This pipeline computes the correlation between significant copy number variation (cnv focal) genes and selected clinical features.
Testing the association between copy number variation 20 focal events and 6 clinical features across 80 patients, 9 significant findings detected with Q value < 0.25.
-
del_3p25.2 cnv correlated to 'Time to Death'.
-
del_3p25.1 cnv correlated to 'Time to Death'.
-
del_3p22.2 cnv correlated to 'Time to Death'.
-
del_3p14.2 cnv correlated to 'Time to Death'.
-
del_3q24 cnv correlated to 'Time to Death'.
-
del_3q29 cnv correlated to 'Time to Death'.
-
del_16q12.1 cnv correlated to 'Time to Death'.
-
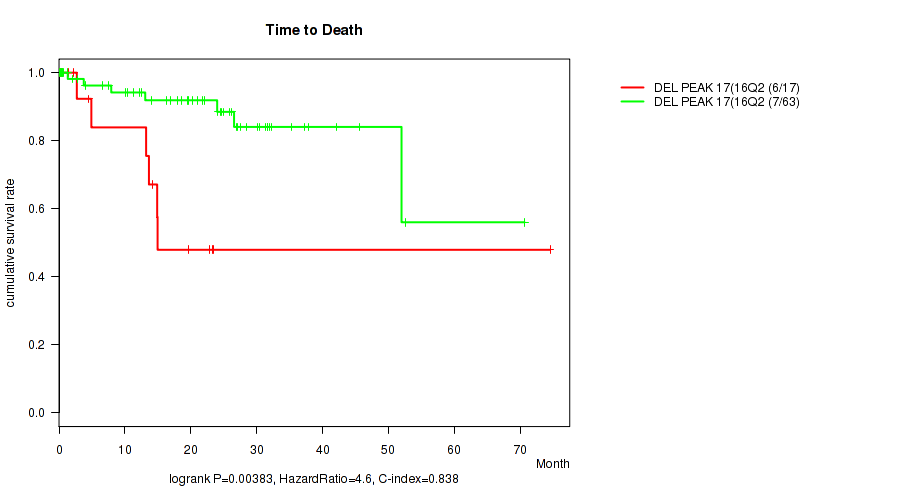
del_16q23.3 cnv correlated to 'Time to Death'.
-
del_16q24.3 cnv correlated to 'Time to Death'.
Table 1. Get Full Table Overview of the association between significant copy number variation of 20 focal events and 6 clinical features. Shown in the table are P values (Q values). Thresholded by Q value < 0.25, 9 significant findings detected.
|
Clinical Features |
Time to Death |
YEARS TO BIRTH |
NEOPLASM DISEASESTAGE |
PATHOLOGY T STAGE |
PATHOLOGY M STAGE |
GENDER | ||
| nCNV (%) | nWild-Type | logrank test | Wilcoxon-test | Fisher's exact test | Fisher's exact test | Fisher's exact test | Fisher's exact test | |
| del 3p25 2 | 43 (54%) | 37 |
0.00165 (0.033) |
0.322 (0.614) |
0.0595 (0.44) |
0.268 (0.596) |
0.117 (0.44) |
1 (1.00) |
| del 3p25 1 | 43 (54%) | 37 |
0.00165 (0.033) |
0.322 (0.614) |
0.0586 (0.44) |
0.267 (0.596) |
0.117 (0.44) |
1 (1.00) |
| del 3p22 2 | 43 (54%) | 37 |
0.00165 (0.033) |
0.322 (0.614) |
0.0569 (0.44) |
0.267 (0.596) |
0.117 (0.44) |
1 (1.00) |
| del 3p14 2 | 44 (55%) | 36 |
0.00165 (0.033) |
0.266 (0.596) |
0.0804 (0.44) |
0.182 (0.52) |
0.117 (0.44) |
1 (1.00) |
| del 3q24 | 44 (55%) | 36 |
0.00165 (0.033) |
0.266 (0.596) |
0.0799 (0.44) |
0.181 (0.52) |
0.117 (0.44) |
1 (1.00) |
| del 3q29 | 44 (55%) | 36 |
0.00165 (0.033) |
0.266 (0.596) |
0.0767 (0.44) |
0.182 (0.52) |
0.117 (0.44) |
1 (1.00) |
| del 16q12 1 | 16 (20%) | 64 |
0.00361 (0.0574) |
0.125 (0.454) |
0.169 (0.519) |
0.376 (0.672) |
0.204 (0.532) |
0.779 (0.954) |
| del 16q23 3 | 17 (21%) | 63 |
0.00383 (0.0574) |
0.14 (0.471) |
0.167 (0.519) |
0.278 (0.596) |
0.204 (0.532) |
1 (1.00) |
| del 16q24 3 | 17 (21%) | 63 |
0.0088 (0.117) |
0.0622 (0.44) |
0.168 (0.519) |
0.281 (0.596) |
0.204 (0.532) |
0.583 (0.814) |
| amp 6p24 3 | 45 (56%) | 35 |
0.0642 (0.44) |
0.0832 (0.44) |
0.454 (0.726) |
0.482 (0.741) |
0.352 (0.649) |
1 (1.00) |
| amp 8q24 22 | 61 (76%) | 19 |
0.0951 (0.44) |
0.56 (0.814) |
0.899 (1.00) |
0.538 (0.814) |
0.562 (0.814) |
0.433 (0.711) |
| amp 17q25 3 | 14 (18%) | 66 |
0.381 (0.672) |
0.276 (0.596) |
0.467 (0.737) |
0.792 (0.96) |
1 (1.00) |
1 (1.00) |
| del 1p36 21 | 24 (30%) | 56 |
0.0302 (0.362) |
0.0888 (0.44) |
0.918 (1.00) |
0.689 (0.875) |
0.602 (0.821) |
0.473 (0.738) |
| del 2q37 2 | 3 (4%) | 77 |
0.374 (0.672) |
0.63 (0.822) |
0.598 (0.821) |
0.293 (0.596) |
1 (1.00) |
0.578 (0.814) |
| del 5q23 1 | 4 (5%) | 76 |
0.388 (0.675) |
0.42 (0.702) |
0.738 (0.913) |
0.823 (0.988) |
1 (1.00) |
0.314 (0.614) |
| del 6q22 31 | 24 (30%) | 56 |
0.421 (0.702) |
0.416 (0.702) |
0.664 (0.856) |
0.141 (0.471) |
0.58 (0.814) |
0.623 (0.822) |
| del 6q27 | 24 (30%) | 56 |
0.136 (0.471) |
0.116 (0.44) |
0.706 (0.883) |
0.341 (0.64) |
0.58 (0.814) |
0.623 (0.822) |
| del 8p11 22 | 19 (24%) | 61 |
0.114 (0.44) |
0.0876 (0.44) |
0.0672 (0.44) |
0.289 (0.596) |
0.204 (0.532) |
0.292 (0.596) |
| del 11q24 3 | 7 (9%) | 73 |
0.246 (0.596) |
0.0683 (0.44) |
0.964 (1.00) |
0.867 (1.00) |
1 (1.00) |
0.693 (0.875) |
| del 17q12 | 3 (4%) | 77 |
1 (1.00) |
0.612 (0.822) |
0.453 (0.726) |
0.577 (0.814) |
1 (1.00) |
1 (1.00) |
P value = 0.00165 (logrank test), Q value = 0.033
Table S1. Gene #6: 'del_3p25.2' versus Clinical Feature #1: 'Time to Death'
| nPatients | nDeath | Duration Range (Median), Month | |
|---|---|---|---|
| ALL | 80 | 13 | 0.1 - 74.5 (19.1) |
| DEL PEAK 3(3P25.2) MUTATED | 43 | 12 | 0.1 - 52.6 (15.0) |
| DEL PEAK 3(3P25.2) WILD-TYPE | 37 | 1 | 0.1 - 74.5 (20.2) |
Figure S1. Get High-res Image Gene #6: 'del_3p25.2' versus Clinical Feature #1: 'Time to Death'

P value = 0.00165 (logrank test), Q value = 0.033
Table S2. Gene #7: 'del_3p25.1' versus Clinical Feature #1: 'Time to Death'
| nPatients | nDeath | Duration Range (Median), Month | |
|---|---|---|---|
| ALL | 80 | 13 | 0.1 - 74.5 (19.1) |
| DEL PEAK 4(3P25.1) MUTATED | 43 | 12 | 0.1 - 52.6 (15.0) |
| DEL PEAK 4(3P25.1) WILD-TYPE | 37 | 1 | 0.1 - 74.5 (20.2) |
Figure S2. Get High-res Image Gene #7: 'del_3p25.1' versus Clinical Feature #1: 'Time to Death'

P value = 0.00165 (logrank test), Q value = 0.033
Table S3. Gene #8: 'del_3p22.2' versus Clinical Feature #1: 'Time to Death'
| nPatients | nDeath | Duration Range (Median), Month | |
|---|---|---|---|
| ALL | 80 | 13 | 0.1 - 74.5 (19.1) |
| DEL PEAK 5(3P22.2) MUTATED | 43 | 12 | 0.1 - 52.6 (15.0) |
| DEL PEAK 5(3P22.2) WILD-TYPE | 37 | 1 | 0.1 - 74.5 (20.2) |
Figure S3. Get High-res Image Gene #8: 'del_3p22.2' versus Clinical Feature #1: 'Time to Death'

P value = 0.00165 (logrank test), Q value = 0.033
Table S4. Gene #9: 'del_3p14.2' versus Clinical Feature #1: 'Time to Death'
| nPatients | nDeath | Duration Range (Median), Month | |
|---|---|---|---|
| ALL | 80 | 13 | 0.1 - 74.5 (19.1) |
| DEL PEAK 6(3P14.2) MUTATED | 44 | 12 | 0.1 - 52.6 (14.9) |
| DEL PEAK 6(3P14.2) WILD-TYPE | 36 | 1 | 0.1 - 74.5 (21.1) |
Figure S4. Get High-res Image Gene #9: 'del_3p14.2' versus Clinical Feature #1: 'Time to Death'

P value = 0.00165 (logrank test), Q value = 0.033
Table S5. Gene #10: 'del_3q24' versus Clinical Feature #1: 'Time to Death'
| nPatients | nDeath | Duration Range (Median), Month | |
|---|---|---|---|
| ALL | 80 | 13 | 0.1 - 74.5 (19.1) |
| DEL PEAK 7(3Q24) MUTATED | 44 | 12 | 0.1 - 52.6 (14.9) |
| DEL PEAK 7(3Q24) WILD-TYPE | 36 | 1 | 0.1 - 74.5 (21.1) |
Figure S5. Get High-res Image Gene #10: 'del_3q24' versus Clinical Feature #1: 'Time to Death'
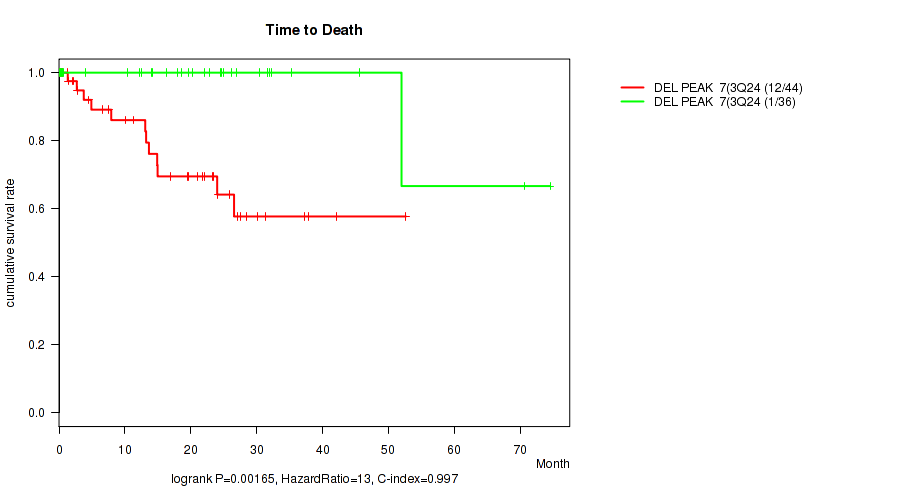
P value = 0.00165 (logrank test), Q value = 0.033
Table S6. Gene #11: 'del_3q29' versus Clinical Feature #1: 'Time to Death'
| nPatients | nDeath | Duration Range (Median), Month | |
|---|---|---|---|
| ALL | 80 | 13 | 0.1 - 74.5 (19.1) |
| DEL PEAK 8(3Q29) MUTATED | 44 | 12 | 0.1 - 52.6 (14.9) |
| DEL PEAK 8(3Q29) WILD-TYPE | 36 | 1 | 0.1 - 74.5 (21.1) |
Figure S6. Get High-res Image Gene #11: 'del_3q29' versus Clinical Feature #1: 'Time to Death'

P value = 0.00361 (logrank test), Q value = 0.057
Table S7. Gene #17: 'del_16q12.1' versus Clinical Feature #1: 'Time to Death'
| nPatients | nDeath | Duration Range (Median), Month | |
|---|---|---|---|
| ALL | 80 | 13 | 0.1 - 74.5 (19.1) |
| DEL PEAK 16(16Q12.1) MUTATED | 16 | 6 | 0.1 - 74.5 (13.9) |
| DEL PEAK 16(16Q12.1) WILD-TYPE | 64 | 7 | 0.1 - 70.7 (20.6) |
Figure S7. Get High-res Image Gene #17: 'del_16q12.1' versus Clinical Feature #1: 'Time to Death'

P value = 0.00383 (logrank test), Q value = 0.057
Table S8. Gene #18: 'del_16q23.3' versus Clinical Feature #1: 'Time to Death'
| nPatients | nDeath | Duration Range (Median), Month | |
|---|---|---|---|
| ALL | 80 | 13 | 0.1 - 74.5 (19.1) |
| DEL PEAK 17(16Q23.3) MUTATED | 17 | 6 | 0.1 - 74.5 (13.6) |
| DEL PEAK 17(16Q23.3) WILD-TYPE | 63 | 7 | 0.1 - 70.7 (21.0) |
Figure S8. Get High-res Image Gene #18: 'del_16q23.3' versus Clinical Feature #1: 'Time to Death'
P value = 0.0088 (logrank test), Q value = 0.12
Table S9. Gene #19: 'del_16q24.3' versus Clinical Feature #1: 'Time to Death'
| nPatients | nDeath | Duration Range (Median), Month | |
|---|---|---|---|
| ALL | 80 | 13 | 0.1 - 74.5 (19.1) |
| DEL PEAK 18(16Q24.3) MUTATED | 17 | 6 | 0.1 - 74.5 (14.2) |
| DEL PEAK 18(16Q24.3) WILD-TYPE | 63 | 7 | 0.1 - 70.7 (20.2) |
Figure S9. Get High-res Image Gene #19: 'del_16q24.3' versus Clinical Feature #1: 'Time to Death'

-
Copy number data file = all_lesions.txt from GISTIC pipeline
-
Processed Copy number data file = /xchip/cga/gdac-prod/tcga-gdac/jobResults/GDAC_Correlate_Genomic_Events_Preprocess/UVM-TP/15908354/transformed.cor.cli.txt
-
Clinical data file = /xchip/cga/gdac-prod/tcga-gdac/jobResults/Append_Data/UVM-TP/15096076/UVM-TP.merged_data.txt
-
Number of patients = 80
-
Number of significantly focal cnvs = 20
-
Number of selected clinical features = 6
-
Exclude genes that fewer than K tumors have mutations, K = 3
For survival clinical features, the Kaplan-Meier survival curves of tumors with and without gene mutations were plotted and the statistical significance P values were estimated by logrank test (Bland and Altman 2004) using the 'survdiff' function in R
For binary or multi-class clinical features (nominal or ordinal), two-tailed Fisher's exact tests (Fisher 1922) were used to estimate the P values using the 'fisher.test' function in R
For multiple hypothesis correction, Q value is the False Discovery Rate (FDR) analogue of the P value (Benjamini and Hochberg 1995), defined as the minimum FDR at which the test may be called significant. We used the 'Benjamini and Hochberg' method of 'p.adjust' function in R to convert P values into Q values.
In addition to the links below, the full results of the analysis summarized in this report can also be downloaded programmatically using firehose_get, or interactively from either the Broad GDAC website or TCGA Data Coordination Center Portal.