This pipeline computes the correlation between significant arm-level copy number variations (cnvs) and selected clinical features.
Testing the association between copy number variation 82 arm-level events and 12 clinical features across 90 patients, 12 significant findings detected with Q value < 0.25.
-
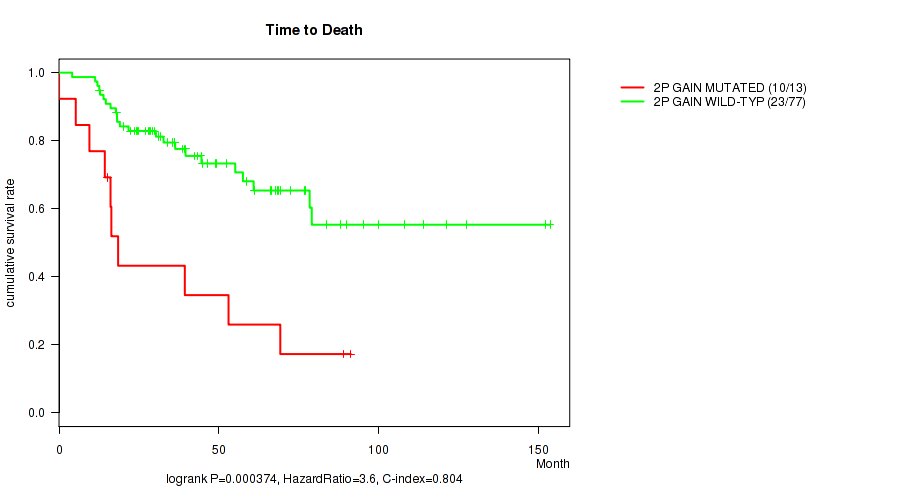
2p gain cnv correlated to 'Time to Death'.
-
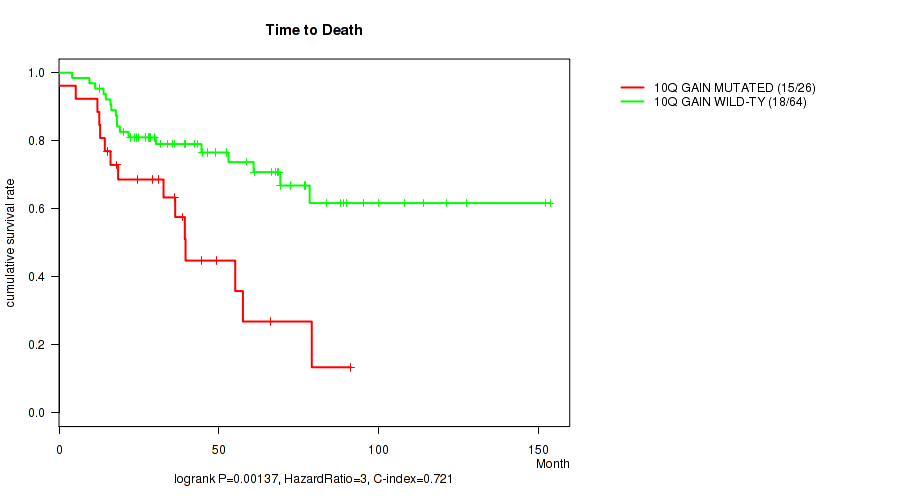
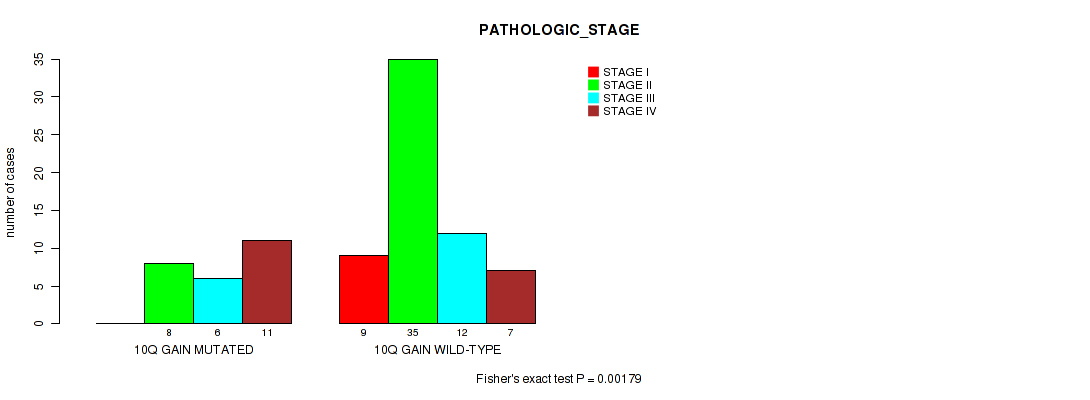
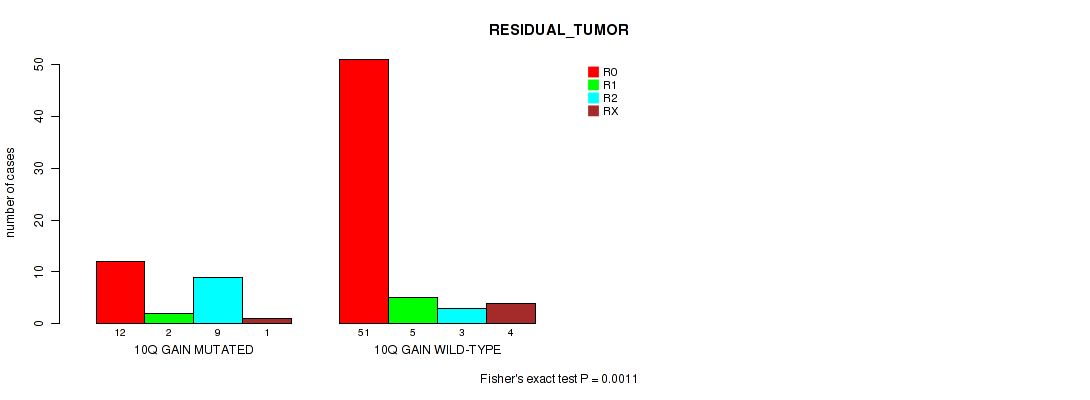
10q gain cnv correlated to 'Time to Death', 'PATHOLOGIC_STAGE', and 'RESIDUAL_TUMOR'.
-
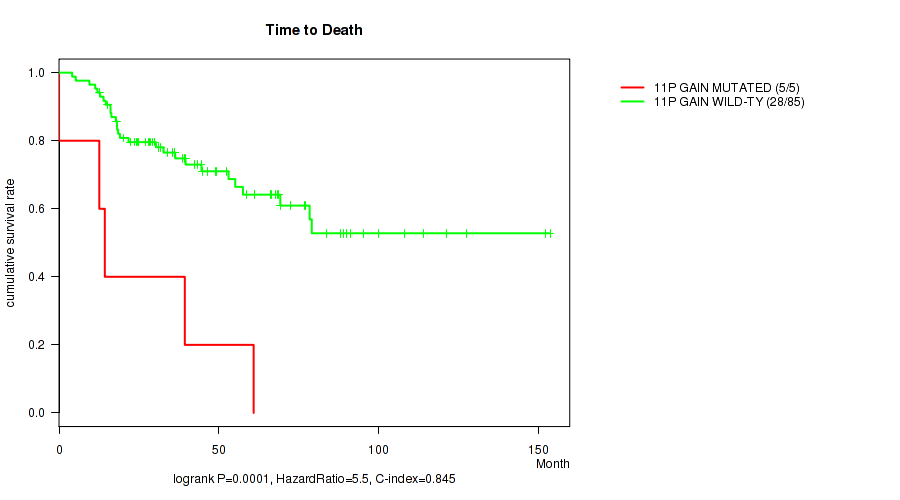
11p gain cnv correlated to 'Time to Death'.
-
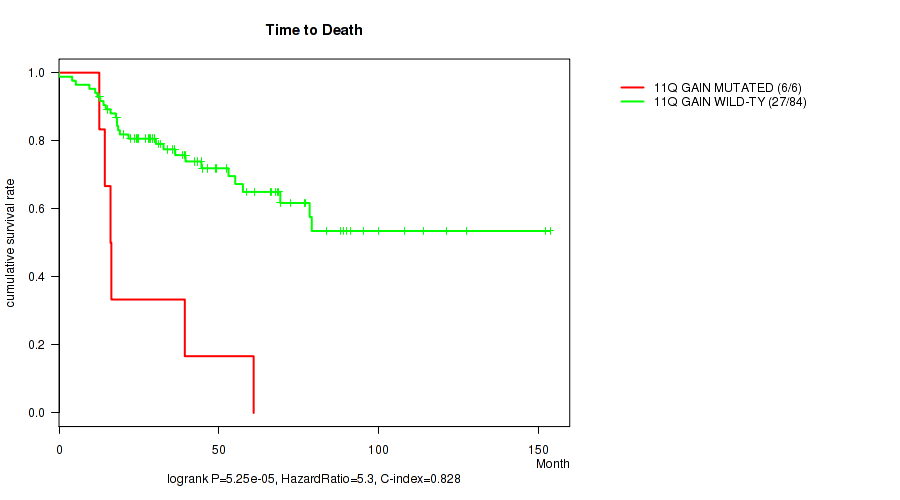
11q gain cnv correlated to 'Time to Death'.
-
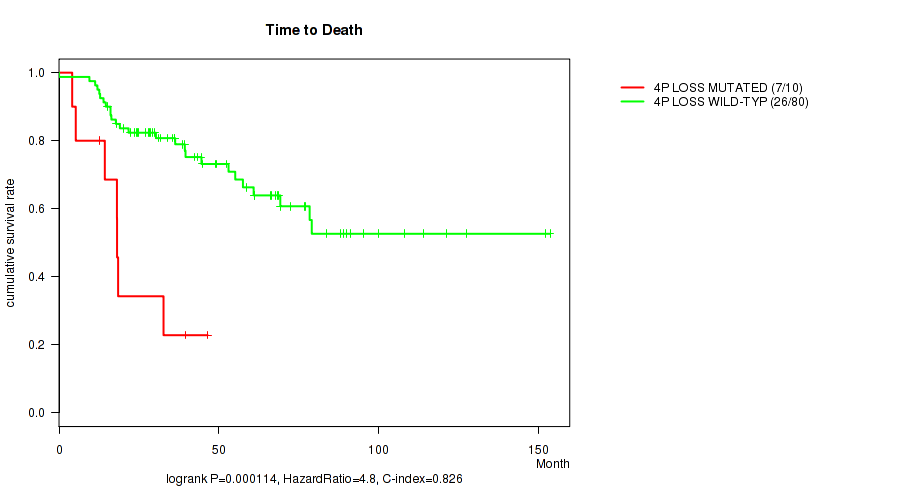
4p loss cnv correlated to 'Time to Death'.
-
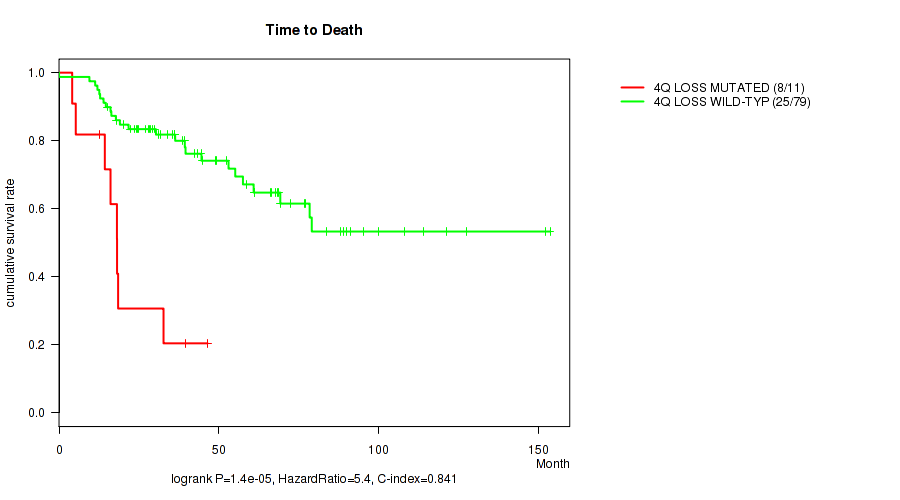
4q loss cnv correlated to 'Time to Death'.
-
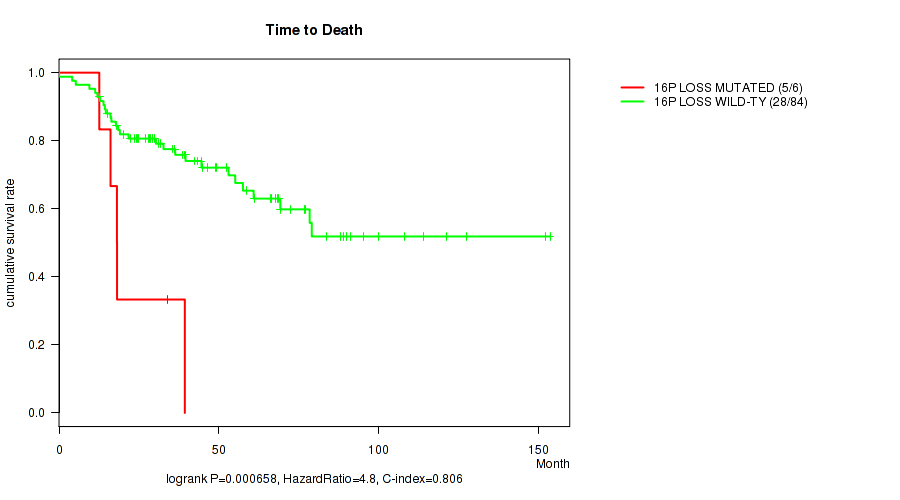
16p loss cnv correlated to 'Time to Death'.
-
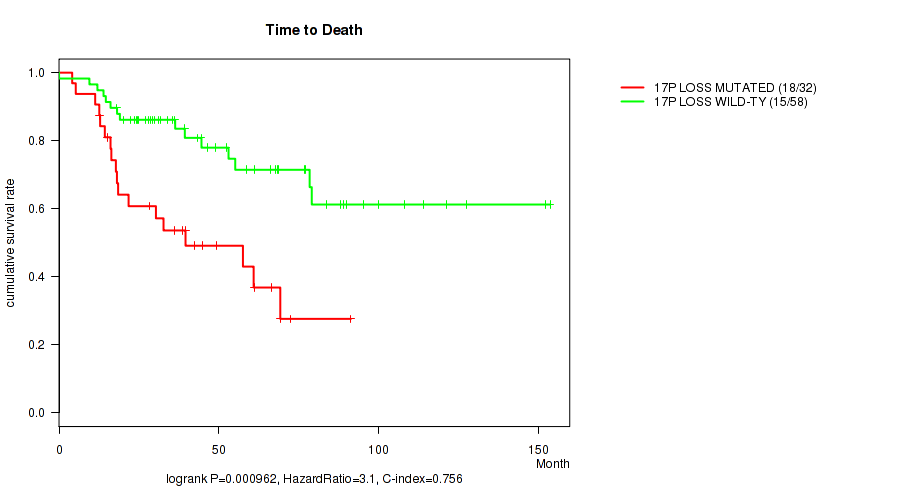
17p loss cnv correlated to 'Time to Death'.
-
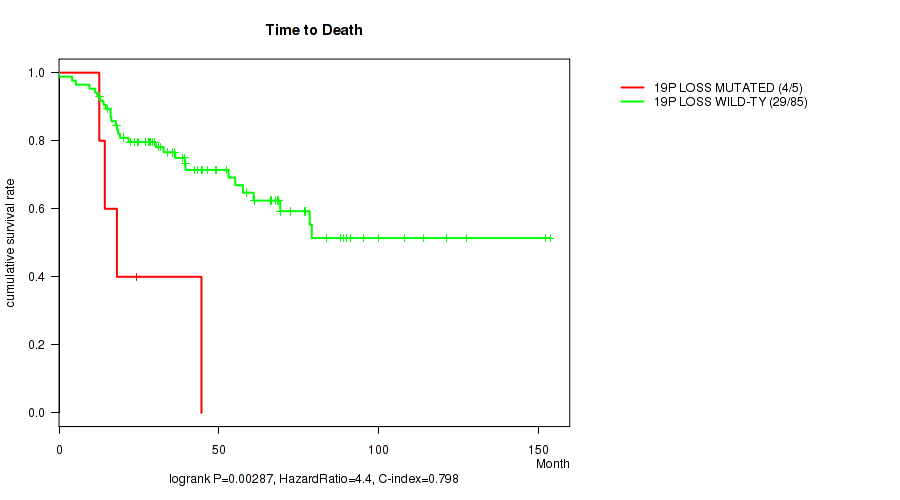
19p loss cnv correlated to 'Time to Death'.
-
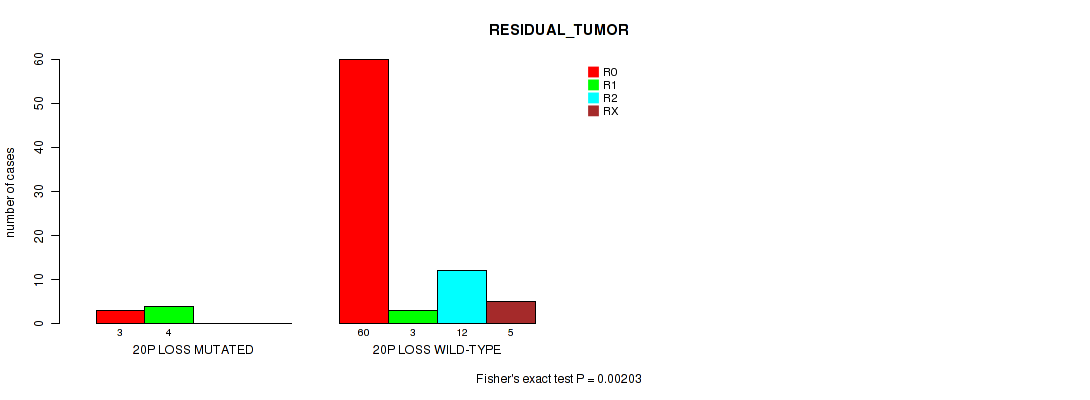
20p loss cnv correlated to 'RESIDUAL_TUMOR'.
Table 1. Get Full Table Overview of the association between significant copy number variation of 82 arm-level events and 12 clinical features. Shown in the table are P values (Q values). Thresholded by Q value < 0.25, 12 significant findings detected.
|
Clinical Features |
Time to Death |
YEARS TO BIRTH |
PATHOLOGIC STAGE |
PATHOLOGY T STAGE |
PATHOLOGY N STAGE |
GENDER |
RADIATION THERAPY |
HISTOLOGICAL TYPE |
RESIDUAL TUMOR |
NUMBER OF LYMPH NODES |
RACE | ETHNICITY | ||
| nCNV (%) | nWild-Type | logrank test | Wilcoxon-test | Fisher's exact test | Fisher's exact test | Fisher's exact test | Fisher's exact test | Fisher's exact test | Fisher's exact test | Fisher's exact test | Wilcoxon-test | Fisher's exact test | Fisher's exact test | |
| 10q gain | 26 (29%) | 64 |
0.00137 (0.15) |
0.266 (1.00) |
0.00179 (0.176) |
0.00557 (0.338) |
1 (1.00) |
1 (1.00) |
0.771 (1.00) |
0.515 (1.00) |
0.0011 (0.135) |
0.763 (1.00) |
1 (1.00) |
0.421 (1.00) |
| 2p gain | 13 (14%) | 77 |
0.000374 (0.0735) |
0.818 (1.00) |
0.378 (1.00) |
0.143 (0.909) |
0.347 (1.00) |
0.205 (0.96) |
0.727 (1.00) |
1 (1.00) |
0.226 (0.977) |
0.235 (0.984) |
0.169 (0.949) |
0.587 (1.00) |
| 11p gain | 5 (6%) | 85 |
0.0001 (0.028) |
0.364 (1.00) |
0.157 (0.925) |
0.043 (0.714) |
1 (1.00) |
0.656 (1.00) |
0.579 (1.00) |
1 (1.00) |
0.0103 (0.43) |
1 (1.00) |
0.569 (1.00) |
|
| 11q gain | 6 (7%) | 84 |
5.25e-05 (0.0258) |
0.698 (1.00) |
0.12 (0.87) |
0.0624 (0.758) |
1 (1.00) |
0.66 (1.00) |
1 (1.00) |
1 (1.00) |
0.0635 (0.762) |
0.318 (1.00) |
1 (1.00) |
1 (1.00) |
| 4p loss | 10 (11%) | 80 |
0.000114 (0.028) |
0.542 (1.00) |
0.0183 (0.516) |
0.00382 (0.289) |
1 (1.00) |
1 (1.00) |
0.0835 (0.857) |
1 (1.00) |
0.0388 (0.693) |
1 (1.00) |
1 (1.00) |
1 (1.00) |
| 4q loss | 11 (12%) | 79 |
1.4e-05 (0.0138) |
0.805 (1.00) |
0.0225 (0.54) |
0.00619 (0.338) |
1 (1.00) |
0.742 (1.00) |
0.205 (0.96) |
1 (1.00) |
0.0114 (0.43) |
0.818 (1.00) |
1 (1.00) |
1 (1.00) |
| 16p loss | 6 (7%) | 84 |
0.000658 (0.108) |
0.418 (1.00) |
0.117 (0.87) |
0.0509 (0.758) |
0.526 (1.00) |
1 (1.00) |
1 (1.00) |
1 (1.00) |
0.00809 (0.379) |
1 (1.00) |
1 (1.00) |
0.444 (1.00) |
| 17p loss | 32 (36%) | 58 |
0.000962 (0.135) |
0.535 (1.00) |
0.0605 (0.758) |
0.14 (0.909) |
0.73 (1.00) |
0.246 (1.00) |
0.275 (1.00) |
1 (1.00) |
0.111 (0.87) |
0.747 (1.00) |
0.699 (1.00) |
0.409 (1.00) |
| 19p loss | 5 (6%) | 85 |
0.00287 (0.236) |
0.603 (1.00) |
0.195 (0.952) |
0.287 (1.00) |
1 (1.00) |
1 (1.00) |
0.576 (1.00) |
1 (1.00) |
0.16 (0.927) |
1 (1.00) |
1 (1.00) |
|
| 20p loss | 9 (10%) | 81 |
0.828 (1.00) |
0.595 (1.00) |
0.557 (1.00) |
0.747 (1.00) |
1 (1.00) |
0.156 (0.925) |
0.385 (1.00) |
1 (1.00) |
0.00203 (0.182) |
0.969 (1.00) |
0.278 (1.00) |
0.548 (1.00) |
| 1p gain | 4 (4%) | 86 |
0.0866 (0.87) |
0.487 (1.00) |
1 (1.00) |
0.747 (1.00) |
1 (1.00) |
0.294 (1.00) |
0.576 (1.00) |
1 (1.00) |
0.301 (1.00) |
0.318 (1.00) |
0.144 (0.909) |
1 (1.00) |
| 1q gain | 8 (9%) | 82 |
0.0407 (0.705) |
0.798 (1.00) |
0.733 (1.00) |
0.455 (1.00) |
0.589 (1.00) |
0.047 (0.745) |
1 (1.00) |
1 (1.00) |
0.51 (1.00) |
0.173 (0.949) |
0.245 (1.00) |
0.548 (1.00) |
| 2q gain | 12 (13%) | 78 |
0.0106 (0.43) |
0.767 (1.00) |
0.154 (0.925) |
0.234 (0.984) |
1 (1.00) |
0.0516 (0.758) |
1 (1.00) |
1 (1.00) |
0.39 (1.00) |
0.235 (0.984) |
0.171 (0.949) |
0.645 (1.00) |
| 3p gain | 13 (14%) | 77 |
0.263 (1.00) |
0.323 (1.00) |
0.582 (1.00) |
0.931 (1.00) |
1 (1.00) |
0.759 (1.00) |
0.0616 (0.758) |
0.0724 (0.819) |
0.77 (1.00) |
0.581 (1.00) |
1 (1.00) |
1 (1.00) |
| 3q gain | 15 (17%) | 75 |
0.371 (1.00) |
0.423 (1.00) |
0.334 (1.00) |
0.756 (1.00) |
0.677 (1.00) |
1 (1.00) |
0.0337 (0.65) |
0.0958 (0.87) |
0.487 (1.00) |
0.581 (1.00) |
1 (1.00) |
1 (1.00) |
| 4p gain | 37 (41%) | 53 |
0.224 (0.977) |
0.941 (1.00) |
0.791 (1.00) |
0.844 (1.00) |
1 (1.00) |
0.654 (1.00) |
0.592 (1.00) |
0.141 (0.909) |
0.206 (0.96) |
0.718 (1.00) |
1 (1.00) |
0.421 (1.00) |
| 4q gain | 33 (37%) | 57 |
0.114 (0.87) |
0.97 (1.00) |
0.96 (1.00) |
0.93 (1.00) |
1 (1.00) |
0.495 (1.00) |
0.791 (1.00) |
0.409 (1.00) |
0.413 (1.00) |
0.567 (1.00) |
1 (1.00) |
0.669 (1.00) |
| 5p gain | 57 (63%) | 33 |
0.451 (1.00) |
0.854 (1.00) |
0.693 (1.00) |
0.894 (1.00) |
1 (1.00) |
1 (1.00) |
0.272 (1.00) |
1 (1.00) |
0.559 (1.00) |
0.621 (1.00) |
1 (1.00) |
0.226 (0.977) |
| 5q gain | 53 (59%) | 37 |
0.84 (1.00) |
0.62 (1.00) |
0.567 (1.00) |
0.797 (1.00) |
1 (1.00) |
1 (1.00) |
0.189 (0.949) |
0.786 (1.00) |
0.813 (1.00) |
0.485 (1.00) |
0.183 (0.949) |
0.115 (0.87) |
| 6p gain | 18 (20%) | 72 |
0.66 (1.00) |
0.0275 (0.575) |
0.497 (1.00) |
0.255 (1.00) |
0.679 (1.00) |
0.588 (1.00) |
0.506 (1.00) |
1 (1.00) |
0.0257 (0.575) |
0.407 (1.00) |
0.0917 (0.87) |
0.0548 (0.758) |
| 6q gain | 16 (18%) | 74 |
0.765 (1.00) |
0.2 (0.96) |
0.114 (0.87) |
0.175 (0.949) |
0.2 (0.96) |
0.399 (1.00) |
0.179 (0.949) |
0.634 (1.00) |
0.119 (0.87) |
0.127 (0.876) |
0.0582 (0.758) |
0.613 (1.00) |
| 7p gain | 48 (53%) | 42 |
0.815 (1.00) |
0.51 (1.00) |
0.166 (0.949) |
0.233 (0.984) |
0.336 (1.00) |
1 (1.00) |
0.793 (1.00) |
0.621 (1.00) |
0.77 (1.00) |
0.361 (1.00) |
0.214 (0.963) |
0.435 (1.00) |
| 7q gain | 48 (53%) | 42 |
0.512 (1.00) |
0.859 (1.00) |
0.108 (0.87) |
0.226 (0.977) |
0.336 (1.00) |
1 (1.00) |
0.431 (1.00) |
0.619 (1.00) |
0.772 (1.00) |
0.268 (1.00) |
0.216 (0.964) |
0.115 (0.87) |
| 8p gain | 32 (36%) | 58 |
0.222 (0.977) |
0.508 (1.00) |
0.443 (1.00) |
0.637 (1.00) |
0.484 (1.00) |
1 (1.00) |
0.786 (1.00) |
0.542 (1.00) |
1 (1.00) |
1 (1.00) |
0.29 (1.00) |
0.421 (1.00) |
| 8q gain | 38 (42%) | 52 |
0.649 (1.00) |
0.49 (1.00) |
0.344 (1.00) |
0.538 (1.00) |
0.51 (1.00) |
1 (1.00) |
0.594 (1.00) |
0.447 (1.00) |
0.798 (1.00) |
0.83 (1.00) |
0.344 (1.00) |
0.7 (1.00) |
| 9p gain | 20 (22%) | 70 |
0.266 (1.00) |
0.716 (1.00) |
0.0601 (0.758) |
0.326 (1.00) |
0.00792 (0.379) |
0.791 (1.00) |
0.105 (0.87) |
0.251 (1.00) |
0.0714 (0.817) |
0.0118 (0.43) |
1 (1.00) |
0.374 (1.00) |
| 9q gain | 29 (32%) | 61 |
0.0147 (0.468) |
0.663 (1.00) |
0.0369 (0.685) |
0.0892 (0.87) |
0.013 (0.441) |
0.477 (1.00) |
0.402 (1.00) |
0.389 (1.00) |
0.0508 (0.758) |
0.0177 (0.516) |
1 (1.00) |
0.421 (1.00) |
| 10p gain | 25 (28%) | 65 |
0.011 (0.43) |
0.397 (1.00) |
0.00616 (0.338) |
0.0147 (0.468) |
1 (1.00) |
1 (1.00) |
1 (1.00) |
0.691 (1.00) |
0.0105 (0.43) |
0.763 (1.00) |
1 (1.00) |
0.421 (1.00) |
| 12p gain | 64 (71%) | 26 |
0.894 (1.00) |
0.287 (1.00) |
0.701 (1.00) |
0.607 (1.00) |
1 (1.00) |
0.464 (1.00) |
0.38 (1.00) |
1 (1.00) |
0.638 (1.00) |
0.703 (1.00) |
0.648 (1.00) |
0.0898 (0.87) |
| 12q gain | 64 (71%) | 26 |
0.917 (1.00) |
0.415 (1.00) |
0.703 (1.00) |
0.653 (1.00) |
0.718 (1.00) |
0.464 (1.00) |
0.38 (1.00) |
1 (1.00) |
0.656 (1.00) |
0.703 (1.00) |
0.0832 (0.857) |
0.0898 (0.87) |
| 13q gain | 6 (7%) | 84 |
0.839 (1.00) |
0.651 (1.00) |
0.735 (1.00) |
0.722 (1.00) |
0.526 (1.00) |
1 (1.00) |
1 (1.00) |
1 (1.00) |
0.503 (1.00) |
0.633 (1.00) |
1 (1.00) |
0.548 (1.00) |
| 14q gain | 21 (23%) | 69 |
0.13 (0.876) |
0.426 (1.00) |
0.181 (0.949) |
0.313 (1.00) |
0.241 (0.998) |
0.606 (1.00) |
0.0606 (0.758) |
0.669 (1.00) |
0.731 (1.00) |
0.149 (0.917) |
1 (1.00) |
0.374 (1.00) |
| 15q gain | 11 (12%) | 79 |
0.779 (1.00) |
0.46 (1.00) |
0.794 (1.00) |
0.711 (1.00) |
1 (1.00) |
1 (1.00) |
0.425 (1.00) |
1 (1.00) |
1 (1.00) |
0.917 (1.00) |
1 (1.00) |
1 (1.00) |
| 16p gain | 49 (54%) | 41 |
0.336 (1.00) |
0.576 (1.00) |
0.595 (1.00) |
0.283 (1.00) |
1 (1.00) |
0.187 (0.949) |
0.793 (1.00) |
1 (1.00) |
0.975 (1.00) |
0.394 (1.00) |
0.725 (1.00) |
0.439 (1.00) |
| 16q gain | 47 (52%) | 43 |
0.35 (1.00) |
0.929 (1.00) |
0.834 (1.00) |
0.616 (1.00) |
1 (1.00) |
0.269 (1.00) |
0.112 (0.87) |
1 (1.00) |
0.931 (1.00) |
0.394 (1.00) |
0.115 (0.87) |
0.699 (1.00) |
| 17p gain | 5 (6%) | 85 |
0.291 (1.00) |
0.622 (1.00) |
0.159 (0.927) |
0.108 (0.87) |
1 (1.00) |
1 (1.00) |
1 (1.00) |
0.0681 (0.798) |
0.501 (1.00) |
0.318 (1.00) |
0.147 (0.915) |
0.444 (1.00) |
| 17q gain | 7 (8%) | 83 |
0.124 (0.873) |
0.488 (1.00) |
0.692 (1.00) |
0.471 (1.00) |
1 (1.00) |
1 (1.00) |
1 (1.00) |
0.0206 (0.519) |
0.581 (1.00) |
1 (1.00) |
0.548 (1.00) |
|
| 18p gain | 6 (7%) | 84 |
0.129 (0.876) |
0.452 (1.00) |
0.342 (1.00) |
0.332 (1.00) |
1 (1.00) |
1 (1.00) |
1 (1.00) |
1 (1.00) |
0.206 (0.96) |
0.214 (0.963) |
1 (1.00) |
|
| 18q gain | 5 (6%) | 85 |
0.309 (1.00) |
0.833 (1.00) |
0.83 (1.00) |
0.288 (1.00) |
1 (1.00) |
0.656 (1.00) |
0.579 (1.00) |
1 (1.00) |
0.113 (0.87) |
0.178 (0.949) |
0.569 (1.00) |
|
| 19p gain | 56 (62%) | 34 |
0.289 (1.00) |
0.119 (0.87) |
0.178 (0.949) |
0.203 (0.96) |
0.737 (1.00) |
0.821 (1.00) |
0.105 (0.87) |
1 (1.00) |
0.77 (1.00) |
0.552 (1.00) |
1 (1.00) |
0.124 (0.873) |
| 19q gain | 52 (58%) | 38 |
0.318 (1.00) |
0.0203 (0.519) |
0.202 (0.96) |
0.326 (1.00) |
0.182 (0.949) |
0.378 (1.00) |
0.108 (0.87) |
0.79 (1.00) |
0.251 (1.00) |
0.321 (1.00) |
1 (1.00) |
0.124 (0.873) |
| 20p gain | 46 (51%) | 44 |
0.141 (0.909) |
0.495 (1.00) |
0.339 (1.00) |
0.799 (1.00) |
1 (1.00) |
0.188 (0.949) |
0.3 (1.00) |
0.615 (1.00) |
0.466 (1.00) |
0.917 (1.00) |
0.495 (1.00) |
1 (1.00) |
| 20q gain | 49 (54%) | 41 |
0.542 (1.00) |
0.964 (1.00) |
0.318 (1.00) |
0.86 (1.00) |
0.336 (1.00) |
0.187 (0.949) |
0.431 (1.00) |
0.622 (1.00) |
0.248 (1.00) |
0.396 (1.00) |
0.214 (0.963) |
0.71 (1.00) |
| 21q gain | 31 (34%) | 59 |
0.68 (1.00) |
0.154 (0.925) |
0.936 (1.00) |
0.941 (1.00) |
0.0836 (0.857) |
0.818 (1.00) |
0.4 (1.00) |
0.4 (1.00) |
0.972 (1.00) |
0.0907 (0.87) |
0.272 (1.00) |
0.443 (1.00) |
| 22q gain | 3 (3%) | 87 |
0.131 (0.876) |
0.208 (0.961) |
1 (1.00) |
1 (1.00) |
0.307 (1.00) |
1 (1.00) |
1 (1.00) |
1 (1.00) |
0.625 (1.00) |
1 (1.00) |
1 (1.00) |
|
| xp gain | 42 (47%) | 48 |
0.617 (1.00) |
0.916 (1.00) |
0.866 (1.00) |
0.87 (1.00) |
1 (1.00) |
0.828 (1.00) |
0.434 (1.00) |
0.619 (1.00) |
0.169 (0.949) |
0.57 (1.00) |
0.347 (1.00) |
0.115 (0.87) |
| xq gain | 41 (46%) | 49 |
0.472 (1.00) |
0.77 (1.00) |
0.546 (1.00) |
0.914 (1.00) |
0.327 (1.00) |
0.824 (1.00) |
0.289 (1.00) |
0.62 (1.00) |
0.155 (0.925) |
0.405 (1.00) |
0.342 (1.00) |
0.435 (1.00) |
| 1p loss | 29 (32%) | 61 |
0.902 (1.00) |
0.866 (1.00) |
0.957 (1.00) |
0.952 (1.00) |
1 (1.00) |
1 (1.00) |
0.26 (1.00) |
0.255 (1.00) |
1 (1.00) |
0.292 (1.00) |
1 (1.00) |
1 (1.00) |
| 1q loss | 20 (22%) | 70 |
0.799 (1.00) |
0.317 (1.00) |
0.564 (1.00) |
0.744 (1.00) |
0.445 (1.00) |
0.599 (1.00) |
0.208 (0.961) |
0.0691 (0.8) |
0.436 (1.00) |
1 (1.00) |
1 (1.00) |
1 (1.00) |
| 2p loss | 17 (19%) | 73 |
0.0334 (0.65) |
0.442 (1.00) |
1 (1.00) |
0.719 (1.00) |
1 (1.00) |
0.576 (1.00) |
0.734 (1.00) |
0.0435 (0.714) |
0.898 (1.00) |
0.581 (1.00) |
1 (1.00) |
1 (1.00) |
| 2q loss | 15 (17%) | 75 |
0.0609 (0.758) |
0.689 (1.00) |
0.618 (1.00) |
0.757 (1.00) |
1 (1.00) |
0.767 (1.00) |
0.475 (1.00) |
0.0305 (0.624) |
0.837 (1.00) |
0.753 (1.00) |
1 (1.00) |
1 (1.00) |
| 3p loss | 20 (22%) | 70 |
0.115 (0.87) |
0.614 (1.00) |
0.0925 (0.87) |
0.343 (1.00) |
1 (1.00) |
0.293 (1.00) |
0.745 (1.00) |
1 (1.00) |
0.027 (0.575) |
0.77 (1.00) |
1 (1.00) |
1 (1.00) |
| 3q loss | 20 (22%) | 70 |
0.191 (0.949) |
0.907 (1.00) |
0.178 (0.949) |
0.559 (1.00) |
1 (1.00) |
0.599 (1.00) |
1 (1.00) |
1 (1.00) |
0.172 (0.949) |
0.77 (1.00) |
0.251 (1.00) |
0.277 (1.00) |
| 5p loss | 8 (9%) | 82 |
0.127 (0.876) |
0.676 (1.00) |
0.189 (0.949) |
0.148 (0.917) |
1 (1.00) |
1 (1.00) |
0.668 (1.00) |
1 (1.00) |
0.195 (0.952) |
0.235 (0.984) |
1 (1.00) |
0.548 (1.00) |
| 5q loss | 7 (8%) | 83 |
0.551 (1.00) |
0.342 (1.00) |
0.0762 (0.842) |
0.142 (0.909) |
0.584 (1.00) |
0.228 (0.978) |
0.152 (0.922) |
1 (1.00) |
0.135 (0.889) |
1 (1.00) |
1 (1.00) |
|
| 6p loss | 19 (21%) | 71 |
0.11 (0.87) |
0.35 (1.00) |
0.0822 (0.857) |
0.147 (0.915) |
0.445 (1.00) |
1 (1.00) |
1 (1.00) |
0.0607 (0.758) |
0.246 (1.00) |
0.5 (1.00) |
1 (1.00) |
0.571 (1.00) |
| 6q loss | 22 (24%) | 68 |
0.0259 (0.575) |
0.254 (1.00) |
0.00701 (0.363) |
0.0187 (0.516) |
0.706 (1.00) |
0.453 (1.00) |
1 (1.00) |
0.0922 (0.87) |
0.0408 (0.705) |
0.671 (1.00) |
1 (1.00) |
1 (1.00) |
| 7p loss | 5 (6%) | 85 |
0.109 (0.87) |
0.718 (1.00) |
0.336 (1.00) |
0.288 (1.00) |
1 (1.00) |
0.0461 (0.744) |
0.576 (1.00) |
1 (1.00) |
0.172 (0.949) |
1 (1.00) |
1 (1.00) |
|
| 7q loss | 6 (7%) | 84 |
0.0173 (0.516) |
0.61 (1.00) |
0.0381 (0.693) |
0.0194 (0.516) |
1 (1.00) |
0.411 (1.00) |
1 (1.00) |
1 (1.00) |
0.26 (1.00) |
1 (1.00) |
1 (1.00) |
|
| 8p loss | 16 (18%) | 74 |
0.821 (1.00) |
0.768 (1.00) |
0.668 (1.00) |
0.97 (1.00) |
0.365 (1.00) |
1 (1.00) |
0.725 (1.00) |
1 (1.00) |
0.0262 (0.575) |
0.854 (1.00) |
1 (1.00) |
1 (1.00) |
| 8q loss | 12 (13%) | 78 |
0.892 (1.00) |
0.639 (1.00) |
0.579 (1.00) |
1 (1.00) |
0.107 (0.87) |
0.534 (1.00) |
1 (1.00) |
1 (1.00) |
0.0808 (0.857) |
0.25 (1.00) |
1 (1.00) |
1 (1.00) |
| 9p loss | 20 (22%) | 70 |
0.174 (0.949) |
0.506 (1.00) |
0.845 (1.00) |
0.619 (1.00) |
0.683 (1.00) |
0.599 (1.00) |
0.061 (0.758) |
0.668 (1.00) |
0.822 (1.00) |
0.193 (0.952) |
1 (1.00) |
0.645 (1.00) |
| 9q loss | 11 (12%) | 79 |
0.857 (1.00) |
0.427 (1.00) |
0.213 (0.963) |
0.425 (1.00) |
0.596 (1.00) |
1 (1.00) |
0.425 (1.00) |
1 (1.00) |
0.317 (1.00) |
0.235 (0.984) |
1 (1.00) |
0.569 (1.00) |
| 10p loss | 12 (13%) | 78 |
0.311 (1.00) |
0.934 (1.00) |
0.183 (0.949) |
1 (1.00) |
0.134 (0.889) |
1 (1.00) |
1 (1.00) |
0.0617 (0.758) |
0.529 (1.00) |
0.116 (0.87) |
1 (1.00) |
0.444 (1.00) |
| 10q loss | 10 (11%) | 80 |
0.383 (1.00) |
0.298 (1.00) |
0.307 (1.00) |
0.712 (1.00) |
0.317 (1.00) |
1 (1.00) |
1 (1.00) |
0.0432 (0.714) |
0.478 (1.00) |
0.152 (0.922) |
1 (1.00) |
1 (1.00) |
| 11p loss | 24 (27%) | 66 |
0.473 (1.00) |
0.722 (1.00) |
0.131 (0.876) |
0.604 (1.00) |
0.706 (1.00) |
0.455 (1.00) |
1 (1.00) |
0.116 (0.87) |
0.476 (1.00) |
0.671 (1.00) |
1 (1.00) |
1 (1.00) |
| 11q loss | 23 (26%) | 67 |
0.158 (0.925) |
0.563 (1.00) |
0.0271 (0.575) |
0.163 (0.94) |
1 (1.00) |
0.317 (1.00) |
1 (1.00) |
0.103 (0.87) |
0.687 (1.00) |
0.854 (1.00) |
1 (1.00) |
0.569 (1.00) |
| 12p loss | 5 (6%) | 85 |
0.181 (0.949) |
0.241 (0.998) |
0.334 (1.00) |
0.287 (1.00) |
1 (1.00) |
0.335 (1.00) |
1 (1.00) |
1 (1.00) |
0.0583 (0.758) |
0.318 (1.00) |
1 (1.00) |
1 (1.00) |
| 12q loss | 4 (4%) | 86 |
0.0594 (0.758) |
0.463 (1.00) |
0.334 (1.00) |
0.286 (1.00) |
1 (1.00) |
0.606 (1.00) |
1 (1.00) |
1 (1.00) |
0.0587 (0.758) |
0.318 (1.00) |
1 (1.00) |
1 (1.00) |
| 13q loss | 39 (43%) | 51 |
0.114 (0.87) |
0.536 (1.00) |
0.485 (1.00) |
0.921 (1.00) |
0.51 (1.00) |
0.51 (1.00) |
1 (1.00) |
0.205 (0.96) |
0.866 (1.00) |
0.606 (1.00) |
0.507 (1.00) |
1 (1.00) |
| 14q loss | 18 (20%) | 72 |
0.72 (1.00) |
0.793 (1.00) |
0.834 (1.00) |
0.78 (1.00) |
0.68 (1.00) |
0.782 (1.00) |
1 (1.00) |
0.0534 (0.758) |
0.531 (1.00) |
0.265 (1.00) |
0.218 (0.964) |
0.129 (0.876) |
| 15q loss | 21 (23%) | 69 |
0.679 (1.00) |
0.519 (1.00) |
0.647 (1.00) |
0.705 (1.00) |
1 (1.00) |
0.606 (1.00) |
0.218 (0.964) |
0.0795 (0.857) |
0.96 (1.00) |
0.333 (1.00) |
1 (1.00) |
0.664 (1.00) |
| 16q loss | 5 (6%) | 85 |
0.0193 (0.516) |
0.214 (0.963) |
0.247 (1.00) |
0.14 (0.909) |
0.461 (1.00) |
1 (1.00) |
0.275 (1.00) |
1 (1.00) |
0.114 (0.87) |
1 (1.00) |
0.444 (1.00) |
|
| 17q loss | 24 (27%) | 66 |
0.0129 (0.441) |
0.964 (1.00) |
0.19 (0.949) |
0.36 (1.00) |
0.706 (1.00) |
0.00587 (0.338) |
0.377 (1.00) |
0.687 (1.00) |
0.217 (0.964) |
0.583 (1.00) |
1 (1.00) |
0.664 (1.00) |
| 18p loss | 37 (41%) | 53 |
0.599 (1.00) |
0.892 (1.00) |
0.21 (0.963) |
0.494 (1.00) |
1 (1.00) |
0.37 (1.00) |
0.295 (1.00) |
0.59 (1.00) |
0.182 (0.949) |
0.816 (1.00) |
0.291 (1.00) |
1 (1.00) |
| 18q loss | 35 (39%) | 55 |
0.934 (1.00) |
0.747 (1.00) |
0.274 (1.00) |
0.521 (1.00) |
1 (1.00) |
0.11 (0.87) |
0.584 (1.00) |
0.426 (1.00) |
0.647 (1.00) |
0.816 (1.00) |
0.274 (1.00) |
1 (1.00) |
| 19q loss | 4 (4%) | 86 |
0.0746 (0.834) |
0.124 (0.873) |
0.876 (1.00) |
1 (1.00) |
1 (1.00) |
1 (1.00) |
0.576 (1.00) |
1 (1.00) |
0.735 (1.00) |
0.318 (1.00) |
1 (1.00) |
1 (1.00) |
| 20q loss | 3 (3%) | 87 |
0.408 (1.00) |
0.582 (1.00) |
0.703 (1.00) |
0.525 (1.00) |
1 (1.00) |
0.549 (1.00) |
1 (1.00) |
1 (1.00) |
0.0367 (0.685) |
1 (1.00) |
0.321 (1.00) |
|
| 21q loss | 15 (17%) | 75 |
0.0214 (0.527) |
0.468 (1.00) |
0.669 (1.00) |
0.418 (1.00) |
1 (1.00) |
0.565 (1.00) |
0.502 (1.00) |
0.031 (0.624) |
0.52 (1.00) |
0.475 (1.00) |
1 (1.00) |
1 (1.00) |
| 22q loss | 48 (53%) | 42 |
0.0059 (0.338) |
0.236 (0.984) |
0.189 (0.949) |
0.0806 (0.857) |
1 (1.00) |
0.374 (1.00) |
1 (1.00) |
1 (1.00) |
0.755 (1.00) |
0.51 (1.00) |
1 (1.00) |
0.117 (0.87) |
| xp loss | 16 (18%) | 74 |
0.752 (1.00) |
0.0502 (0.758) |
0.861 (1.00) |
0.866 (1.00) |
0.677 (1.00) |
0.778 (1.00) |
0.29 (1.00) |
0.631 (1.00) |
1 (1.00) |
0.974 (1.00) |
1 (1.00) |
0.571 (1.00) |
| xq loss | 15 (17%) | 75 |
0.725 (1.00) |
0.12 (0.87) |
0.7 (1.00) |
0.551 (1.00) |
0.194 (0.952) |
1 (1.00) |
0.0647 (0.767) |
0.607 (1.00) |
1 (1.00) |
0.116 (0.87) |
1 (1.00) |
0.571 (1.00) |
P value = 0.000374 (logrank test), Q value = 0.074
Table S1. Gene #3: '2p gain' versus Clinical Feature #1: 'Time to Death'
| nPatients | nDeath | Duration Range (Median), Month | |
|---|---|---|---|
| ALL | 90 | 33 | 0.0 - 153.6 (38.9) |
| 2P GAIN MUTATED | 13 | 10 | 0.0 - 91.3 (16.4) |
| 2P GAIN WILD-TYPE | 77 | 23 | 4.1 - 153.6 (39.5) |
Figure S1. Get High-res Image Gene #3: '2p gain' versus Clinical Feature #1: 'Time to Death'
P value = 0.00137 (logrank test), Q value = 0.15
Table S2. Gene #20: '10q gain' versus Clinical Feature #1: 'Time to Death'
| nPatients | nDeath | Duration Range (Median), Month | |
|---|---|---|---|
| ALL | 90 | 33 | 0.0 - 153.6 (38.9) |
| 10Q GAIN MUTATED | 26 | 15 | 0.0 - 91.3 (32.0) |
| 10Q GAIN WILD-TYPE | 64 | 18 | 4.1 - 153.6 (43.9) |
Figure S2. Get High-res Image Gene #20: '10q gain' versus Clinical Feature #1: 'Time to Death'
P value = 0.00179 (Fisher's exact test), Q value = 0.18
Table S3. Gene #20: '10q gain' versus Clinical Feature #3: 'PATHOLOGIC_STAGE'
| nPatients | STAGE I | STAGE II | STAGE III | STAGE IV |
|---|---|---|---|---|
| ALL | 9 | 43 | 18 | 18 |
| 10Q GAIN MUTATED | 0 | 8 | 6 | 11 |
| 10Q GAIN WILD-TYPE | 9 | 35 | 12 | 7 |
Figure S3. Get High-res Image Gene #20: '10q gain' versus Clinical Feature #3: 'PATHOLOGIC_STAGE'
P value = 0.0011 (Fisher's exact test), Q value = 0.14
Table S4. Gene #20: '10q gain' versus Clinical Feature #9: 'RESIDUAL_TUMOR'
| nPatients | R0 | R1 | R2 | RX |
|---|---|---|---|---|
| ALL | 63 | 7 | 12 | 5 |
| 10Q GAIN MUTATED | 12 | 2 | 9 | 1 |
| 10Q GAIN WILD-TYPE | 51 | 5 | 3 | 4 |
Figure S4. Get High-res Image Gene #20: '10q gain' versus Clinical Feature #9: 'RESIDUAL_TUMOR'
P value = 1e-04 (logrank test), Q value = 0.028
Table S5. Gene #21: '11p gain' versus Clinical Feature #1: 'Time to Death'
| nPatients | nDeath | Duration Range (Median), Month | |
|---|---|---|---|
| ALL | 90 | 33 | 0.0 - 153.6 (38.9) |
| 11P GAIN MUTATED | 5 | 5 | 0.0 - 60.9 (14.3) |
| 11P GAIN WILD-TYPE | 85 | 28 | 4.1 - 153.6 (39.2) |
Figure S5. Get High-res Image Gene #21: '11p gain' versus Clinical Feature #1: 'Time to Death'
P value = 5.25e-05 (logrank test), Q value = 0.026
Table S6. Gene #22: '11q gain' versus Clinical Feature #1: 'Time to Death'
| nPatients | nDeath | Duration Range (Median), Month | |
|---|---|---|---|
| ALL | 90 | 33 | 0.0 - 153.6 (38.9) |
| 11Q GAIN MUTATED | 6 | 6 | 12.6 - 60.9 (16.2) |
| 11Q GAIN WILD-TYPE | 84 | 27 | 0.0 - 153.6 (39.4) |
Figure S6. Get High-res Image Gene #22: '11q gain' versus Clinical Feature #1: 'Time to Death'
P value = 0.000114 (logrank test), Q value = 0.028
Table S7. Gene #48: '4p loss' versus Clinical Feature #1: 'Time to Death'
| nPatients | nDeath | Duration Range (Median), Month | |
|---|---|---|---|
| ALL | 90 | 33 | 0.0 - 153.6 (38.9) |
| 4P LOSS MUTATED | 10 | 7 | 4.1 - 46.5 (18.1) |
| 4P LOSS WILD-TYPE | 80 | 26 | 0.0 - 153.6 (41.0) |
Figure S7. Get High-res Image Gene #48: '4p loss' versus Clinical Feature #1: 'Time to Death'
P value = 1.4e-05 (logrank test), Q value = 0.014
Table S8. Gene #49: '4q loss' versus Clinical Feature #1: 'Time to Death'
| nPatients | nDeath | Duration Range (Median), Month | |
|---|---|---|---|
| ALL | 90 | 33 | 0.0 - 153.6 (38.9) |
| 4Q LOSS MUTATED | 11 | 8 | 4.1 - 46.5 (18.1) |
| 4Q LOSS WILD-TYPE | 79 | 25 | 0.0 - 153.6 (42.5) |
Figure S8. Get High-res Image Gene #49: '4q loss' versus Clinical Feature #1: 'Time to Death'
P value = 0.000658 (logrank test), Q value = 0.11
Table S9. Gene #69: '16p loss' versus Clinical Feature #1: 'Time to Death'
| nPatients | nDeath | Duration Range (Median), Month | |
|---|---|---|---|
| ALL | 90 | 33 | 0.0 - 153.6 (38.9) |
| 16P LOSS MUTATED | 6 | 5 | 12.6 - 39.4 (18.1) |
| 16P LOSS WILD-TYPE | 84 | 28 | 0.0 - 153.6 (39.5) |
Figure S9. Get High-res Image Gene #69: '16p loss' versus Clinical Feature #1: 'Time to Death'
P value = 0.000962 (logrank test), Q value = 0.14
Table S10. Gene #71: '17p loss' versus Clinical Feature #1: 'Time to Death'
| nPatients | nDeath | Duration Range (Median), Month | |
|---|---|---|---|
| ALL | 90 | 33 | 0.0 - 153.6 (38.9) |
| 17P LOSS MUTATED | 32 | 18 | 4.1 - 91.3 (31.5) |
| 17P LOSS WILD-TYPE | 58 | 15 | 0.0 - 153.6 (43.9) |
Figure S10. Get High-res Image Gene #71: '17p loss' versus Clinical Feature #1: 'Time to Death'
P value = 0.00287 (logrank test), Q value = 0.24
Table S11. Gene #75: '19p loss' versus Clinical Feature #1: 'Time to Death'
| nPatients | nDeath | Duration Range (Median), Month | |
|---|---|---|---|
| ALL | 90 | 33 | 0.0 - 153.6 (38.9) |
| 19P LOSS MUTATED | 5 | 4 | 12.6 - 44.5 (18.1) |
| 19P LOSS WILD-TYPE | 85 | 29 | 0.0 - 153.6 (39.4) |
Figure S11. Get High-res Image Gene #75: '19p loss' versus Clinical Feature #1: 'Time to Death'
P value = 0.00203 (Fisher's exact test), Q value = 0.18
Table S12. Gene #77: '20p loss' versus Clinical Feature #9: 'RESIDUAL_TUMOR'
| nPatients | R0 | R1 | R2 | RX |
|---|---|---|---|---|
| ALL | 63 | 7 | 12 | 5 |
| 20P LOSS MUTATED | 3 | 4 | 0 | 0 |
| 20P LOSS WILD-TYPE | 60 | 3 | 12 | 5 |
Figure S12. Get High-res Image Gene #77: '20p loss' versus Clinical Feature #9: 'RESIDUAL_TUMOR'
-
Copy number data file = broad_values_by_arm.txt from GISTIC pipeline
-
Processed Copy number data file = /xchip/cga/gdac-prod/tcga-gdac/jobResults/GDAC_Correlate_Genomic_Events_Preprocess/ACC-TP/19778621/transformed.cor.cli.txt
-
Clinical data file = /xchip/cga/gdac-prod/tcga-gdac/jobResults/Append_Data/ACC-TP/19775006/ACC-TP.merged_data.txt
-
Number of patients = 90
-
Number of significantly arm-level cnvs = 82
-
Number of selected clinical features = 12
-
Exclude regions that fewer than K tumors have mutations, K = 3
For survival clinical features, the Kaplan-Meier survival curves of tumors with and without gene mutations were plotted and the statistical significance P values were estimated by logrank test (Bland and Altman 2004) using the 'survdiff' function in R
For binary or multi-class clinical features (nominal or ordinal), two-tailed Fisher's exact tests (Fisher 1922) were used to estimate the P values using the 'fisher.test' function in R
For multiple hypothesis correction, Q value is the False Discovery Rate (FDR) analogue of the P value (Benjamini and Hochberg 1995), defined as the minimum FDR at which the test may be called significant. We used the 'Benjamini and Hochberg' method of 'p.adjust' function in R to convert P values into Q values.
In addition to the links below, the full results of the analysis summarized in this report can also be downloaded programmatically using firehose_get, or interactively from either the Broad GDAC website or TCGA Data Coordination Center Portal.