This pipeline computes the correlation between APOBRC groups and selected clinical features.
Testing the association between APOBEC groups identified by 2 different apobec score and 13 clinical features across 395 patients, 7 significant findings detected with Q value < 0.25.
-
3 subtypes identified in current cancer cohort by 'APOBEC MUTLOAD MINESTIMATE'. These subtypes correlate to 'Time to Death', 'GENDER', 'RADIATION_THERAPY', and 'RACE'.
-
3 subtypes identified in current cancer cohort by 'APOBEC ENRICH'. These subtypes correlate to 'Time to Death', 'RADIATION_THERAPY', and 'RACE'.
Table 1. Get Full Table Overview of the association between APOBEC groups by 2 different APOBEC scores and 13 clinical features. Shown in the table are P values (Q values). Thresholded by Q value < 0.25, 7 significant findings detected.
|
Clinical Features |
Statistical Tests |
APOBEC MUTLOAD MINESTIMATE |
APOBEC ENRICH |
| Time to Death | logrank test |
0.0103 (0.0667) |
0.0218 (0.105) |
| YEARS TO BIRTH | Kruskal-Wallis (anova) |
0.567 (0.702) |
0.611 (0.722) |
| PATHOLOGIC STAGE | Fisher's exact test |
0.457 (0.661) |
0.361 (0.635) |
| PATHOLOGY T STAGE | Fisher's exact test |
0.378 (0.635) |
0.137 (0.444) |
| PATHOLOGY N STAGE | Fisher's exact test |
0.361 (0.635) |
0.549 (0.702) |
| PATHOLOGY M STAGE | Fisher's exact test |
0.824 (0.892) |
0.216 (0.624) |
| GENDER | Fisher's exact test |
0.0446 (0.166) |
0.655 (0.741) |
| RADIATION THERAPY | Fisher's exact test |
0.0242 (0.105) |
0.00835 (0.0667) |
| KARNOFSKY PERFORMANCE SCORE | Kruskal-Wallis (anova) |
0.354 (0.635) |
0.488 (0.667) |
| NUMBER PACK YEARS SMOKED | Kruskal-Wallis (anova) |
0.25 (0.635) |
0.391 (0.635) |
| NUMBER OF LYMPH NODES | Kruskal-Wallis (anova) |
0.317 (0.635) |
0.454 (0.661) |
| RACE | Fisher's exact test |
0.00041 (0.00533) |
0.0001 (0.0026) |
| ETHNICITY | Fisher's exact test |
0.888 (0.923) |
1 (1.00) |
Table S1. Description of APOBEC group #1: 'APOBEC MUTLOAD MINESTIMATE'
| Cluster Labels | 0 | HIGH | LOW |
|---|---|---|---|
| Number of samples | 46 | 136 | 213 |
P value = 0.0103 (logrank test), Q value = 0.067
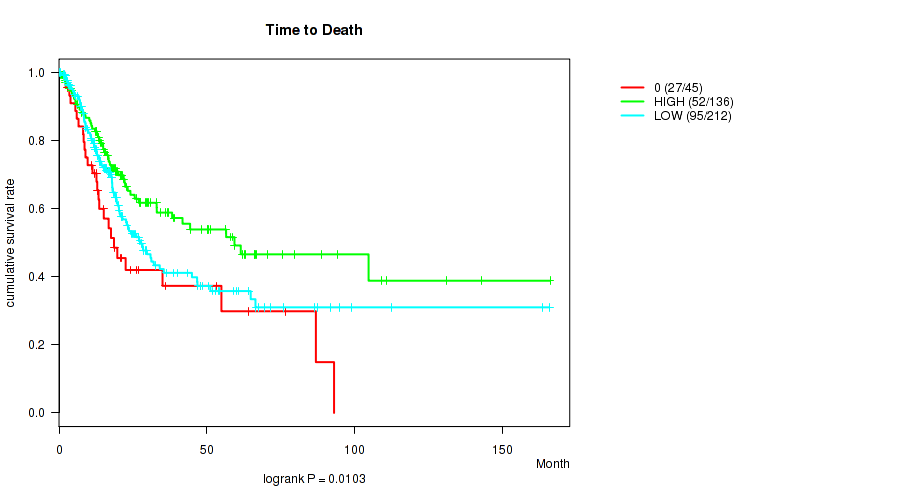
Table S2. Clustering Approach #1: 'APOBEC MUTLOAD MINESTIMATE' versus Clinical Feature #1: 'Time to Death'
| nPatients | nDeath | Duration Range (Median), Month | |
|---|---|---|---|
| ALL | 393 | 174 | 0.1 - 166.0 (17.2) |
| 0 | 45 | 27 | 2.0 - 93.0 (13.6) |
| HIGH | 136 | 52 | 0.6 - 166.0 (19.2) |
| LOW | 212 | 95 | 0.1 - 165.7 (16.1) |
Figure S1. Get High-res Image Clustering Approach #1: 'APOBEC MUTLOAD MINESTIMATE' versus Clinical Feature #1: 'Time to Death'
P value = 0.0446 (Fisher's exact test), Q value = 0.17
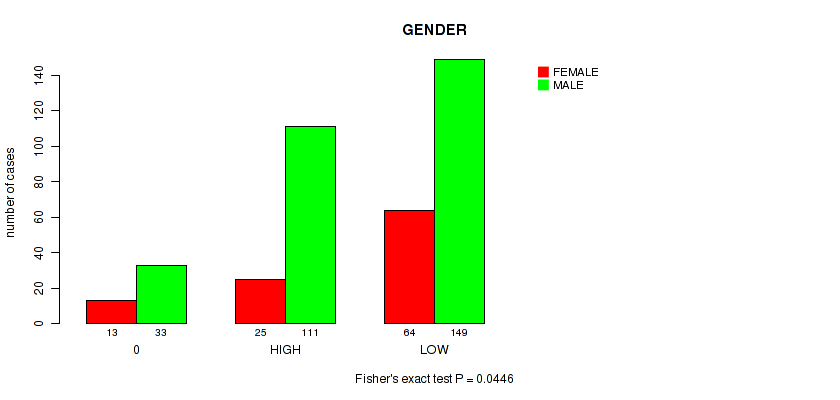
Table S3. Clustering Approach #1: 'APOBEC MUTLOAD MINESTIMATE' versus Clinical Feature #7: 'GENDER'
| nPatients | FEMALE | MALE |
|---|---|---|
| ALL | 102 | 293 |
| 0 | 13 | 33 |
| HIGH | 25 | 111 |
| LOW | 64 | 149 |
Figure S2. Get High-res Image Clustering Approach #1: 'APOBEC MUTLOAD MINESTIMATE' versus Clinical Feature #7: 'GENDER'
P value = 0.0242 (Fisher's exact test), Q value = 0.11
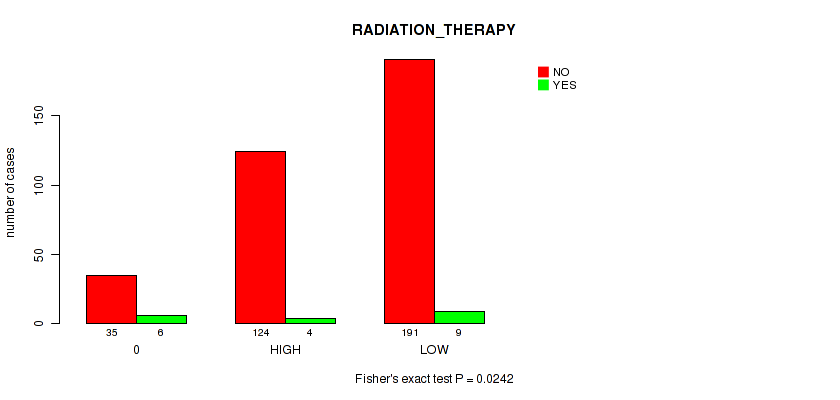
Table S4. Clustering Approach #1: 'APOBEC MUTLOAD MINESTIMATE' versus Clinical Feature #8: 'RADIATION_THERAPY'
| nPatients | NO | YES |
|---|---|---|
| ALL | 350 | 19 |
| 0 | 35 | 6 |
| HIGH | 124 | 4 |
| LOW | 191 | 9 |
Figure S3. Get High-res Image Clustering Approach #1: 'APOBEC MUTLOAD MINESTIMATE' versus Clinical Feature #8: 'RADIATION_THERAPY'
P value = 0.00041 (Fisher's exact test), Q value = 0.0053
Table S5. Clustering Approach #1: 'APOBEC MUTLOAD MINESTIMATE' versus Clinical Feature #12: 'RACE'
| nPatients | ASIAN | BLACK OR AFRICAN AMERICAN | WHITE |
|---|---|---|---|
| ALL | 39 | 22 | 317 |
| 0 | 13 | 4 | 27 |
| HIGH | 8 | 5 | 119 |
| LOW | 18 | 13 | 171 |
Figure S4. Get High-res Image Clustering Approach #1: 'APOBEC MUTLOAD MINESTIMATE' versus Clinical Feature #12: 'RACE'
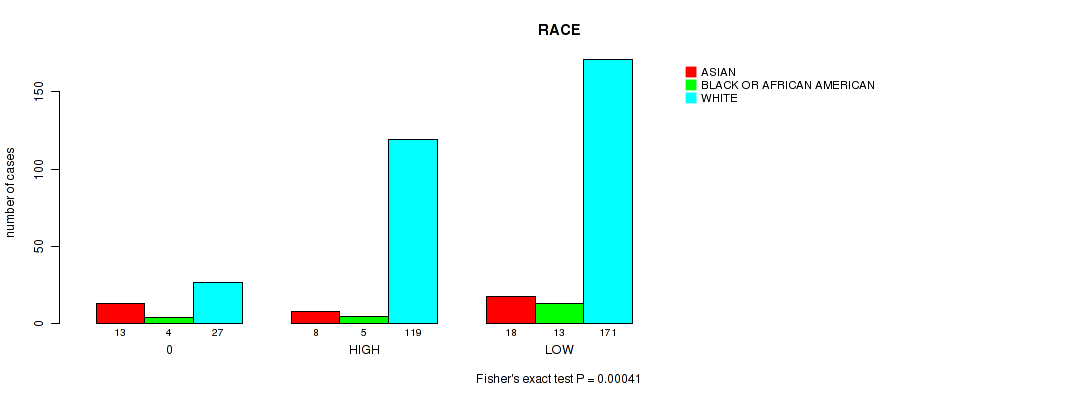
Table S6. Description of APOBEC group #2: 'APOBEC ENRICH'
| Cluster Labels | FC.HIGH.SIG | FC.LOW.NONSIG | FC.NEUTRAL |
|---|---|---|---|
| Number of samples | 327 | 46 | 22 |
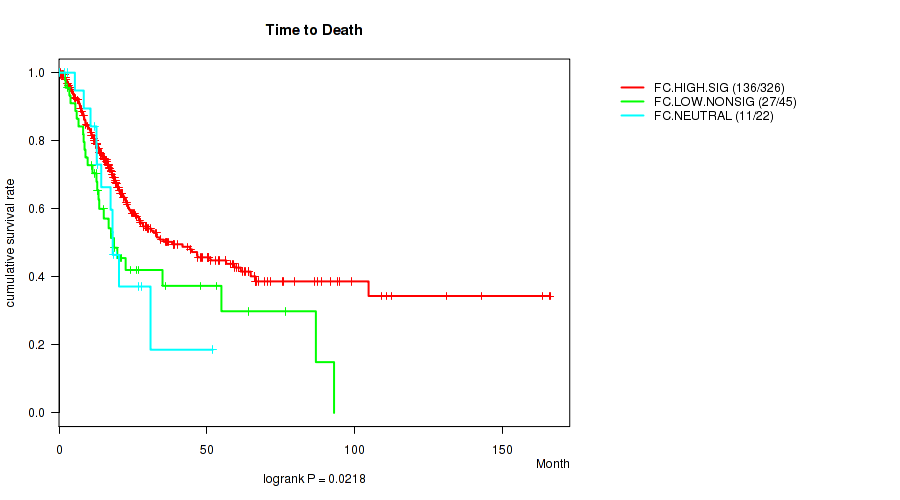
P value = 0.0218 (logrank test), Q value = 0.11
Table S7. Clustering Approach #2: 'APOBEC ENRICH' versus Clinical Feature #1: 'Time to Death'
| nPatients | nDeath | Duration Range (Median), Month | |
|---|---|---|---|
| ALL | 393 | 174 | 0.1 - 166.0 (17.2) |
| FC.HIGH.SIG | 326 | 136 | 0.6 - 166.0 (17.7) |
| FC.LOW.NONSIG | 45 | 27 | 2.0 - 93.0 (13.6) |
| FC.NEUTRAL | 22 | 11 | 0.1 - 52.0 (13.7) |
Figure S5. Get High-res Image Clustering Approach #2: 'APOBEC ENRICH' versus Clinical Feature #1: 'Time to Death'
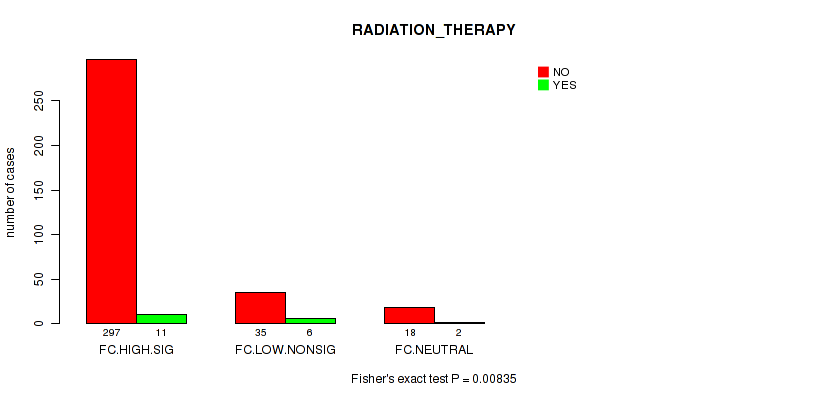
P value = 0.00835 (Fisher's exact test), Q value = 0.067
Table S8. Clustering Approach #2: 'APOBEC ENRICH' versus Clinical Feature #8: 'RADIATION_THERAPY'
| nPatients | NO | YES |
|---|---|---|
| ALL | 350 | 19 |
| FC.HIGH.SIG | 297 | 11 |
| FC.LOW.NONSIG | 35 | 6 |
| FC.NEUTRAL | 18 | 2 |
Figure S6. Get High-res Image Clustering Approach #2: 'APOBEC ENRICH' versus Clinical Feature #8: 'RADIATION_THERAPY'
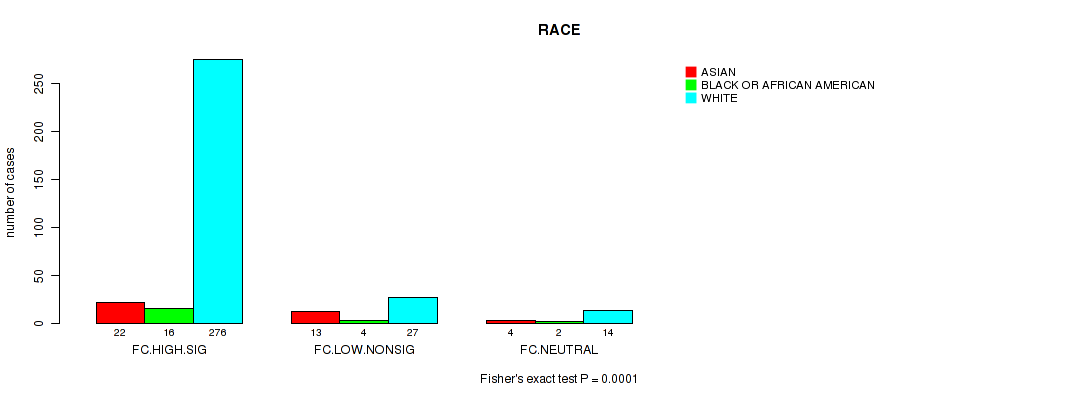
P value = 1e-04 (Fisher's exact test), Q value = 0.0026
Table S9. Clustering Approach #2: 'APOBEC ENRICH' versus Clinical Feature #12: 'RACE'
| nPatients | ASIAN | BLACK OR AFRICAN AMERICAN | WHITE |
|---|---|---|---|
| ALL | 39 | 22 | 317 |
| FC.HIGH.SIG | 22 | 16 | 276 |
| FC.LOW.NONSIG | 13 | 4 | 27 |
| FC.NEUTRAL | 4 | 2 | 14 |
Figure S7. Get High-res Image Clustering Approach #2: 'APOBEC ENRICH' versus Clinical Feature #12: 'RACE'
-
APOBEC groups file = /xchip/cga/gdac-prod/tcga-gdac/jobResults/APOBEC_Pipelines/BLCA-TP/19921873/APOBEC_clinical_corr_input_19929340/APOBEC_for_clinical.correlaion.input.categorical.txt
-
Clinical data file = /xchip/cga/gdac-prod/tcga-gdac/jobResults/Append_Data/BLCA-TP/19775034/BLCA-TP.merged_data.txt
-
Number of patients = 395
-
Number of selected clinical features = 13
APOBEC classification based on APOBEC_MutLoad_MinEstimate : a. APOBEC non group -- samples with zero value, b. APOBEC hig group -- samples above median value in non zero samples, c. APOBEC hig group -- samples below median value in non zero samples.
APOBEC classification based on APOBEC_enrich : a. No Enrichmment group -- all samples with BH_Fisher_p-value_tCw >=0.05, b. Small enrichment group -- samples with BH_Fisher_p-value_tCw = < 0.05 and APOBEC_enrich=<2, c. High enrichment gruop -- samples with BH_Fisher_p-value_tCw =< 0.05 and APOBEC_enrich>2.
For survival clinical features, the Kaplan-Meier survival curves of tumors with and without gene mutations were plotted and the statistical significance P values were estimated by logrank test (Bland and Altman 2004) using the 'survdiff' function in R
For binary clinical features, two-tailed Fisher's exact tests (Fisher 1922) were used to estimate the P values using the 'fisher.test' function in R
For multiple hypothesis correction, Q value is the False Discovery Rate (FDR) analogue of the P value (Benjamini and Hochberg 1995), defined as the minimum FDR at which the test may be called significant. We used the 'Benjamini and Hochberg' method of 'p.adjust' function in R to convert P values into Q values.
In addition to the links below, the full results of the analysis summarized in this report can also be downloaded programmatically using firehose_get, or interactively from either the Broad GDAC website or TCGA Data Coordination Center Portal.