This pipeline computes the correlation between APOBRC groups and selected clinical features.
Testing the association between APOBEC groups identified by 2 different apobec score and 12 clinical features across 977 patients, 5 significant findings detected with Q value < 0.25.
-
3 subtypes identified in current cancer cohort by 'APOBEC MUTLOAD MINESTIMATE'. These subtypes correlate to 'HISTOLOGICAL_TYPE' and 'RACE'.
-
3 subtypes identified in current cancer cohort by 'APOBEC ENRICH'. These subtypes correlate to 'HISTOLOGICAL_TYPE', 'RACE', and 'ETHNICITY'.
Table 1. Get Full Table Overview of the association between APOBEC groups by 2 different APOBEC scores and 12 clinical features. Shown in the table are P values (Q values). Thresholded by Q value < 0.25, 5 significant findings detected.
|
Clinical Features |
Statistical Tests |
APOBEC MUTLOAD MINESTIMATE |
APOBEC ENRICH |
| Time to Death | logrank test |
0.457 (0.783) |
0.781 (0.986) |
| YEARS TO BIRTH | Kruskal-Wallis (anova) |
0.228 (0.563) |
0.861 (1.00) |
| PATHOLOGIC STAGE | Fisher's exact test |
0.729 (0.986) |
0.572 (0.915) |
| PATHOLOGY T STAGE | Fisher's exact test |
0.344 (0.635) |
0.225 (0.563) |
| PATHOLOGY N STAGE | Fisher's exact test |
0.258 (0.563) |
0.637 (0.956) |
| PATHOLOGY M STAGE | Fisher's exact test |
1 (1.00) |
1 (1.00) |
| GENDER | Fisher's exact test |
0.244 (0.563) |
1 (1.00) |
| RADIATION THERAPY | Fisher's exact test |
0.339 (0.635) |
0.741 (0.986) |
| HISTOLOGICAL TYPE | Fisher's exact test |
0.00041 (0.00984) |
0.00143 (0.0124) |
| NUMBER OF LYMPH NODES | Kruskal-Wallis (anova) |
0.195 (0.563) |
0.195 (0.563) |
| RACE | Fisher's exact test |
0.00289 (0.0173) |
0.00155 (0.0124) |
| ETHNICITY | Fisher's exact test |
0.905 (1.00) |
0.0461 (0.221) |
Table S1. Description of APOBEC group #1: 'APOBEC MUTLOAD MINESTIMATE'
| Cluster Labels | 0 | HIGH | LOW |
|---|---|---|---|
| Number of samples | 750 | 133 | 94 |
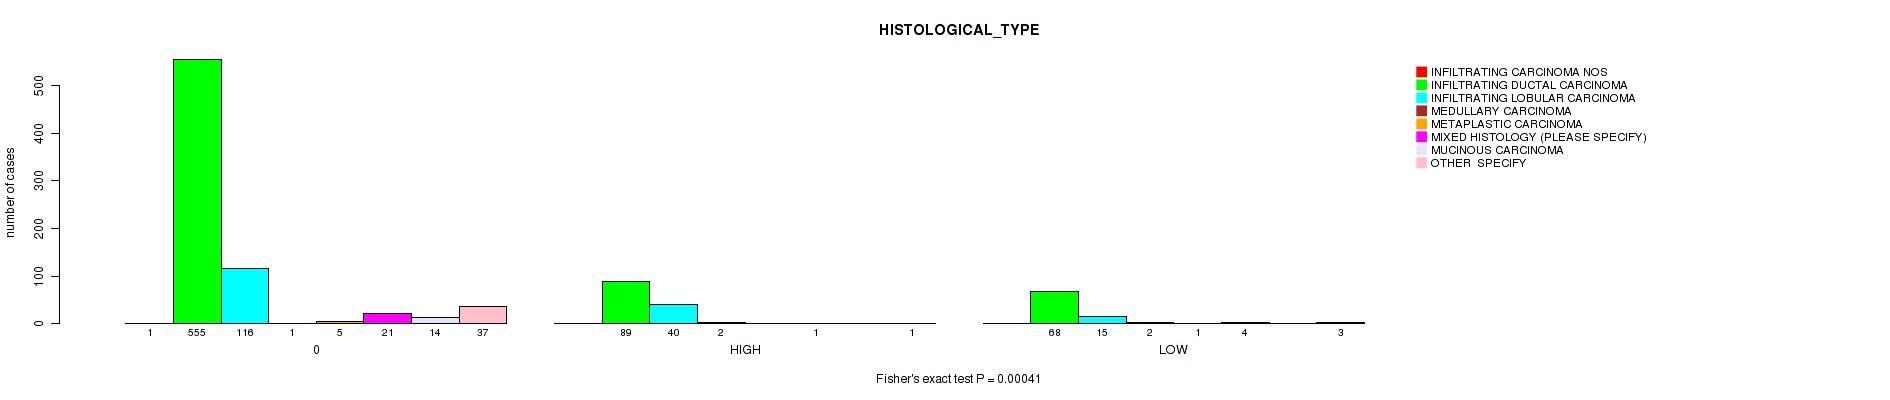
P value = 0.00041 (Fisher's exact test), Q value = 0.0098
Table S2. Clustering Approach #1: 'APOBEC MUTLOAD MINESTIMATE' versus Clinical Feature #9: 'HISTOLOGICAL_TYPE'
| nPatients | INFILTRATING CARCINOMA NOS | INFILTRATING DUCTAL CARCINOMA | INFILTRATING LOBULAR CARCINOMA | MEDULLARY CARCINOMA | METAPLASTIC CARCINOMA | MIXED HISTOLOGY (PLEASE SPECIFY) | MUCINOUS CARCINOMA | OTHER SPECIFY |
|---|---|---|---|---|---|---|---|---|
| ALL | 1 | 712 | 171 | 5 | 6 | 26 | 14 | 41 |
| 0 | 1 | 555 | 116 | 1 | 5 | 21 | 14 | 37 |
| HIGH | 0 | 89 | 40 | 2 | 0 | 1 | 0 | 1 |
| LOW | 0 | 68 | 15 | 2 | 1 | 4 | 0 | 3 |
Figure S1. Get High-res Image Clustering Approach #1: 'APOBEC MUTLOAD MINESTIMATE' versus Clinical Feature #9: 'HISTOLOGICAL_TYPE'
P value = 0.00289 (Fisher's exact test), Q value = 0.017
Table S3. Clustering Approach #1: 'APOBEC MUTLOAD MINESTIMATE' versus Clinical Feature #11: 'RACE'
| nPatients | AMERICAN INDIAN OR ALASKA NATIVE | ASIAN | BLACK OR AFRICAN AMERICAN | WHITE |
|---|---|---|---|---|
| ALL | 1 | 57 | 121 | 705 |
| 0 | 1 | 33 | 86 | 561 |
| HIGH | 0 | 16 | 19 | 85 |
| LOW | 0 | 8 | 16 | 59 |
Figure S2. Get High-res Image Clustering Approach #1: 'APOBEC MUTLOAD MINESTIMATE' versus Clinical Feature #11: 'RACE'
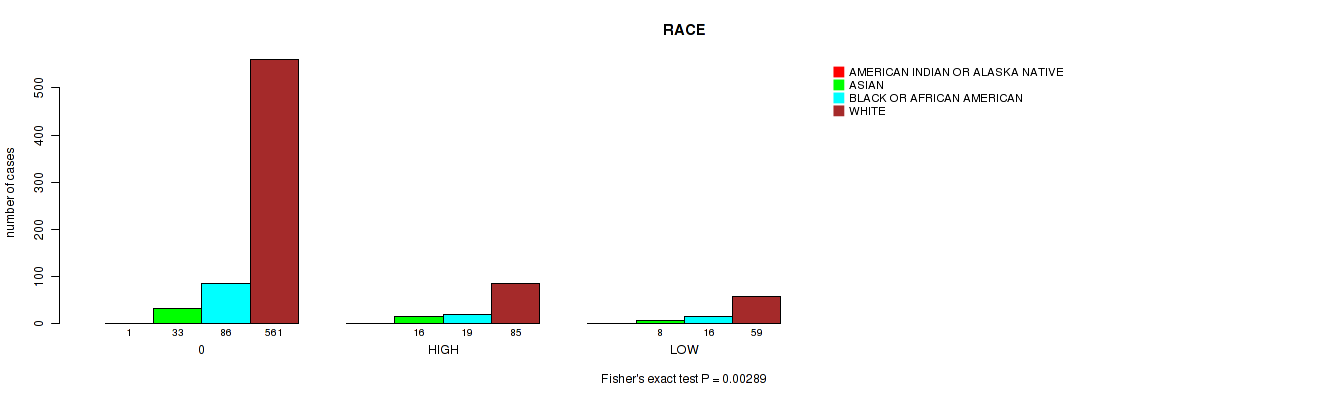
Table S4. Description of APOBEC group #2: 'APOBEC ENRICH'
| Cluster Labels | FC.HIGH.SIG | FC.LOW.NONSIG | FC.NEUTRAL |
|---|---|---|---|
| Number of samples | 220 | 656 | 101 |
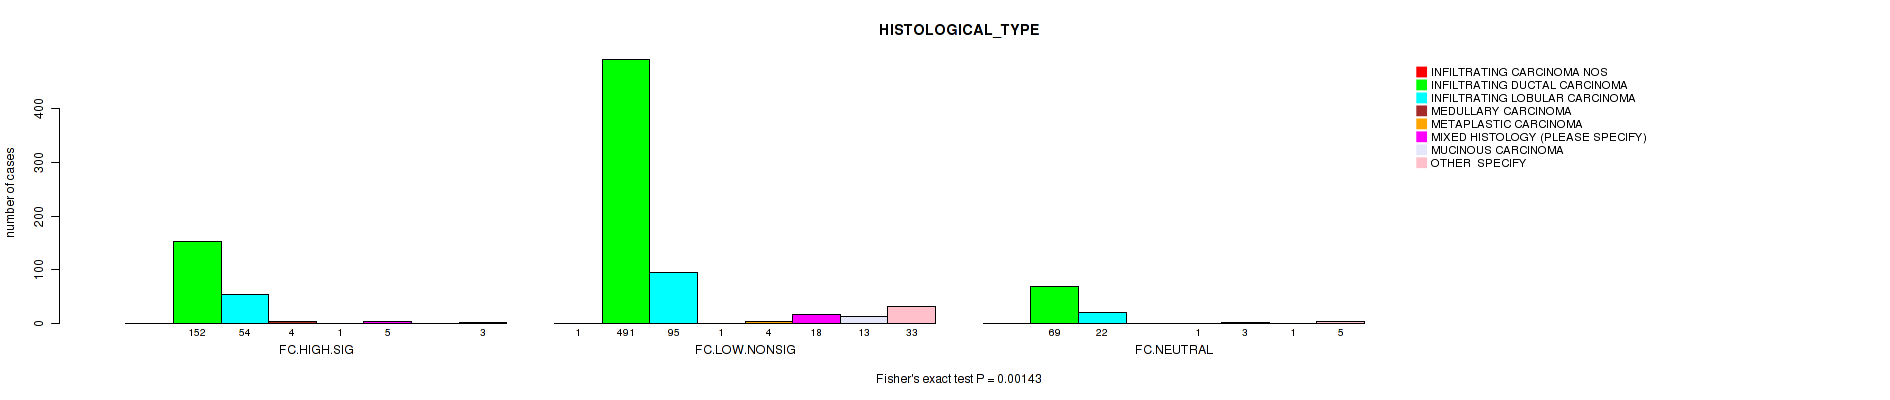
P value = 0.00143 (Fisher's exact test), Q value = 0.012
Table S5. Clustering Approach #2: 'APOBEC ENRICH' versus Clinical Feature #9: 'HISTOLOGICAL_TYPE'
| nPatients | INFILTRATING CARCINOMA NOS | INFILTRATING DUCTAL CARCINOMA | INFILTRATING LOBULAR CARCINOMA | MEDULLARY CARCINOMA | METAPLASTIC CARCINOMA | MIXED HISTOLOGY (PLEASE SPECIFY) | MUCINOUS CARCINOMA | OTHER SPECIFY |
|---|---|---|---|---|---|---|---|---|
| ALL | 1 | 712 | 171 | 5 | 6 | 26 | 14 | 41 |
| FC.HIGH.SIG | 0 | 152 | 54 | 4 | 1 | 5 | 0 | 3 |
| FC.LOW.NONSIG | 1 | 491 | 95 | 1 | 4 | 18 | 13 | 33 |
| FC.NEUTRAL | 0 | 69 | 22 | 0 | 1 | 3 | 1 | 5 |
Figure S3. Get High-res Image Clustering Approach #2: 'APOBEC ENRICH' versus Clinical Feature #9: 'HISTOLOGICAL_TYPE'
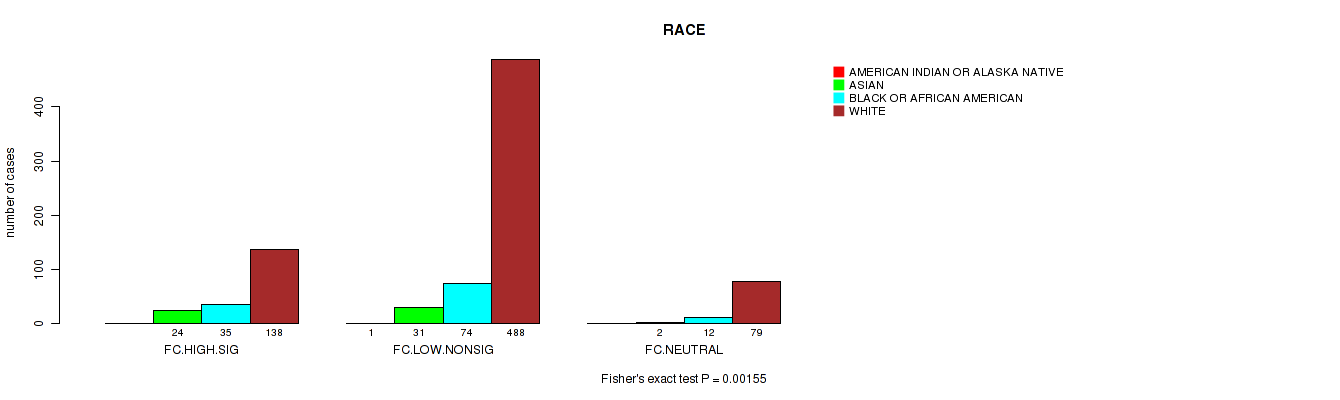
P value = 0.00155 (Fisher's exact test), Q value = 0.012
Table S6. Clustering Approach #2: 'APOBEC ENRICH' versus Clinical Feature #11: 'RACE'
| nPatients | AMERICAN INDIAN OR ALASKA NATIVE | ASIAN | BLACK OR AFRICAN AMERICAN | WHITE |
|---|---|---|---|---|
| ALL | 1 | 57 | 121 | 705 |
| FC.HIGH.SIG | 0 | 24 | 35 | 138 |
| FC.LOW.NONSIG | 1 | 31 | 74 | 488 |
| FC.NEUTRAL | 0 | 2 | 12 | 79 |
Figure S4. Get High-res Image Clustering Approach #2: 'APOBEC ENRICH' versus Clinical Feature #11: 'RACE'
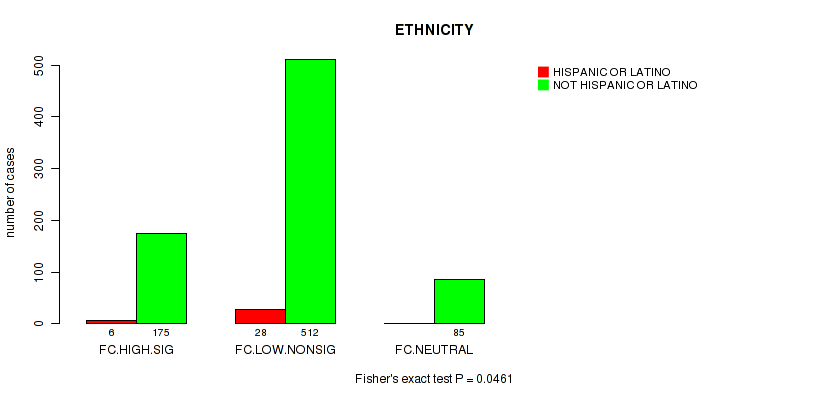
P value = 0.0461 (Fisher's exact test), Q value = 0.22
Table S7. Clustering Approach #2: 'APOBEC ENRICH' versus Clinical Feature #12: 'ETHNICITY'
| nPatients | HISPANIC OR LATINO | NOT HISPANIC OR LATINO |
|---|---|---|
| ALL | 34 | 772 |
| FC.HIGH.SIG | 6 | 175 |
| FC.LOW.NONSIG | 28 | 512 |
| FC.NEUTRAL | 0 | 85 |
Figure S5. Get High-res Image Clustering Approach #2: 'APOBEC ENRICH' versus Clinical Feature #12: 'ETHNICITY'
-
APOBEC groups file = /xchip/cga/gdac-prod/tcga-gdac/jobResults/APOBEC_Pipelines/BRCA-TP/20231607/APOBEC_clinical_corr_input_20231679/APOBEC_for_clinical.correlaion.input.categorical.txt
-
Clinical data file = /xchip/cga/gdac-prod/tcga-gdac/jobResults/Append_Data/BRCA-TP/19775058/BRCA-TP.merged_data.txt
-
Number of patients = 977
-
Number of selected clinical features = 12
APOBEC classification based on APOBEC_MutLoad_MinEstimate : a. APOBEC non group -- samples with zero value, b. APOBEC hig group -- samples above median value in non zero samples, c. APOBEC hig group -- samples below median value in non zero samples.
APOBEC classification based on APOBEC_enrich : a. No Enrichmment group -- all samples with BH_Fisher_p-value_tCw >=0.05, b. Small enrichment group -- samples with BH_Fisher_p-value_tCw = < 0.05 and APOBEC_enrich=<2, c. High enrichment gruop -- samples with BH_Fisher_p-value_tCw =< 0.05 and APOBEC_enrich>2.
For survival clinical features, the Kaplan-Meier survival curves of tumors with and without gene mutations were plotted and the statistical significance P values were estimated by logrank test (Bland and Altman 2004) using the 'survdiff' function in R
For binary clinical features, two-tailed Fisher's exact tests (Fisher 1922) were used to estimate the P values using the 'fisher.test' function in R
For multiple hypothesis correction, Q value is the False Discovery Rate (FDR) analogue of the P value (Benjamini and Hochberg 1995), defined as the minimum FDR at which the test may be called significant. We used the 'Benjamini and Hochberg' method of 'p.adjust' function in R to convert P values into Q values.
In addition to the links below, the full results of the analysis summarized in this report can also be downloaded programmatically using firehose_get, or interactively from either the Broad GDAC website or TCGA Data Coordination Center Portal.