This pipeline computes the correlation between significant arm-level copy number variations (cnvs) and selected clinical features.
Testing the association between copy number variation 52 arm-level events and 7 clinical features across 47 patients, one significant finding detected with Q value < 0.25.
-
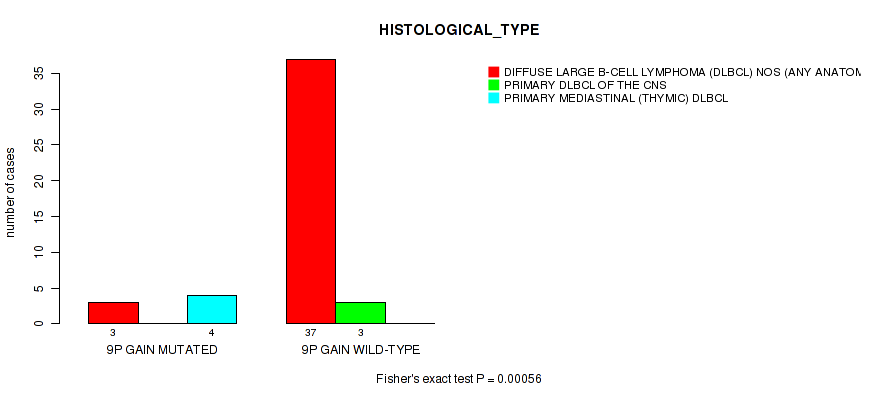
9p gain cnv correlated to 'HISTOLOGICAL_TYPE'.
Table 1. Get Full Table Overview of the association between significant copy number variation of 52 arm-level events and 7 clinical features. Shown in the table are P values (Q values). Thresholded by Q value < 0.25, one significant finding detected.
|
Clinical Features |
Time to Death |
YEARS TO BIRTH |
GENDER |
RADIATION THERAPY |
HISTOLOGICAL TYPE |
RACE | ETHNICITY | ||
| nCNV (%) | nWild-Type | logrank test | Wilcoxon-test | Fisher's exact test | Fisher's exact test | Fisher's exact test | Fisher's exact test | Fisher's exact test | |
| 9p gain | 7 (15%) | 40 |
0.945 (1.00) |
0.16 (0.776) |
0.684 (1.00) |
0.0601 (0.561) |
0.00056 (0.204) |
0.496 (1.00) |
0.35 (0.917) |
| 1q gain | 5 (11%) | 42 |
0.286 (0.867) |
0.277 (0.867) |
1 (1.00) |
1 (1.00) |
1 (1.00) |
0.232 (0.867) |
1 (1.00) |
| 2p gain | 6 (13%) | 41 |
0.986 (1.00) |
0.1 (0.668) |
1 (1.00) |
0.221 (0.867) |
0.112 (0.668) |
0.71 (1.00) |
0.164 (0.776) |
| 2q gain | 6 (13%) | 41 |
0.986 (1.00) |
0.1 (0.668) |
1 (1.00) |
0.221 (0.867) |
0.111 (0.668) |
0.71 (1.00) |
0.164 (0.776) |
| 3p gain | 10 (21%) | 37 |
0.098 (0.668) |
0.979 (1.00) |
1 (1.00) |
0.636 (1.00) |
0.789 (1.00) |
0.59 (1.00) |
0.251 (0.867) |
| 3q gain | 13 (28%) | 34 |
0.0508 (0.561) |
0.568 (1.00) |
0.746 (1.00) |
0.385 (0.971) |
1 (1.00) |
0.812 (1.00) |
0.269 (0.867) |
| 5p gain | 7 (15%) | 40 |
0.607 (1.00) |
0.317 (0.915) |
1 (1.00) |
0.0601 (0.561) |
0.0134 (0.486) |
0.735 (1.00) |
0.0595 (0.561) |
| 5q gain | 6 (13%) | 41 |
0.981 (1.00) |
0.156 (0.776) |
0.678 (1.00) |
0.037 (0.561) |
0.00732 (0.365) |
1 (1.00) |
0.0301 (0.561) |
| 6p gain | 6 (13%) | 41 |
0.275 (0.867) |
0.823 (1.00) |
0.204 (0.867) |
1 (1.00) |
0.642 (1.00) |
0.707 (1.00) |
0.637 (1.00) |
| 6q gain | 4 (9%) | 43 |
0.423 (0.993) |
0.954 (1.00) |
0.117 (0.668) |
1 (1.00) |
1 (1.00) |
0.343 (0.917) |
1 (1.00) |
| 7p gain | 15 (32%) | 32 |
0.11 (0.668) |
0.723 (1.00) |
0.758 (1.00) |
1 (1.00) |
0.219 (0.867) |
1 (1.00) |
0.481 (1.00) |
| 7q gain | 13 (28%) | 34 |
0.231 (0.867) |
0.695 (1.00) |
0.746 (1.00) |
1 (1.00) |
0.315 (0.915) |
0.81 (1.00) |
0.713 (1.00) |
| 8p gain | 7 (15%) | 40 |
0.774 (1.00) |
0.0391 (0.561) |
0.436 (0.993) |
0.286 (0.867) |
0.153 (0.776) |
0.337 (0.917) |
0.00802 (0.365) |
| 8q gain | 8 (17%) | 39 |
0.672 (1.00) |
0.0282 (0.561) |
0.715 (1.00) |
0.089 (0.668) |
0.0213 (0.516) |
0.272 (0.867) |
0.00184 (0.291) |
| 9q gain | 7 (15%) | 40 |
0.898 (1.00) |
0.139 (0.776) |
0.217 (0.867) |
0.0601 (0.561) |
0.0122 (0.486) |
0.496 (1.00) |
0.35 (0.917) |
| 10p gain | 4 (9%) | 43 |
0.402 (0.971) |
0.954 (1.00) |
0.117 (0.668) |
1 (1.00) |
1 (1.00) |
0.669 (1.00) |
1 (1.00) |
| 10q gain | 4 (9%) | 43 |
0.423 (0.993) |
0.457 (1.00) |
0.617 (1.00) |
0.496 (1.00) |
1 (1.00) |
0.669 (1.00) |
0.266 (0.867) |
| 11p gain | 9 (19%) | 38 |
0.747 (1.00) |
0.695 (1.00) |
0.0305 (0.561) |
1 (1.00) |
0.0652 (0.593) |
0.553 (1.00) |
0.0352 (0.561) |
| 11q gain | 13 (28%) | 34 |
0.819 (1.00) |
0.475 (1.00) |
0.102 (0.668) |
0.654 (1.00) |
0.234 (0.867) |
0.653 (1.00) |
0.269 (0.867) |
| 12p gain | 7 (15%) | 40 |
0.216 (0.867) |
0.354 (0.92) |
1 (1.00) |
0.286 (0.867) |
0.0565 (0.561) |
1 (1.00) |
0.35 (0.917) |
| 12q gain | 9 (19%) | 38 |
0.0546 (0.561) |
0.57 (1.00) |
0.486 (1.00) |
0.609 (1.00) |
0.0207 (0.516) |
0.777 (1.00) |
0.205 (0.867) |
| 13q gain | 5 (11%) | 42 |
0.647 (1.00) |
0.342 (0.917) |
1 (1.00) |
1 (1.00) |
1 (1.00) |
0.431 (0.993) |
0.59 (1.00) |
| 16p gain | 7 (15%) | 40 |
0.281 (0.867) |
0.754 (1.00) |
1 (1.00) |
1 (1.00) |
0.274 (0.867) |
1 (1.00) |
1 (1.00) |
| 16q gain | 7 (15%) | 40 |
0.0742 (0.659) |
0.964 (1.00) |
0.684 (1.00) |
1 (1.00) |
0.276 (0.867) |
1 (1.00) |
1 (1.00) |
| 17q gain | 3 (6%) | 44 |
0.196 (0.867) |
0.24 (0.867) |
0.242 (0.867) |
1 (1.00) |
0.39 (0.971) |
0.114 (0.668) |
0.56 (1.00) |
| 18p gain | 13 (28%) | 34 |
0.0492 (0.561) |
0.295 (0.88) |
0.746 (1.00) |
0.385 (0.971) |
0.806 (1.00) |
0.114 (0.668) |
0.713 (1.00) |
| 18q gain | 14 (30%) | 33 |
0.19 (0.867) |
0.522 (1.00) |
1 (1.00) |
0.658 (1.00) |
0.803 (1.00) |
0.0593 (0.561) |
0.731 (1.00) |
| 19p gain | 3 (6%) | 44 |
0.445 (0.993) |
0.0895 (0.668) |
1 (1.00) |
0.398 (0.971) |
1 (1.00) |
1 (1.00) |
0.156 (0.776) |
| 19q gain | 3 (6%) | 44 |
0.445 (0.993) |
0.0895 (0.668) |
1 (1.00) |
0.398 (0.971) |
1 (1.00) |
1 (1.00) |
0.156 (0.776) |
| 20p gain | 5 (11%) | 42 |
0.745 (1.00) |
0.641 (1.00) |
0.0561 (0.561) |
1 (1.00) |
0.57 (1.00) |
0.434 (0.993) |
0.59 (1.00) |
| 20q gain | 4 (9%) | 43 |
0.56 (1.00) |
0.26 (0.867) |
0.117 (0.668) |
1 (1.00) |
0.488 (1.00) |
0.67 (1.00) |
0.266 (0.867) |
| 21q gain | 10 (21%) | 37 |
0.977 (1.00) |
0.317 (0.915) |
0.475 (1.00) |
0.636 (1.00) |
0.288 (0.867) |
0.777 (1.00) |
0.7 (1.00) |
| xp gain | 6 (13%) | 41 |
0.926 (1.00) |
0.655 (1.00) |
1 (1.00) |
1 (1.00) |
0.0179 (0.516) |
1 (1.00) |
0.0301 (0.561) |
| xq gain | 6 (13%) | 41 |
0.87 (1.00) |
0.632 (1.00) |
1 (1.00) |
0.57 (1.00) |
0.0187 (0.516) |
0.706 (1.00) |
0.164 (0.776) |
| 1p loss | 3 (6%) | 44 |
0.445 (0.993) |
0.384 (0.971) |
0.579 (1.00) |
1 (1.00) |
0.199 (0.867) |
1 (1.00) |
1 (1.00) |
| 3p loss | 5 (11%) | 42 |
0.402 (0.971) |
0.262 (0.867) |
1 (1.00) |
1 (1.00) |
0.153 (0.776) |
0.23 (0.867) |
0.0971 (0.668) |
| 3q loss | 4 (9%) | 43 |
0.445 (0.993) |
0.35 (0.917) |
1 (1.00) |
0.496 (1.00) |
0.0994 (0.668) |
0.219 (0.867) |
0.0459 (0.561) |
| 4p loss | 3 (6%) | 44 |
0.502 (1.00) |
0.349 (0.917) |
0.242 (0.867) |
1 (1.00) |
1 (1.00) |
1 (1.00) |
1 (1.00) |
| 4q loss | 4 (9%) | 43 |
0.49 (1.00) |
0.469 (1.00) |
0.117 (0.668) |
1 (1.00) |
1 (1.00) |
0.667 (1.00) |
1 (1.00) |
| 6q loss | 7 (15%) | 40 |
0.851 (1.00) |
0.811 (1.00) |
1 (1.00) |
0.573 (1.00) |
0.0873 (0.668) |
0.338 (0.917) |
0.0595 (0.561) |
| 8p loss | 8 (17%) | 39 |
0.929 (1.00) |
0.799 (1.00) |
0.269 (0.867) |
1 (1.00) |
0.34 (0.917) |
0.744 (1.00) |
0.403 (0.971) |
| 8q loss | 4 (9%) | 43 |
0.402 (0.971) |
0.153 (0.776) |
0.617 (1.00) |
1 (1.00) |
0.266 (0.867) |
1 (1.00) |
0.266 (0.867) |
| 13q loss | 3 (6%) | 44 |
0.527 (1.00) |
0.879 (1.00) |
1 (1.00) |
0.398 (0.971) |
0.0536 (0.561) |
0.316 (0.915) |
0.156 (0.776) |
| 15q loss | 7 (15%) | 40 |
0.22 (0.867) |
0.765 (1.00) |
0.112 (0.668) |
0.573 (1.00) |
1 (1.00) |
1 (1.00) |
0.659 (1.00) |
| 16q loss | 4 (9%) | 43 |
0.435 (0.993) |
0.909 (1.00) |
0.117 (0.668) |
1 (1.00) |
1 (1.00) |
0.343 (0.917) |
0.56 (1.00) |
| 17p loss | 9 (19%) | 38 |
0.186 (0.867) |
0.871 (1.00) |
0.16 (0.776) |
0.609 (1.00) |
0.0211 (0.516) |
0.552 (1.00) |
0.0048 (0.291) |
| 17q loss | 4 (9%) | 43 |
0.47 (1.00) |
0.504 (1.00) |
1 (1.00) |
0.496 (1.00) |
0.00412 (0.291) |
0.217 (0.867) |
0.00278 (0.291) |
| 18p loss | 5 (11%) | 42 |
0.602 (1.00) |
0.863 (1.00) |
0.644 (1.00) |
1 (1.00) |
0.332 (0.917) |
1 (1.00) |
0.59 (1.00) |
| 18q loss | 4 (9%) | 43 |
0.418 (0.993) |
0.0327 (0.561) |
0.617 (1.00) |
1 (1.00) |
0.264 (0.867) |
0.215 (0.867) |
0.0459 (0.561) |
| 22q loss | 3 (6%) | 44 |
0.502 (1.00) |
0.794 (1.00) |
0.242 (0.867) |
1 (1.00) |
1 (1.00) |
0.113 (0.668) |
0.56 (1.00) |
| xp loss | 5 (11%) | 42 |
0.0498 (0.561) |
0.468 (1.00) |
0.0561 (0.561) |
1 (1.00) |
1 (1.00) |
0.434 (0.993) |
1 (1.00) |
| xq loss | 4 (9%) | 43 |
0.0045 (0.291) |
1 (1.00) |
0.117 (0.668) |
1 (1.00) |
1 (1.00) |
0.347 (0.917) |
0.56 (1.00) |
P value = 0.00056 (Fisher's exact test), Q value = 0.2
Table S1. Gene #14: '9p gain' versus Clinical Feature #5: 'HISTOLOGICAL_TYPE'
| nPatients | DIFFUSE LARGE B-CELL LYMPHOMA (DLBCL) NOS (ANY ANATOMIC SITE NODAL OR EXTRANODAL) | PRIMARY DLBCL OF THE CNS | PRIMARY MEDIASTINAL (THYMIC) DLBCL |
|---|---|---|---|
| ALL | 40 | 3 | 4 |
| 9P GAIN MUTATED | 3 | 0 | 4 |
| 9P GAIN WILD-TYPE | 37 | 3 | 0 |
Figure S1. Get High-res Image Gene #14: '9p gain' versus Clinical Feature #5: 'HISTOLOGICAL_TYPE'
-
Copy number data file = broad_values_by_arm.txt from GISTIC pipeline
-
Processed Copy number data file = /xchip/cga/gdac-prod/tcga-gdac/jobResults/GDAC_Correlate_Genomic_Events_Preprocess/DLBC-TP/19780780/transformed.cor.cli.txt
-
Clinical data file = /xchip/cga/gdac-prod/tcga-gdac/jobResults/Append_Data/DLBC-TP/19775131/DLBC-TP.merged_data.txt
-
Number of patients = 47
-
Number of significantly arm-level cnvs = 52
-
Number of selected clinical features = 7
-
Exclude regions that fewer than K tumors have mutations, K = 3
For survival clinical features, the Kaplan-Meier survival curves of tumors with and without gene mutations were plotted and the statistical significance P values were estimated by logrank test (Bland and Altman 2004) using the 'survdiff' function in R
For binary or multi-class clinical features (nominal or ordinal), two-tailed Fisher's exact tests (Fisher 1922) were used to estimate the P values using the 'fisher.test' function in R
For multiple hypothesis correction, Q value is the False Discovery Rate (FDR) analogue of the P value (Benjamini and Hochberg 1995), defined as the minimum FDR at which the test may be called significant. We used the 'Benjamini and Hochberg' method of 'p.adjust' function in R to convert P values into Q values.
In addition to the links below, the full results of the analysis summarized in this report can also be downloaded programmatically using firehose_get, or interactively from either the Broad GDAC website or TCGA Data Coordination Center Portal.