This pipeline computes the correlation between significant arm-level copy number variations (cnvs) and selected clinical features.
Testing the association between copy number variation 82 arm-level events and 8 clinical features across 571 patients, 15 significant findings detected with Q value < 0.25.
-
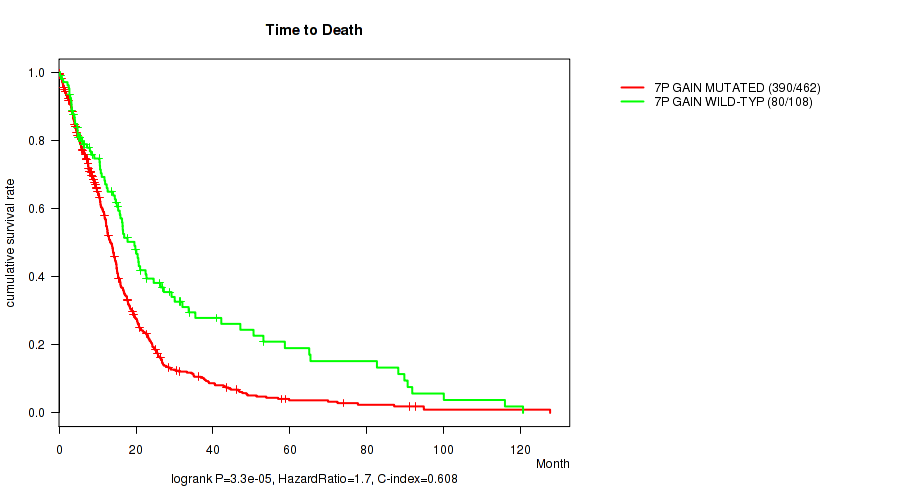
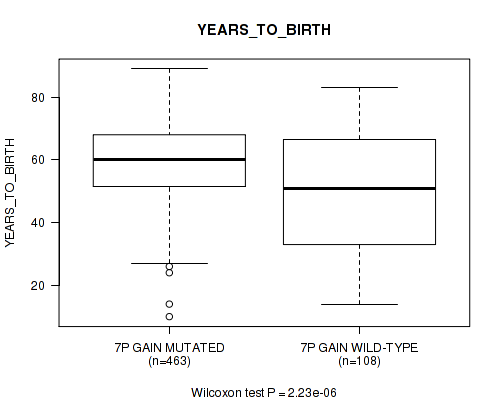
7p gain cnv correlated to 'Time to Death' and 'YEARS_TO_BIRTH'.
-
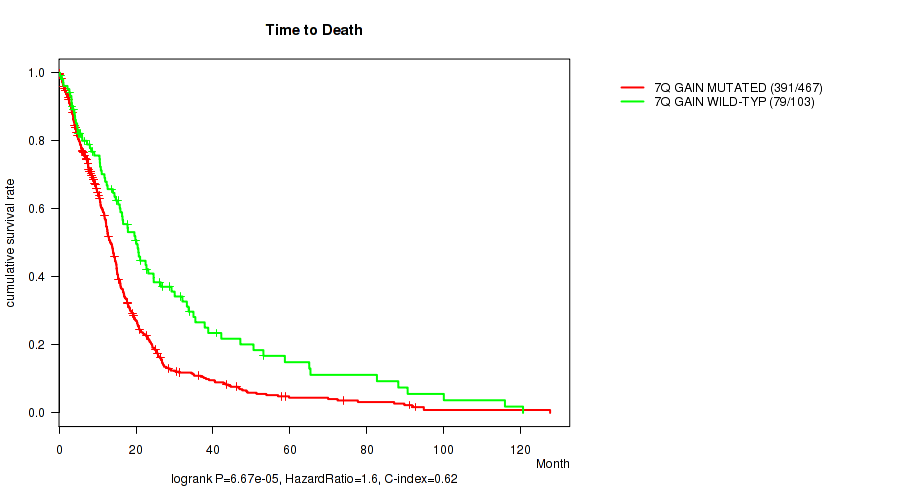
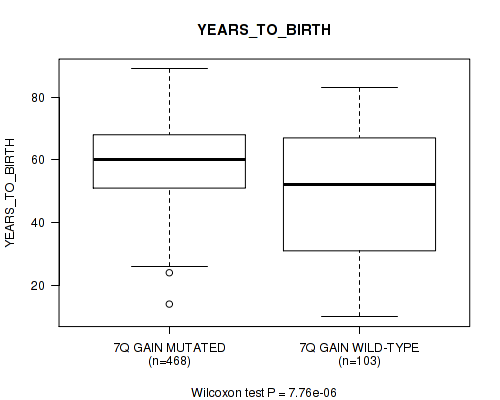
7q gain cnv correlated to 'Time to Death' and 'YEARS_TO_BIRTH'.
-
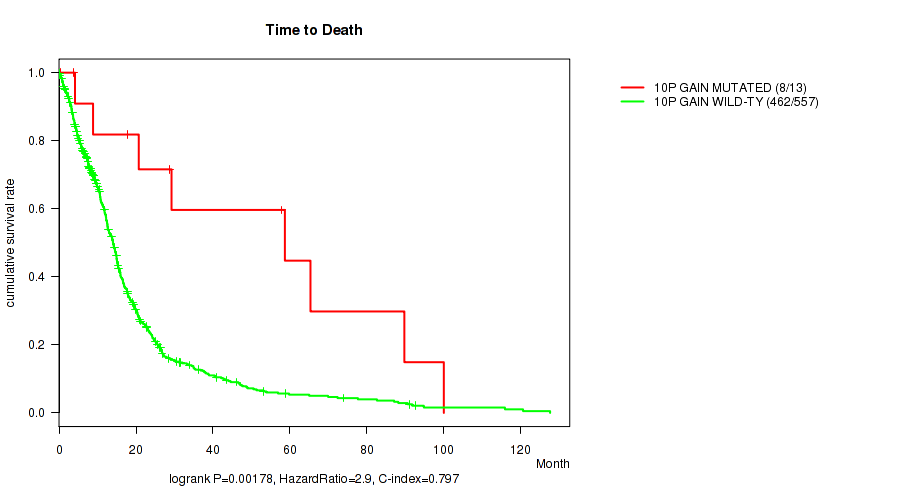
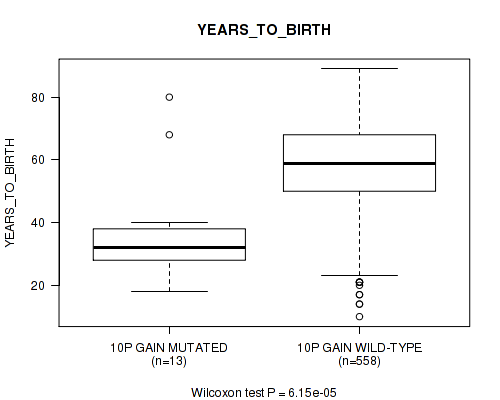
10p gain cnv correlated to 'Time to Death' and 'YEARS_TO_BIRTH'.
-
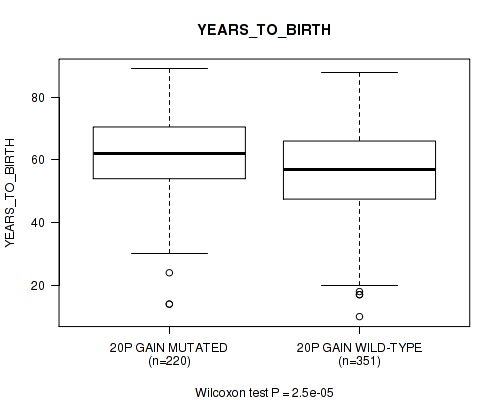
20p gain cnv correlated to 'YEARS_TO_BIRTH'.
-
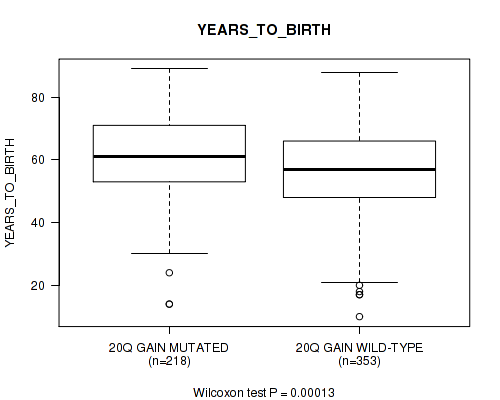
20q gain cnv correlated to 'YEARS_TO_BIRTH'.
-
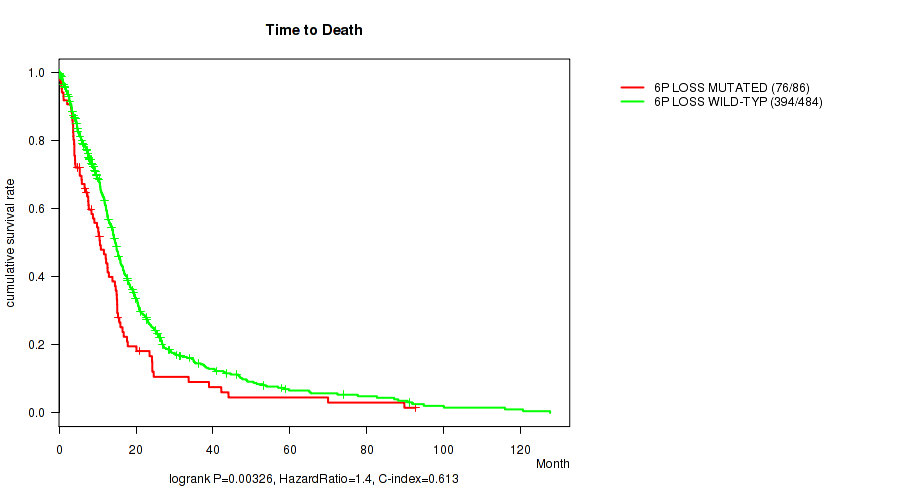
6p loss cnv correlated to 'Time to Death'.
-
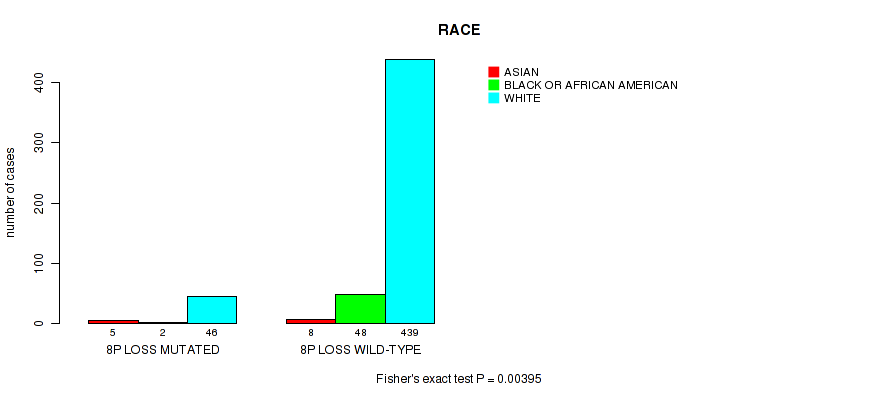
8p loss cnv correlated to 'RACE'.
-
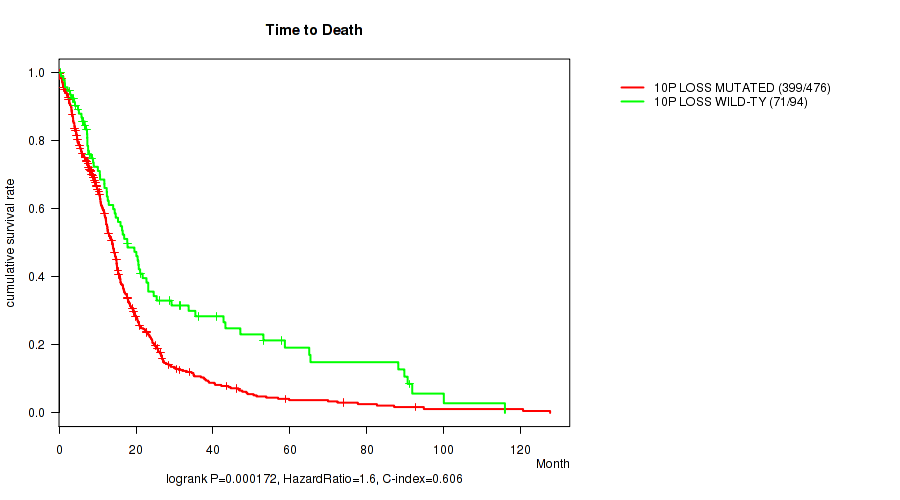
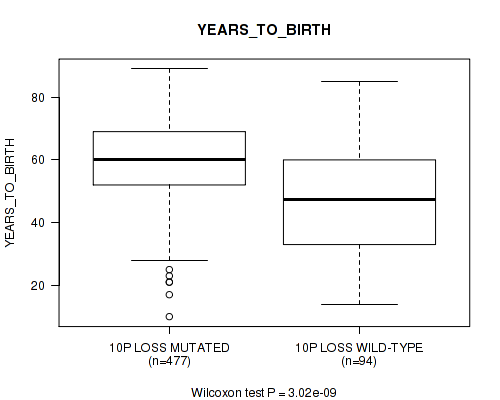
10p loss cnv correlated to 'Time to Death', 'YEARS_TO_BIRTH', and 'HISTOLOGICAL_TYPE'.
-
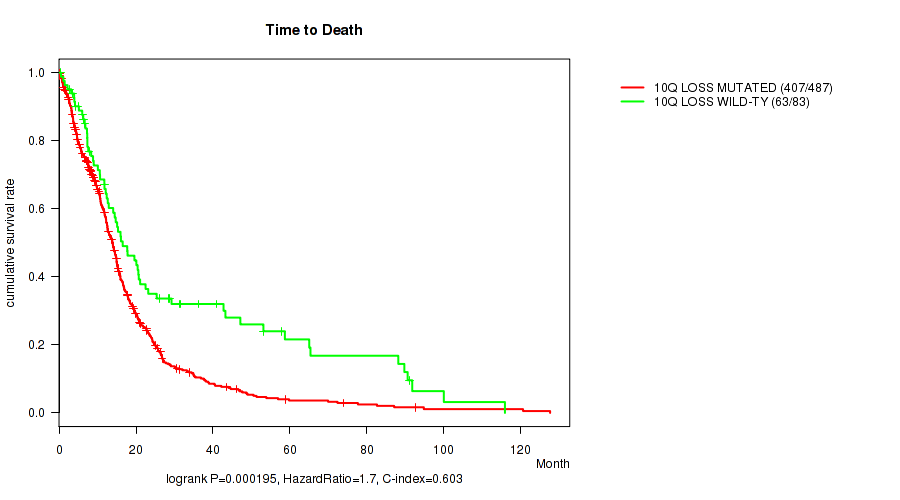
10q loss cnv correlated to 'Time to Death' and 'YEARS_TO_BIRTH'.
Table 1. Get Full Table Overview of the association between significant copy number variation of 82 arm-level events and 8 clinical features. Shown in the table are P values (Q values). Thresholded by Q value < 0.25, 15 significant findings detected.
|
Clinical Features |
Time to Death |
YEARS TO BIRTH |
GENDER |
RADIATION THERAPY |
KARNOFSKY PERFORMANCE SCORE |
HISTOLOGICAL TYPE |
RACE | ETHNICITY | ||
| nCNV (%) | nWild-Type | logrank test | Wilcoxon-test | Fisher's exact test | Fisher's exact test | Wilcoxon-test | Fisher's exact test | Fisher's exact test | Fisher's exact test | |
| 10p loss | 477 (84%) | 94 |
0.000172 (0.0113) |
3.02e-09 (1.98e-06) |
0.167 (1.00) |
0.612 (1.00) |
0.08 (0.874) |
0.00512 (0.224) |
0.108 (0.948) |
0.132 (0.982) |
| 7p gain | 463 (81%) | 108 |
3.3e-05 (0.00361) |
2.23e-06 (0.000487) |
0.743 (1.00) |
0.207 (1.00) |
0.935 (1.00) |
0.0338 (0.813) |
0.0539 (0.824) |
0.27 (1.00) |
| 7q gain | 468 (82%) | 103 |
6.67e-05 (0.00547) |
7.76e-06 (0.00127) |
0.222 (1.00) |
0.518 (1.00) |
0.882 (1.00) |
0.0362 (0.813) |
0.0368 (0.813) |
0.249 (1.00) |
| 10p gain | 13 (2%) | 558 |
0.00178 (0.0975) |
6.15e-05 (0.00547) |
0.0403 (0.824) |
0.375 (1.00) |
0.348 (1.00) |
0.286 (1.00) |
0.0131 (0.469) |
0.281 (1.00) |
| 10q loss | 488 (85%) | 83 |
0.000195 (0.0116) |
1.32e-07 (4.34e-05) |
0.466 (1.00) |
1 (1.00) |
0.00985 (0.404) |
0.0596 (0.855) |
0.0777 (0.874) |
0.0906 (0.902) |
| 20p gain | 220 (39%) | 351 |
0.298 (1.00) |
2.5e-05 (0.00328) |
0.333 (1.00) |
0.898 (1.00) |
0.86 (1.00) |
0.465 (1.00) |
0.0372 (0.813) |
1 (1.00) |
| 20q gain | 218 (38%) | 353 |
0.516 (1.00) |
0.00013 (0.00951) |
0.29 (1.00) |
1 (1.00) |
0.781 (1.00) |
0.478 (1.00) |
0.0535 (0.824) |
1 (1.00) |
| 6p loss | 86 (15%) | 485 |
0.00326 (0.164) |
0.383 (1.00) |
0.811 (1.00) |
0.165 (1.00) |
0.692 (1.00) |
0.602 (1.00) |
0.256 (1.00) |
0.702 (1.00) |
| 8p loss | 58 (10%) | 513 |
0.725 (1.00) |
0.173 (1.00) |
0.156 (1.00) |
0.68 (1.00) |
0.42 (1.00) |
0.569 (1.00) |
0.00395 (0.185) |
0.619 (1.00) |
| 1p gain | 81 (14%) | 490 |
0.315 (1.00) |
0.464 (1.00) |
0.624 (1.00) |
0.156 (1.00) |
0.119 (0.951) |
0.0279 (0.733) |
0.852 (1.00) |
0.664 (1.00) |
| 1q gain | 88 (15%) | 483 |
0.848 (1.00) |
0.611 (1.00) |
0.288 (1.00) |
0.228 (1.00) |
0.274 (1.00) |
0.199 (1.00) |
0.774 (1.00) |
0.687 (1.00) |
| 2p gain | 37 (6%) | 534 |
0.545 (1.00) |
0.781 (1.00) |
0.121 (0.954) |
0.452 (1.00) |
0.351 (1.00) |
1 (1.00) |
0.339 (1.00) |
1 (1.00) |
| 2q gain | 36 (6%) | 535 |
0.37 (1.00) |
0.309 (1.00) |
0.378 (1.00) |
0.796 (1.00) |
0.236 (1.00) |
1 (1.00) |
0.325 (1.00) |
1 (1.00) |
| 3p gain | 57 (10%) | 514 |
0.773 (1.00) |
0.0444 (0.824) |
0.319 (1.00) |
0.538 (1.00) |
0.606 (1.00) |
0.611 (1.00) |
0.927 (1.00) |
1 (1.00) |
| 3q gain | 63 (11%) | 508 |
0.635 (1.00) |
0.111 (0.948) |
0.412 (1.00) |
0.843 (1.00) |
0.551 (1.00) |
0.47 (1.00) |
0.932 (1.00) |
1 (1.00) |
| 4p gain | 36 (6%) | 535 |
0.752 (1.00) |
0.495 (1.00) |
0.86 (1.00) |
0.796 (1.00) |
0.0472 (0.824) |
1 (1.00) |
0.571 (1.00) |
0.575 (1.00) |
| 4q gain | 33 (6%) | 538 |
0.948 (1.00) |
0.567 (1.00) |
0.467 (1.00) |
1 (1.00) |
0.044 (0.824) |
1 (1.00) |
0.532 (1.00) |
1 (1.00) |
| 5p gain | 49 (9%) | 522 |
0.697 (1.00) |
0.688 (1.00) |
0.169 (1.00) |
0.376 (1.00) |
0.206 (1.00) |
0.0664 (0.855) |
1 (1.00) |
0.298 (1.00) |
| 5q gain | 41 (7%) | 530 |
0.361 (1.00) |
0.524 (1.00) |
0.134 (0.982) |
0.213 (1.00) |
0.719 (1.00) |
0.113 (0.948) |
0.913 (1.00) |
0.612 (1.00) |
| 6p gain | 24 (4%) | 547 |
0.255 (1.00) |
0.498 (1.00) |
0.671 (1.00) |
1 (1.00) |
0.787 (1.00) |
1 (1.00) |
0.483 (1.00) |
1 (1.00) |
| 6q gain | 23 (4%) | 548 |
0.195 (1.00) |
0.25 (1.00) |
1 (1.00) |
1 (1.00) |
0.751 (1.00) |
1 (1.00) |
0.562 (1.00) |
1 (1.00) |
| 8p gain | 52 (9%) | 519 |
0.879 (1.00) |
0.814 (1.00) |
0.657 (1.00) |
0.376 (1.00) |
0.74 (1.00) |
0.635 (1.00) |
0.32 (1.00) |
1 (1.00) |
| 8q gain | 59 (10%) | 512 |
0.473 (1.00) |
0.373 (1.00) |
0.482 (1.00) |
0.675 (1.00) |
0.844 (1.00) |
0.49 (1.00) |
0.762 (1.00) |
1 (1.00) |
| 9p gain | 47 (8%) | 524 |
0.335 (1.00) |
0.642 (1.00) |
0.163 (1.00) |
0.356 (1.00) |
0.898 (1.00) |
0.145 (0.991) |
0.297 (1.00) |
0.24 (1.00) |
| 9q gain | 70 (12%) | 501 |
0.926 (1.00) |
0.926 (1.00) |
0.153 (1.00) |
0.131 (0.982) |
0.791 (1.00) |
0.333 (1.00) |
0.297 (1.00) |
0.644 (1.00) |
| 10q gain | 3 (1%) | 568 |
0.341 (1.00) |
0.661 (1.00) |
0.564 (1.00) |
1 (1.00) |
1 (1.00) |
1 (1.00) |
0.0726 (0.855) |
|
| 11p gain | 17 (3%) | 554 |
0.619 (1.00) |
0.96 (1.00) |
0.806 (1.00) |
0.715 (1.00) |
0.431 (1.00) |
1 (1.00) |
0.598 (1.00) |
0.335 (1.00) |
| 11q gain | 14 (2%) | 557 |
0.275 (1.00) |
0.117 (0.951) |
0.267 (1.00) |
0.705 (1.00) |
0.169 (1.00) |
0.463 (1.00) |
1 (1.00) |
0.299 (1.00) |
| 12p gain | 59 (10%) | 512 |
0.608 (1.00) |
0.31 (1.00) |
0.482 (1.00) |
0.0637 (0.855) |
0.438 (1.00) |
0.791 (1.00) |
0.928 (1.00) |
1 (1.00) |
| 12q gain | 48 (8%) | 523 |
0.999 (1.00) |
0.617 (1.00) |
0.218 (1.00) |
0.18 (1.00) |
0.659 (1.00) |
0.56 (1.00) |
0.142 (0.991) |
0.612 (1.00) |
| 13q gain | 10 (2%) | 561 |
0.434 (1.00) |
0.0108 (0.419) |
0.201 (1.00) |
0.295 (1.00) |
0.0846 (0.89) |
0.571 (1.00) |
1 (1.00) |
1 (1.00) |
| 14q gain | 22 (4%) | 549 |
0.269 (1.00) |
0.058 (0.855) |
0.513 (1.00) |
0.743 (1.00) |
0.494 (1.00) |
0.0771 (0.874) |
0.829 (1.00) |
1 (1.00) |
| 15q gain | 24 (4%) | 547 |
0.272 (1.00) |
0.878 (1.00) |
0.526 (1.00) |
0.118 (0.951) |
0.108 (0.948) |
0.828 (1.00) |
0.841 (1.00) |
1 (1.00) |
| 16p gain | 38 (7%) | 533 |
0.0464 (0.824) |
0.858 (1.00) |
0.305 (1.00) |
0.456 (1.00) |
0.99 (1.00) |
1 (1.00) |
0.462 (1.00) |
1 (1.00) |
| 16q gain | 37 (6%) | 534 |
0.178 (1.00) |
0.88 (1.00) |
0.606 (1.00) |
0.455 (1.00) |
0.881 (1.00) |
1 (1.00) |
0.453 (1.00) |
1 (1.00) |
| 17p gain | 48 (8%) | 523 |
0.101 (0.948) |
0.0254 (0.718) |
0.281 (1.00) |
0.177 (1.00) |
0.574 (1.00) |
0.46 (1.00) |
0.411 (1.00) |
1 (1.00) |
| 17q gain | 59 (10%) | 512 |
0.0212 (0.661) |
0.0136 (0.469) |
0.576 (1.00) |
0.153 (1.00) |
0.659 (1.00) |
0.67 (1.00) |
0.534 (1.00) |
0.375 (1.00) |
| 18p gain | 57 (10%) | 514 |
0.55 (1.00) |
0.392 (1.00) |
0.669 (1.00) |
0.835 (1.00) |
0.477 (1.00) |
0.07 (0.855) |
0.205 (1.00) |
0.346 (1.00) |
| 18q gain | 57 (10%) | 514 |
0.672 (1.00) |
0.228 (1.00) |
0.2 (1.00) |
0.835 (1.00) |
0.376 (1.00) |
0.0707 (0.855) |
0.399 (1.00) |
1 (1.00) |
| 19p gain | 223 (39%) | 348 |
0.51 (1.00) |
0.947 (1.00) |
0.793 (1.00) |
0.0956 (0.936) |
0.872 (1.00) |
0.54 (1.00) |
0.497 (1.00) |
0.552 (1.00) |
| 19q gain | 197 (35%) | 374 |
0.641 (1.00) |
0.473 (1.00) |
0.653 (1.00) |
0.6 (1.00) |
0.732 (1.00) |
0.751 (1.00) |
0.262 (1.00) |
0.357 (1.00) |
| 21q gain | 63 (11%) | 508 |
0.71 (1.00) |
0.0818 (0.88) |
0.892 (1.00) |
0.842 (1.00) |
0.506 (1.00) |
0.178 (1.00) |
0.109 (0.948) |
0.376 (1.00) |
| 22q gain | 34 (6%) | 537 |
0.225 (1.00) |
0.571 (1.00) |
1 (1.00) |
0.603 (1.00) |
0.346 (1.00) |
0.328 (1.00) |
0.794 (1.00) |
0.148 (1.00) |
| xp gain | 15 (3%) | 556 |
0.999 (1.00) |
0.439 (1.00) |
0.597 (1.00) |
0.705 (1.00) |
0.546 (1.00) |
0.721 (1.00) |
0.723 (1.00) |
0.203 (1.00) |
| xq gain | 16 (3%) | 555 |
0.427 (1.00) |
0.559 (1.00) |
1 (1.00) |
0.705 (1.00) |
0.71 (1.00) |
0.373 (1.00) |
0.737 (1.00) |
0.243 (1.00) |
| 1p loss | 15 (3%) | 556 |
0.432 (1.00) |
0.0513 (0.824) |
0.425 (1.00) |
0.44 (1.00) |
0.348 (1.00) |
0.491 (1.00) |
0.737 (1.00) |
1 (1.00) |
| 1q loss | 14 (2%) | 557 |
0.311 (1.00) |
0.0263 (0.718) |
1 (1.00) |
0.418 (1.00) |
0.036 (0.813) |
1 (1.00) |
0.714 (1.00) |
1 (1.00) |
| 2p loss | 32 (6%) | 539 |
0.683 (1.00) |
0.0792 (0.874) |
0.135 (0.982) |
0.054 (0.824) |
0.863 (1.00) |
0.758 (1.00) |
0.89 (1.00) |
1 (1.00) |
| 2q loss | 32 (6%) | 539 |
0.872 (1.00) |
0.106 (0.948) |
0.263 (1.00) |
0.054 (0.824) |
0.595 (1.00) |
0.352 (1.00) |
0.89 (1.00) |
1 (1.00) |
| 3p loss | 40 (7%) | 531 |
0.505 (1.00) |
0.0693 (0.855) |
1 (1.00) |
0.0457 (0.824) |
0.981 (1.00) |
0.574 (1.00) |
0.744 (1.00) |
0.203 (1.00) |
| 3q loss | 34 (6%) | 537 |
0.969 (1.00) |
0.656 (1.00) |
0.589 (1.00) |
0.413 (1.00) |
0.629 (1.00) |
0.878 (1.00) |
0.805 (1.00) |
0.514 (1.00) |
| 4p loss | 54 (9%) | 517 |
0.227 (1.00) |
0.764 (1.00) |
0.144 (0.991) |
0.395 (1.00) |
0.42 (1.00) |
0.463 (1.00) |
0.644 (1.00) |
0.308 (1.00) |
| 4q loss | 55 (10%) | 516 |
0.0207 (0.661) |
0.135 (0.982) |
0.772 (1.00) |
0.403 (1.00) |
0.583 (1.00) |
0.921 (1.00) |
0.477 (1.00) |
0.288 (1.00) |
| 5p loss | 43 (8%) | 528 |
0.108 (0.948) |
0.551 (1.00) |
0.872 (1.00) |
0.34 (1.00) |
0.529 (1.00) |
0.898 (1.00) |
0.0901 (0.902) |
0.212 (1.00) |
| 5q loss | 44 (8%) | 527 |
0.116 (0.951) |
0.602 (1.00) |
1 (1.00) |
0.34 (1.00) |
0.705 (1.00) |
0.534 (1.00) |
0.315 (1.00) |
0.0519 (0.824) |
| 6q loss | 124 (22%) | 447 |
0.23 (1.00) |
0.756 (1.00) |
0.299 (1.00) |
0.45 (1.00) |
0.856 (1.00) |
0.741 (1.00) |
0.238 (1.00) |
0.476 (1.00) |
| 7p loss | 8 (1%) | 563 |
0.471 (1.00) |
0.0526 (0.824) |
1 (1.00) |
1 (1.00) |
0.735 (1.00) |
1 (1.00) |
0.625 (1.00) |
1 (1.00) |
| 7q loss | 6 (1%) | 565 |
0.628 (1.00) |
0.0239 (0.711) |
1 (1.00) |
0.583 (1.00) |
0.309 (1.00) |
1 (1.00) |
0.521 (1.00) |
1 (1.00) |
| 8q loss | 42 (7%) | 529 |
0.0607 (0.855) |
0.21 (1.00) |
0.416 (1.00) |
0.635 (1.00) |
0.276 (1.00) |
0.894 (1.00) |
0.286 (1.00) |
1 (1.00) |
| 9p loss | 199 (35%) | 372 |
0.359 (1.00) |
0.574 (1.00) |
0.787 (1.00) |
0.602 (1.00) |
0.724 (1.00) |
0.881 (1.00) |
0.46 (1.00) |
0.064 (0.855) |
| 9q loss | 94 (16%) | 477 |
0.786 (1.00) |
0.705 (1.00) |
0.489 (1.00) |
0.396 (1.00) |
0.53 (1.00) |
0.164 (1.00) |
0.133 (0.982) |
0.236 (1.00) |
| 11p loss | 99 (17%) | 472 |
0.273 (1.00) |
0.82 (1.00) |
0.0705 (0.855) |
1 (1.00) |
0.429 (1.00) |
0.443 (1.00) |
0.698 (1.00) |
0.7 (1.00) |
| 11q loss | 93 (16%) | 478 |
0.853 (1.00) |
0.357 (1.00) |
0.419 (1.00) |
0.614 (1.00) |
0.661 (1.00) |
0.806 (1.00) |
0.953 (1.00) |
0.229 (1.00) |
| 12p loss | 58 (10%) | 513 |
0.781 (1.00) |
0.612 (1.00) |
0.48 (1.00) |
0.532 (1.00) |
0.97 (1.00) |
0.616 (1.00) |
0.194 (1.00) |
1 (1.00) |
| 12q loss | 57 (10%) | 514 |
0.955 (1.00) |
0.658 (1.00) |
0.568 (1.00) |
0.287 (1.00) |
0.935 (1.00) |
0.368 (1.00) |
0.206 (1.00) |
0.327 (1.00) |
| 13q loss | 185 (32%) | 386 |
0.824 (1.00) |
0.805 (1.00) |
0.927 (1.00) |
0.0855 (0.89) |
0.917 (1.00) |
0.608 (1.00) |
0.537 (1.00) |
0.759 (1.00) |
| 14q loss | 145 (25%) | 426 |
0.852 (1.00) |
0.797 (1.00) |
0.326 (1.00) |
0.199 (1.00) |
0.961 (1.00) |
0.498 (1.00) |
0.31 (1.00) |
0.31 (1.00) |
| 15q loss | 106 (19%) | 465 |
0.864 (1.00) |
0.073 (0.855) |
0.659 (1.00) |
0.333 (1.00) |
0.766 (1.00) |
0.508 (1.00) |
1 (1.00) |
0.257 (1.00) |
| 16p loss | 63 (11%) | 508 |
0.0987 (0.948) |
0.309 (1.00) |
0.683 (1.00) |
0.415 (1.00) |
0.433 (1.00) |
0.152 (1.00) |
1 (1.00) |
1 (1.00) |
| 16q loss | 82 (14%) | 489 |
0.166 (1.00) |
0.834 (1.00) |
1 (1.00) |
0.368 (1.00) |
0.627 (1.00) |
0.377 (1.00) |
0.684 (1.00) |
0.695 (1.00) |
| 17p loss | 63 (11%) | 508 |
0.748 (1.00) |
0.493 (1.00) |
0.412 (1.00) |
0.557 (1.00) |
0.99 (1.00) |
0.93 (1.00) |
1 (1.00) |
1 (1.00) |
| 17q loss | 40 (7%) | 531 |
0.705 (1.00) |
0.468 (1.00) |
0.502 (1.00) |
0.809 (1.00) |
0.79 (1.00) |
0.893 (1.00) |
0.61 (1.00) |
0.586 (1.00) |
| 18p loss | 71 (12%) | 500 |
0.221 (1.00) |
0.859 (1.00) |
0.517 (1.00) |
0.182 (1.00) |
0.345 (1.00) |
0.468 (1.00) |
0.233 (1.00) |
0.65 (1.00) |
| 18q loss | 62 (11%) | 509 |
0.536 (1.00) |
0.789 (1.00) |
0.784 (1.00) |
0.0688 (0.855) |
0.306 (1.00) |
0.68 (1.00) |
0.192 (1.00) |
0.145 (0.991) |
| 19p loss | 27 (5%) | 544 |
0.706 (1.00) |
0.949 (1.00) |
0.843 (1.00) |
0.344 (1.00) |
0.509 (1.00) |
0.852 (1.00) |
1 (1.00) |
1 (1.00) |
| 19q loss | 35 (6%) | 536 |
0.779 (1.00) |
0.879 (1.00) |
1 (1.00) |
0.413 (1.00) |
0.803 (1.00) |
0.397 (1.00) |
0.712 (1.00) |
1 (1.00) |
| 20p loss | 19 (3%) | 552 |
0.892 (1.00) |
0.426 (1.00) |
0.239 (1.00) |
0.732 (1.00) |
0.661 (1.00) |
1 (1.00) |
0.2 (1.00) |
0.352 (1.00) |
| 20q loss | 17 (3%) | 554 |
0.767 (1.00) |
0.767 (1.00) |
0.313 (1.00) |
0.491 (1.00) |
0.719 (1.00) |
0.764 (1.00) |
0.378 (1.00) |
1 (1.00) |
| 21q loss | 42 (7%) | 529 |
0.518 (1.00) |
0.667 (1.00) |
0.416 (1.00) |
1 (1.00) |
0.109 (0.948) |
1 (1.00) |
1 (1.00) |
0.24 (1.00) |
| 22q loss | 181 (32%) | 390 |
0.926 (1.00) |
0.0908 (0.902) |
0.927 (1.00) |
0.504 (1.00) |
0.384 (1.00) |
0.848 (1.00) |
0.654 (1.00) |
1 (1.00) |
| xp loss | 114 (20%) | 457 |
0.139 (0.991) |
0.596 (1.00) |
0.391 (1.00) |
0.275 (1.00) |
0.56 (1.00) |
0.873 (1.00) |
0.112 (0.948) |
0.715 (1.00) |
| xq loss | 106 (19%) | 465 |
0.122 (0.954) |
0.63 (1.00) |
0.378 (1.00) |
0.196 (1.00) |
0.511 (1.00) |
0.714 (1.00) |
0.139 (0.991) |
0.473 (1.00) |
P value = 3.3e-05 (logrank test), Q value = 0.0036
Table S1. Gene #13: '7p gain' versus Clinical Feature #1: 'Time to Death'
| nPatients | nDeath | Duration Range (Median), Month | |
|---|---|---|---|
| ALL | 570 | 470 | 0.1 - 127.6 (12.2) |
| 7P GAIN MUTATED | 462 | 390 | 0.1 - 127.6 (11.8) |
| 7P GAIN WILD-TYPE | 108 | 80 | 0.2 - 120.6 (15.2) |
Figure S1. Get High-res Image Gene #13: '7p gain' versus Clinical Feature #1: 'Time to Death'
P value = 2.23e-06 (Wilcoxon-test), Q value = 0.00049
Table S2. Gene #13: '7p gain' versus Clinical Feature #2: 'YEARS_TO_BIRTH'
| nPatients | Mean (Std.Dev) | |
|---|---|---|
| ALL | 571 | 57.7 (14.5) |
| 7P GAIN MUTATED | 463 | 59.6 (12.4) |
| 7P GAIN WILD-TYPE | 108 | 49.6 (19.4) |
Figure S2. Get High-res Image Gene #13: '7p gain' versus Clinical Feature #2: 'YEARS_TO_BIRTH'
P value = 6.67e-05 (logrank test), Q value = 0.0055
Table S3. Gene #14: '7q gain' versus Clinical Feature #1: 'Time to Death'
| nPatients | nDeath | Duration Range (Median), Month | |
|---|---|---|---|
| ALL | 570 | 470 | 0.1 - 127.6 (12.2) |
| 7Q GAIN MUTATED | 467 | 391 | 0.1 - 127.6 (11.8) |
| 7Q GAIN WILD-TYPE | 103 | 79 | 0.2 - 120.6 (15.9) |
Figure S3. Get High-res Image Gene #14: '7q gain' versus Clinical Feature #1: 'Time to Death'
P value = 7.76e-06 (Wilcoxon-test), Q value = 0.0013
Table S4. Gene #14: '7q gain' versus Clinical Feature #2: 'YEARS_TO_BIRTH'
| nPatients | Mean (Std.Dev) | |
|---|---|---|
| ALL | 571 | 57.7 (14.5) |
| 7Q GAIN MUTATED | 468 | 59.6 (12.2) |
| 7Q GAIN WILD-TYPE | 103 | 49.4 (20.1) |
Figure S4. Get High-res Image Gene #14: '7q gain' versus Clinical Feature #2: 'YEARS_TO_BIRTH'
P value = 0.00178 (logrank test), Q value = 0.097
Table S5. Gene #19: '10p gain' versus Clinical Feature #1: 'Time to Death'
| nPatients | nDeath | Duration Range (Median), Month | |
|---|---|---|---|
| ALL | 570 | 470 | 0.1 - 127.6 (12.2) |
| 10P GAIN MUTATED | 13 | 8 | 0.4 - 100.0 (28.7) |
| 10P GAIN WILD-TYPE | 557 | 462 | 0.1 - 127.6 (12.1) |
Figure S5. Get High-res Image Gene #19: '10p gain' versus Clinical Feature #1: 'Time to Death'
P value = 6.15e-05 (Wilcoxon-test), Q value = 0.0055
Table S6. Gene #19: '10p gain' versus Clinical Feature #2: 'YEARS_TO_BIRTH'
| nPatients | Mean (Std.Dev) | |
|---|---|---|
| ALL | 571 | 57.7 (14.5) |
| 10P GAIN MUTATED | 13 | 37.5 (17.4) |
| 10P GAIN WILD-TYPE | 558 | 58.2 (14.1) |
Figure S6. Get High-res Image Gene #19: '10p gain' versus Clinical Feature #2: 'YEARS_TO_BIRTH'
P value = 2.5e-05 (Wilcoxon-test), Q value = 0.0033
Table S7. Gene #36: '20p gain' versus Clinical Feature #2: 'YEARS_TO_BIRTH'
| nPatients | Mean (Std.Dev) | |
|---|---|---|
| ALL | 571 | 57.7 (14.5) |
| 20P GAIN MUTATED | 220 | 61.0 (13.0) |
| 20P GAIN WILD-TYPE | 351 | 55.7 (15.0) |
Figure S7. Get High-res Image Gene #36: '20p gain' versus Clinical Feature #2: 'YEARS_TO_BIRTH'
P value = 0.00013 (Wilcoxon-test), Q value = 0.0095
Table S8. Gene #37: '20q gain' versus Clinical Feature #2: 'YEARS_TO_BIRTH'
| nPatients | Mean (Std.Dev) | |
|---|---|---|
| ALL | 571 | 57.7 (14.5) |
| 20Q GAIN MUTATED | 218 | 60.8 (13.3) |
| 20Q GAIN WILD-TYPE | 353 | 55.9 (14.9) |
Figure S8. Get High-res Image Gene #37: '20q gain' versus Clinical Feature #2: 'YEARS_TO_BIRTH'
P value = 0.00326 (logrank test), Q value = 0.16
Table S9. Gene #52: '6p loss' versus Clinical Feature #1: 'Time to Death'
| nPatients | nDeath | Duration Range (Median), Month | |
|---|---|---|---|
| ALL | 570 | 470 | 0.1 - 127.6 (12.2) |
| 6P LOSS MUTATED | 86 | 76 | 0.2 - 92.7 (9.5) |
| 6P LOSS WILD-TYPE | 484 | 394 | 0.1 - 127.6 (12.6) |
Figure S9. Get High-res Image Gene #52: '6p loss' versus Clinical Feature #1: 'Time to Death'
P value = 0.00395 (Fisher's exact test), Q value = 0.19
Table S10. Gene #56: '8p loss' versus Clinical Feature #7: 'RACE'
| nPatients | ASIAN | BLACK OR AFRICAN AMERICAN | WHITE |
|---|---|---|---|
| ALL | 13 | 50 | 485 |
| 8P LOSS MUTATED | 5 | 2 | 46 |
| 8P LOSS WILD-TYPE | 8 | 48 | 439 |
Figure S10. Get High-res Image Gene #56: '8p loss' versus Clinical Feature #7: 'RACE'
P value = 0.000172 (logrank test), Q value = 0.011
Table S11. Gene #60: '10p loss' versus Clinical Feature #1: 'Time to Death'
| nPatients | nDeath | Duration Range (Median), Month | |
|---|---|---|---|
| ALL | 570 | 470 | 0.1 - 127.6 (12.2) |
| 10P LOSS MUTATED | 476 | 399 | 0.1 - 127.6 (11.9) |
| 10P LOSS WILD-TYPE | 94 | 71 | 0.4 - 115.9 (14.6) |
Figure S11. Get High-res Image Gene #60: '10p loss' versus Clinical Feature #1: 'Time to Death'
P value = 3.02e-09 (Wilcoxon-test), Q value = 2e-06
Table S12. Gene #60: '10p loss' versus Clinical Feature #2: 'YEARS_TO_BIRTH'
| nPatients | Mean (Std.Dev) | |
|---|---|---|
| ALL | 571 | 57.7 (14.5) |
| 10P LOSS MUTATED | 477 | 59.7 (12.6) |
| 10P LOSS WILD-TYPE | 94 | 47.9 (18.8) |
Figure S12. Get High-res Image Gene #60: '10p loss' versus Clinical Feature #2: 'YEARS_TO_BIRTH'
P value = 0.00512 (Fisher's exact test), Q value = 0.22
Table S13. Gene #60: '10p loss' versus Clinical Feature #6: 'HISTOLOGICAL_TYPE'
| nPatients | GLIOBLASTOMA MULTIFORME (GBM) | TREATED PRIMARY GBM | UNTREATED PRIMARY (DE NOVO) GBM |
|---|---|---|---|
| ALL | 28 | 18 | 525 |
| 10P LOSS MUTATED | 22 | 10 | 445 |
| 10P LOSS WILD-TYPE | 6 | 8 | 80 |
Figure S13. Get High-res Image Gene #60: '10p loss' versus Clinical Feature #6: 'HISTOLOGICAL_TYPE'

P value = 0.000195 (logrank test), Q value = 0.012
Table S14. Gene #61: '10q loss' versus Clinical Feature #1: 'Time to Death'
| nPatients | nDeath | Duration Range (Median), Month | |
|---|---|---|---|
| ALL | 570 | 470 | 0.1 - 127.6 (12.2) |
| 10Q LOSS MUTATED | 487 | 407 | 0.1 - 127.6 (11.9) |
| 10Q LOSS WILD-TYPE | 83 | 63 | 0.4 - 115.9 (14.5) |
Figure S14. Get High-res Image Gene #61: '10q loss' versus Clinical Feature #1: 'Time to Death'
P value = 1.32e-07 (Wilcoxon-test), Q value = 4.3e-05
Table S15. Gene #61: '10q loss' versus Clinical Feature #2: 'YEARS_TO_BIRTH'
| nPatients | Mean (Std.Dev) | |
|---|---|---|
| ALL | 571 | 57.7 (14.5) |
| 10Q LOSS MUTATED | 488 | 59.3 (13.0) |
| 10Q LOSS WILD-TYPE | 83 | 48.4 (18.6) |
Figure S15. Get High-res Image Gene #61: '10q loss' versus Clinical Feature #2: 'YEARS_TO_BIRTH'

-
Copy number data file = broad_values_by_arm.txt from GISTIC pipeline
-
Processed Copy number data file = /xchip/cga/gdac-prod/tcga-gdac/jobResults/GDAC_Correlate_Genomic_Events_Preprocess/GBM-TP/19791352/transformed.cor.cli.txt
-
Clinical data file = /xchip/cga/gdac-prod/tcga-gdac/jobResults/Append_Data/GBM-TP/19775175/GBM-TP.merged_data.txt
-
Number of patients = 571
-
Number of significantly arm-level cnvs = 82
-
Number of selected clinical features = 8
-
Exclude regions that fewer than K tumors have mutations, K = 3
For survival clinical features, the Kaplan-Meier survival curves of tumors with and without gene mutations were plotted and the statistical significance P values were estimated by logrank test (Bland and Altman 2004) using the 'survdiff' function in R
For binary or multi-class clinical features (nominal or ordinal), two-tailed Fisher's exact tests (Fisher 1922) were used to estimate the P values using the 'fisher.test' function in R
For multiple hypothesis correction, Q value is the False Discovery Rate (FDR) analogue of the P value (Benjamini and Hochberg 1995), defined as the minimum FDR at which the test may be called significant. We used the 'Benjamini and Hochberg' method of 'p.adjust' function in R to convert P values into Q values.
In addition to the links below, the full results of the analysis summarized in this report can also be downloaded programmatically using firehose_get, or interactively from either the Broad GDAC website or TCGA Data Coordination Center Portal.