This pipeline computes the correlation between significant copy number variation (cnv focal) genes and selected clinical features.
Testing the association between copy number variation 71 focal events and 8 clinical features across 571 patients, 31 significant findings detected with Q value < 0.25.
-
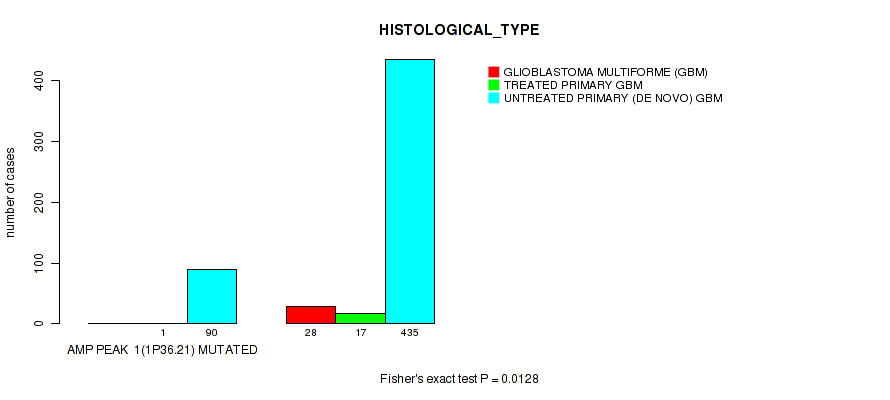
amp_1p36.21 cnv correlated to 'HISTOLOGICAL_TYPE'.
-
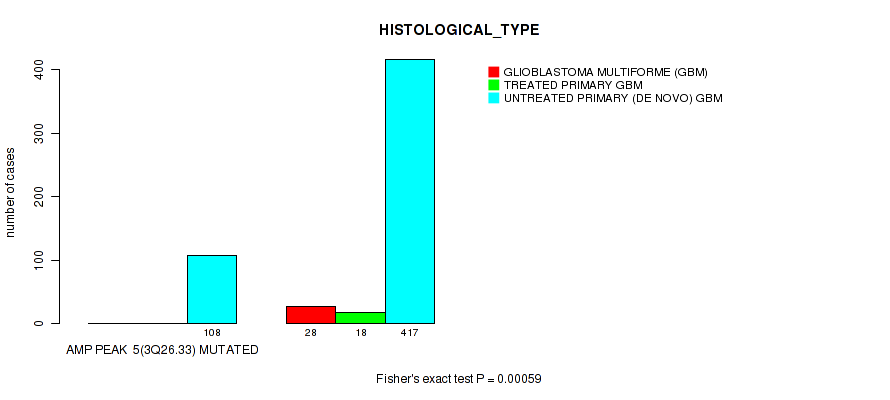
amp_3q26.33 cnv correlated to 'HISTOLOGICAL_TYPE'.
-
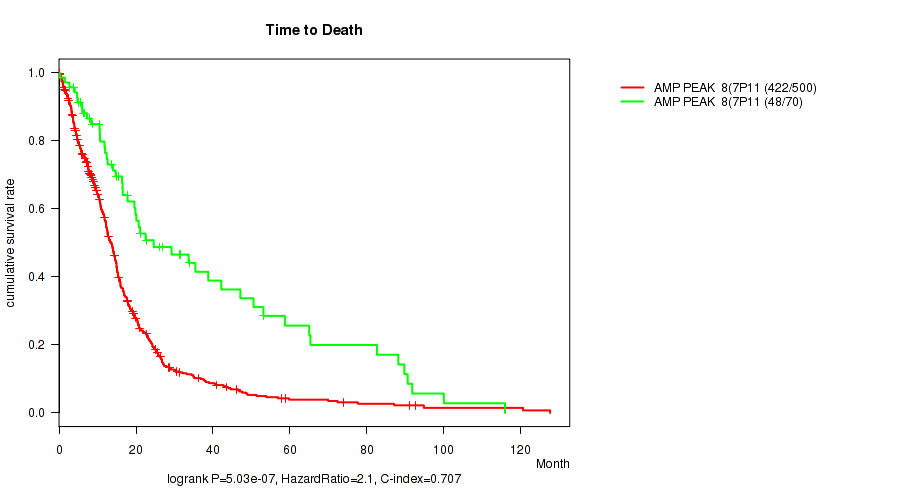
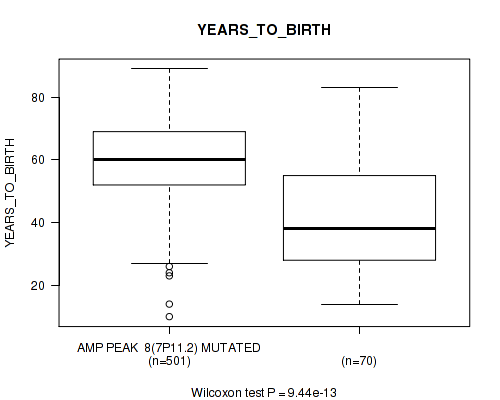
amp_7p11.2 cnv correlated to 'Time to Death' and 'YEARS_TO_BIRTH'.
-
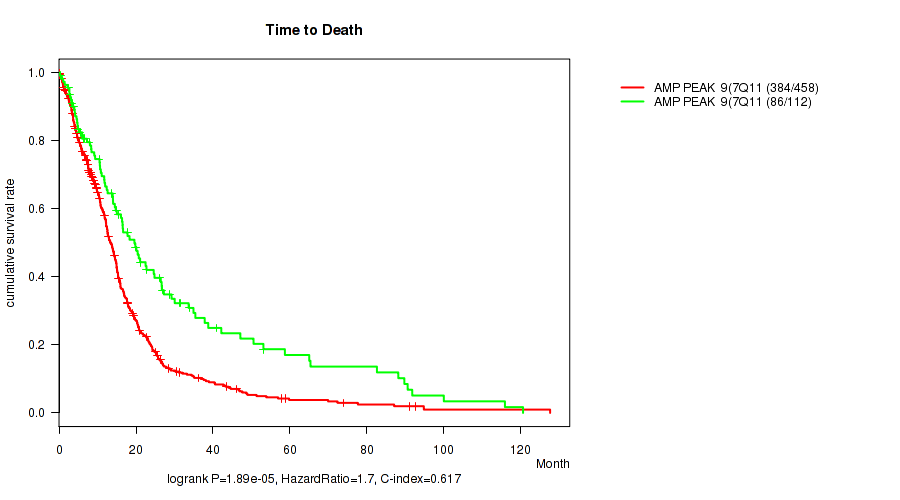
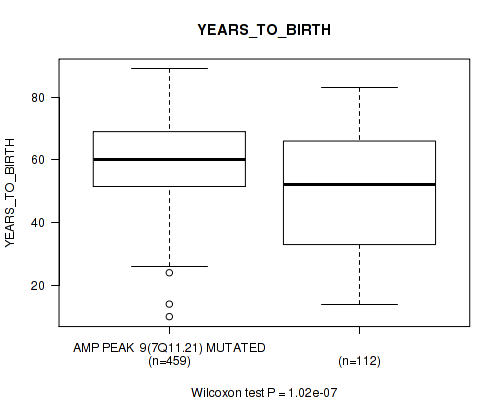
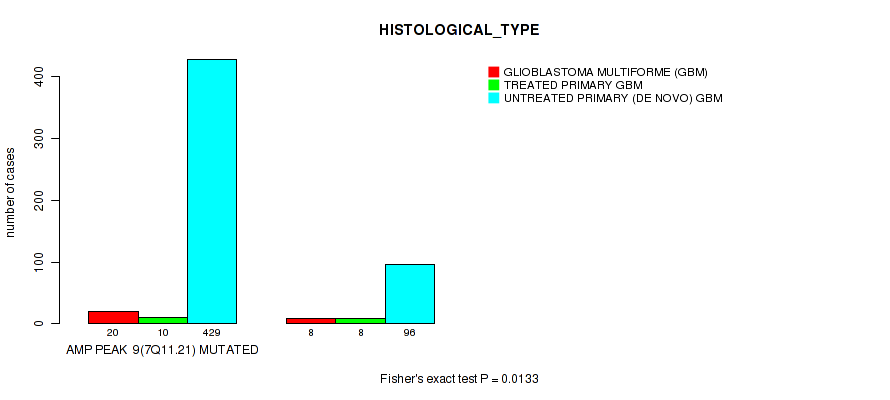
amp_7q11.21 cnv correlated to 'Time to Death', 'YEARS_TO_BIRTH', and 'HISTOLOGICAL_TYPE'.
-
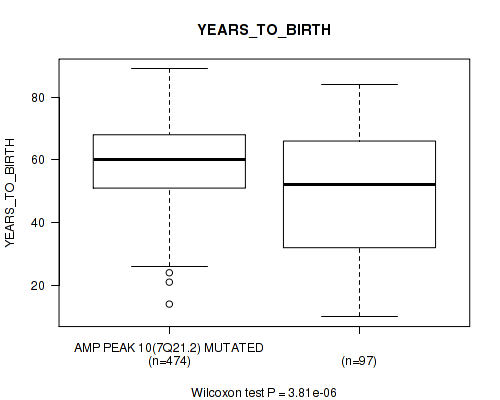
amp_7q21.2 cnv correlated to 'Time to Death' and 'YEARS_TO_BIRTH'.
-
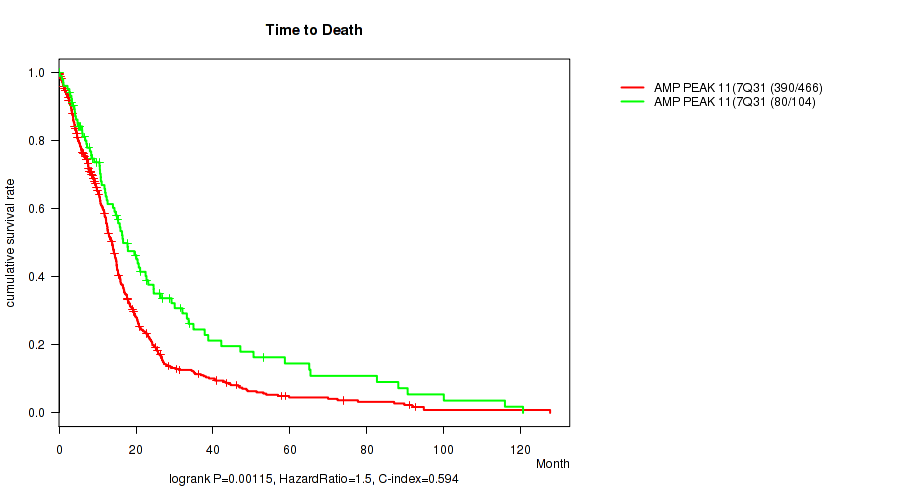
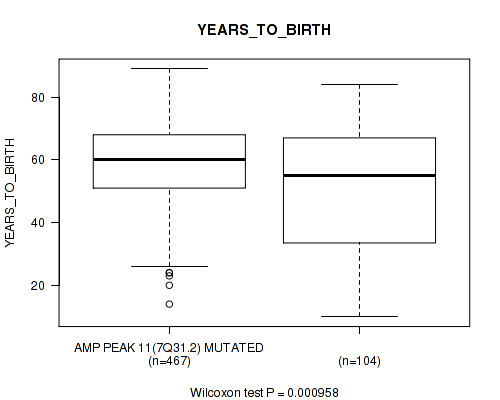
amp_7q31.2 cnv correlated to 'Time to Death' and 'YEARS_TO_BIRTH'.
-
amp_14q32.33 cnv correlated to 'YEARS_TO_BIRTH'.
-
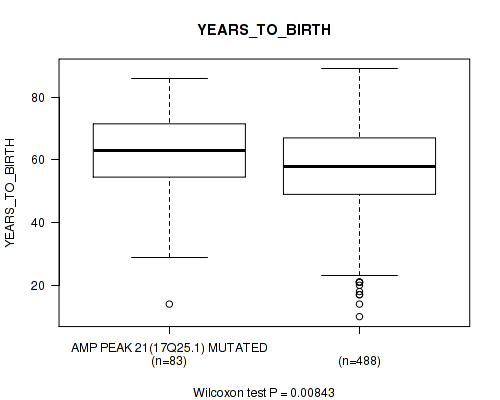
amp_17q25.1 cnv correlated to 'YEARS_TO_BIRTH'.
-
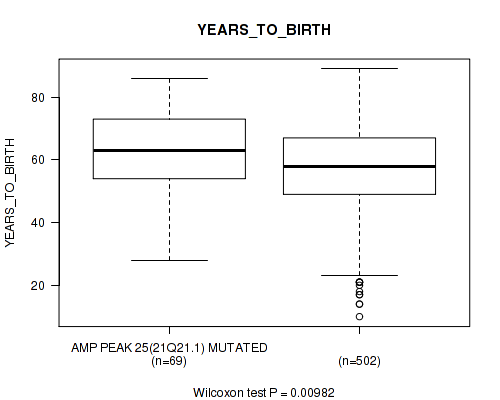
amp_21q21.1 cnv correlated to 'YEARS_TO_BIRTH'.
-
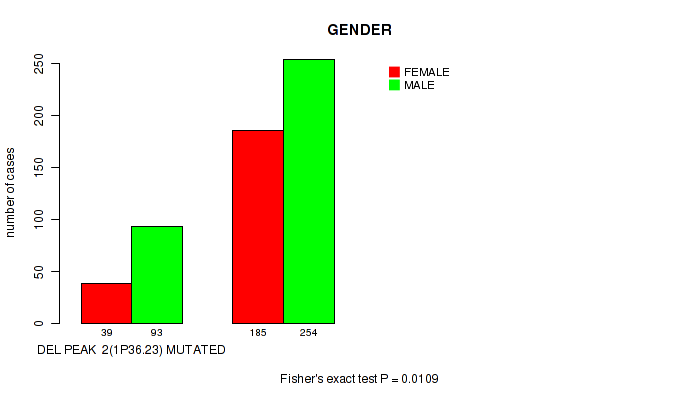
del_1p36.23 cnv correlated to 'GENDER'.
-
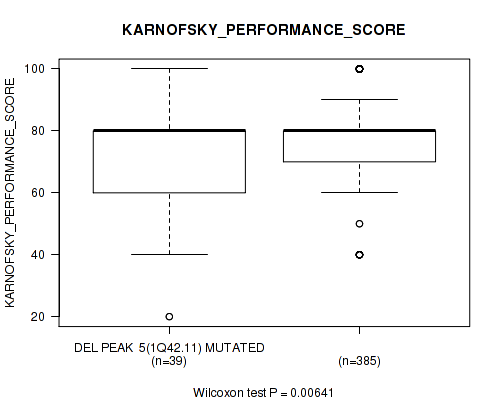
del_1q42.11 cnv correlated to 'KARNOFSKY_PERFORMANCE_SCORE'.
-
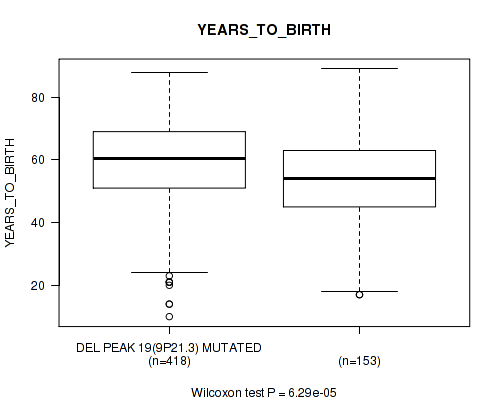
del_9p21.3 cnv correlated to 'YEARS_TO_BIRTH'.
-
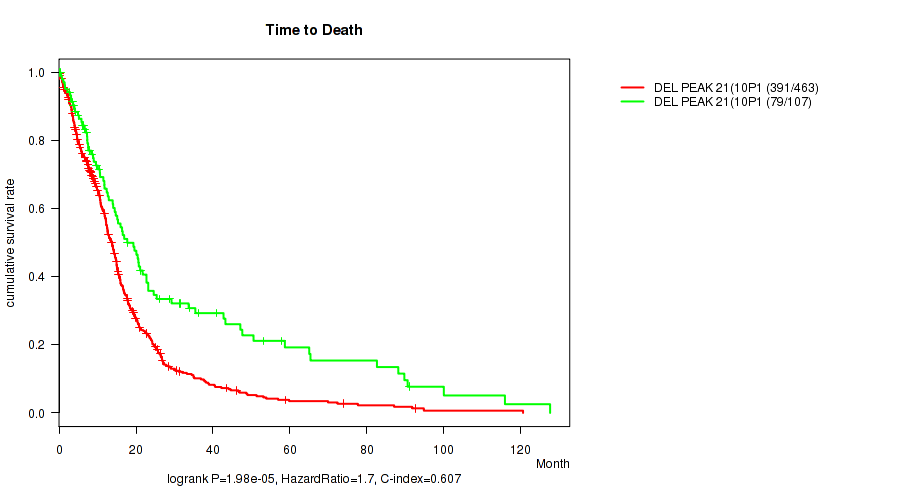
del_10p15.3 cnv correlated to 'Time to Death' and 'YEARS_TO_BIRTH'.
-
del_10p13 cnv correlated to 'Time to Death', 'YEARS_TO_BIRTH', and 'HISTOLOGICAL_TYPE'.
-
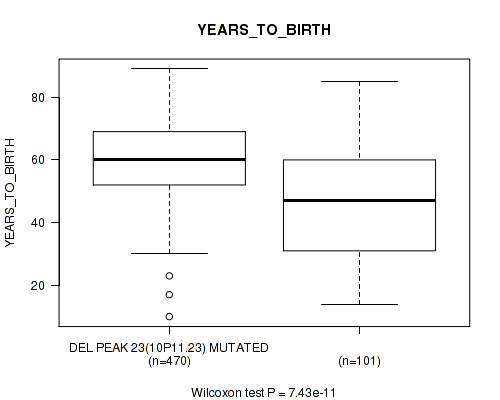
del_10p11.23 cnv correlated to 'Time to Death', 'YEARS_TO_BIRTH', and 'HISTOLOGICAL_TYPE'.
-
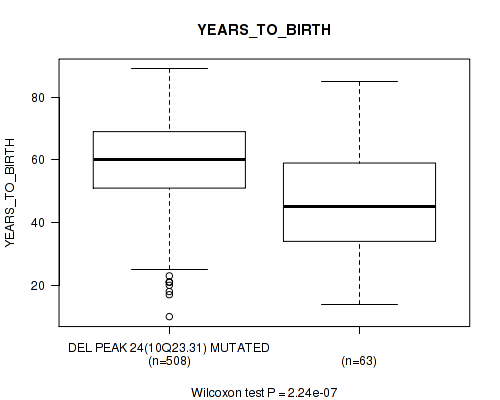
del_10q23.31 cnv correlated to 'Time to Death' and 'YEARS_TO_BIRTH'.
-
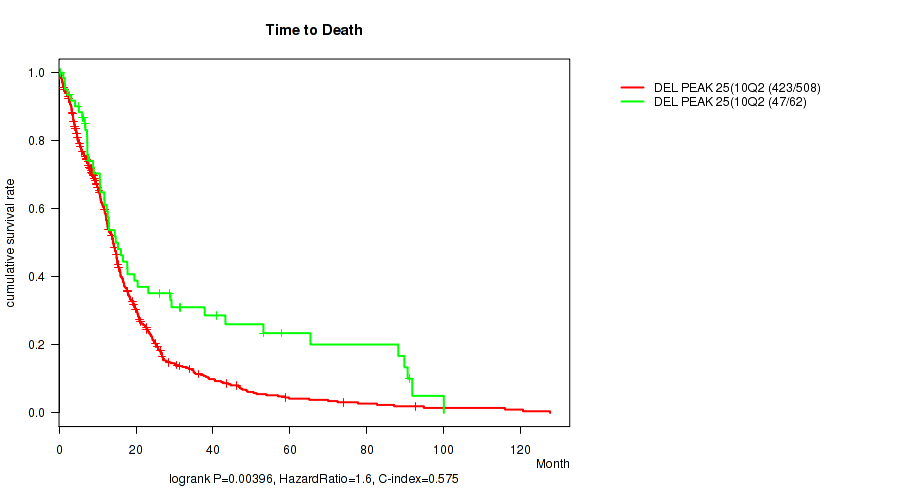
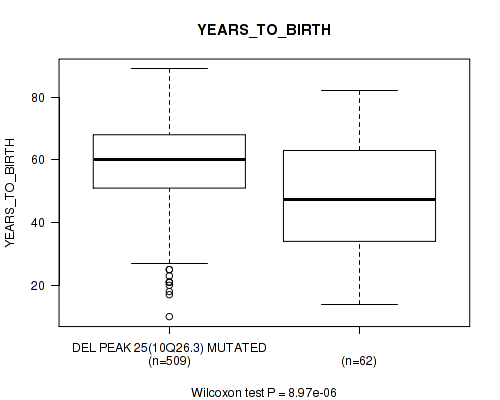
del_10q26.3 cnv correlated to 'Time to Death' and 'YEARS_TO_BIRTH'.
-
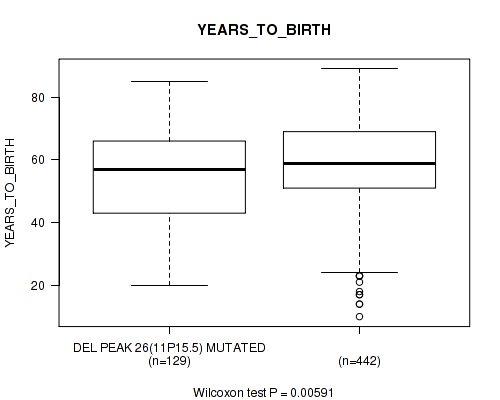
del_11p15.5 cnv correlated to 'YEARS_TO_BIRTH'.
-
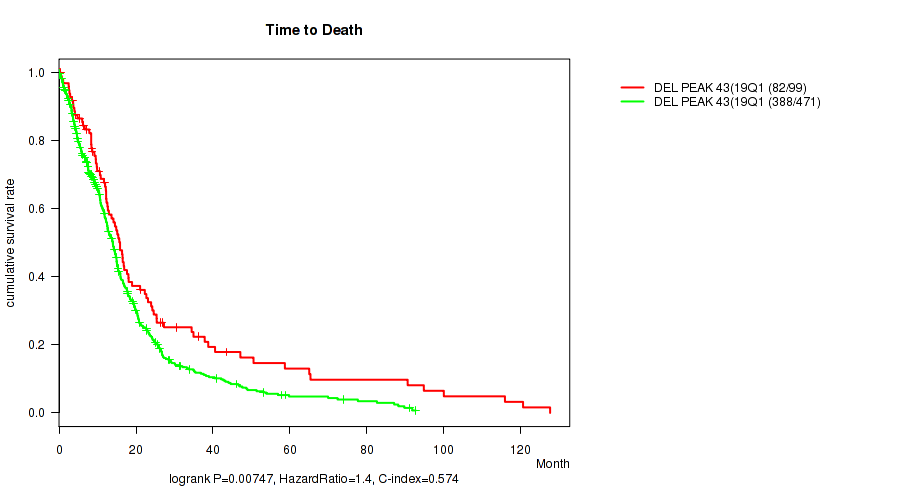
del_19q13.41 cnv correlated to 'Time to Death'.
Table 1. Get Full Table Overview of the association between significant copy number variation of 71 focal events and 8 clinical features. Shown in the table are P values (Q values). Thresholded by Q value < 0.25, 31 significant findings detected.
|
Clinical Features |
Time to Death |
YEARS TO BIRTH |
GENDER |
RADIATION THERAPY |
KARNOFSKY PERFORMANCE SCORE |
HISTOLOGICAL TYPE |
RACE | ETHNICITY | ||
| nCNV (%) | nWild-Type | logrank test | Wilcoxon-test | Fisher's exact test | Fisher's exact test | Wilcoxon-test | Fisher's exact test | Fisher's exact test | Fisher's exact test | |
| amp 7q11 21 | 459 (80%) | 112 |
1.89e-05 (0.000865) |
1.02e-07 (1.16e-05) |
0.197 (0.787) |
0.276 (0.821) |
0.458 (0.938) |
0.0133 (0.243) |
0.254 (0.807) |
0.14 (0.719) |
| del 10p13 | 465 (81%) | 106 |
6.55e-06 (0.000372) |
2.25e-08 (3.2e-06) |
0.0469 (0.503) |
1 (1.00) |
0.472 (0.94) |
0.0117 (0.229) |
0.127 (0.689) |
0.27 (0.82) |
| del 10p11 23 | 470 (82%) | 101 |
5.07e-07 (3.6e-05) |
7.43e-11 (2.11e-08) |
0.116 (0.689) |
0.87 (1.00) |
0.0447 (0.488) |
0.00431 (0.117) |
0.158 (0.772) |
0.251 (0.807) |
| amp 7p11 2 | 501 (88%) | 70 |
5.03e-07 (3.6e-05) |
9.44e-13 (5.36e-10) |
0.242 (0.807) |
0.179 (0.787) |
0.0187 (0.312) |
0.0652 (0.607) |
0.462 (0.94) |
0.0602 (0.57) |
| amp 7q21 2 | 474 (83%) | 97 |
8.47e-05 (0.00301) |
3.81e-06 (0.00024) |
0.424 (0.931) |
0.505 (0.947) |
0.363 (0.897) |
0.133 (0.709) |
0.0349 (0.441) |
0.0441 (0.488) |
| amp 7q31 2 | 467 (82%) | 104 |
0.00115 (0.0343) |
0.000958 (0.0302) |
0.268 (0.82) |
0.194 (0.787) |
0.924 (1.00) |
0.29 (0.827) |
0.0481 (0.506) |
0.0549 (0.553) |
| del 10p15 3 | 464 (81%) | 107 |
1.98e-05 (0.000865) |
1.07e-08 (2.02e-06) |
0.126 (0.689) |
0.633 (0.977) |
0.244 (0.807) |
0.0294 (0.422) |
0.196 (0.787) |
0.273 (0.821) |
| del 10q23 31 | 508 (89%) | 63 |
7.48e-05 (0.00283) |
2.24e-07 (2.12e-05) |
0.785 (1.00) |
0.842 (1.00) |
0.0821 (0.644) |
0.0248 (0.38) |
0.334 (0.881) |
0.635 (0.977) |
| del 10q26 3 | 509 (89%) | 62 |
0.00396 (0.113) |
8.97e-06 (0.000463) |
0.68 (0.997) |
0.312 (0.851) |
0.0575 (0.558) |
0.0915 (0.675) |
0.0821 (0.644) |
0.632 (0.977) |
| amp 1p36 21 | 91 (16%) | 480 |
0.058 (0.558) |
0.271 (0.82) |
0.483 (0.94) |
0.125 (0.689) |
0.134 (0.709) |
0.0128 (0.242) |
0.0794 (0.644) |
0.399 (0.915) |
| amp 3q26 33 | 108 (19%) | 463 |
0.19 (0.787) |
0.032 (0.435) |
0.662 (0.992) |
0.0818 (0.644) |
0.558 (0.95) |
0.00059 (0.0197) |
0.166 (0.785) |
0.701 (0.997) |
| amp 14q32 33 | 36 (6%) | 535 |
0.366 (0.897) |
0.00533 (0.138) |
0.487 (0.94) |
1 (1.00) |
0.246 (0.807) |
0.467 (0.94) |
0.729 (1.00) |
1 (1.00) |
| amp 17q25 1 | 83 (15%) | 488 |
0.0297 (0.422) |
0.00843 (0.184) |
0.184 (0.787) |
0.156 (0.772) |
0.519 (0.947) |
0.789 (1.00) |
0.181 (0.787) |
0.691 (0.997) |
| amp 21q21 1 | 69 (12%) | 502 |
0.931 (1.00) |
0.00982 (0.207) |
1 (1.00) |
0.701 (0.997) |
0.821 (1.00) |
0.209 (0.787) |
0.0854 (0.647) |
0.378 (0.897) |
| del 1p36 23 | 132 (23%) | 439 |
0.871 (1.00) |
0.127 (0.689) |
0.0109 (0.221) |
0.883 (1.00) |
0.203 (0.787) |
0.479 (0.94) |
0.164 (0.784) |
0.312 (0.851) |
| del 1q42 11 | 49 (9%) | 522 |
0.122 (0.689) |
0.29 (0.827) |
1 (1.00) |
0.376 (0.897) |
0.00641 (0.152) |
0.907 (1.00) |
0.363 (0.897) |
0.25 (0.807) |
| del 9p21 3 | 418 (73%) | 153 |
0.0335 (0.435) |
6.29e-05 (0.00255) |
0.498 (0.94) |
0.205 (0.787) |
0.0337 (0.435) |
0.689 (0.997) |
0.49 (0.94) |
0.744 (1.00) |
| del 11p15 5 | 129 (23%) | 442 |
0.0533 (0.55) |
0.00591 (0.146) |
0.219 (0.79) |
1 (1.00) |
0.0697 (0.61) |
0.496 (0.94) |
1 (1.00) |
1 (1.00) |
| del 19q13 41 | 99 (17%) | 472 |
0.00747 (0.17) |
0.475 (0.94) |
0.821 (1.00) |
0.25 (0.807) |
0.682 (0.997) |
0.567 (0.95) |
0.609 (0.975) |
1 (1.00) |
| amp 1q32 1 | 158 (28%) | 413 |
0.376 (0.897) |
0.18 (0.787) |
1 (1.00) |
0.127 (0.689) |
0.288 (0.827) |
0.966 (1.00) |
0.879 (1.00) |
0.526 (0.947) |
| amp 1q44 | 98 (17%) | 473 |
0.613 (0.975) |
0.95 (1.00) |
0.213 (0.787) |
0.186 (0.787) |
0.455 (0.938) |
0.137 (0.715) |
0.954 (1.00) |
0.424 (0.931) |
| amp 2p24 3 | 49 (9%) | 522 |
0.24 (0.806) |
0.275 (0.821) |
0.445 (0.932) |
1 (1.00) |
0.708 (1) |
1 (1.00) |
0.599 (0.972) |
0.612 (0.975) |
| amp 4p16 3 | 48 (8%) | 523 |
0.566 (0.95) |
0.85 (1.00) |
0.356 (0.897) |
0.821 (1.00) |
0.163 (0.783) |
0.751 (1.00) |
0.779 (1.00) |
1 (1.00) |
| amp 4q12 | 108 (19%) | 463 |
0.218 (0.79) |
0.142 (0.719) |
0.382 (0.897) |
0.078 (0.644) |
0.813 (1.00) |
0.682 (0.997) |
0.552 (0.95) |
1 (1.00) |
| amp 8q24 21 | 70 (12%) | 501 |
0.0838 (0.644) |
0.441 (0.932) |
0.516 (0.947) |
0.329 (0.881) |
0.918 (1.00) |
0.82 (1.00) |
0.23 (0.79) |
1 (1.00) |
| amp 11p13 | 30 (5%) | 541 |
0.727 (1.00) |
0.279 (0.825) |
1 (1.00) |
0.406 (0.926) |
0.627 (0.977) |
0.739 (1.00) |
0.769 (1.00) |
0.514 (0.947) |
| amp 12p13 32 | 84 (15%) | 487 |
0.944 (1.00) |
0.173 (0.787) |
1 (1.00) |
0.216 (0.79) |
0.936 (1.00) |
0.891 (1.00) |
0.556 (0.95) |
0.687 (0.997) |
| amp 12q14 1 | 134 (23%) | 437 |
0.201 (0.787) |
0.699 (0.997) |
0.419 (0.931) |
0.304 (0.85) |
0.531 (0.947) |
0.692 (0.997) |
0.72 (1) |
0.31 (0.851) |
| amp 12q15 | 92 (16%) | 479 |
0.449 (0.937) |
0.576 (0.957) |
0.354 (0.897) |
1 (1.00) |
0.791 (1.00) |
0.763 (1.00) |
0.526 (0.947) |
0.229 (0.79) |
| amp 13q34 | 32 (6%) | 539 |
0.777 (1.00) |
0.689 (0.997) |
0.456 (0.938) |
0.593 (0.972) |
0.579 (0.959) |
0.481 (0.94) |
1 (1.00) |
1 (1.00) |
| amp 13q34 | 30 (5%) | 541 |
0.641 (0.978) |
0.414 (0.931) |
0.568 (0.95) |
1 (1.00) |
0.432 (0.932) |
0.74 (1.00) |
0.493 (0.94) |
1 (1.00) |
| amp 17p13 2 | 51 (9%) | 520 |
0.642 (0.978) |
0.496 (0.94) |
0.293 (0.827) |
0.185 (0.787) |
0.936 (1.00) |
0.527 (0.947) |
0.713 (1) |
1 (1.00) |
| amp 19p13 3 | 241 (42%) | 330 |
0.157 (0.772) |
0.68 (0.997) |
1 (1.00) |
0.313 (0.851) |
0.226 (0.79) |
0.52 (0.947) |
0.428 (0.931) |
0.769 (1.00) |
| amp 19p13 2 | 246 (43%) | 325 |
0.265 (0.82) |
0.976 (1.00) |
1 (1.00) |
0.378 (0.897) |
0.55 (0.95) |
0.555 (0.95) |
0.748 (1.00) |
0.77 (1.00) |
| amp 19q12 | 214 (37%) | 357 |
0.726 (1.00) |
0.496 (0.94) |
0.596 (0.972) |
0.12 (0.689) |
0.789 (1.00) |
0.473 (0.94) |
0.718 (1) |
0.387 (0.897) |
| del 1p36 32 | 96 (17%) | 475 |
0.556 (0.95) |
0.619 (0.975) |
0.0294 (0.422) |
0.619 (0.975) |
0.863 (1.00) |
0.104 (0.689) |
0.0837 (0.644) |
0.7 (0.997) |
| del 1p32 3 | 60 (11%) | 511 |
0.615 (0.975) |
0.0555 (0.553) |
0.127 (0.689) |
0.42 (0.931) |
0.735 (1.00) |
0.535 (0.947) |
0.27 (0.82) |
1 (1.00) |
| del 1p22 1 | 47 (8%) | 524 |
0.55 (0.95) |
0.36 (0.897) |
1 (1.00) |
1 (1.00) |
0.894 (1.00) |
0.0673 (0.61) |
1 (1.00) |
1 (1.00) |
| del 1q44 | 34 (6%) | 537 |
0.386 (0.897) |
0.321 (0.868) |
1 (1.00) |
0.429 (0.931) |
0.161 (0.783) |
0.878 (1.00) |
0.883 (1.00) |
0.474 (0.94) |
| del 2q22 1 | 47 (8%) | 524 |
0.27 (0.82) |
0.0904 (0.675) |
0.439 (0.932) |
0.106 (0.689) |
0.622 (0.976) |
0.113 (0.689) |
0.229 (0.79) |
0.611 (0.975) |
| del 2q37 1 | 55 (10%) | 516 |
0.91 (1.00) |
0.777 (1.00) |
0.245 (0.807) |
0.203 (0.787) |
0.855 (1.00) |
0.92 (1.00) |
0.602 (0.972) |
1 (1.00) |
| del 3p21 1 | 53 (9%) | 518 |
0.0444 (0.488) |
0.0147 (0.26) |
0.768 (1.00) |
0.283 (0.827) |
0.569 (0.95) |
0.341 (0.884) |
0.495 (0.94) |
0.337 (0.881) |
| del 3q13 31 | 56 (10%) | 515 |
0.877 (1.00) |
0.398 (0.915) |
0.567 (0.95) |
0.832 (1.00) |
0.239 (0.806) |
0.777 (1.00) |
0.528 (0.947) |
0.346 (0.894) |
| del 3q22 1 | 58 (10%) | 513 |
0.949 (1.00) |
0.385 (0.897) |
1 (1.00) |
0.832 (1.00) |
0.43 (0.931) |
0.784 (1.00) |
0.311 (0.851) |
0.365 (0.897) |
| del 3q29 | 65 (11%) | 506 |
0.174 (0.787) |
0.57 (0.95) |
1 (1.00) |
1 (1.00) |
0.643 (0.978) |
1 (1.00) |
1 (1.00) |
1 (1.00) |
| del 4p16 3 | 77 (13%) | 494 |
0.0948 (0.682) |
0.0984 (0.689) |
0.211 (0.787) |
0.855 (1.00) |
0.269 (0.82) |
0.497 (0.94) |
0.53 (0.947) |
0.661 (0.992) |
| del 4q34 3 | 92 (16%) | 479 |
0.0428 (0.488) |
0.121 (0.689) |
0.0361 (0.446) |
0.178 (0.787) |
0.784 (1.00) |
0.852 (1.00) |
0.178 (0.787) |
1 (1.00) |
| del 5q34 | 69 (12%) | 502 |
0.0217 (0.342) |
0.289 (0.827) |
0.236 (0.806) |
0.567 (0.95) |
0.467 (0.94) |
0.208 (0.787) |
0.0407 (0.485) |
0.17 (0.785) |
| del 6q22 31 | 157 (27%) | 414 |
0.0206 (0.334) |
0.221 (0.79) |
0.0839 (0.644) |
0.0699 (0.61) |
0.682 (0.997) |
0.412 (0.931) |
0.534 (0.947) |
0.193 (0.787) |
| del 6q26 | 178 (31%) | 393 |
0.0767 (0.644) |
0.891 (1.00) |
0.196 (0.787) |
0.59 (0.972) |
0.745 (1.00) |
0.19 (0.787) |
0.97 (1.00) |
0.355 (0.897) |
| del 8p23 2 | 66 (12%) | 505 |
0.372 (0.897) |
0.041 (0.485) |
0.285 (0.827) |
0.696 (0.997) |
0.334 (0.881) |
0.93 (1.00) |
0.0163 (0.281) |
0.376 (0.897) |
| del 9q34 2 | 79 (14%) | 492 |
0.923 (1.00) |
0.963 (1.00) |
0.901 (1.00) |
0.584 (0.964) |
0.829 (1.00) |
0.0698 (0.61) |
0.252 (0.807) |
0.229 (0.79) |
| del 11p11 2 | 105 (18%) | 466 |
0.169 (0.785) |
0.675 (0.997) |
0.224 (0.79) |
1 (1.00) |
0.337 (0.881) |
0.239 (0.806) |
0.773 (1.00) |
1 (1.00) |
| del 11q14 1 | 96 (17%) | 475 |
0.847 (1.00) |
0.533 (0.947) |
0.359 (0.897) |
0.619 (0.975) |
0.67 (0.997) |
0.293 (0.827) |
0.91 (1.00) |
0.7 (0.997) |
| del 12p13 1 | 71 (12%) | 500 |
0.121 (0.689) |
0.984 (1.00) |
0.437 (0.932) |
0.569 (0.95) |
0.491 (0.94) |
0.295 (0.829) |
0.117 (0.689) |
1 (1.00) |
| del 12q12 | 76 (13%) | 495 |
0.596 (0.972) |
0.655 (0.99) |
0.615 (0.975) |
0.197 (0.787) |
0.518 (0.947) |
1 (1.00) |
0.427 (0.931) |
0.657 (0.99) |
| del 12q15 | 78 (14%) | 493 |
0.719 (1) |
0.646 (0.978) |
0.454 (0.938) |
0.141 (0.719) |
0.704 (0.997) |
0.83 (1.00) |
0.333 (0.881) |
0.209 (0.787) |
| del 13q14 2 | 239 (42%) | 332 |
0.746 (1.00) |
0.753 (1.00) |
0.544 (0.95) |
0.0998 (0.689) |
0.869 (1.00) |
0.445 (0.932) |
0.435 (0.932) |
1 (1.00) |
| del 13q22 1 | 227 (40%) | 344 |
0.718 (1) |
0.963 (1.00) |
0.861 (1.00) |
0.127 (0.689) |
0.31 (0.851) |
0.415 (0.931) |
0.804 (1.00) |
0.378 (0.897) |
| del 14q13 1 | 176 (31%) | 395 |
0.602 (0.972) |
0.555 (0.95) |
0.114 (0.689) |
0.422 (0.931) |
0.827 (1.00) |
0.538 (0.949) |
0.259 (0.814) |
0.119 (0.689) |
| del 14q24 2 | 171 (30%) | 400 |
0.867 (1.00) |
0.511 (0.947) |
0.224 (0.79) |
0.103 (0.689) |
0.887 (1.00) |
0.254 (0.807) |
0.711 (1) |
1 (1.00) |
| del 15q14 | 152 (27%) | 419 |
0.291 (0.827) |
0.0327 (0.435) |
0.629 (0.977) |
0.258 (0.813) |
0.886 (1.00) |
0.896 (1.00) |
0.462 (0.94) |
0.328 (0.881) |
| del 16p12 2 | 92 (16%) | 479 |
0.108 (0.689) |
0.208 (0.787) |
0.354 (0.897) |
0.17 (0.785) |
0.211 (0.787) |
0.442 (0.932) |
0.907 (1.00) |
1 (1.00) |
| del 16q23 1 | 99 (17%) | 472 |
0.136 (0.715) |
0.75 (1.00) |
0.821 (1.00) |
0.0941 (0.682) |
0.629 (0.977) |
0.63 (0.977) |
0.64 (0.978) |
0.702 (0.997) |
| del 17p13 2 | 86 (15%) | 485 |
0.722 (1.00) |
0.558 (0.95) |
0.338 (0.881) |
0.49 (0.94) |
0.382 (0.897) |
0.847 (1.00) |
0.603 (0.972) |
1 (1.00) |
| del 17p13 1 | 96 (17%) | 475 |
0.754 (1.00) |
0.0989 (0.689) |
0.108 (0.689) |
0.868 (1.00) |
0.932 (1.00) |
1 (1.00) |
0.871 (1.00) |
1 (1.00) |
| del 17q11 2 | 70 (12%) | 501 |
0.521 (0.947) |
0.533 (0.947) |
0.794 (1.00) |
0.454 (0.938) |
0.739 (1.00) |
1 (1.00) |
0.737 (1.00) |
1 (1.00) |
| del 18q22 3 | 82 (14%) | 489 |
0.886 (1.00) |
0.509 (0.947) |
0.808 (1.00) |
0.213 (0.787) |
0.109 (0.689) |
0.789 (1.00) |
0.382 (0.897) |
0.399 (0.915) |
| del 21q21 1 | 56 (10%) | 515 |
0.492 (0.94) |
0.409 (0.928) |
0.775 (1.00) |
1 (1.00) |
0.357 (0.897) |
0.924 (1.00) |
0.929 (1.00) |
0.365 (0.897) |
| del 22q13 32 | 212 (37%) | 359 |
0.566 (0.95) |
0.157 (0.772) |
0.929 (1.00) |
0.7 (0.997) |
0.717 (1) |
0.97 (1.00) |
0.195 (0.787) |
1 (1.00) |
| del xp22 2 | 118 (21%) | 453 |
0.123 (0.689) |
0.507 (0.947) |
1 (1.00) |
0.645 (0.978) |
0.437 (0.932) |
0.918 (1.00) |
0.672 (0.997) |
0.474 (0.94) |
P value = 0.0128 (Fisher's exact test), Q value = 0.24
Table S1. Gene #1: 'amp_1p36.21' versus Clinical Feature #6: 'HISTOLOGICAL_TYPE'
| nPatients | GLIOBLASTOMA MULTIFORME (GBM) | TREATED PRIMARY GBM | UNTREATED PRIMARY (DE NOVO) GBM |
|---|---|---|---|
| ALL | 28 | 18 | 525 |
| AMP PEAK 1(1P36.21) MUTATED | 0 | 1 | 90 |
| AMP PEAK 1(1P36.21) WILD-TYPE | 28 | 17 | 435 |
Figure S1. Get High-res Image Gene #1: 'amp_1p36.21' versus Clinical Feature #6: 'HISTOLOGICAL_TYPE'
P value = 0.00059 (Fisher's exact test), Q value = 0.02
Table S2. Gene #5: 'amp_3q26.33' versus Clinical Feature #6: 'HISTOLOGICAL_TYPE'
| nPatients | GLIOBLASTOMA MULTIFORME (GBM) | TREATED PRIMARY GBM | UNTREATED PRIMARY (DE NOVO) GBM |
|---|---|---|---|
| ALL | 28 | 18 | 525 |
| AMP PEAK 5(3Q26.33) MUTATED | 0 | 0 | 108 |
| AMP PEAK 5(3Q26.33) WILD-TYPE | 28 | 18 | 417 |
Figure S2. Get High-res Image Gene #5: 'amp_3q26.33' versus Clinical Feature #6: 'HISTOLOGICAL_TYPE'
P value = 5.03e-07 (logrank test), Q value = 3.6e-05
Table S3. Gene #8: 'amp_7p11.2' versus Clinical Feature #1: 'Time to Death'
| nPatients | nDeath | Duration Range (Median), Month | |
|---|---|---|---|
| ALL | 570 | 470 | 0.1 - 127.6 (12.2) |
| AMP PEAK 8(7P11.2) MUTATED | 500 | 422 | 0.1 - 127.6 (11.8) |
| AMP PEAK 8(7P11.2) WILD-TYPE | 70 | 48 | 0.2 - 115.9 (17.1) |
Figure S3. Get High-res Image Gene #8: 'amp_7p11.2' versus Clinical Feature #1: 'Time to Death'
P value = 9.44e-13 (Wilcoxon-test), Q value = 5.4e-10
Table S4. Gene #8: 'amp_7p11.2' versus Clinical Feature #2: 'YEARS_TO_BIRTH'
| nPatients | Mean (Std.Dev) | |
|---|---|---|
| ALL | 571 | 57.7 (14.5) |
| AMP PEAK 8(7P11.2) MUTATED | 501 | 59.8 (12.5) |
| AMP PEAK 8(7P11.2) WILD-TYPE | 70 | 43.1 (18.8) |
Figure S4. Get High-res Image Gene #8: 'amp_7p11.2' versus Clinical Feature #2: 'YEARS_TO_BIRTH'
P value = 1.89e-05 (logrank test), Q value = 0.00086
Table S5. Gene #9: 'amp_7q11.21' versus Clinical Feature #1: 'Time to Death'
| nPatients | nDeath | Duration Range (Median), Month | |
|---|---|---|---|
| ALL | 570 | 470 | 0.1 - 127.6 (12.2) |
| AMP PEAK 9(7Q11.21) MUTATED | 458 | 384 | 0.1 - 127.6 (11.8) |
| AMP PEAK 9(7Q11.21) WILD-TYPE | 112 | 86 | 0.2 - 120.6 (15.2) |
Figure S5. Get High-res Image Gene #9: 'amp_7q11.21' versus Clinical Feature #1: 'Time to Death'
P value = 1.02e-07 (Wilcoxon-test), Q value = 1.2e-05
Table S6. Gene #9: 'amp_7q11.21' versus Clinical Feature #2: 'YEARS_TO_BIRTH'
| nPatients | Mean (Std.Dev) | |
|---|---|---|
| ALL | 571 | 57.7 (14.5) |
| AMP PEAK 9(7Q11.21) MUTATED | 459 | 59.9 (12.4) |
| AMP PEAK 9(7Q11.21) WILD-TYPE | 112 | 49.1 (18.7) |
Figure S6. Get High-res Image Gene #9: 'amp_7q11.21' versus Clinical Feature #2: 'YEARS_TO_BIRTH'
P value = 0.0133 (Fisher's exact test), Q value = 0.24
Table S7. Gene #9: 'amp_7q11.21' versus Clinical Feature #6: 'HISTOLOGICAL_TYPE'
| nPatients | GLIOBLASTOMA MULTIFORME (GBM) | TREATED PRIMARY GBM | UNTREATED PRIMARY (DE NOVO) GBM |
|---|---|---|---|
| ALL | 28 | 18 | 525 |
| AMP PEAK 9(7Q11.21) MUTATED | 20 | 10 | 429 |
| AMP PEAK 9(7Q11.21) WILD-TYPE | 8 | 8 | 96 |
Figure S7. Get High-res Image Gene #9: 'amp_7q11.21' versus Clinical Feature #6: 'HISTOLOGICAL_TYPE'
P value = 8.47e-05 (logrank test), Q value = 0.003
Table S8. Gene #10: 'amp_7q21.2' versus Clinical Feature #1: 'Time to Death'
| nPatients | nDeath | Duration Range (Median), Month | |
|---|---|---|---|
| ALL | 570 | 470 | 0.1 - 127.6 (12.2) |
| AMP PEAK 10(7Q21.2) MUTATED | 473 | 398 | 0.1 - 127.6 (11.8) |
| AMP PEAK 10(7Q21.2) WILD-TYPE | 97 | 72 | 0.1 - 120.6 (15.1) |
Figure S8. Get High-res Image Gene #10: 'amp_7q21.2' versus Clinical Feature #1: 'Time to Death'

P value = 3.81e-06 (Wilcoxon-test), Q value = 0.00024
Table S9. Gene #10: 'amp_7q21.2' versus Clinical Feature #2: 'YEARS_TO_BIRTH'
| nPatients | Mean (Std.Dev) | |
|---|---|---|
| ALL | 571 | 57.7 (14.5) |
| AMP PEAK 10(7Q21.2) MUTATED | 474 | 59.5 (12.5) |
| AMP PEAK 10(7Q21.2) WILD-TYPE | 97 | 49.2 (19.9) |
Figure S9. Get High-res Image Gene #10: 'amp_7q21.2' versus Clinical Feature #2: 'YEARS_TO_BIRTH'
P value = 0.00115 (logrank test), Q value = 0.034
Table S10. Gene #11: 'amp_7q31.2' versus Clinical Feature #1: 'Time to Death'
| nPatients | nDeath | Duration Range (Median), Month | |
|---|---|---|---|
| ALL | 570 | 470 | 0.1 - 127.6 (12.2) |
| AMP PEAK 11(7Q31.2) MUTATED | 466 | 390 | 0.1 - 127.6 (11.8) |
| AMP PEAK 11(7Q31.2) WILD-TYPE | 104 | 80 | 0.1 - 120.6 (14.8) |
Figure S10. Get High-res Image Gene #11: 'amp_7q31.2' versus Clinical Feature #1: 'Time to Death'
P value = 0.000958 (Wilcoxon-test), Q value = 0.03
Table S11. Gene #11: 'amp_7q31.2' versus Clinical Feature #2: 'YEARS_TO_BIRTH'
| nPatients | Mean (Std.Dev) | |
|---|---|---|
| ALL | 571 | 57.7 (14.5) |
| AMP PEAK 11(7Q31.2) MUTATED | 467 | 59.2 (12.7) |
| AMP PEAK 11(7Q31.2) WILD-TYPE | 104 | 51.4 (19.7) |
Figure S11. Get High-res Image Gene #11: 'amp_7q31.2' versus Clinical Feature #2: 'YEARS_TO_BIRTH'
P value = 0.00533 (Wilcoxon-test), Q value = 0.14
Table S12. Gene #19: 'amp_14q32.33' versus Clinical Feature #2: 'YEARS_TO_BIRTH'
| nPatients | Mean (Std.Dev) | |
|---|---|---|
| ALL | 571 | 57.7 (14.5) |
| AMP PEAK 19(14Q32.33) MUTATED | 36 | 63.4 (14.4) |
| AMP PEAK 19(14Q32.33) WILD-TYPE | 535 | 57.4 (14.4) |
Figure S12. Get High-res Image Gene #19: 'amp_14q32.33' versus Clinical Feature #2: 'YEARS_TO_BIRTH'

P value = 0.00843 (Wilcoxon-test), Q value = 0.18
Table S13. Gene #21: 'amp_17q25.1' versus Clinical Feature #2: 'YEARS_TO_BIRTH'
| nPatients | Mean (Std.Dev) | |
|---|---|---|
| ALL | 571 | 57.7 (14.5) |
| AMP PEAK 21(17Q25.1) MUTATED | 83 | 61.2 (13.6) |
| AMP PEAK 21(17Q25.1) WILD-TYPE | 488 | 57.1 (14.6) |
Figure S13. Get High-res Image Gene #21: 'amp_17q25.1' versus Clinical Feature #2: 'YEARS_TO_BIRTH'
P value = 0.00982 (Wilcoxon-test), Q value = 0.21
Table S14. Gene #25: 'amp_21q21.1' versus Clinical Feature #2: 'YEARS_TO_BIRTH'
| nPatients | Mean (Std.Dev) | |
|---|---|---|
| ALL | 571 | 57.7 (14.5) |
| AMP PEAK 25(21Q21.1) MUTATED | 69 | 62.0 (13.3) |
| AMP PEAK 25(21Q21.1) WILD-TYPE | 502 | 57.2 (14.6) |
Figure S14. Get High-res Image Gene #25: 'amp_21q21.1' versus Clinical Feature #2: 'YEARS_TO_BIRTH'
P value = 0.0109 (Fisher's exact test), Q value = 0.22
Table S15. Gene #27: 'del_1p36.23' versus Clinical Feature #3: 'GENDER'
| nPatients | FEMALE | MALE |
|---|---|---|
| ALL | 224 | 347 |
| DEL PEAK 2(1P36.23) MUTATED | 39 | 93 |
| DEL PEAK 2(1P36.23) WILD-TYPE | 185 | 254 |
Figure S15. Get High-res Image Gene #27: 'del_1p36.23' versus Clinical Feature #3: 'GENDER'
P value = 0.00641 (Wilcoxon-test), Q value = 0.15
Table S16. Gene #30: 'del_1q42.11' versus Clinical Feature #5: 'KARNOFSKY_PERFORMANCE_SCORE'
| nPatients | Mean (Std.Dev) | |
|---|---|---|
| ALL | 424 | 77.4 (14.9) |
| DEL PEAK 5(1Q42.11) MUTATED | 39 | 69.7 (18.6) |
| DEL PEAK 5(1Q42.11) WILD-TYPE | 385 | 78.2 (14.3) |
Figure S16. Get High-res Image Gene #30: 'del_1q42.11' versus Clinical Feature #5: 'KARNOFSKY_PERFORMANCE_SCORE'
P value = 6.29e-05 (Wilcoxon-test), Q value = 0.0026
Table S17. Gene #44: 'del_9p21.3' versus Clinical Feature #2: 'YEARS_TO_BIRTH'
| nPatients | Mean (Std.Dev) | |
|---|---|---|
| ALL | 571 | 57.7 (14.5) |
| DEL PEAK 19(9P21.3) MUTATED | 418 | 59.1 (13.8) |
| DEL PEAK 19(9P21.3) WILD-TYPE | 153 | 53.9 (15.7) |
Figure S17. Get High-res Image Gene #44: 'del_9p21.3' versus Clinical Feature #2: 'YEARS_TO_BIRTH'
P value = 1.98e-05 (logrank test), Q value = 0.00086
Table S18. Gene #46: 'del_10p15.3' versus Clinical Feature #1: 'Time to Death'
| nPatients | nDeath | Duration Range (Median), Month | |
|---|---|---|---|
| ALL | 570 | 470 | 0.1 - 127.6 (12.2) |
| DEL PEAK 21(10P15.3) MUTATED | 463 | 391 | 0.1 - 120.6 (12.0) |
| DEL PEAK 21(10P15.3) WILD-TYPE | 107 | 79 | 0.1 - 127.6 (14.1) |
Figure S18. Get High-res Image Gene #46: 'del_10p15.3' versus Clinical Feature #1: 'Time to Death'
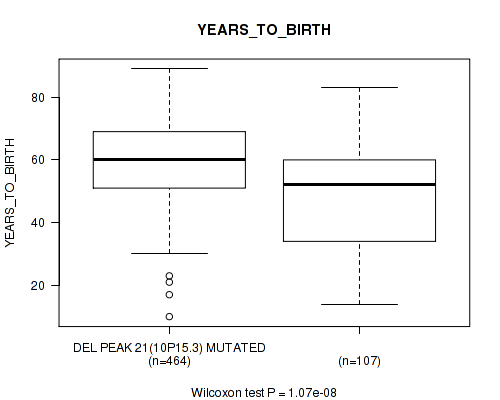
P value = 1.07e-08 (Wilcoxon-test), Q value = 2e-06
Table S19. Gene #46: 'del_10p15.3' versus Clinical Feature #2: 'YEARS_TO_BIRTH'
| nPatients | Mean (Std.Dev) | |
|---|---|---|
| ALL | 571 | 57.7 (14.5) |
| DEL PEAK 21(10P15.3) MUTATED | 464 | 59.8 (12.6) |
| DEL PEAK 21(10P15.3) WILD-TYPE | 107 | 48.8 (18.5) |
Figure S19. Get High-res Image Gene #46: 'del_10p15.3' versus Clinical Feature #2: 'YEARS_TO_BIRTH'
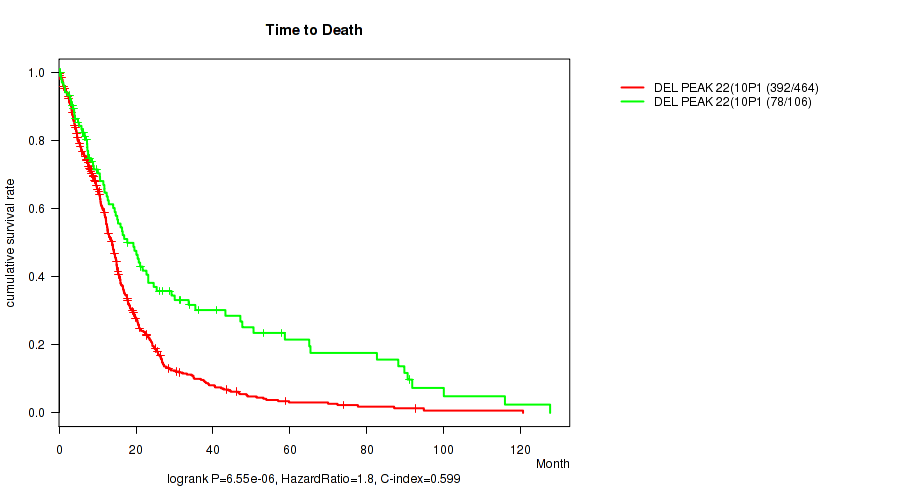
P value = 6.55e-06 (logrank test), Q value = 0.00037
Table S20. Gene #47: 'del_10p13' versus Clinical Feature #1: 'Time to Death'
| nPatients | nDeath | Duration Range (Median), Month | |
|---|---|---|---|
| ALL | 570 | 470 | 0.1 - 127.6 (12.2) |
| DEL PEAK 22(10P13) MUTATED | 464 | 392 | 0.1 - 120.6 (12.0) |
| DEL PEAK 22(10P13) WILD-TYPE | 106 | 78 | 0.1 - 127.6 (14.3) |
Figure S20. Get High-res Image Gene #47: 'del_10p13' versus Clinical Feature #1: 'Time to Death'
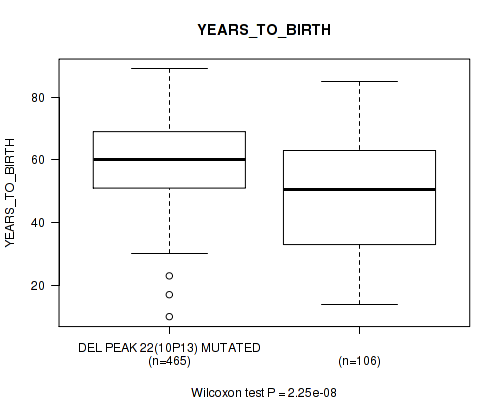
P value = 2.25e-08 (Wilcoxon-test), Q value = 3.2e-06
Table S21. Gene #47: 'del_10p13' versus Clinical Feature #2: 'YEARS_TO_BIRTH'
| nPatients | Mean (Std.Dev) | |
|---|---|---|
| ALL | 571 | 57.7 (14.5) |
| DEL PEAK 22(10P13) MUTATED | 465 | 59.8 (12.4) |
| DEL PEAK 22(10P13) WILD-TYPE | 106 | 48.8 (19.1) |
Figure S21. Get High-res Image Gene #47: 'del_10p13' versus Clinical Feature #2: 'YEARS_TO_BIRTH'
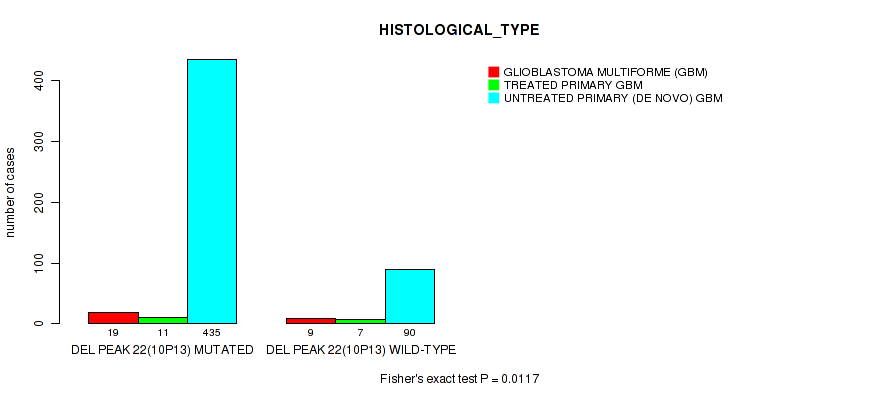
P value = 0.0117 (Fisher's exact test), Q value = 0.23
Table S22. Gene #47: 'del_10p13' versus Clinical Feature #6: 'HISTOLOGICAL_TYPE'
| nPatients | GLIOBLASTOMA MULTIFORME (GBM) | TREATED PRIMARY GBM | UNTREATED PRIMARY (DE NOVO) GBM |
|---|---|---|---|
| ALL | 28 | 18 | 525 |
| DEL PEAK 22(10P13) MUTATED | 19 | 11 | 435 |
| DEL PEAK 22(10P13) WILD-TYPE | 9 | 7 | 90 |
Figure S22. Get High-res Image Gene #47: 'del_10p13' versus Clinical Feature #6: 'HISTOLOGICAL_TYPE'
P value = 5.07e-07 (logrank test), Q value = 3.6e-05
Table S23. Gene #48: 'del_10p11.23' versus Clinical Feature #1: 'Time to Death'
| nPatients | nDeath | Duration Range (Median), Month | |
|---|---|---|---|
| ALL | 570 | 470 | 0.1 - 127.6 (12.2) |
| DEL PEAK 23(10P11.23) MUTATED | 469 | 396 | 0.1 - 120.6 (11.8) |
| DEL PEAK 23(10P11.23) WILD-TYPE | 101 | 74 | 0.1 - 127.6 (16.1) |
Figure S23. Get High-res Image Gene #48: 'del_10p11.23' versus Clinical Feature #1: 'Time to Death'

P value = 7.43e-11 (Wilcoxon-test), Q value = 2.1e-08
Table S24. Gene #48: 'del_10p11.23' versus Clinical Feature #2: 'YEARS_TO_BIRTH'
| nPatients | Mean (Std.Dev) | |
|---|---|---|
| ALL | 571 | 57.7 (14.5) |
| DEL PEAK 23(10P11.23) MUTATED | 470 | 60.0 (12.3) |
| DEL PEAK 23(10P11.23) WILD-TYPE | 101 | 47.3 (18.8) |
Figure S24. Get High-res Image Gene #48: 'del_10p11.23' versus Clinical Feature #2: 'YEARS_TO_BIRTH'
P value = 0.00431 (Fisher's exact test), Q value = 0.12
Table S25. Gene #48: 'del_10p11.23' versus Clinical Feature #6: 'HISTOLOGICAL_TYPE'
| nPatients | GLIOBLASTOMA MULTIFORME (GBM) | TREATED PRIMARY GBM | UNTREATED PRIMARY (DE NOVO) GBM |
|---|---|---|---|
| ALL | 28 | 18 | 525 |
| DEL PEAK 23(10P11.23) MUTATED | 20 | 10 | 440 |
| DEL PEAK 23(10P11.23) WILD-TYPE | 8 | 8 | 85 |
Figure S25. Get High-res Image Gene #48: 'del_10p11.23' versus Clinical Feature #6: 'HISTOLOGICAL_TYPE'

P value = 7.48e-05 (logrank test), Q value = 0.0028
Table S26. Gene #49: 'del_10q23.31' versus Clinical Feature #1: 'Time to Death'
| nPatients | nDeath | Duration Range (Median), Month | |
|---|---|---|---|
| ALL | 570 | 470 | 0.1 - 127.6 (12.2) |
| DEL PEAK 24(10Q23.31) MUTATED | 507 | 424 | 0.1 - 127.6 (12.1) |
| DEL PEAK 24(10Q23.31) WILD-TYPE | 63 | 46 | 0.4 - 115.9 (14.1) |
Figure S26. Get High-res Image Gene #49: 'del_10q23.31' versus Clinical Feature #1: 'Time to Death'

P value = 2.24e-07 (Wilcoxon-test), Q value = 2.1e-05
Table S27. Gene #49: 'del_10q23.31' versus Clinical Feature #2: 'YEARS_TO_BIRTH'
| nPatients | Mean (Std.Dev) | |
|---|---|---|
| ALL | 571 | 57.7 (14.5) |
| DEL PEAK 24(10Q23.31) MUTATED | 508 | 59.1 (13.4) |
| DEL PEAK 24(10Q23.31) WILD-TYPE | 63 | 47.2 (18.6) |
Figure S27. Get High-res Image Gene #49: 'del_10q23.31' versus Clinical Feature #2: 'YEARS_TO_BIRTH'
P value = 0.00396 (logrank test), Q value = 0.11
Table S28. Gene #50: 'del_10q26.3' versus Clinical Feature #1: 'Time to Death'
| nPatients | nDeath | Duration Range (Median), Month | |
|---|---|---|---|
| ALL | 570 | 470 | 0.1 - 127.6 (12.2) |
| DEL PEAK 25(10Q26.3) MUTATED | 508 | 423 | 0.1 - 127.6 (12.1) |
| DEL PEAK 25(10Q26.3) WILD-TYPE | 62 | 47 | 0.4 - 100.0 (12.8) |
Figure S28. Get High-res Image Gene #50: 'del_10q26.3' versus Clinical Feature #1: 'Time to Death'
P value = 8.97e-06 (Wilcoxon-test), Q value = 0.00046
Table S29. Gene #50: 'del_10q26.3' versus Clinical Feature #2: 'YEARS_TO_BIRTH'
| nPatients | Mean (Std.Dev) | |
|---|---|---|
| ALL | 571 | 57.7 (14.5) |
| DEL PEAK 25(10Q26.3) MUTATED | 509 | 58.9 (13.5) |
| DEL PEAK 25(10Q26.3) WILD-TYPE | 62 | 48.3 (18.7) |
Figure S29. Get High-res Image Gene #50: 'del_10q26.3' versus Clinical Feature #2: 'YEARS_TO_BIRTH'
P value = 0.00591 (Wilcoxon-test), Q value = 0.15
Table S30. Gene #51: 'del_11p15.5' versus Clinical Feature #2: 'YEARS_TO_BIRTH'
| nPatients | Mean (Std.Dev) | |
|---|---|---|
| ALL | 571 | 57.7 (14.5) |
| DEL PEAK 26(11P15.5) MUTATED | 129 | 53.9 (16.4) |
| DEL PEAK 26(11P15.5) WILD-TYPE | 442 | 58.9 (13.7) |
Figure S30. Get High-res Image Gene #51: 'del_11p15.5' versus Clinical Feature #2: 'YEARS_TO_BIRTH'
P value = 0.00747 (logrank test), Q value = 0.17
Table S31. Gene #68: 'del_19q13.41' versus Clinical Feature #1: 'Time to Death'
| nPatients | nDeath | Duration Range (Median), Month | |
|---|---|---|---|
| ALL | 570 | 470 | 0.1 - 127.6 (12.2) |
| DEL PEAK 43(19Q13.41) MUTATED | 99 | 82 | 0.2 - 127.6 (13.6) |
| DEL PEAK 43(19Q13.41) WILD-TYPE | 471 | 388 | 0.1 - 92.7 (11.8) |
Figure S31. Get High-res Image Gene #68: 'del_19q13.41' versus Clinical Feature #1: 'Time to Death'
-
Copy number data file = all_lesions.txt from GISTIC pipeline
-
Processed Copy number data file = /xchip/cga/gdac-prod/tcga-gdac/jobResults/GDAC_Correlate_Genomic_Events_Preprocess/GBM-TP/19791355/transformed.cor.cli.txt
-
Clinical data file = /xchip/cga/gdac-prod/tcga-gdac/jobResults/Append_Data/GBM-TP/19775175/GBM-TP.merged_data.txt
-
Number of patients = 571
-
Number of significantly focal cnvs = 71
-
Number of selected clinical features = 8
-
Exclude genes that fewer than K tumors have mutations, K = 3
For survival clinical features, the Kaplan-Meier survival curves of tumors with and without gene mutations were plotted and the statistical significance P values were estimated by logrank test (Bland and Altman 2004) using the 'survdiff' function in R
For binary or multi-class clinical features (nominal or ordinal), two-tailed Fisher's exact tests (Fisher 1922) were used to estimate the P values using the 'fisher.test' function in R
For multiple hypothesis correction, Q value is the False Discovery Rate (FDR) analogue of the P value (Benjamini and Hochberg 1995), defined as the minimum FDR at which the test may be called significant. We used the 'Benjamini and Hochberg' method of 'p.adjust' function in R to convert P values into Q values.
In addition to the links below, the full results of the analysis summarized in this report can also be downloaded programmatically using firehose_get, or interactively from either the Broad GDAC website or TCGA Data Coordination Center Portal.