This pipeline computes the correlation between significantly recurrent gene mutations and selected clinical features.
Testing the association between mutation status of 35 genes and 8 clinical features across 278 patients, 5 significant findings detected with Q value < 0.25.
-
TP53 mutation correlated to 'Time to Death'.
-
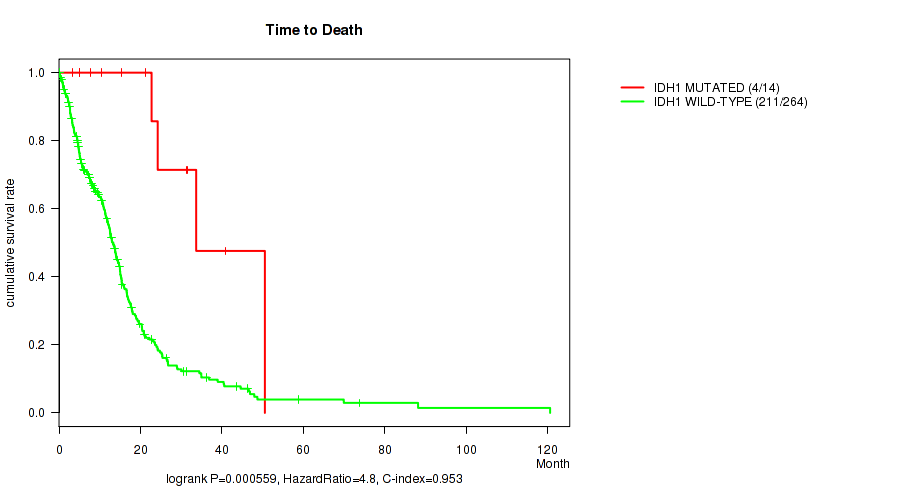
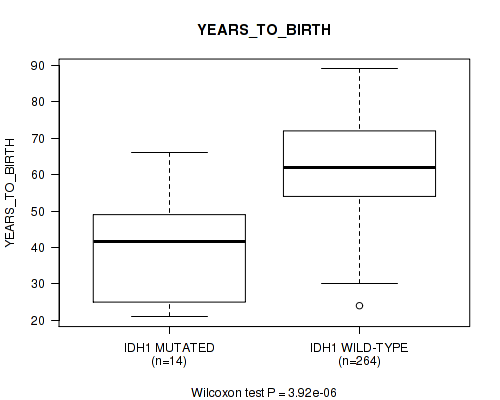
IDH1 mutation correlated to 'Time to Death' and 'YEARS_TO_BIRTH'.
-
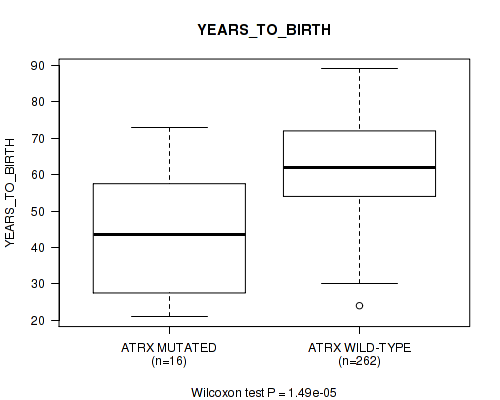
ATRX mutation correlated to 'YEARS_TO_BIRTH'.
-
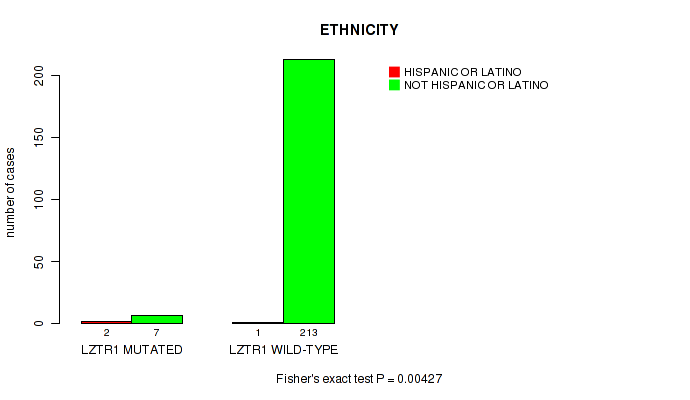
LZTR1 mutation correlated to 'ETHNICITY'.
Table 1. Get Full Table Overview of the association between mutation status of 35 genes and 8 clinical features. Shown in the table are P values (Q values). Thresholded by Q value < 0.25, 5 significant findings detected.
|
Clinical Features |
Time to Death |
YEARS TO BIRTH |
GENDER |
RADIATION THERAPY |
KARNOFSKY PERFORMANCE SCORE |
HISTOLOGICAL TYPE |
RACE | ETHNICITY | ||
| nMutated (%) | nWild-Type | logrank test | Wilcoxon-test | Fisher's exact test | Fisher's exact test | Wilcoxon-test | Fisher's exact test | Fisher's exact test | Fisher's exact test | |
| IDH1 | 14 (5%) | 264 |
0.000559 (0.0522) |
3.92e-06 (0.0011) |
0.392 (1.00) |
0.139 (1.00) |
0.129 (1.00) |
0.499 (1.00) |
0.0275 (0.641) |
1 (1.00) |
| TP53 | 79 (28%) | 199 |
0.00181 (0.127) |
0.325 (1.00) |
0.491 (1.00) |
0.103 (1.00) |
0.157 (1.00) |
0.308 (1.00) |
0.598 (1.00) |
1 (1.00) |
| ATRX | 16 (6%) | 262 |
0.00818 (0.36) |
1.49e-05 (0.00208) |
0.593 (1.00) |
0.746 (1.00) |
0.233 (1.00) |
0.548 (1.00) |
0.0259 (0.641) |
1 (1.00) |
| LZTR1 | 10 (4%) | 268 |
0.69 (1.00) |
0.234 (1.00) |
0.101 (1.00) |
0.148 (1.00) |
0.296 (1.00) |
0.169 (1.00) |
1 (1.00) |
0.00427 (0.239) |
| PIK3R1 | 32 (12%) | 246 |
0.935 (1.00) |
0.495 (1.00) |
0.434 (1.00) |
1 (1.00) |
0.62 (1.00) |
1 (1.00) |
0.679 (1.00) |
1 (1.00) |
| RB1 | 23 (8%) | 255 |
0.287 (1.00) |
0.949 (1.00) |
0.654 (1.00) |
1 (1.00) |
0.0303 (0.641) |
0.685 (1.00) |
0.599 (1.00) |
1 (1.00) |
| NF1 | 29 (10%) | 249 |
0.283 (1.00) |
0.134 (1.00) |
0.84 (1.00) |
0.591 (1.00) |
0.0592 (0.842) |
1 (1.00) |
1 (1.00) |
1 (1.00) |
| PTEN | 85 (31%) | 193 |
0.811 (1.00) |
0.324 (1.00) |
0.588 (1.00) |
0.0811 (0.946) |
0.983 (1.00) |
0.0602 (0.842) |
1 (1.00) |
0.227 (1.00) |
| PIK3CA | 26 (9%) | 252 |
0.213 (1.00) |
0.96 (1.00) |
0.831 (1.00) |
0.586 (1.00) |
0.721 (1.00) |
0.729 (1.00) |
0.381 (1.00) |
1 (1.00) |
| STAG2 | 12 (4%) | 266 |
0.00899 (0.36) |
0.849 (1.00) |
0.761 (1.00) |
0.233 (1.00) |
0.107 (1.00) |
1 (1.00) |
0.615 (1.00) |
1 (1.00) |
| SLC26A3 | 6 (2%) | 272 |
0.722 (1.00) |
0.279 (1.00) |
0.424 (1.00) |
0.594 (1.00) |
0.98 (1.00) |
1 (1.00) |
1 (1.00) |
1 (1.00) |
| SEMG1 | 8 (3%) | 270 |
0.366 (1.00) |
0.176 (1.00) |
0.715 (1.00) |
1 (1.00) |
0.547 (1.00) |
1 (1.00) |
0.497 (1.00) |
1 (1.00) |
| KDR | 8 (3%) | 270 |
0.661 (1.00) |
0.499 (1.00) |
0.266 (1.00) |
0.632 (1.00) |
0.634 (1.00) |
0.321 (1.00) |
1 (1.00) |
1 (1.00) |
| RPL5 | 7 (3%) | 271 |
0.82 (1.00) |
0.803 (1.00) |
0.256 (1.00) |
0.61 (1.00) |
0.444 (1.00) |
1 (1.00) |
0.448 (1.00) |
1 (1.00) |
| MAP3K1 | 6 (2%) | 272 |
0.691 (1.00) |
0.295 (1.00) |
0.424 (1.00) |
1 (1.00) |
0.767 (1.00) |
1 (1.00) |
1 (1.00) |
1 (1.00) |
| BRAF | 6 (2%) | 272 |
0.244 (1.00) |
0.918 (1.00) |
1 (1.00) |
0.594 (1.00) |
0.742 (1.00) |
0.0278 (0.641) |
0.401 (1.00) |
1 (1.00) |
| EGFR | 73 (26%) | 205 |
0.727 (1.00) |
0.695 (1.00) |
0.257 (1.00) |
1 (1.00) |
0.343 (1.00) |
0.451 (1.00) |
0.41 (1.00) |
1 (1.00) |
| TMPRSS6 | 6 (2%) | 272 |
0.963 (1.00) |
0.274 (1.00) |
0.67 (1.00) |
1 (1.00) |
0.293 (1.00) |
1 (1.00) |
1 (1.00) |
1 (1.00) |
| PRKCD | 3 (1%) | 275 |
0.977 (1.00) |
0.123 (1.00) |
1 (1.00) |
0.44 (1.00) |
1 (1.00) |
0.226 (1.00) |
1 (1.00) |
|
| TP63 | 6 (2%) | 272 |
0.334 (1.00) |
0.994 (1.00) |
0.67 (1.00) |
1 (1.00) |
0.697 (1.00) |
1 (1.00) |
1 (1.00) |
0.0531 (0.842) |
| PDGFRA | 11 (4%) | 267 |
0.665 (1.00) |
0.0539 (0.842) |
1 (1.00) |
0.413 (1.00) |
0.121 (1.00) |
1 (1.00) |
1 (1.00) |
1 (1.00) |
| CHD8 | 8 (3%) | 270 |
0.885 (1.00) |
0.0224 (0.641) |
0.141 (1.00) |
0.354 (1.00) |
0.261 (1.00) |
1 (1.00) |
1 (1.00) |
1 (1.00) |
| IL4R | 8 (3%) | 270 |
0.145 (1.00) |
0.108 (1.00) |
0.0273 (0.641) |
0.354 (1.00) |
0.394 (1.00) |
1 (1.00) |
0.496 (1.00) |
1 (1.00) |
| REN | 5 (2%) | 273 |
0.766 (1.00) |
0.617 (1.00) |
0.657 (1.00) |
1 (1.00) |
0.357 (1.00) |
0.0785 (0.946) |
1 (1.00) |
1 (1.00) |
| CD209 | 5 (2%) | 273 |
0.671 (1.00) |
0.717 (1.00) |
0.0579 (0.842) |
1 (1.00) |
0.625 (1.00) |
1 (1.00) |
1 (1.00) |
1 (1.00) |
| FBN3 | 11 (4%) | 267 |
0.19 (1.00) |
0.94 (1.00) |
0.532 (1.00) |
1 (1.00) |
0.956 (1.00) |
0.19 (1.00) |
0.613 (1.00) |
1 (1.00) |
| MMP13 | 5 (2%) | 273 |
0.686 (1.00) |
0.12 (1.00) |
0.657 (1.00) |
0.59 (1.00) |
0.0727 (0.925) |
1 (1.00) |
1 (1.00) |
1 (1.00) |
| TCF12 | 3 (1%) | 275 |
0.957 (1.00) |
0.94 (1.00) |
0.555 (1.00) |
1 (1.00) |
0.625 (1.00) |
1 (1.00) |
1 (1.00) |
1 (1.00) |
| IL18RAP | 6 (2%) | 272 |
0.708 (1.00) |
0.158 (1.00) |
0.67 (1.00) |
0.594 (1.00) |
0.188 (1.00) |
1 (1.00) |
0.401 (1.00) |
1 (1.00) |
| ODF4 | 3 (1%) | 275 |
0.328 (1.00) |
0.568 (1.00) |
1 (1.00) |
0.44 (1.00) |
1 (1.00) |
1 (1.00) |
1 (1.00) |
|
| KEL | 15 (5%) | 263 |
0.787 (1.00) |
0.543 (1.00) |
0.413 (1.00) |
0.476 (1.00) |
0.279 (1.00) |
1 (1.00) |
0.708 (1.00) |
1 (1.00) |
| TESK1 | 3 (1%) | 275 |
0.595 (1.00) |
0.0671 (0.895) |
1 (1.00) |
0.44 (1.00) |
1 (1.00) |
1 (1.00) |
1 (1.00) |
|
| MUC17 | 21 (8%) | 257 |
0.281 (1.00) |
0.5 (1.00) |
0.817 (1.00) |
0.76 (1.00) |
0.643 (1.00) |
1 (1.00) |
1 (1.00) |
1 (1.00) |
| FAM126B | 4 (1%) | 274 |
0.891 (1.00) |
0.7 (1.00) |
1 (1.00) |
1 (1.00) |
0.258 (1.00) |
1 (1.00) |
1 (1.00) |
1 (1.00) |
| DDX5 | 3 (1%) | 275 |
0.032 (0.641) |
0.0388 (0.725) |
0.555 (1.00) |
0.44 (1.00) |
0.135 (1.00) |
1 (1.00) |
1 (1.00) |
P value = 0.00181 (logrank test), Q value = 0.13
Table S1. Gene #1: 'TP53 MUTATION STATUS' versus Clinical Feature #1: 'Time to Death'
| nPatients | nDeath | Duration Range (Median), Month | |
|---|---|---|---|
| ALL | 278 | 215 | 0.1 - 120.6 (11.3) |
| TP53 MUTATED | 79 | 54 | 0.4 - 69.9 (12.9) |
| TP53 WILD-TYPE | 199 | 161 | 0.1 - 120.6 (10.4) |
Figure S1. Get High-res Image Gene #1: 'TP53 MUTATION STATUS' versus Clinical Feature #1: 'Time to Death'

P value = 0.000559 (logrank test), Q value = 0.052
Table S2. Gene #6: 'IDH1 MUTATION STATUS' versus Clinical Feature #1: 'Time to Death'
| nPatients | nDeath | Duration Range (Median), Month | |
|---|---|---|---|
| ALL | 278 | 215 | 0.1 - 120.6 (11.3) |
| IDH1 MUTATED | 14 | 4 | 3.4 - 50.5 (21.9) |
| IDH1 WILD-TYPE | 264 | 211 | 0.1 - 120.6 (11.0) |
Figure S2. Get High-res Image Gene #6: 'IDH1 MUTATION STATUS' versus Clinical Feature #1: 'Time to Death'
P value = 3.92e-06 (Wilcoxon-test), Q value = 0.0011
Table S3. Gene #6: 'IDH1 MUTATION STATUS' versus Clinical Feature #2: 'YEARS_TO_BIRTH'
| nPatients | Mean (Std.Dev) | |
|---|---|---|
| ALL | 278 | 61.0 (13.0) |
| IDH1 MUTATED | 14 | 40.0 (15.1) |
| IDH1 WILD-TYPE | 264 | 62.2 (11.9) |
Figure S3. Get High-res Image Gene #6: 'IDH1 MUTATION STATUS' versus Clinical Feature #2: 'YEARS_TO_BIRTH'
P value = 1.49e-05 (Wilcoxon-test), Q value = 0.0021
Table S4. Gene #13: 'ATRX MUTATION STATUS' versus Clinical Feature #2: 'YEARS_TO_BIRTH'
| nPatients | Mean (Std.Dev) | |
|---|---|---|
| ALL | 278 | 61.0 (13.0) |
| ATRX MUTATED | 16 | 42.7 (16.4) |
| ATRX WILD-TYPE | 262 | 62.2 (11.9) |
Figure S4. Get High-res Image Gene #13: 'ATRX MUTATION STATUS' versus Clinical Feature #2: 'YEARS_TO_BIRTH'
P value = 0.00427 (Fisher's exact test), Q value = 0.24
Table S5. Gene #28: 'LZTR1 MUTATION STATUS' versus Clinical Feature #8: 'ETHNICITY'
| nPatients | HISPANIC OR LATINO | NOT HISPANIC OR LATINO |
|---|---|---|
| ALL | 3 | 220 |
| LZTR1 MUTATED | 2 | 7 |
| LZTR1 WILD-TYPE | 1 | 213 |
Figure S5. Get High-res Image Gene #28: 'LZTR1 MUTATION STATUS' versus Clinical Feature #8: 'ETHNICITY'
-
Mutation data file = sample_sig_gene_table.txt from Mutsig_2CV pipeline
-
Processed Mutation data file = /xchip/cga/gdac-prod/tcga-gdac/jobResults/GDAC_Correlate_Genomic_Events_Preprocess/GBM-TP/20063482/transformed.cor.cli.txt
-
Clinical data file = /xchip/cga/gdac-prod/tcga-gdac/jobResults/Append_Data/GBM-TP/19775175/GBM-TP.merged_data.txt
-
Number of patients = 278
-
Number of significantly mutated genes = 35
-
Number of selected clinical features = 8
-
Exclude genes that fewer than K tumors have mutations, K = 3
For survival clinical features, the Kaplan-Meier survival curves of tumors with and without gene mutations were plotted and the statistical significance P values were estimated by logrank test (Bland and Altman 2004) using the 'survdiff' function in R
For binary or multi-class clinical features (nominal or ordinal), two-tailed Fisher's exact tests (Fisher 1922) were used to estimate the P values using the 'fisher.test' function in R
For multiple hypothesis correction, Q value is the False Discovery Rate (FDR) analogue of the P value (Benjamini and Hochberg 1995), defined as the minimum FDR at which the test may be called significant. We used the 'Benjamini and Hochberg' method of 'p.adjust' function in R to convert P values into Q values.
In addition to the links below, the full results of the analysis summarized in this report can also be downloaded programmatically using firehose_get, or interactively from either the Broad GDAC website or TCGA Data Coordination Center Portal.