This pipeline computes the correlation between APOBRC groups and selected clinical features.
Testing the association between APOBEC groups identified by 2 different apobec score and 13 clinical features across 510 patients, 8 significant findings detected with Q value < 0.25.
-
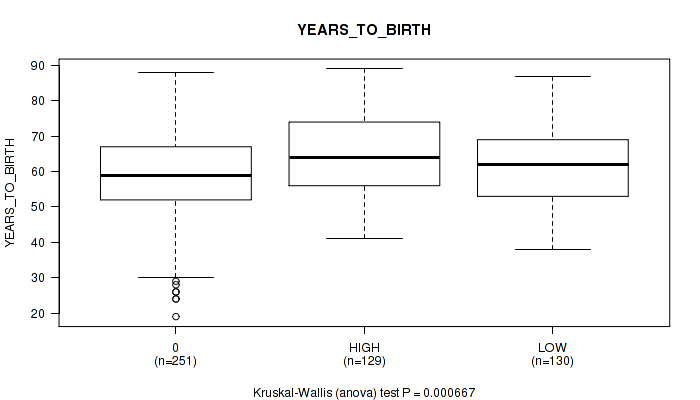
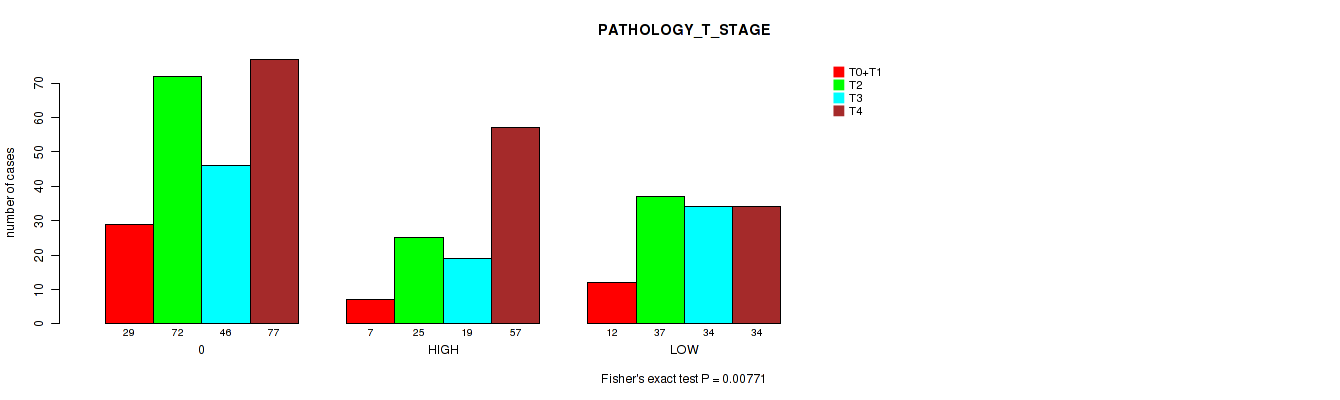
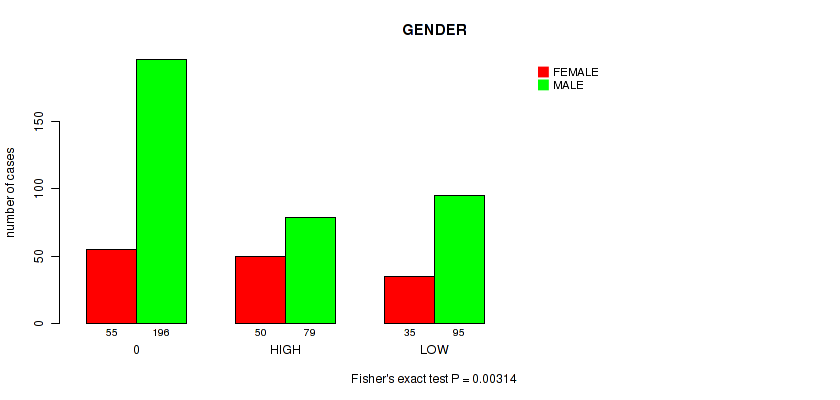
3 subtypes identified in current cancer cohort by 'APOBEC MUTLOAD MINESTIMATE'. These subtypes correlate to 'YEARS_TO_BIRTH', 'PATHOLOGY_T_STAGE', 'GENDER', and 'NUMBER_PACK_YEARS_SMOKED'.
-
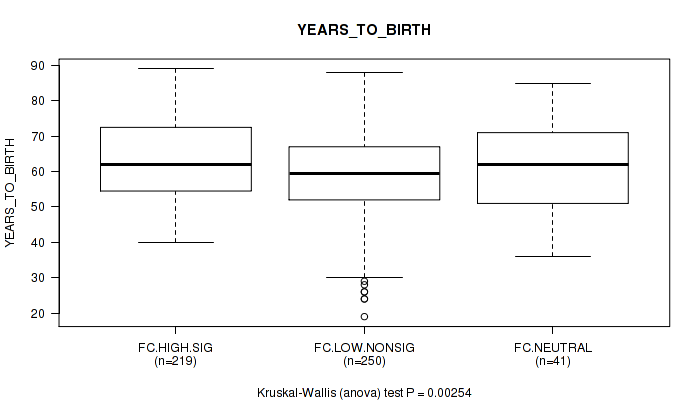
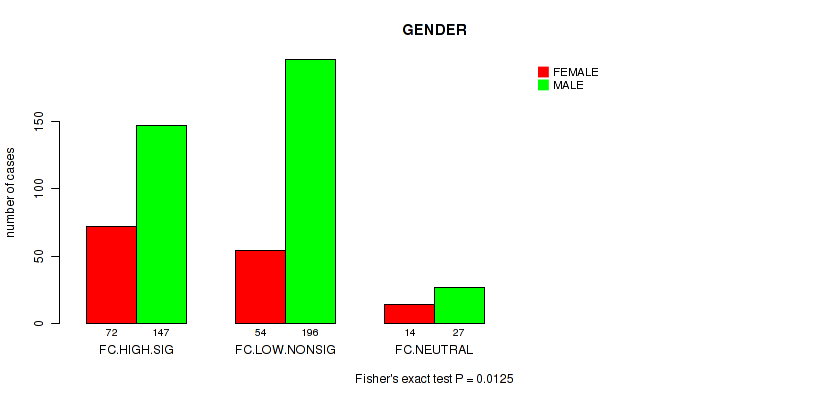
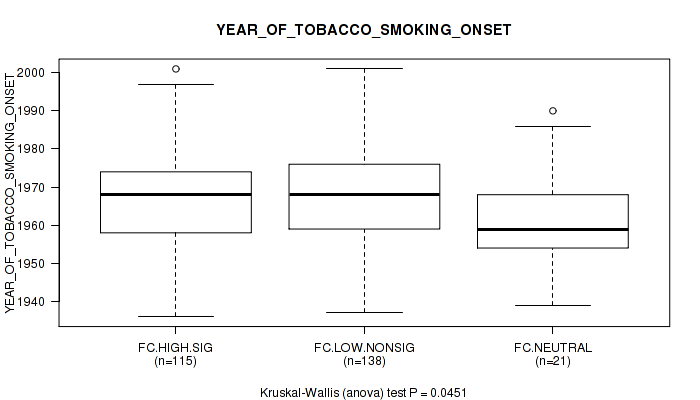
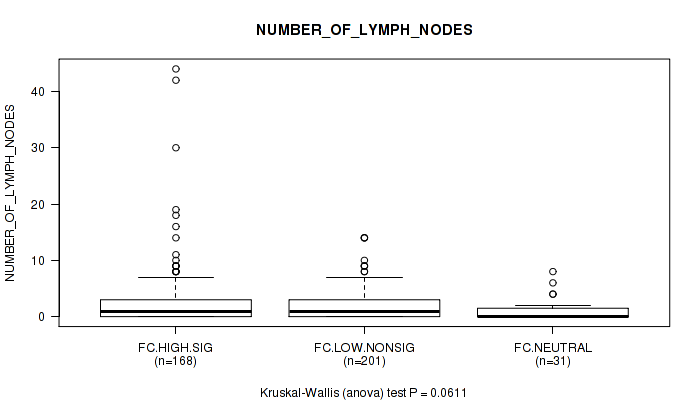
3 subtypes identified in current cancer cohort by 'APOBEC ENRICH'. These subtypes correlate to 'YEARS_TO_BIRTH', 'GENDER', 'YEAR_OF_TOBACCO_SMOKING_ONSET', and 'NUMBER_OF_LYMPH_NODES'.
Table 1. Get Full Table Overview of the association between APOBEC groups by 2 different APOBEC scores and 13 clinical features. Shown in the table are P values (Q values). Thresholded by Q value < 0.25, 8 significant findings detected.
|
Clinical Features |
Statistical Tests |
APOBEC MUTLOAD MINESTIMATE |
APOBEC ENRICH |
| Time to Death | logrank test |
0.16 (0.398) |
0.295 (0.511) |
| YEARS TO BIRTH | Kruskal-Wallis (anova) |
0.000667 (0.0173) |
0.00254 (0.0272) |
| PATHOLOGIC STAGE | Fisher's exact test |
0.152 (0.398) |
0.329 (0.512) |
| PATHOLOGY T STAGE | Fisher's exact test |
0.00771 (0.0501) |
0.391 (0.536) |
| PATHOLOGY N STAGE | Fisher's exact test |
0.245 (0.49) |
0.383 (0.536) |
| GENDER | Fisher's exact test |
0.00314 (0.0272) |
0.0125 (0.0651) |
| RADIATION THERAPY | Fisher's exact test |
0.937 (0.975) |
0.454 (0.59) |
| HISTOLOGICAL TYPE | Fisher's exact test |
0.847 (0.957) |
0.725 (0.856) |
| NUMBER PACK YEARS SMOKED | Kruskal-Wallis (anova) |
0.0361 (0.156) |
0.168 (0.398) |
| YEAR OF TOBACCO SMOKING ONSET | Kruskal-Wallis (anova) |
0.21 (0.455) |
0.0451 (0.167) |
| NUMBER OF LYMPH NODES | Kruskal-Wallis (anova) |
0.517 (0.64) |
0.0611 (0.198) |
| RACE | Fisher's exact test |
0.268 (0.498) |
0.335 (0.512) |
| ETHNICITY | Fisher's exact test |
0.933 (0.975) |
1 (1.00) |
Table S1. Description of APOBEC group #1: 'APOBEC MUTLOAD MINESTIMATE'
| Cluster Labels | 0 | HIGH | LOW |
|---|---|---|---|
| Number of samples | 251 | 129 | 130 |
P value = 0.000667 (Kruskal-Wallis (anova)), Q value = 0.017
Table S2. Clustering Approach #1: 'APOBEC MUTLOAD MINESTIMATE' versus Clinical Feature #2: 'YEARS_TO_BIRTH'
| nPatients | Mean (Std.Dev) | |
|---|---|---|
| ALL | 510 | 61.0 (12.0) |
| 0 | 251 | 58.7 (12.3) |
| HIGH | 129 | 64.4 (11.3) |
| LOW | 130 | 62.0 (11.2) |
Figure S1. Get High-res Image Clustering Approach #1: 'APOBEC MUTLOAD MINESTIMATE' versus Clinical Feature #2: 'YEARS_TO_BIRTH'
P value = 0.00771 (Fisher's exact test), Q value = 0.05
Table S3. Clustering Approach #1: 'APOBEC MUTLOAD MINESTIMATE' versus Clinical Feature #4: 'PATHOLOGY_T_STAGE'
| nPatients | T0+T1 | T2 | T3 | T4 |
|---|---|---|---|---|
| ALL | 48 | 134 | 99 | 168 |
| 0 | 29 | 72 | 46 | 77 |
| HIGH | 7 | 25 | 19 | 57 |
| LOW | 12 | 37 | 34 | 34 |
Figure S2. Get High-res Image Clustering Approach #1: 'APOBEC MUTLOAD MINESTIMATE' versus Clinical Feature #4: 'PATHOLOGY_T_STAGE'
P value = 0.00314 (Fisher's exact test), Q value = 0.027
Table S4. Clustering Approach #1: 'APOBEC MUTLOAD MINESTIMATE' versus Clinical Feature #6: 'GENDER'
| nPatients | FEMALE | MALE |
|---|---|---|
| ALL | 140 | 370 |
| 0 | 55 | 196 |
| HIGH | 50 | 79 |
| LOW | 35 | 95 |
Figure S3. Get High-res Image Clustering Approach #1: 'APOBEC MUTLOAD MINESTIMATE' versus Clinical Feature #6: 'GENDER'
P value = 0.0361 (Kruskal-Wallis (anova)), Q value = 0.16
Table S5. Clustering Approach #1: 'APOBEC MUTLOAD MINESTIMATE' versus Clinical Feature #9: 'NUMBER_PACK_YEARS_SMOKED'
| nPatients | Mean (Std.Dev) | |
|---|---|---|
| ALL | 286 | 46.3 (35.5) |
| 0 | 151 | 46.1 (35.5) |
| HIGH | 60 | 40.2 (30.7) |
| LOW | 75 | 51.4 (38.7) |
Figure S4. Get High-res Image Clustering Approach #1: 'APOBEC MUTLOAD MINESTIMATE' versus Clinical Feature #9: 'NUMBER_PACK_YEARS_SMOKED'
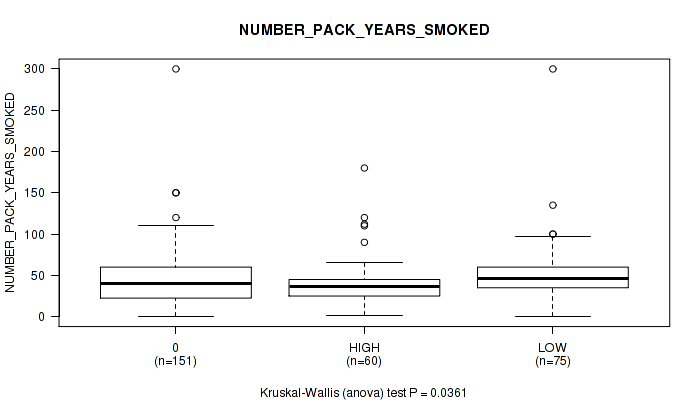
Table S6. Description of APOBEC group #2: 'APOBEC ENRICH'
| Cluster Labels | FC.HIGH.SIG | FC.LOW.NONSIG | FC.NEUTRAL |
|---|---|---|---|
| Number of samples | 219 | 250 | 41 |
P value = 0.00254 (Kruskal-Wallis (anova)), Q value = 0.027
Table S7. Clustering Approach #2: 'APOBEC ENRICH' versus Clinical Feature #2: 'YEARS_TO_BIRTH'
| nPatients | Mean (Std.Dev) | |
|---|---|---|
| ALL | 510 | 61.0 (12.0) |
| FC.HIGH.SIG | 219 | 63.4 (11.3) |
| FC.LOW.NONSIG | 250 | 58.8 (12.2) |
| FC.NEUTRAL | 41 | 61.2 (12.1) |
Figure S5. Get High-res Image Clustering Approach #2: 'APOBEC ENRICH' versus Clinical Feature #2: 'YEARS_TO_BIRTH'
P value = 0.0125 (Fisher's exact test), Q value = 0.065
Table S8. Clustering Approach #2: 'APOBEC ENRICH' versus Clinical Feature #6: 'GENDER'
| nPatients | FEMALE | MALE |
|---|---|---|
| ALL | 140 | 370 |
| FC.HIGH.SIG | 72 | 147 |
| FC.LOW.NONSIG | 54 | 196 |
| FC.NEUTRAL | 14 | 27 |
Figure S6. Get High-res Image Clustering Approach #2: 'APOBEC ENRICH' versus Clinical Feature #6: 'GENDER'
P value = 0.0451 (Kruskal-Wallis (anova)), Q value = 0.17
Table S9. Clustering Approach #2: 'APOBEC ENRICH' versus Clinical Feature #10: 'YEAR_OF_TOBACCO_SMOKING_ONSET'
| nPatients | Mean (Std.Dev) | |
|---|---|---|
| ALL | 274 | 1967.0 (12.6) |
| FC.HIGH.SIG | 115 | 1966.6 (13.0) |
| FC.LOW.NONSIG | 138 | 1968.2 (12.0) |
| FC.NEUTRAL | 21 | 1961.1 (13.5) |
Figure S7. Get High-res Image Clustering Approach #2: 'APOBEC ENRICH' versus Clinical Feature #10: 'YEAR_OF_TOBACCO_SMOKING_ONSET'
P value = 0.0611 (Kruskal-Wallis (anova)), Q value = 0.2
Table S10. Clustering Approach #2: 'APOBEC ENRICH' versus Clinical Feature #11: 'NUMBER_OF_LYMPH_NODES'
| nPatients | Mean (Std.Dev) | |
|---|---|---|
| ALL | 400 | 2.2 (4.3) |
| FC.HIGH.SIG | 168 | 2.8 (5.9) |
| FC.LOW.NONSIG | 201 | 1.8 (2.6) |
| FC.NEUTRAL | 31 | 1.2 (1.9) |
Figure S8. Get High-res Image Clustering Approach #2: 'APOBEC ENRICH' versus Clinical Feature #11: 'NUMBER_OF_LYMPH_NODES'
-
APOBEC groups file = /xchip/cga/gdac-prod/tcga-gdac/jobResults/APOBEC_Pipelines/HNSC-TP/20203263/APOBEC_clinical_corr_input_20214860/APOBEC_for_clinical.correlaion.input.categorical.txt
-
Clinical data file = /xchip/cga/gdac-prod/tcga-gdac/jobResults/Append_Data/HNSC-TP/19775211/HNSC-TP.merged_data.txt
-
Number of patients = 510
-
Number of selected clinical features = 13
APOBEC classification based on APOBEC_MutLoad_MinEstimate : a. APOBEC non group -- samples with zero value, b. APOBEC hig group -- samples above median value in non zero samples, c. APOBEC hig group -- samples below median value in non zero samples.
APOBEC classification based on APOBEC_enrich : a. No Enrichmment group -- all samples with BH_Fisher_p-value_tCw >=0.05, b. Small enrichment group -- samples with BH_Fisher_p-value_tCw = < 0.05 and APOBEC_enrich=<2, c. High enrichment gruop -- samples with BH_Fisher_p-value_tCw =< 0.05 and APOBEC_enrich>2.
For survival clinical features, the Kaplan-Meier survival curves of tumors with and without gene mutations were plotted and the statistical significance P values were estimated by logrank test (Bland and Altman 2004) using the 'survdiff' function in R
For binary clinical features, two-tailed Fisher's exact tests (Fisher 1922) were used to estimate the P values using the 'fisher.test' function in R
For multiple hypothesis correction, Q value is the False Discovery Rate (FDR) analogue of the P value (Benjamini and Hochberg 1995), defined as the minimum FDR at which the test may be called significant. We used the 'Benjamini and Hochberg' method of 'p.adjust' function in R to convert P values into Q values.
In addition to the links below, the full results of the analysis summarized in this report can also be downloaded programmatically using firehose_get, or interactively from either the Broad GDAC website or TCGA Data Coordination Center Portal.