This pipeline computes the correlation between significant arm-level copy number variations (cnvs) and selected clinical features.
Testing the association between copy number variation 63 arm-level events and 12 clinical features across 66 patients, 8 significant findings detected with Q value < 0.25.
-
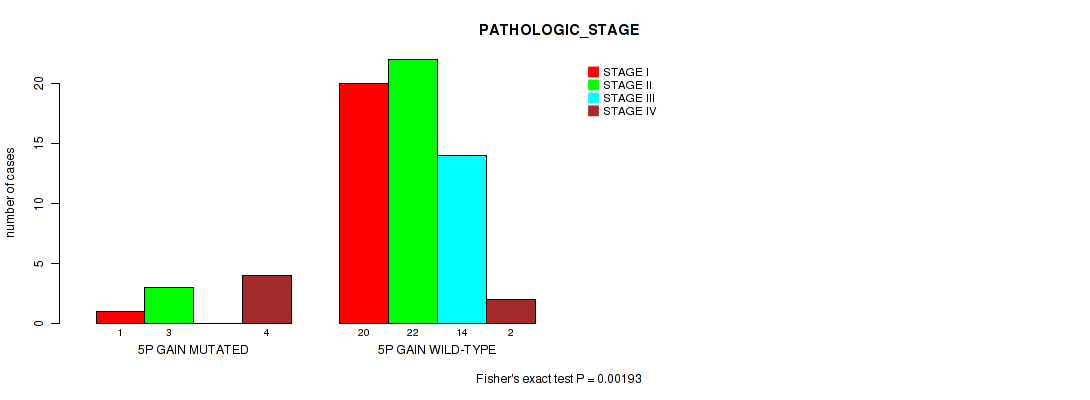
5p gain cnv correlated to 'PATHOLOGIC_STAGE'.
-
5q gain cnv correlated to 'PATHOLOGIC_STAGE'.
-
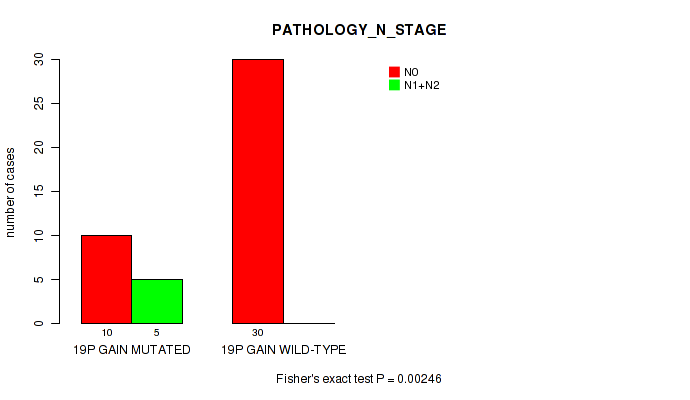
19p gain cnv correlated to 'PATHOLOGY_N_STAGE'.
-
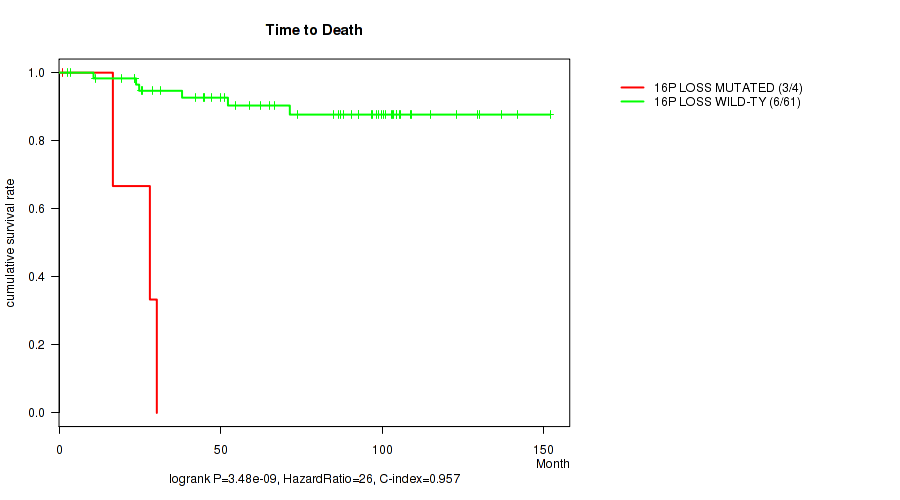
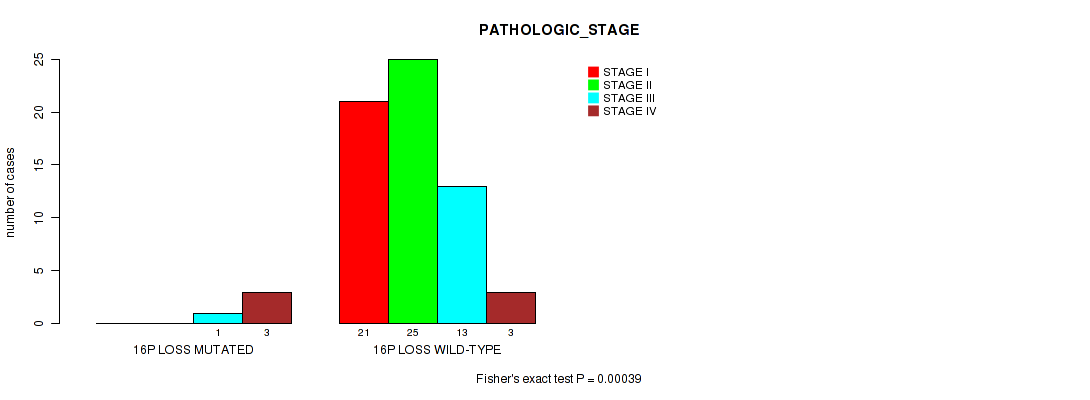
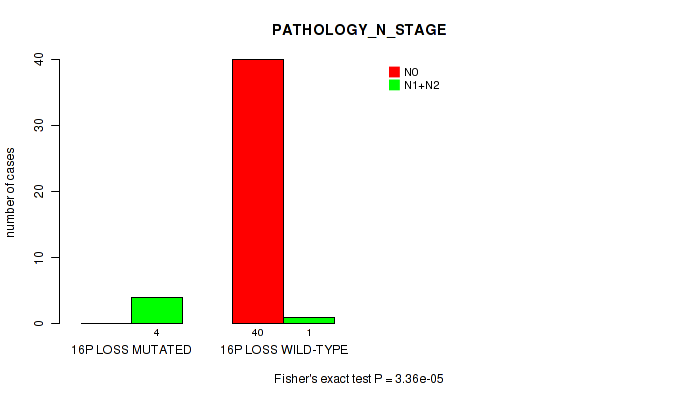
16p loss cnv correlated to 'Time to Death', 'PATHOLOGIC_STAGE', and 'PATHOLOGY_N_STAGE'.
-
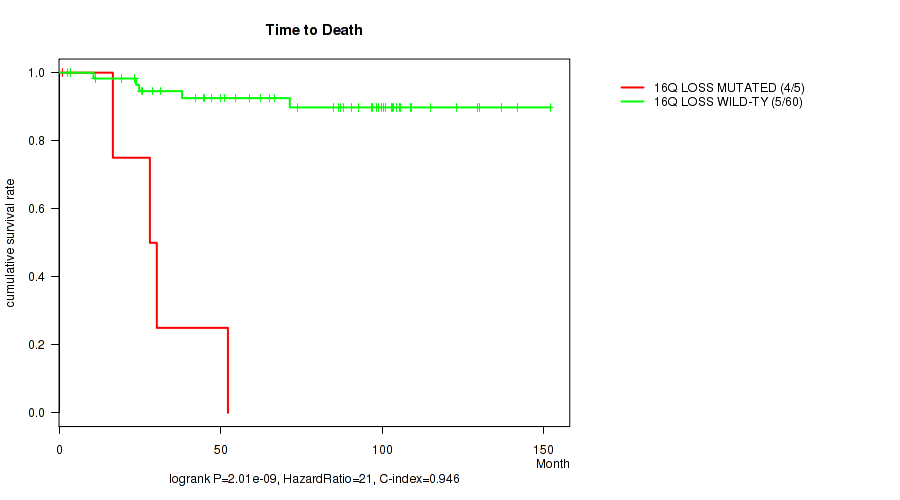
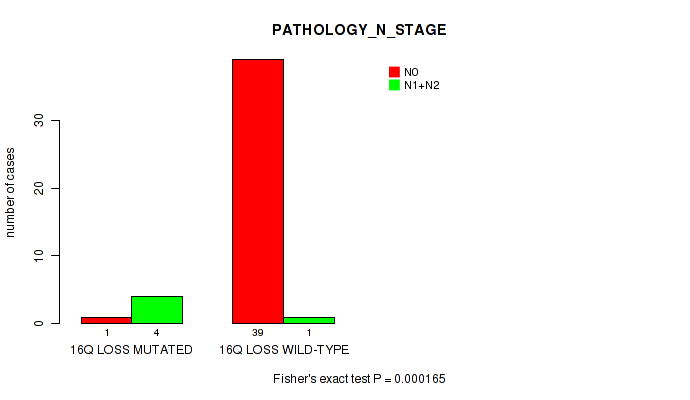
16q loss cnv correlated to 'Time to Death' and 'PATHOLOGY_N_STAGE'.
Table 1. Get Full Table Overview of the association between significant copy number variation of 63 arm-level events and 12 clinical features. Shown in the table are P values (Q values). Thresholded by Q value < 0.25, 8 significant findings detected.
|
Clinical Features |
Time to Death |
YEARS TO BIRTH |
PATHOLOGIC STAGE |
PATHOLOGY T STAGE |
PATHOLOGY N STAGE |
PATHOLOGY M STAGE |
GENDER |
KARNOFSKY PERFORMANCE SCORE |
NUMBER PACK YEARS SMOKED |
YEAR OF TOBACCO SMOKING ONSET |
RACE | ETHNICITY | ||
| nCNV (%) | nWild-Type | logrank test | Wilcoxon-test | Fisher's exact test | Fisher's exact test | Fisher's exact test | Fisher's exact test | Fisher's exact test | Fisher's exact test | Wilcoxon-test | Wilcoxon-test | Fisher's exact test | Fisher's exact test | |
| 16p loss | 4 (6%) | 62 |
3.48e-09 (1.32e-06) |
0.519 (1.00) |
0.00039 (0.059) |
0.00657 (0.354) |
3.36e-05 (0.00846) |
0.11 (0.723) |
0.639 (1.00) |
1 (1.00) |
1 (1.00) |
|||
| 16q loss | 5 (8%) | 61 |
2.01e-09 (1.32e-06) |
0.221 (0.888) |
0.00442 (0.304) |
0.0482 (0.587) |
0.000165 (0.0311) |
0.11 (0.723) |
0.641 (1.00) |
1 (1.00) |
1 (1.00) |
|||
| 5p gain | 8 (12%) | 58 |
0.00702 (0.354) |
0.0661 (0.649) |
0.00193 (0.208) |
0.363 (1.00) |
0.0874 (0.654) |
0.00952 (0.379) |
0.455 (1.00) |
1 (1.00) |
1 (1.00) |
|||
| 5q gain | 8 (12%) | 58 |
0.00702 (0.354) |
0.0661 (0.649) |
0.00141 (0.178) |
0.365 (1.00) |
0.0874 (0.654) |
0.00952 (0.379) |
0.455 (1.00) |
1 (1.00) |
1 (1.00) |
|||
| 19p gain | 19 (29%) | 47 |
0.0192 (0.502) |
0.0291 (0.569) |
0.0152 (0.441) |
0.519 (1.00) |
0.00246 (0.232) |
0.0571 (0.617) |
0.412 (1.00) |
1 (1.00) |
0.784 (1.00) |
0.0606 (0.619) |
0.256 (0.936) |
0.29 (0.94) |
| 3p gain | 8 (12%) | 58 |
0.00834 (0.371) |
0.0837 (0.654) |
0.0163 (0.441) |
0.466 (1.00) |
0.0327 (0.569) |
0.213 (0.869) |
0.128 (0.723) |
1 (1.00) |
0.292 (0.94) |
1 (1.00) |
||
| 3q gain | 8 (12%) | 58 |
0.00834 (0.371) |
0.0837 (0.654) |
0.0159 (0.441) |
0.467 (1.00) |
0.0327 (0.569) |
0.213 (0.869) |
0.128 (0.723) |
1 (1.00) |
0.295 (0.94) |
1 (1.00) |
||
| 4p gain | 24 (36%) | 42 |
0.885 (1.00) |
0.265 (0.94) |
0.141 (0.731) |
0.81 (1.00) |
1 (1.00) |
0.124 (0.723) |
1 (1.00) |
0.528 (1.00) |
0.0467 (0.579) |
0.0369 (0.569) |
1 (1.00) |
0.287 (0.94) |
| 4q gain | 24 (36%) | 42 |
0.885 (1.00) |
0.265 (0.94) |
0.142 (0.731) |
0.81 (1.00) |
1 (1.00) |
0.124 (0.723) |
1 (1.00) |
0.528 (1.00) |
0.0467 (0.579) |
0.0369 (0.569) |
1 (1.00) |
0.287 (0.94) |
| 7p gain | 24 (36%) | 42 |
0.0281 (0.569) |
0.172 (0.777) |
0.361 (1.00) |
0.69 (1.00) |
0.636 (1.00) |
0.124 (0.723) |
0.195 (0.847) |
0.528 (1.00) |
0.784 (1.00) |
0.0606 (0.619) |
1 (1.00) |
0.303 (0.94) |
| 7q gain | 24 (36%) | 42 |
0.0281 (0.569) |
0.172 (0.777) |
0.356 (1.00) |
0.69 (1.00) |
0.636 (1.00) |
0.124 (0.723) |
0.195 (0.847) |
0.528 (1.00) |
0.784 (1.00) |
0.0606 (0.619) |
1 (1.00) |
0.303 (0.94) |
| 8p gain | 17 (26%) | 49 |
0.926 (1.00) |
0.142 (0.731) |
0.389 (1.00) |
0.407 (1.00) |
1 (1.00) |
0.443 (1.00) |
0.776 (1.00) |
0.528 (1.00) |
0.394 (1.00) |
1 (1.00) |
0.588 (1.00) |
|
| 8q gain | 18 (27%) | 48 |
0.926 (1.00) |
0.15 (0.735) |
0.228 (0.894) |
0.45 (1.00) |
1 (1.00) |
0.0714 (0.654) |
0.577 (1.00) |
0.528 (1.00) |
0.394 (1.00) |
1 (1.00) |
0.588 (1.00) |
|
| 9p gain | 10 (15%) | 56 |
0.624 (1.00) |
0.979 (1.00) |
0.12 (0.723) |
0.194 (0.847) |
0.306 (0.94) |
1 (1.00) |
1 (1.00) |
1 (1.00) |
0.759 (1.00) |
0.375 (1.00) |
0.535 (1.00) |
|
| 9q gain | 10 (15%) | 56 |
0.624 (1.00) |
0.979 (1.00) |
0.123 (0.723) |
0.193 (0.847) |
0.306 (0.94) |
1 (1.00) |
1 (1.00) |
1 (1.00) |
0.759 (1.00) |
0.373 (1.00) |
0.535 (1.00) |
|
| 10p gain | 4 (6%) | 62 |
0.558 (1.00) |
0.34 (1.00) |
0.267 (0.94) |
0.451 (1.00) |
1 (1.00) |
1 (1.00) |
1 (1.00) |
1 (1.00) |
||||
| 11p gain | 15 (23%) | 51 |
0.956 (1.00) |
0.812 (1.00) |
0.742 (1.00) |
0.812 (1.00) |
0.617 (1.00) |
0.443 (1.00) |
1 (1.00) |
1 (1.00) |
0.0467 (0.579) |
0.0369 (0.569) |
0.559 (1.00) |
0.0756 (0.654) |
| 11q gain | 15 (23%) | 51 |
0.485 (1.00) |
0.945 (1.00) |
0.741 (1.00) |
0.81 (1.00) |
1 (1.00) |
0.443 (1.00) |
1 (1.00) |
1 (1.00) |
0.0467 (0.579) |
0.0369 (0.569) |
0.56 (1.00) |
0.0756 (0.654) |
| 12p gain | 19 (29%) | 47 |
0.661 (1.00) |
0.0137 (0.415) |
0.0772 (0.654) |
0.317 (0.958) |
1 (1.00) |
0.0873 (0.654) |
0.412 (1.00) |
0.528 (1.00) |
0.357 (1.00) |
1 (1.00) |
1 (1.00) |
|
| 12q gain | 20 (30%) | 46 |
0.209 (0.869) |
0.0696 (0.654) |
0.111 (0.723) |
0.71 (1.00) |
0.33 (0.993) |
0.0873 (0.654) |
0.593 (1.00) |
0.528 (1.00) |
0.234 (0.894) |
0.0369 (0.569) |
0.805 (1.00) |
1 (1.00) |
| 14q gain | 21 (32%) | 45 |
0.819 (1.00) |
0.144 (0.731) |
0.0967 (0.697) |
0.381 (1.00) |
1 (1.00) |
0.105 (0.723) |
0.794 (1.00) |
0.528 (1.00) |
0.234 (0.894) |
0.0369 (0.569) |
1 (1.00) |
0.609 (1.00) |
| 15q gain | 21 (32%) | 45 |
0.34 (1.00) |
0.283 (0.94) |
0.411 (1.00) |
0.48 (1.00) |
0.35 (1.00) |
0.105 (0.723) |
0.794 (1.00) |
0.528 (1.00) |
1 (1.00) |
0.233 (0.894) |
0.815 (1.00) |
0.124 (0.723) |
| 16p gain | 21 (32%) | 45 |
0.217 (0.877) |
0.995 (1.00) |
0.472 (1.00) |
0.404 (1.00) |
0.635 (1.00) |
1 (1.00) |
1 (1.00) |
0.528 (1.00) |
0.0467 (0.579) |
0.0369 (0.569) |
1 (1.00) |
0.124 (0.723) |
| 16q gain | 21 (32%) | 45 |
0.217 (0.877) |
0.995 (1.00) |
0.475 (1.00) |
0.404 (1.00) |
0.635 (1.00) |
1 (1.00) |
1 (1.00) |
0.528 (1.00) |
0.0467 (0.579) |
0.0369 (0.569) |
1 (1.00) |
0.124 (0.723) |
| 18p gain | 17 (26%) | 49 |
0.872 (1.00) |
0.278 (0.94) |
0.293 (0.94) |
0.432 (1.00) |
0.303 (0.94) |
0.4 (1.00) |
0.776 (1.00) |
1 (1.00) |
0.298 (0.94) |
1 (1.00) |
0.57 (1.00) |
|
| 18q gain | 16 (24%) | 50 |
0.355 (1.00) |
0.525 (1.00) |
0.31 (0.943) |
0.199 (0.858) |
0.303 (0.94) |
0.4 (1.00) |
1 (1.00) |
1 (1.00) |
0.298 (0.94) |
1 (1.00) |
0.305 (0.94) |
|
| 19q gain | 17 (26%) | 49 |
0.106 (0.723) |
0.0137 (0.415) |
0.297 (0.94) |
0.644 (1.00) |
0.136 (0.731) |
0.0444 (0.579) |
0.776 (1.00) |
1 (1.00) |
1 (1.00) |
0.233 (0.894) |
0.594 (1.00) |
0.29 (0.94) |
| 20p gain | 20 (30%) | 46 |
0.799 (1.00) |
0.128 (0.723) |
0.368 (1.00) |
0.793 (1.00) |
0.35 (1.00) |
0.524 (1.00) |
0.593 (1.00) |
0.528 (1.00) |
0.234 (0.894) |
0.0369 (0.569) |
0.364 (1.00) |
0.588 (1.00) |
| 20q gain | 21 (32%) | 45 |
0.331 (0.993) |
0.053 (0.615) |
0.136 (0.731) |
0.845 (1.00) |
0.35 (1.00) |
0.524 (1.00) |
0.433 (1.00) |
0.528 (1.00) |
0.234 (0.894) |
0.0369 (0.569) |
0.367 (1.00) |
0.609 (1.00) |
| 21q gain | 4 (6%) | 62 |
0.496 (1.00) |
0.591 (1.00) |
1 (1.00) |
1 (1.00) |
1 (1.00) |
1 (1.00) |
1 (1.00) |
1 (1.00) |
||||
| 22q gain | 19 (29%) | 47 |
0.164 (0.767) |
0.415 (1.00) |
0.49 (1.00) |
0.521 (1.00) |
0.166 (0.768) |
0.524 (1.00) |
0.412 (1.00) |
1 (1.00) |
0.784 (1.00) |
0.0606 (0.619) |
0.794 (1.00) |
0.588 (1.00) |
| xp gain | 7 (11%) | 59 |
0.406 (1.00) |
0.95 (1.00) |
0.698 (1.00) |
0.881 (1.00) |
1 (1.00) |
0.213 (0.869) |
0.691 (1.00) |
1 (1.00) |
0.519 (1.00) |
0.466 (1.00) |
||
| xq gain | 6 (9%) | 60 |
0.412 (1.00) |
0.815 (1.00) |
0.383 (1.00) |
0.662 (1.00) |
1 (1.00) |
0.213 (0.869) |
0.388 (1.00) |
1 (1.00) |
0.459 (1.00) |
0.39 (1.00) |
||
| 1p loss | 53 (80%) | 13 |
0.431 (1.00) |
0.478 (1.00) |
0.0287 (0.569) |
0.0408 (0.579) |
1 (1.00) |
0.162 (0.76) |
0.534 (1.00) |
0.51 (1.00) |
0.609 (1.00) |
1 (1.00) |
1 (1.00) |
|
| 1q loss | 52 (79%) | 14 |
0.823 (1.00) |
0.456 (1.00) |
0.00626 (0.354) |
0.0131 (0.415) |
0.529 (1.00) |
0.213 (0.869) |
0.367 (1.00) |
0.51 (1.00) |
1 (1.00) |
1 (1.00) |
||
| 2p loss | 46 (70%) | 20 |
0.941 (1.00) |
0.241 (0.905) |
0.145 (0.731) |
0.114 (0.723) |
1 (1.00) |
0.4 (1.00) |
0.284 (0.94) |
0.51 (1.00) |
1 (1.00) |
1 (1.00) |
||
| 2q loss | 46 (70%) | 20 |
0.941 (1.00) |
0.241 (0.905) |
0.145 (0.731) |
0.113 (0.723) |
1 (1.00) |
0.4 (1.00) |
0.284 (0.94) |
0.51 (1.00) |
1 (1.00) |
1 (1.00) |
||
| 3p loss | 9 (14%) | 57 |
0.193 (0.847) |
0.0465 (0.579) |
0.0756 (0.654) |
0.0227 (0.569) |
1 (1.00) |
1 (1.00) |
0.469 (1.00) |
1 (1.00) |
0.535 (1.00) |
|||
| 3q loss | 8 (12%) | 58 |
0.231 (0.894) |
0.107 (0.723) |
0.142 (0.731) |
0.054 (0.615) |
1 (1.00) |
1 (1.00) |
0.256 (0.936) |
1 (1.00) |
0.535 (1.00) |
|||
| 5p loss | 10 (15%) | 56 |
0.771 (1.00) |
0.642 (1.00) |
0.134 (0.731) |
0.0842 (0.654) |
1 (1.00) |
1 (1.00) |
1 (1.00) |
0.423 (1.00) |
0.155 (0.752) |
0.0736 (0.654) |
0.159 (0.752) |
0.121 (0.723) |
| 5q loss | 10 (15%) | 56 |
0.771 (1.00) |
0.642 (1.00) |
0.133 (0.731) |
0.0835 (0.654) |
1 (1.00) |
1 (1.00) |
1 (1.00) |
0.423 (1.00) |
0.155 (0.752) |
0.0736 (0.654) |
0.159 (0.752) |
0.121 (0.723) |
| 6p loss | 51 (77%) | 15 |
0.579 (1.00) |
0.379 (1.00) |
0.0794 (0.654) |
0.0565 (0.617) |
0.568 (1.00) |
0.356 (1.00) |
0.244 (0.905) |
0.51 (1.00) |
1 (1.00) |
1 (1.00) |
||
| 6q loss | 51 (77%) | 15 |
0.579 (1.00) |
0.379 (1.00) |
0.0841 (0.654) |
0.0549 (0.615) |
0.568 (1.00) |
0.356 (1.00) |
0.244 (0.905) |
0.51 (1.00) |
1 (1.00) |
1 (1.00) |
||
| 8p loss | 9 (14%) | 57 |
0.204 (0.869) |
0.779 (1.00) |
0.741 (1.00) |
0.438 (1.00) |
1 (1.00) |
1 (1.00) |
0.727 (1.00) |
1 (1.00) |
0.615 (1.00) |
0.566 (1.00) |
||
| 8q loss | 8 (12%) | 58 |
0.243 (0.905) |
0.575 (1.00) |
0.7 (1.00) |
0.411 (1.00) |
1 (1.00) |
1 (1.00) |
1 (1.00) |
1 (1.00) |
0.567 (1.00) |
1 (1.00) |
||
| 9p loss | 10 (15%) | 56 |
0.00364 (0.275) |
0.0116 (0.415) |
1 (1.00) |
1 (1.00) |
0.529 (1.00) |
1 (1.00) |
0.508 (1.00) |
1 (1.00) |
0.535 (1.00) |
|||
| 9q loss | 10 (15%) | 56 |
0.00364 (0.275) |
0.0116 (0.415) |
1 (1.00) |
1 (1.00) |
0.529 (1.00) |
1 (1.00) |
0.508 (1.00) |
1 (1.00) |
0.535 (1.00) |
|||
| 10p loss | 48 (73%) | 18 |
0.128 (0.723) |
0.762 (1.00) |
0.546 (1.00) |
0.395 (1.00) |
1 (1.00) |
0.31 (0.943) |
1 (1.00) |
0.559 (1.00) |
0.26 (0.938) |
1 (1.00) |
1 (1.00) |
|
| 10q loss | 49 (74%) | 17 |
0.146 (0.731) |
0.953 (1.00) |
0.347 (1.00) |
0.21 (0.869) |
1 (1.00) |
0.31 (0.943) |
1 (1.00) |
0.559 (1.00) |
0.26 (0.938) |
1 (1.00) |
1 (1.00) |
|
| 11p loss | 7 (11%) | 59 |
0.305 (0.94) |
0.0527 (0.615) |
0.0962 (0.697) |
0.0774 (0.654) |
0.461 (1.00) |
1 (1.00) |
0.691 (1.00) |
1 (1.00) |
1 (1.00) |
1 (1.00) |
||
| 11q loss | 7 (11%) | 59 |
0.305 (0.94) |
0.0527 (0.615) |
0.0961 (0.697) |
0.0784 (0.654) |
0.461 (1.00) |
1 (1.00) |
0.691 (1.00) |
1 (1.00) |
1 (1.00) |
1 (1.00) |
||
| 13q loss | 43 (65%) | 23 |
0.545 (1.00) |
0.0641 (0.646) |
0.443 (1.00) |
0.354 (1.00) |
0.301 (0.94) |
1 (1.00) |
0.294 (0.94) |
1 (1.00) |
0.474 (1.00) |
0.371 (1.00) |
0.818 (1.00) |
1 (1.00) |
| 17p loss | 50 (76%) | 16 |
0.788 (1.00) |
0.149 (0.734) |
0.073 (0.654) |
0.0426 (0.579) |
0.568 (1.00) |
0.356 (1.00) |
0.158 (0.752) |
0.51 (1.00) |
1 (1.00) |
1 (1.00) |
||
| 17q loss | 50 (76%) | 16 |
0.788 (1.00) |
0.149 (0.734) |
0.075 (0.654) |
0.0422 (0.579) |
0.568 (1.00) |
0.356 (1.00) |
0.158 (0.752) |
0.51 (1.00) |
1 (1.00) |
1 (1.00) |
||
| 18p loss | 8 (12%) | 58 |
0.976 (1.00) |
0.455 (1.00) |
0.445 (1.00) |
0.899 (1.00) |
0.211 (0.869) |
1 (1.00) |
0.256 (0.936) |
1 (1.00) |
0.295 (0.94) |
1 (1.00) |
||
| 18q loss | 10 (15%) | 56 |
0.433 (1.00) |
0.343 (1.00) |
0.139 (0.731) |
0.833 (1.00) |
0.258 (0.936) |
1 (1.00) |
0.295 (0.94) |
1 (1.00) |
0.376 (1.00) |
1 (1.00) |
||
| 19q loss | 3 (5%) | 63 |
0.132 (0.731) |
0.423 (1.00) |
0.0122 (0.415) |
0.193 (0.847) |
0.0289 (0.569) |
1 (1.00) |
1 (1.00) |
0.101 (0.718) |
0.111 (0.723) |
|||
| 20p loss | 4 (6%) | 62 |
0.631 (1.00) |
0.237 (0.9) |
0.139 (0.731) |
0.142 (0.731) |
0.304 (0.94) |
1 (1.00) |
1 (1.00) |
1 (1.00) |
1 (1.00) |
1 (1.00) |
||
| 20q loss | 3 (5%) | 63 |
0.436 (1.00) |
0.432 (1.00) |
0.0392 (0.579) |
0.0258 (0.569) |
0.304 (0.94) |
1 (1.00) |
1 (1.00) |
1 (1.00) |
||||
| 21q loss | 35 (53%) | 31 |
0.0353 (0.569) |
0.375 (1.00) |
0.906 (1.00) |
0.781 (1.00) |
0.0731 (0.654) |
1 (1.00) |
0.805 (1.00) |
0.231 (0.894) |
0.705 (1.00) |
0.112 (0.723) |
0.544 (1.00) |
0.613 (1.00) |
| 22q loss | 8 (12%) | 58 |
0.29 (0.94) |
0.783 (1.00) |
0.177 (0.798) |
1 (1.00) |
0.211 (0.869) |
0.262 (0.938) |
0.0553 (0.615) |
1 (1.00) |
0.567 (1.00) |
0.39 (1.00) |
||
| xp loss | 38 (58%) | 28 |
0.865 (1.00) |
0.0808 (0.654) |
0.291 (0.94) |
0.546 (1.00) |
1 (1.00) |
1 (1.00) |
0.128 (0.723) |
1 (1.00) |
0.17 (0.777) |
0.112 (0.723) |
0.813 (1.00) |
1 (1.00) |
| xq loss | 39 (59%) | 27 |
0.346 (1.00) |
0.0923 (0.684) |
0.305 (0.94) |
0.361 (1.00) |
1 (1.00) |
1 (1.00) |
0.136 (0.731) |
1 (1.00) |
0.17 (0.777) |
0.233 (0.894) |
0.818 (1.00) |
1 (1.00) |
P value = 0.00193 (Fisher's exact test), Q value = 0.21
Table S1. Gene #5: '5p gain' versus Clinical Feature #3: 'PATHOLOGIC_STAGE'
| nPatients | STAGE I | STAGE II | STAGE III | STAGE IV |
|---|---|---|---|---|
| ALL | 21 | 25 | 14 | 6 |
| 5P GAIN MUTATED | 1 | 3 | 0 | 4 |
| 5P GAIN WILD-TYPE | 20 | 22 | 14 | 2 |
Figure S1. Get High-res Image Gene #5: '5p gain' versus Clinical Feature #3: 'PATHOLOGIC_STAGE'
P value = 0.00141 (Fisher's exact test), Q value = 0.18
Table S2. Gene #6: '5q gain' versus Clinical Feature #3: 'PATHOLOGIC_STAGE'
| nPatients | STAGE I | STAGE II | STAGE III | STAGE IV |
|---|---|---|---|---|
| ALL | 21 | 25 | 14 | 6 |
| 5Q GAIN MUTATED | 1 | 3 | 0 | 4 |
| 5Q GAIN WILD-TYPE | 20 | 22 | 14 | 2 |
Figure S2. Get High-res Image Gene #6: '5q gain' versus Clinical Feature #3: 'PATHOLOGIC_STAGE'

P value = 0.00246 (Fisher's exact test), Q value = 0.23
Table S3. Gene #24: '19p gain' versus Clinical Feature #5: 'PATHOLOGY_N_STAGE'
| nPatients | N0 | N1+N2 |
|---|---|---|
| ALL | 40 | 5 |
| 19P GAIN MUTATED | 10 | 5 |
| 19P GAIN WILD-TYPE | 30 | 0 |
Figure S3. Get High-res Image Gene #24: '19p gain' versus Clinical Feature #5: 'PATHOLOGY_N_STAGE'
P value = 3.48e-09 (logrank test), Q value = 1.3e-06
Table S4. Gene #51: '16p loss' versus Clinical Feature #1: 'Time to Death'
| nPatients | nDeath | Duration Range (Median), Month | |
|---|---|---|---|
| ALL | 65 | 9 | 1.0 - 152.0 (73.9) |
| 16P LOSS MUTATED | 4 | 3 | 1.0 - 30.2 (22.4) |
| 16P LOSS WILD-TYPE | 61 | 6 | 2.5 - 152.0 (86.6) |
Figure S4. Get High-res Image Gene #51: '16p loss' versus Clinical Feature #1: 'Time to Death'
P value = 0.00039 (Fisher's exact test), Q value = 0.059
Table S5. Gene #51: '16p loss' versus Clinical Feature #3: 'PATHOLOGIC_STAGE'
| nPatients | STAGE I | STAGE II | STAGE III | STAGE IV |
|---|---|---|---|---|
| ALL | 21 | 25 | 14 | 6 |
| 16P LOSS MUTATED | 0 | 0 | 1 | 3 |
| 16P LOSS WILD-TYPE | 21 | 25 | 13 | 3 |
Figure S5. Get High-res Image Gene #51: '16p loss' versus Clinical Feature #3: 'PATHOLOGIC_STAGE'
P value = 3.36e-05 (Fisher's exact test), Q value = 0.0085
Table S6. Gene #51: '16p loss' versus Clinical Feature #5: 'PATHOLOGY_N_STAGE'
| nPatients | N0 | N1+N2 |
|---|---|---|
| ALL | 40 | 5 |
| 16P LOSS MUTATED | 0 | 4 |
| 16P LOSS WILD-TYPE | 40 | 1 |
Figure S6. Get High-res Image Gene #51: '16p loss' versus Clinical Feature #5: 'PATHOLOGY_N_STAGE'
P value = 2.01e-09 (logrank test), Q value = 1.3e-06
Table S7. Gene #52: '16q loss' versus Clinical Feature #1: 'Time to Death'
| nPatients | nDeath | Duration Range (Median), Month | |
|---|---|---|---|
| ALL | 65 | 9 | 1.0 - 152.0 (73.9) |
| 16Q LOSS MUTATED | 5 | 4 | 1.0 - 52.3 (28.1) |
| 16Q LOSS WILD-TYPE | 60 | 5 | 2.5 - 152.0 (86.8) |
Figure S7. Get High-res Image Gene #52: '16q loss' versus Clinical Feature #1: 'Time to Death'
P value = 0.000165 (Fisher's exact test), Q value = 0.031
Table S8. Gene #52: '16q loss' versus Clinical Feature #5: 'PATHOLOGY_N_STAGE'
| nPatients | N0 | N1+N2 |
|---|---|---|
| ALL | 40 | 5 |
| 16Q LOSS MUTATED | 1 | 4 |
| 16Q LOSS WILD-TYPE | 39 | 1 |
Figure S8. Get High-res Image Gene #52: '16q loss' versus Clinical Feature #5: 'PATHOLOGY_N_STAGE'
-
Copy number data file = broad_values_by_arm.txt from GISTIC pipeline
-
Processed Copy number data file = /xchip/cga/gdac-prod/tcga-gdac/jobResults/GDAC_Correlate_Genomic_Events_Preprocess/KICH-TP/19781646/transformed.cor.cli.txt
-
Clinical data file = /xchip/cga/gdac-prod/tcga-gdac/jobResults/Append_Data/KICH-TP/19775213/KICH-TP.merged_data.txt
-
Number of patients = 66
-
Number of significantly arm-level cnvs = 63
-
Number of selected clinical features = 12
-
Exclude regions that fewer than K tumors have mutations, K = 3
For survival clinical features, the Kaplan-Meier survival curves of tumors with and without gene mutations were plotted and the statistical significance P values were estimated by logrank test (Bland and Altman 2004) using the 'survdiff' function in R
For binary or multi-class clinical features (nominal or ordinal), two-tailed Fisher's exact tests (Fisher 1922) were used to estimate the P values using the 'fisher.test' function in R
For multiple hypothesis correction, Q value is the False Discovery Rate (FDR) analogue of the P value (Benjamini and Hochberg 1995), defined as the minimum FDR at which the test may be called significant. We used the 'Benjamini and Hochberg' method of 'p.adjust' function in R to convert P values into Q values.
In addition to the links below, the full results of the analysis summarized in this report can also be downloaded programmatically using firehose_get, or interactively from either the Broad GDAC website or TCGA Data Coordination Center Portal.