This pipeline computes the correlation between significant copy number variation (cnv focal) genes and molecular subtypes.
Testing the association between copy number variation 2 focal events and 10 molecular subtypes across 66 patients, 4 significant findings detected with P value < 0.05 and Q value < 0.25.
-
amp_8q11.23 cnv correlated to 'RPPA_CHIERARCHICAL', 'MRNASEQ_CNMF', and 'MRNASEQ_CHIERARCHICAL'.
-
amp_15q22.31 cnv correlated to 'MRNASEQ_CNMF'.
Table 1. Get Full Table Overview of the association between significant copy number variation of 2 focal events and 10 molecular subtypes. Shown in the table are P values (Q values). Thresholded by P value < 0.05 and Q value < 0.25, 4 significant findings detected.
|
Clinical Features |
CN CNMF |
METHLYATION CNMF |
RPPA CNMF |
RPPA CHIERARCHICAL |
MRNASEQ CNMF |
MRNASEQ CHIERARCHICAL |
MIRSEQ CNMF |
MIRSEQ CHIERARCHICAL |
MIRSEQ MATURE CNMF |
MIRSEQ MATURE CHIERARCHICAL |
||
| nCNV (%) | nWild-Type | Fisher's exact test | Fisher's exact test | Fisher's exact test | Fisher's exact test | Fisher's exact test | Fisher's exact test | Fisher's exact test | Fisher's exact test | Fisher's exact test | Fisher's exact test | |
| amp 8q11 23 | 19 (29%) | 47 |
0.322 (0.493) |
0.626 (0.659) |
0.186 (0.456) |
0.0444 (0.217) |
0.00295 (0.059) |
0.0248 (0.165) |
1 (1.00) |
0.23 (0.459) |
0.363 (0.493) |
0.117 (0.39) |
| amp 15q22 31 | 23 (35%) | 43 |
0.0543 (0.217) |
0.582 (0.646) |
0.205 (0.456) |
0.37 (0.493) |
0.00635 (0.0635) |
0.182 (0.456) |
0.523 (0.646) |
0.299 (0.493) |
0.554 (0.646) |
0.364 (0.493) |
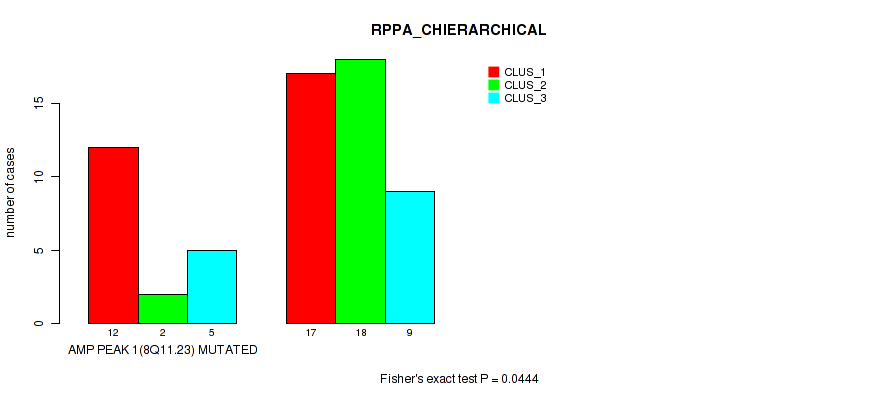
P value = 0.0444 (Fisher's exact test), Q value = 0.22
Table S1. Gene #1: 'amp_8q11.23' versus Molecular Subtype #4: 'RPPA_CHIERARCHICAL'
| nPatients | CLUS_1 | CLUS_2 | CLUS_3 |
|---|---|---|---|
| ALL | 29 | 20 | 14 |
| AMP PEAK 1(8Q11.23) MUTATED | 12 | 2 | 5 |
| AMP PEAK 1(8Q11.23) WILD-TYPE | 17 | 18 | 9 |
Figure S1. Get High-res Image Gene #1: 'amp_8q11.23' versus Molecular Subtype #4: 'RPPA_CHIERARCHICAL'
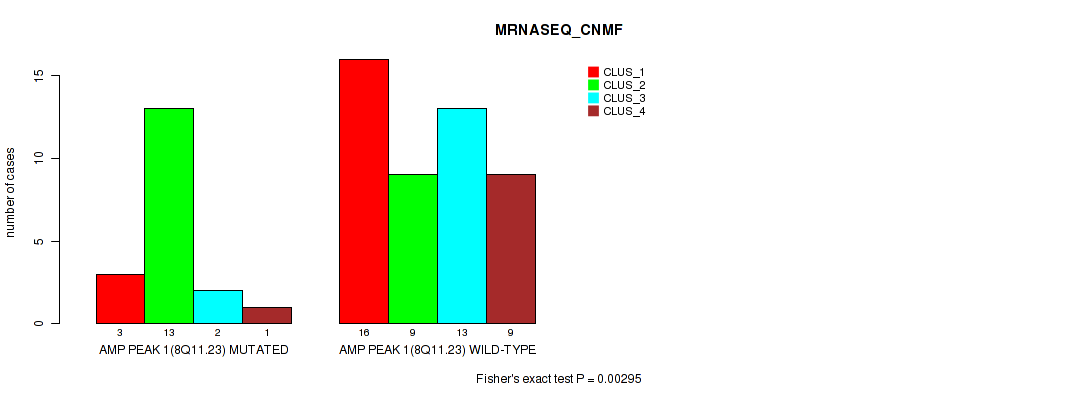
P value = 0.00295 (Fisher's exact test), Q value = 0.059
Table S2. Gene #1: 'amp_8q11.23' versus Molecular Subtype #5: 'MRNASEQ_CNMF'
| nPatients | CLUS_1 | CLUS_2 | CLUS_3 | CLUS_4 |
|---|---|---|---|---|
| ALL | 19 | 22 | 15 | 10 |
| AMP PEAK 1(8Q11.23) MUTATED | 3 | 13 | 2 | 1 |
| AMP PEAK 1(8Q11.23) WILD-TYPE | 16 | 9 | 13 | 9 |
Figure S2. Get High-res Image Gene #1: 'amp_8q11.23' versus Molecular Subtype #5: 'MRNASEQ_CNMF'
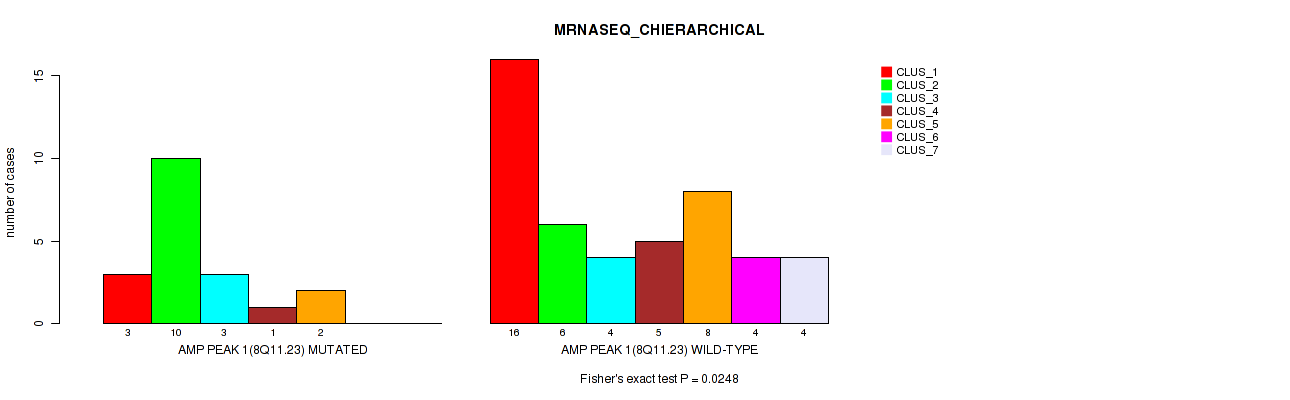
P value = 0.0248 (Fisher's exact test), Q value = 0.17
Table S3. Gene #1: 'amp_8q11.23' versus Molecular Subtype #6: 'MRNASEQ_CHIERARCHICAL'
| nPatients | CLUS_1 | CLUS_2 | CLUS_3 | CLUS_4 | CLUS_5 | CLUS_6 | CLUS_7 |
|---|---|---|---|---|---|---|---|
| ALL | 19 | 16 | 7 | 6 | 10 | 4 | 4 |
| AMP PEAK 1(8Q11.23) MUTATED | 3 | 10 | 3 | 1 | 2 | 0 | 0 |
| AMP PEAK 1(8Q11.23) WILD-TYPE | 16 | 6 | 4 | 5 | 8 | 4 | 4 |
Figure S3. Get High-res Image Gene #1: 'amp_8q11.23' versus Molecular Subtype #6: 'MRNASEQ_CHIERARCHICAL'
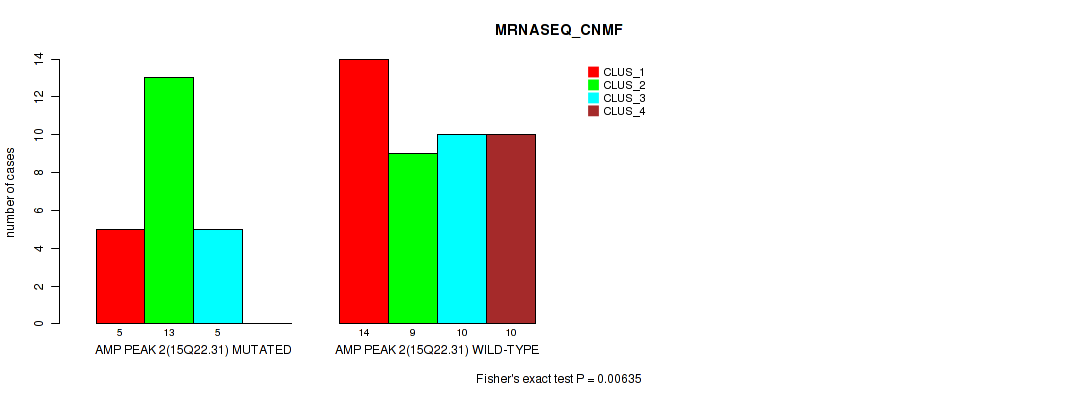
P value = 0.00635 (Fisher's exact test), Q value = 0.063
Table S4. Gene #2: 'amp_15q22.31' versus Molecular Subtype #5: 'MRNASEQ_CNMF'
| nPatients | CLUS_1 | CLUS_2 | CLUS_3 | CLUS_4 |
|---|---|---|---|---|
| ALL | 19 | 22 | 15 | 10 |
| AMP PEAK 2(15Q22.31) MUTATED | 5 | 13 | 5 | 0 |
| AMP PEAK 2(15Q22.31) WILD-TYPE | 14 | 9 | 10 | 10 |
Figure S4. Get High-res Image Gene #2: 'amp_15q22.31' versus Molecular Subtype #5: 'MRNASEQ_CNMF'
-
Copy number data file = all_lesions.txt from GISTIC pipeline
-
Processed Copy number data file = /xchip/cga/gdac-prod/tcga-gdac/jobResults/GDAC_Correlate_Genomic_Events_Preprocess/KICH-TP/20146429/transformed.cor.cli.txt
-
Molecular subtype file = /xchip/cga/gdac-prod/tcga-gdac/jobResults/GDAC_mergedClustering/KICH-TP/20147307/KICH-TP.transferedmergedcluster.txt
-
Number of patients = 66
-
Number of significantly focal cnvs = 2
-
Number of molecular subtypes = 10
-
Exclude genes that fewer than K tumors have alterations, K = 3
For binary or multi-class clinical features (nominal or ordinal), two-tailed Fisher's exact tests (Fisher 1922) were used to estimate the P values using the 'fisher.test' function in R
For multiple hypothesis correction, Q value is the False Discovery Rate (FDR) analogue of the P value (Benjamini and Hochberg 1995), defined as the minimum FDR at which the test may be called significant. We used the 'Benjamini and Hochberg' method of 'p.adjust' function in R to convert P values into Q values.
In addition to the links below, the full results of the analysis summarized in this report can also be downloaded programmatically using firehose_get, or interactively from either the Broad GDAC website or TCGA Data Coordination Center Portal.