This pipeline inspects significant overlapping pathway genesets for a given gene list using a hypergeometric test. For the gene set database, we uses GSEA MSigDB Class2: Canonical Pathways DB as a geneset data. Further details about the MsigDB genesets, please visit The Broad Institute GSEA MsigDB
For a given gene list, a hypergeometric test was tried to find significant overlapping canonical pathway gene sets. In terms of FDR adjusted p.values, top 5 significant overlapping gene sets are listed as below.
-
KEGG_CELL_CYCLE, KEGG_PATHWAYS_IN_CANCER, KEGG_GLIOMA, KEGG_PROSTATE_CANCER, KEGG_MELANOMA
Table 1. Get Full Table This table shows significant genesets in which at least one gene is found and its FDR adjusted p.value is smaller than 0.05. the hypergeometric p-value is a probability of randomly drawing x or more successes(gene overlaps in geneset databse) from the population (gene universe consisiting of N number of genes) in k total draws(the number of input genes). The hypergeometric test is identical to the corresponding one-tailed version of Fisher's exact test. That is, P(X=x) = f(x| N,m,k).
| GS(geneset) pathway name | gene.list | GS size (m) | n.NotInGS (n) | Gene universe (N) | n.drawn (k) | n.found (x) | p.value (p(X>=x)) | FDR (q.value) |
|---|---|---|---|---|---|---|---|---|
| KEGG CELL CYCLE | gene.list | 387 | 45569 | 45956 | 11 | 3 | 9.299e-05 | 0.006261 |
| KEGG PATHWAYS IN CANCER | gene.list | 387 | 45569 | 45956 | 11 | 3 | 9.299e-05 | 0.006261 |
| KEGG GLIOMA | gene.list | 387 | 45569 | 45956 | 11 | 3 | 9.299e-05 | 0.006261 |
| KEGG PROSTATE CANCER | gene.list | 387 | 45569 | 45956 | 11 | 3 | 9.299e-05 | 0.006261 |
| KEGG MELANOMA | gene.list | 387 | 45569 | 45956 | 11 | 3 | 9.299e-05 | 0.006261 |
| KEGG SMALL CELL LUNG CANCER | gene.list | 387 | 45569 | 45956 | 11 | 3 | 9.299e-05 | 0.006261 |
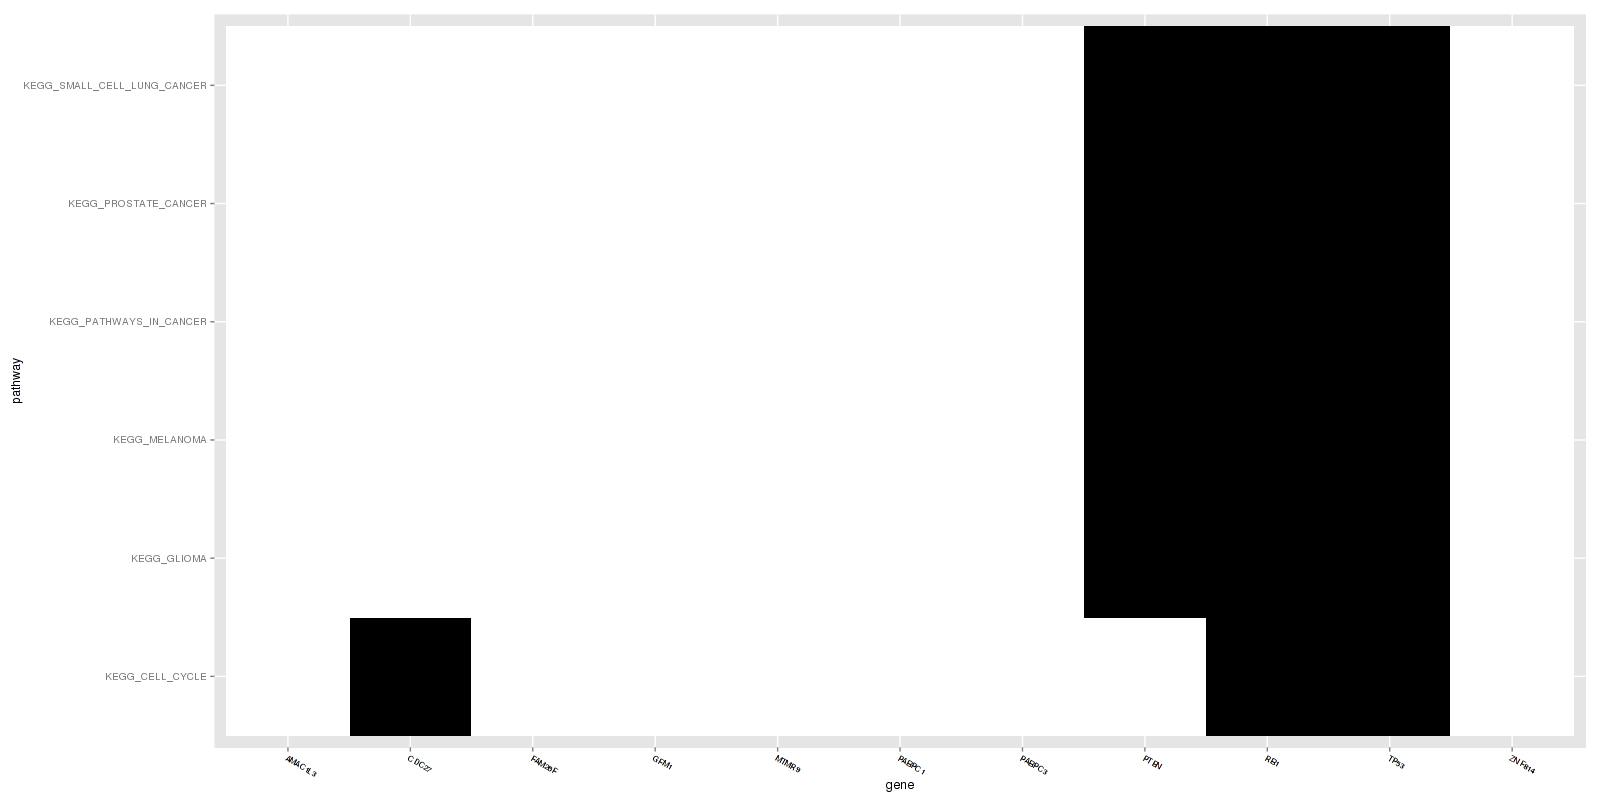
Figure 1. Get High-res Image This figure is an event heatmap indicating gene matches across genesets
-
Gene set database = c2.cp.v3.0-2.symbols.gmt
-
Input gene list = sig_genes.txt
For a given gene list, it uses a hypergeometric test to get a significance of each overlapping pathway geneset. The hypergeometric p-value is obtained by R library function phyer() and is defined as a probability of randomly drawing x or more successes(gene matches) from the population consisting N genes in k(the input genes) total draws.
-
a cumulative p.val with lower tail==T in phyer():
-
ex). a probability to see at least 3 genes in the group is p(x>=3) = 1 - p(x<=2)= 1 - phyer(2, lower.tail=T) that is, f(x| N, m, k) = mCk * ((N-m) C (n-k)) / ((N) C (n))
-
The hypergeometric test is identical to the corresponding one-tailed version of Fisher's exact test.
-
ex). Fisher' exact test = matrix(c(n.Found, n.GS-n.Found, n.drawn-n.Found, n.NotGS- (n.drawn-n.Found)), nrow=2, dimnames = list(inputGenes = c("Found", "NotFound"),GeneUniverse = c("GS", "nonGS")) )
In addition to the links below, the full results of the analysis summarized in this report can also be downloaded programmatically using firehose_get, or interactively from either the Broad GDAC website or TCGA Data Coordination Center Portal.