This pipeline performs Gene Set Enrichment Analysis (GSEA) using The Broad Institute GSEA tool with MSigDB - Class2: Canonical Pathways gene sets. For a given phenotype subtype, it shows what pathways are significantly enriched in each subtype by comparing gene expression profiles between subtypes. Here, the phenotype is mRNAseq_cNMF subtypes in LIHC-TP. This pipeline has the following features:
-
For each subtype, calculates enrichment scores (ES) using signal to noise (S2N) that checks similarity between subtypes in expression level then calculates p values through permutation test.
-
Lists pathways significantly enriched in each phenotype subtype and their enrichment scores (ES).
-
Lists top 20 core genes enriched in each significant gene set and their enrichment scores (ES).
-
Checks if the top core genes are up-regulated or down-regulated.
-
Checks if the top core genes are high expressed or low expressed.
-
Checks if the top core genes are significantly differently expressed genes.
Table 1. Get Full Table basic data info
| basic data info |
|---|
| Number of Gene Sets: 192 |
| Number of samples: 371 |
| Original number of Gene Sets: 404 |
| Maximum gene set size: 388 |
Table 2. Get Full Table pheno data info
| phenotype info |
|---|
| pheno.type: 1 - 5 :[ clus1 ] 62 |
| pheno.type: 2 - 5 :[ clus2 ] 99 |
| pheno.type: 3 - 5 :[ clus3 ] 71 |
| pheno.type: 4 - 5 :[ clus4 ] 69 |
| pheno.type: 5 - 5 :[ clus5 ] 70 |
For the expression subtypes of 17745 genes in 372 samples, GSEA found enriched gene sets in each cluster using 371 gene sets in MSigDB canonical pathways. Top enriched gene sets are listed as below.
-
clus1
-
Top enriched gene sets are BIOCARTA G1 PATHWAY, BIOCARTA FMLP PATHWAY, BIOCARTA MPR PATHWAY, BIOCARTA TOLL PATHWAY, KEGG RNA DEGRADATION, KEGG DNA REPLICATION, KEGG SPLICEOSOME, KEGG BASE EXCISION REPAIR, KEGG NUCLEOTIDE EXCISION REPAIR, KEGG HOMOLOGOUS RECOMBINATION
-
And common core enriched genes are MCM2, MCM3, MCM4, MCM5, MCM6, MCM7, PCNA, POLD1, RPA4, ACIN1
-
clus2
-
Top enriched gene sets are KEGG GLYCOLYSIS GLUCONEOGENESIS, KEGG CITRATE CYCLE TCA CYCLE, KEGG PENTOSE AND GLUCURONATE INTERCONVERSIONS, KEGG FATTY ACID METABOLISM, KEGG STEROID HORMONE BIOSYNTHESIS, KEGG ALANINE ASPARTATE AND GLUTAMATE METABOLISM, KEGG GLYCINE SERINE AND THREONINE METABOLISM, KEGG CYSTEINE AND METHIONINE METABOLISM, KEGG VALINE LEUCINE AND ISOLEUCINE DEGRADATION, KEGG LYSINE DEGRADATION
-
And common core enriched genes are ACAT1, ACAT2, ALDH2, ALDH7A1, ALDH9A1, LDHAL6B, PIPOX, ACACB, ACSS2, EHHADH
-
clus3
-
Top enriched gene sets are BIOCARTA G1 PATHWAY, BIOCARTA MPR PATHWAY, BIOCARTA INTEGRIN PATHWAY, BIOCARTA WNT PATHWAY, KEGG INOSITOL PHOSPHATE METABOLISM, KEGG ETHER LIPID METABOLISM, KEGG SPHINGOLIPID METABOLISM, KEGG GLYCOSPHINGOLIPID BIOSYNTHESIS LACTO AND NEOLACTO SERIES, KEGG RIBOSOME, KEGG DNA REPLICATION
-
And common core enriched genes are ACTA1, CCNB1, CDC25C, CDK1, MYT1, SRC, RPL10A, RPL12, RPL13A, RPL14
-
clus4
-
Top enriched gene sets are BIOCARTA NO1 PATHWAY, BIOCARTA AGR PATHWAY, BIOCARTA ALK PATHWAY, BIOCARTA BCR PATHWAY, BIOCARTA CARM ER PATHWAY, BIOCARTA HDAC PATHWAY, BIOCARTA EGF PATHWAY, BIOCARTA ERK PATHWAY, BIOCARTA FAS PATHWAY, BIOCARTA FCER1 PATHWAY
-
And common core enriched genes are PRKX, FZD1, FZD2, FZD7, FZD8, LEF1, WNT1, WNT10A, WNT11, WNT2
-
clus5
-
Top enriched gene sets are BIOCARTA WNT PATHWAY, KEGG PENTOSE AND GLUCURONATE INTERCONVERSIONS, KEGG FATTY ACID METABOLISM, KEGG STEROID HORMONE BIOSYNTHESIS, KEGG VALINE LEUCINE AND ISOLEUCINE DEGRADATION, KEGG LYSINE DEGRADATION, KEGG TYROSINE METABOLISM, KEGG TRYPTOPHAN METABOLISM, KEGG PROPANOATE METABOLISM, KEGG BUTANOATE METABOLISM
-
And common core enriched genes are ACAA1, ACSL5, ACSL6, ADH1A, ADH1B, ADH1C, ADH4, ADH5, ADH6, ADH7
Table 3. Get Full Table This table shows top 10 pathways which are significantly enriched in cluster clus1. It displays only significant gene sets satisfying nom.p.val.threshold (-1), fwer.p.val.threshold (-1) , fdr.q.val.threshold (0.25) and the default table is sorted by Normalized Enrichment Score (NES). Further details on NES statistics, please visit The Broad GSEA website.
| GeneSet(GS) | Size(#genes) | genes.ES.table | ES | NES | NOM.p.val | FDR.q.val | FWER.p.val | Tag.. | Gene.. | Signal | FDR..median. | glob.p.val |
|---|---|---|---|---|---|---|---|---|---|---|---|---|
| BIOCARTA G1 PATHWAY | 27 | genes.ES.table | 0.55 | 1.6 | 0.028 | 0.53 | 0.79 | 0.41 | 0.24 | 0.31 | 0.31 | 0.16 |
| BIOCARTA FMLP PATHWAY | 35 | genes.ES.table | 0.5 | 1.6 | 0.029 | 0.42 | 0.63 | 0.2 | 0.16 | 0.17 | 0.21 | 0.11 |
| BIOCARTA MPR PATHWAY | 32 | genes.ES.table | 0.53 | 1.7 | 0.012 | 0.41 | 0.57 | 0.31 | 0.18 | 0.26 | 0.18 | 0.11 |
| BIOCARTA TOLL PATHWAY | 36 | genes.ES.table | 0.48 | 1.5 | 0.068 | 0.5 | 0.88 | 0.19 | 0.11 | 0.17 | 0.31 | 0.14 |
| KEGG RNA DEGRADATION | 55 | genes.ES.table | 0.34 | 1.6 | 0.054 | 0.4 | 0.69 | 0.74 | 0.51 | 0.37 | 0.22 | 0.096 |
| KEGG DNA REPLICATION | 35 | genes.ES.table | 0.63 | 1.7 | 0.067 | 0.42 | 0.52 | 0.74 | 0.3 | 0.52 | 0.17 | 0.12 |
| KEGG SPLICEOSOME | 125 | genes.ES.table | 0.47 | 1.9 | 0.016 | 0.44 | 0.15 | 0.74 | 0.46 | 0.4 | 0 | 0.13 |
| KEGG BASE EXCISION REPAIR | 32 | genes.ES.table | 0.42 | 1.5 | 0.12 | 0.57 | 0.92 | 0.56 | 0.39 | 0.34 | 0.39 | 0.17 |
| KEGG NUCLEOTIDE EXCISION REPAIR | 43 | genes.ES.table | 0.39 | 1.5 | 0.11 | 0.54 | 0.84 | 0.51 | 0.41 | 0.3 | 0.33 | 0.16 |
| KEGG HOMOLOGOUS RECOMBINATION | 27 | genes.ES.table | 0.67 | 1.7 | 0.024 | 0.5 | 0.51 | 0.41 | 0.14 | 0.35 | 0.21 | 0.15 |
Table S1. Get Full Table This table shows a Running Enrichment Score (RES) of each gene in this pathway, that is, the enrichment score at this point in the ranked list of genes. All genes are ranked by Signal-to-Noise (S2N), a measure of similarity as default and are used to obtain ES matrix of all genes. In this way, GSEA tool uses expression pattern of not only overlapped genes but also not-overlapped genes to produce ES matrix.
| Rank | GENE | SYMBOL | DESC | LIST.LOC | S2N | RES | CORE_ENRICHMENT |
|---|---|---|---|---|---|---|---|
| 1 | HSPA6 | HSPA6 | HSPA6 | 1121 | 0.3 | -0.027 | YES |
| 2 | PPIH | PPIH | PPIH | 1829 | 0.24 | -0.038 | YES |
| 3 | SNRPD1 | SNRPD1 | SNRPD1 | 2795 | 0.18 | -0.071 | YES |
| 4 | THOC4 | THOC4 | THOC4 | 2991 | 0.17 | -0.062 | YES |
| 5 | SNRPA1 | SNRPA1 | SNRPA1 | 3139 | 0.16 | -0.05 | YES |
| 6 | HSPA1B | HSPA1B | HSPA1B | 3291 | 0.16 | -0.04 | YES |
| 7 | SNRNP40 | SNRNP40 | SNRNP40 | 3482 | 0.15 | -0.032 | YES |
| 8 | SNRPA | SNRPA | SNRPA | 3674 | 0.14 | -0.026 | YES |
| 9 | SNRPB | SNRPB | SNRPB | 3683 | 0.14 | -0.009 | YES |
| 10 | SNRPD2 | SNRPD2 | SNRPD2 | 3857 | 0.14 | -0.0024 | YES |
| 11 | NAA38 | NAA38 | NAA38 | 3975 | 0.13 | 0.0069 | YES |
| 12 | PRPF38A | PRPF38A | PRPF38A | 4006 | 0.13 | 0.021 | YES |
| 13 | SF3A3 | SF3A3 | SF3A3 | 4146 | 0.13 | 0.028 | YES |
| 14 | SNRPF | SNRPF | SNRPF | 4170 | 0.13 | 0.042 | YES |
| 15 | EFTUD2 | EFTUD2 | EFTUD2 | 4277 | 0.12 | 0.051 | YES |
| 16 | SF3B4 | SF3B4 | SF3B4 | 4292 | 0.12 | 0.065 | YES |
| 17 | LSM2 | LSM2 | LSM2 | 4491 | 0.12 | 0.068 | YES |
| 18 | PPIL1 | PPIL1 | PPIL1 | 4533 | 0.12 | 0.079 | YES |
| 19 | SF3A2 | SF3A2 | SF3A2 | 4622 | 0.11 | 0.087 | YES |
| 20 | TXNL4A | TXNL4A | TXNL4A | 4762 | 0.11 | 0.092 | YES |
| 21 | BUD31 | BUD31 | BUD31 | 4967 | 0.1 | 0.093 | YES |
| 22 | PRPF4 | PRPF4 | PRPF4 | 5093 | 0.099 | 0.098 | YES |
| 23 | SNRPC | SNRPC | SNRPC | 5098 | 0.099 | 0.11 | YES |
| 24 | PRPF3 | PRPF3 | PRPF3 | 5166 | 0.097 | 0.12 | YES |
| 25 | PPIE | PPIE | PPIE | 5167 | 0.097 | 0.13 | YES |
| 26 | THOC1 | THOC1 | THOC1 | 5223 | 0.096 | 0.14 | YES |
| 27 | EIF4A3 | EIF4A3 | EIF4A3 | 5335 | 0.093 | 0.14 | YES |
| 28 | TCERG1 | TCERG1 | TCERG1 | 5379 | 0.092 | 0.15 | YES |
| 29 | MAGOH | MAGOH | MAGOH | 5493 | 0.089 | 0.16 | YES |
| 30 | U2AF2 | U2AF2 | U2AF2 | 5536 | 0.088 | 0.16 | YES |
| 31 | PRPF31 | PRPF31 | PRPF31 | 5562 | 0.088 | 0.17 | YES |
| 32 | SNRPB2 | SNRPB2 | SNRPB2 | 5638 | 0.086 | 0.18 | YES |
| 33 | SFRS9 | SFRS9 | SFRS9 | 5698 | 0.084 | 0.18 | YES |
| 34 | SNRPG | SNRPG | SNRPG | 5787 | 0.082 | 0.19 | YES |
| 35 | RBM17 | RBM17 | RBM17 | 5808 | 0.082 | 0.2 | YES |
| 36 | LSM7 | LSM7 | LSM7 | 5882 | 0.08 | 0.2 | YES |
| 37 | HNRNPA3 | HNRNPA3 | HNRNPA3 | 5924 | 0.079 | 0.21 | YES |
| 38 | SF3B5 | SF3B5 | SF3B5 | 5951 | 0.079 | 0.22 | YES |
| 39 | SF3B3 | SF3B3 | SF3B3 | 6012 | 0.078 | 0.23 | YES |
| 40 | RBMX | RBMX | RBMX | 6033 | 0.077 | 0.23 | YES |
| 41 | SNRPE | SNRPE | SNRPE | 6077 | 0.076 | 0.24 | YES |
| 42 | HSPA2 | HSPA2 | HSPA2 | 6134 | 0.075 | 0.25 | YES |
| 43 | PRPF38B | PRPF38B | PRPF38B | 6164 | 0.074 | 0.25 | YES |
| 44 | THOC2 | THOC2 | THOC2 | 6167 | 0.074 | 0.26 | YES |
| 45 | PRPF40B | PRPF40B | PRPF40B | 6250 | 0.073 | 0.27 | YES |
| 46 | LSM5 | LSM5 | LSM5 | 6274 | 0.072 | 0.27 | YES |
| 47 | DDX23 | DDX23 | DDX23 | 6277 | 0.072 | 0.28 | YES |
| 48 | SFRS13A | SFRS13A | SFRS13A | 6334 | 0.071 | 0.29 | YES |
| 49 | LSM4 | LSM4 | LSM4 | 6445 | 0.069 | 0.29 | YES |
| 50 | SR140 | SR140 | SR140 | 6461 | 0.068 | 0.3 | YES |
| 51 | U2AF1 | U2AF1 | U2AF1 | 6542 | 0.067 | 0.3 | YES |
| 52 | ISY1 | ISY1 | ISY1 | 6551 | 0.067 | 0.31 | YES |
| 53 | SART1 | SART1 | SART1 | 6560 | 0.067 | 0.32 | YES |
| 54 | HNRNPM | HNRNPM | HNRNPM | 6697 | 0.064 | 0.32 | YES |
| 55 | PRPF19 | PRPF19 | PRPF19 | 6755 | 0.063 | 0.32 | YES |
| 56 | BCAS2 | BCAS2 | BCAS2 | 6764 | 0.063 | 0.33 | YES |
| 57 | SFRS3 | SFRS3 | SFRS3 | 6776 | 0.063 | 0.33 | YES |
| 58 | RBM22 | RBM22 | RBM22 | 6786 | 0.063 | 0.34 | YES |
| 59 | HNRNPA1 | HNRNPA1 | HNRNPA1 | 6787 | 0.063 | 0.35 | YES |
| 60 | TRA2B | TRA2B | TRA2B | 6908 | 0.06 | 0.35 | YES |
| 61 | RBM8A | RBM8A | RBM8A | 6925 | 0.06 | 0.36 | YES |
| 62 | NCBP1 | NCBP1 | NCBP1 | 7004 | 0.058 | 0.36 | YES |
| 63 | PUF60 | PUF60 | PUF60 | 7008 | 0.058 | 0.36 | YES |
| 64 | CCDC12 | CCDC12 | CCDC12 | 7035 | 0.058 | 0.37 | YES |
| 65 | THOC3 | THOC3 | THOC3 | 7045 | 0.058 | 0.38 | YES |
| 66 | HNRNPU | HNRNPU | HNRNPU | 7094 | 0.057 | 0.38 | YES |
| 67 | PQBP1 | PQBP1 | PQBP1 | 7101 | 0.057 | 0.39 | YES |
| 68 | SFRS7 | SFRS7 | SFRS7 | 7113 | 0.057 | 0.39 | YES |
| 69 | DHX8 | DHX8 | DHX8 | 7148 | 0.056 | 0.4 | YES |
| 70 | DHX15 | DHX15 | DHX15 | 7251 | 0.054 | 0.4 | YES |
| 71 | SNRNP70 | SNRNP70 | SNRNP70 | 7285 | 0.054 | 0.4 | YES |
| 72 | SF3B2 | SF3B2 | SF3B2 | 7292 | 0.054 | 0.41 | YES |
| 73 | HNRNPA1L2 | HNRNPA1L2 | HNRNPA1L2 | 7468 | 0.051 | 0.41 | YES |
| 74 | CRNKL1 | CRNKL1 | CRNKL1 | 7481 | 0.051 | 0.41 | YES |
| 75 | BAT1 | BAT1 | BAT1 | 7564 | 0.05 | 0.41 | YES |
| 76 | SFRS2 | SFRS2 | SFRS2 | 7647 | 0.048 | 0.41 | YES |
| 77 | PHF5A | PHF5A | PHF5A | 7682 | 0.048 | 0.42 | YES |
| 78 | DHX38 | DHX38 | DHX38 | 7709 | 0.047 | 0.42 | YES |
| 79 | PRPF6 | PRPF6 | PRPF6 | 7748 | 0.047 | 0.42 | YES |
| 80 | PRPF40A | PRPF40A | PRPF40A | 7765 | 0.046 | 0.43 | YES |
| 81 | TRA2A | TRA2A | TRA2A | 7807 | 0.046 | 0.43 | YES |
| 82 | SFRS1 | SFRS1 | SFRS1 | 7830 | 0.045 | 0.44 | YES |
| 83 | SNRNP200 | SNRNP200 | SNRNP200 | 7907 | 0.044 | 0.44 | YES |
| 84 | PLRG1 | PLRG1 | PLRG1 | 7925 | 0.044 | 0.44 | YES |
| 85 | SYF2 | SYF2 | SYF2 | 7948 | 0.043 | 0.45 | YES |
| 86 | ACIN1 | ACIN1 | ACIN1 | 7973 | 0.043 | 0.45 | YES |
| 87 | USP39 | USP39 | USP39 | 7977 | 0.043 | 0.46 | YES |
| 88 | LSM6 | LSM6 | LSM6 | 7983 | 0.042 | 0.46 | YES |
| 89 | HSPA1A | HSPA1A | HSPA1A | 8075 | 0.041 | 0.46 | YES |
| 90 | SFRS4 | SFRS4 | SFRS4 | 8170 | 0.039 | 0.46 | YES |
| 91 | HNRNPC | HNRNPC | HNRNPC | 8181 | 0.039 | 0.46 | YES |
| 92 | HSPA8 | HSPA8 | HSPA8 | 8186 | 0.039 | 0.47 | YES |
| 93 | SMNDC1 | SMNDC1 | SMNDC1 | 8207 | 0.039 | 0.47 | YES |
| 94 | NHP2L1 | NHP2L1 | NHP2L1 | 8372 | 0.036 | 0.47 | NO |
| 95 | MAGOHB | MAGOHB | MAGOHB | 8510 | 0.034 | 0.46 | NO |
| 96 | LSM3 | LSM3 | LSM3 | 8781 | 0.03 | 0.45 | NO |
| 97 | SF3B14 | SF3B14 | SF3B14 | 8972 | 0.027 | 0.44 | NO |
| 98 | SNRNP27 | SNRNP27 | SNRNP27 | 9139 | 0.024 | 0.44 | NO |
| 99 | PRPF18 | PRPF18 | PRPF18 | 9283 | 0.022 | 0.43 | NO |
| 100 | CDC40 | CDC40 | CDC40 | 9307 | 0.022 | 0.43 | NO |
| 101 | HNRNPK | HNRNPK | HNRNPK | 9311 | 0.022 | 0.44 | NO |
| 102 | RBM25 | RBM25 | RBM25 | 9339 | 0.021 | 0.44 | NO |
| 103 | SF3A1 | SF3A1 | SF3A1 | 9362 | 0.021 | 0.44 | NO |
| 104 | DHX16 | DHX16 | DHX16 | 9553 | 0.018 | 0.43 | NO |
| 105 | SF3B1 | SF3B1 | SF3B1 | 9564 | 0.018 | 0.43 | NO |
| 106 | SNRPD3 | SNRPD3 | SNRPD3 | 9717 | 0.016 | 0.42 | NO |
| 107 | SLU7 | SLU7 | SLU7 | 9741 | 0.015 | 0.42 | NO |
| 108 | DDX46 | DDX46 | DDX46 | 9823 | 0.014 | 0.42 | NO |
| 109 | DDX5 | DDX5 | DDX5 | 10079 | 0.01 | 0.41 | NO |
| 110 | XAB2 | XAB2 | XAB2 | 10112 | 0.0096 | 0.41 | NO |
| 111 | DDX42 | DDX42 | DDX42 | 10354 | 0.006 | 0.39 | NO |
| 112 | SFRS6 | SFRS6 | SFRS6 | 10410 | 0.0052 | 0.39 | NO |
| 113 | SNW1 | SNW1 | SNW1 | 10530 | 0.0035 | 0.38 | NO |
| 114 | PRPF8 | PRPF8 | PRPF8 | 10681 | 0.0011 | 0.38 | NO |
| 115 | CWC15 | CWC15 | CWC15 | 10695 | 0.00074 | 0.38 | NO |
| 116 | AQR | AQR | AQR | 10841 | -0.0018 | 0.37 | NO |
| 117 | WBP11 | WBP11 | WBP11 | 11073 | -0.0052 | 0.36 | NO |
| 118 | ZMAT2 | ZMAT2 | ZMAT2 | 11132 | -0.0063 | 0.35 | NO |
| 119 | PCBP1 | PCBP1 | PCBP1 | 11283 | -0.0088 | 0.35 | NO |
| 120 | CDC5L | CDC5L | CDC5L | 11351 | -0.01 | 0.34 | NO |
| 121 | SFRS2B | SFRS2B | SFRS2B | 11468 | -0.012 | 0.34 | NO |
| 122 | CHERP | CHERP | CHERP | 11887 | -0.02 | 0.32 | NO |
| 123 | CTNNBL1 | CTNNBL1 | CTNNBL1 | 12228 | -0.027 | 0.3 | NO |
| 124 | HSPA1L | HSPA1L | HSPA1L | 13019 | -0.044 | 0.26 | NO |
| 125 | SFRS5 | SFRS5 | SFRS5 | 13484 | -0.054 | 0.24 | NO |
Figure S1. Get High-res Image This plot shows mRNAseq_cNMF expression data heatmap (on the left) a RunningEnrichmentScore(RES) plot (on the top right) and a Signal2Noise(S2N) plot (on the bottom right) of genes in the pathway: BIOCARTA G1 PATHWAY.
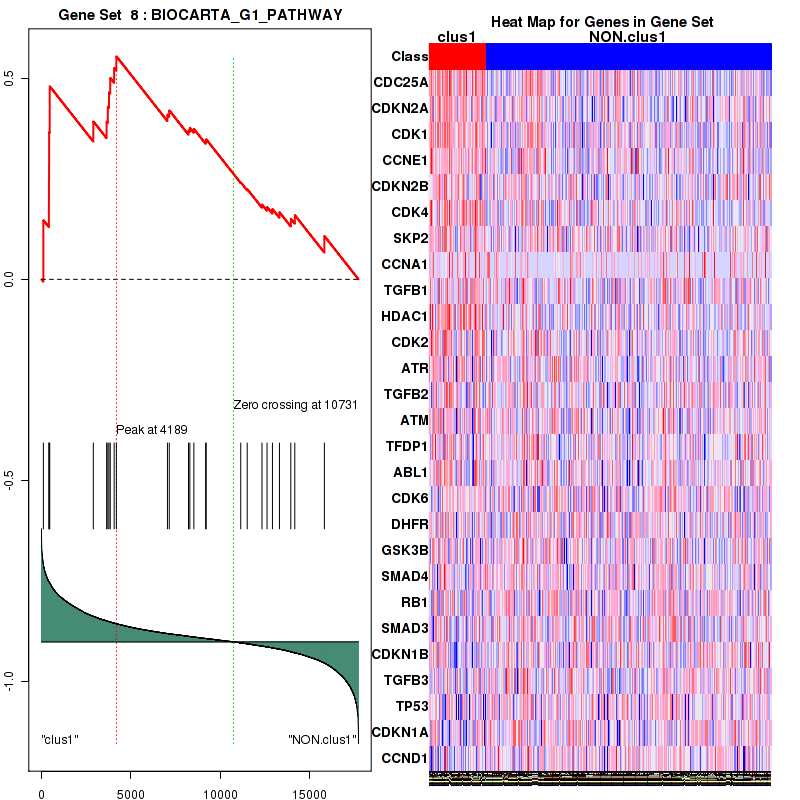
Figure S2. Get High-res Image For the top 5 core enriched genes in the pathway: BIOCARTA G1 PATHWAY, this volcano plot shows how much they are up/down-regulated and significant. The significance was calculated by empirical bayesian fit
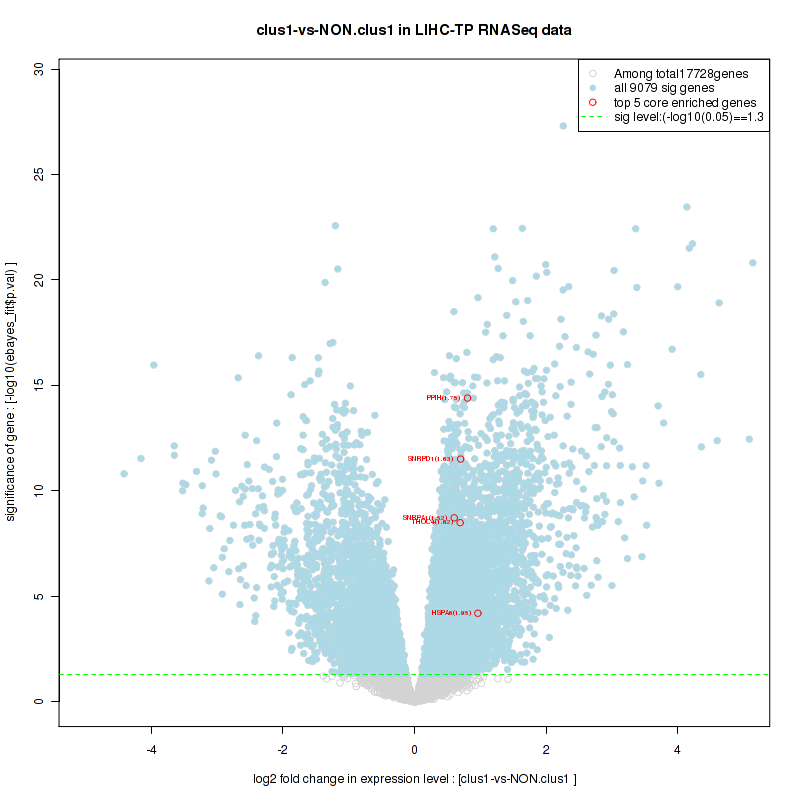
Table S2. Get Full Table This table shows a Running Enrichment Score (RES) of each gene in this pathway, that is, the enrichment score at this point in the ranked list of genes. All genes are ranked by Signal-to-Noise (S2N), a measure of similarity as default and are used to obtain ES matrix of all genes. In this way, GSEA tool uses expression pattern of not only overlapped genes but also not-overlapped genes to produce ES matrix.
| Rank | GENE | SYMBOL | DESC | LIST.LOC | S2N | RES | CORE_ENRICHMENT |
|---|---|---|---|---|---|---|---|
| 1 | CARD18 | CARD18 | CARD18 | 150 | 0.51 | 0.048 | YES |
| 2 | CASP5 | CASP5 | CASP5 | 267 | 0.46 | 0.092 | YES |
| 3 | MAPK13 | MAPK13 | MAPK13 | 296 | 0.45 | 0.14 | YES |
| 4 | IL1B | IL1B | IL1B | 484 | 0.4 | 0.17 | YES |
| 5 | CXCL1 | CXCL1 | CXCL1 | 493 | 0.4 | 0.22 | YES |
| 6 | IL18 | IL18 | IL18 | 507 | 0.4 | 0.26 | YES |
| 7 | CCL13 | CCL13 | CCL13 | 670 | 0.36 | 0.29 | YES |
| 8 | PYCARD | PYCARD | PYCARD | 866 | 0.33 | 0.32 | YES |
| 9 | PSTPIP1 | PSTPIP1 | PSTPIP1 | 919 | 0.33 | 0.35 | YES |
| 10 | CARD9 | CARD9 | CARD9 | 960 | 0.32 | 0.38 | YES |
| 11 | IL8 | IL8 | IL8 | 961 | 0.32 | 0.42 | YES |
| 12 | BIRC3 | BIRC3 | BIRC3 | 1069 | 0.31 | 0.45 | YES |
| 13 | NLRC4 | NLRC4 | NLRC4 | 1118 | 0.3 | 0.48 | YES |
| 14 | NOD2 | NOD2 | NOD2 | 1277 | 0.29 | 0.5 | YES |
| 15 | TNF | TNF | TNF | 1415 | 0.28 | 0.52 | YES |
| 16 | CASP1 | CASP1 | CASP1 | 1440 | 0.27 | 0.55 | YES |
| 17 | CARD6 | CARD6 | CARD6 | 1662 | 0.26 | 0.57 | YES |
| 18 | CCL5 | CCL5 | CCL5 | 1712 | 0.25 | 0.59 | YES |
| 19 | CCL8 | CCL8 | CCL8 | 1912 | 0.24 | 0.61 | YES |
| 20 | RIPK2 | RIPK2 | RIPK2 | 1924 | 0.24 | 0.63 | YES |
| 21 | NLRP3 | NLRP3 | NLRP3 | 2111 | 0.22 | 0.65 | YES |
| 22 | MEFV | MEFV | MEFV | 2200 | 0.22 | 0.66 | YES |
| 23 | NAIP | NAIP | NAIP | 3493 | 0.15 | 0.61 | NO |
| 24 | NLRP1 | NLRP1 | NLRP1 | 4241 | 0.12 | 0.58 | NO |
| 25 | CASP8 | CASP8 | CASP8 | 4782 | 0.11 | 0.56 | NO |
| 26 | MAPK3 | MAPK3 | MAPK3 | 5160 | 0.097 | 0.55 | NO |
| 27 | MAP3K7 | MAP3K7 | MAP3K7 | 5288 | 0.094 | 0.55 | NO |
| 28 | MAPK12 | MAPK12 | MAPK12 | 5299 | 0.094 | 0.56 | NO |
| 29 | NOD1 | NOD1 | NOD1 | 5551 | 0.088 | 0.56 | NO |
| 30 | IKBKG | IKBKG | IKBKG | 5602 | 0.086 | 0.57 | NO |
| 31 | IL6 | IL6 | IL6 | 6099 | 0.076 | 0.55 | NO |
| 32 | NFKBIB | NFKBIB | NFKBIB | 6333 | 0.071 | 0.54 | NO |
| 33 | HSP90AA1 | HSP90AA1 | HSP90AA1 | 7828 | 0.045 | 0.46 | NO |
| 34 | HSP90B1 | HSP90B1 | HSP90B1 | 7979 | 0.042 | 0.46 | NO |
| 35 | TNFAIP3 | TNFAIP3 | TNFAIP3 | 8261 | 0.038 | 0.44 | NO |
| 36 | SUGT1 | SUGT1 | SUGT1 | 8658 | 0.032 | 0.43 | NO |
| 37 | IKBKB | IKBKB | IKBKB | 9388 | 0.02 | 0.39 | NO |
| 38 | RELA | RELA | RELA | 9629 | 0.017 | 0.38 | NO |
| 39 | CCL2 | CCL2 | CCL2 | 10060 | 0.01 | 0.35 | NO |
| 40 | CXCL2 | CXCL2 | CXCL2 | 10125 | 0.0093 | 0.35 | NO |
| 41 | NFKB1 | NFKB1 | NFKB1 | 10302 | 0.0068 | 0.34 | NO |
| 42 | XIAP | XIAP | XIAP | 10333 | 0.0065 | 0.34 | NO |
| 43 | MAPK14 | MAPK14 | MAPK14 | 11276 | -0.0086 | 0.29 | NO |
| 44 | MAPK9 | MAPK9 | MAPK9 | 11388 | -0.011 | 0.28 | NO |
| 45 | BIRC2 | BIRC2 | BIRC2 | 11472 | -0.012 | 0.28 | NO |
| 46 | MAPK1 | MAPK1 | MAPK1 | 11544 | -0.014 | 0.28 | NO |
| 47 | ERBB2IP | ERBB2IP | ERBB2IP | 11785 | -0.018 | 0.26 | NO |
| 48 | CARD8 | CARD8 | CARD8 | 11806 | -0.019 | 0.27 | NO |
| 49 | TAB2 | TAB2 | TAB2 | 12081 | -0.024 | 0.25 | NO |
| 50 | TAB3 | TAB3 | TAB3 | 12197 | -0.027 | 0.25 | NO |
| 51 | TRIP6 | TRIP6 | TRIP6 | 12531 | -0.033 | 0.23 | NO |
| 52 | TAB1 | TAB1 | TAB1 | 12765 | -0.038 | 0.22 | NO |
| 53 | CHUK | CHUK | CHUK | 13711 | -0.061 | 0.18 | NO |
| 54 | CCL11 | CCL11 | CCL11 | 13758 | -0.062 | 0.18 | NO |
| 55 | MAPK11 | MAPK11 | MAPK11 | 13806 | -0.064 | 0.19 | NO |
| 56 | TRAF6 | TRAF6 | TRAF6 | 13929 | -0.068 | 0.19 | NO |
| 57 | NFKBIA | NFKBIA | NFKBIA | 13964 | -0.069 | 0.19 | NO |
| 58 | MAPK10 | MAPK10 | MAPK10 | 14152 | -0.075 | 0.19 | NO |
| 59 | MAPK8 | MAPK8 | MAPK8 | 14946 | -0.1 | 0.16 | NO |
Figure S3. Get High-res Image This plot shows mRNAseq_cNMF expression data heatmap (on the left) a RunningEnrichmentScore(RES) plot (on the top right) and a Signal2Noise(S2N) plot (on the bottom right) of genes in the pathway: BIOCARTA FMLP PATHWAY.
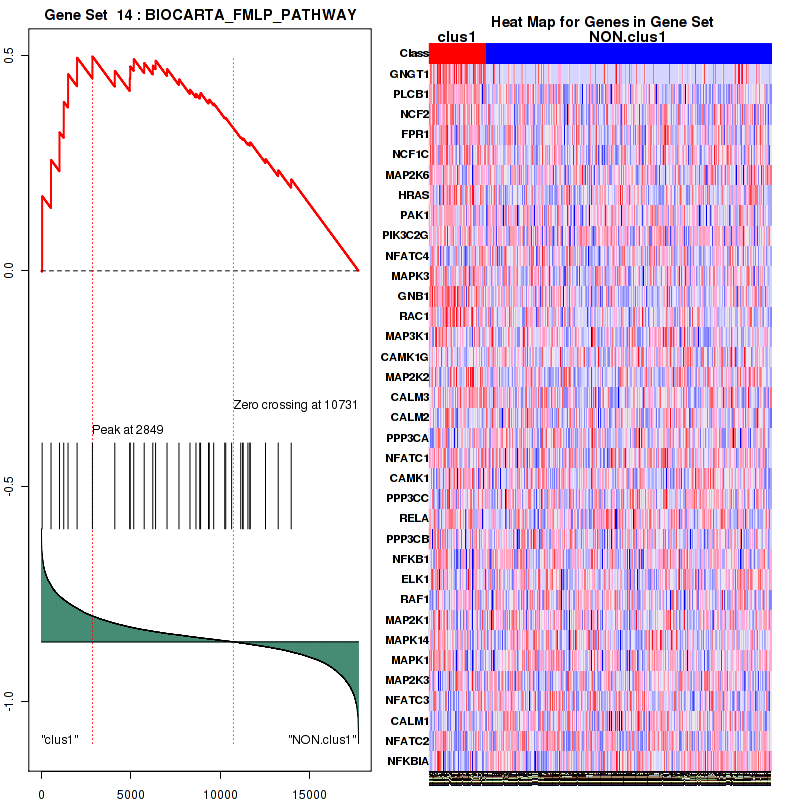
Figure S4. Get High-res Image For the top 5 core enriched genes in the pathway: BIOCARTA FMLP PATHWAY, this volcano plot shows how much they are up/down-regulated and significant. The significance was calculated by empirical bayesian fit
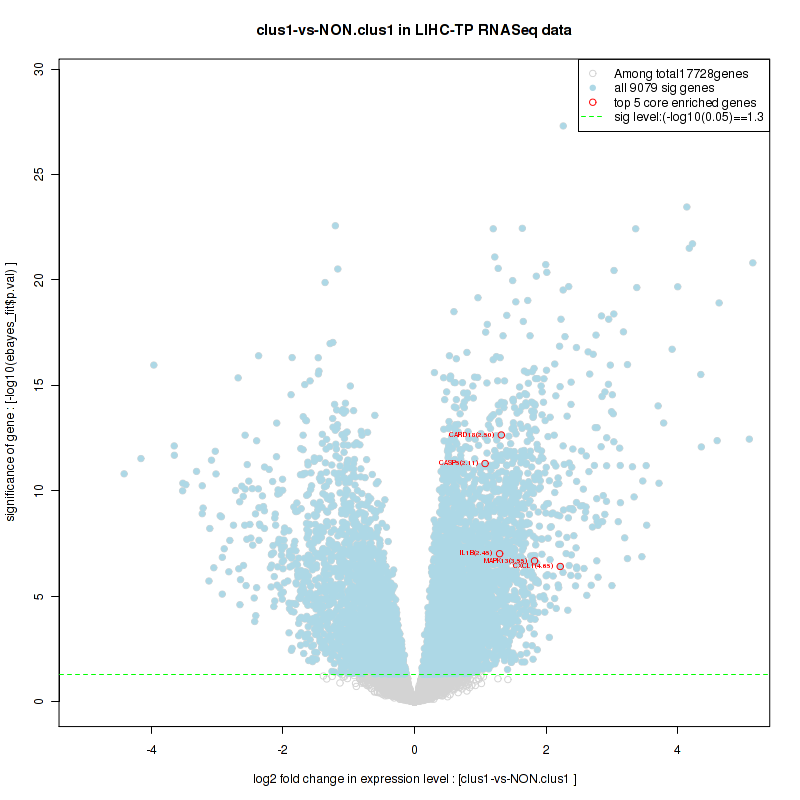
Table S3. Get Full Table This table shows a Running Enrichment Score (RES) of each gene in this pathway, that is, the enrichment score at this point in the ranked list of genes. All genes are ranked by Signal-to-Noise (S2N), a measure of similarity as default and are used to obtain ES matrix of all genes. In this way, GSEA tool uses expression pattern of not only overlapped genes but also not-overlapped genes to produce ES matrix.
| Rank | GENE | SYMBOL | DESC | LIST.LOC | S2N | RES | CORE_ENRICHMENT |
|---|---|---|---|---|---|---|---|
| 1 | E2F2 | E2F2 | E2F2 | 32 | 0.61 | 0.026 | YES |
| 2 | CDC20 | CDC20 | CDC20 | 37 | 0.61 | 0.053 | YES |
| 3 | ORC1L | ORC1L | ORC1L | 54 | 0.59 | 0.079 | YES |
| 4 | TTK | TTK | TTK | 72 | 0.56 | 0.1 | YES |
| 5 | ORC6L | ORC6L | ORC6L | 87 | 0.55 | 0.13 | YES |
| 6 | CDC25A | CDC25A | CDC25A | 107 | 0.54 | 0.15 | YES |
| 7 | PLK1 | PLK1 | PLK1 | 109 | 0.53 | 0.18 | YES |
| 8 | PKMYT1 | PKMYT1 | PKMYT1 | 115 | 0.53 | 0.2 | YES |
| 9 | CDC45 | CDC45 | CDC45 | 121 | 0.52 | 0.22 | YES |
| 10 | BUB1B | BUB1B | BUB1B | 124 | 0.52 | 0.24 | YES |
| 11 | BUB1 | BUB1 | BUB1 | 134 | 0.52 | 0.27 | YES |
| 12 | PTTG1 | PTTG1 | PTTG1 | 138 | 0.51 | 0.29 | YES |
| 13 | CDC25C | CDC25C | CDC25C | 182 | 0.49 | 0.31 | YES |
| 14 | CCNB2 | CCNB2 | CCNB2 | 276 | 0.45 | 0.33 | YES |
| 15 | CDC6 | CDC6 | CDC6 | 285 | 0.45 | 0.35 | YES |
| 16 | CDC7 | CDC7 | CDC7 | 315 | 0.44 | 0.36 | YES |
| 17 | CDKN2A | CDKN2A | CDKN2A | 417 | 0.42 | 0.38 | YES |
| 18 | CDK1 | CDK1 | CDK1 | 427 | 0.41 | 0.4 | YES |
| 19 | CCNB1 | CCNB1 | CCNB1 | 440 | 0.41 | 0.41 | YES |
| 20 | CCNE1 | CCNE1 | CCNE1 | 461 | 0.41 | 0.43 | YES |
| 21 | MAD2L1 | MAD2L1 | MAD2L1 | 464 | 0.41 | 0.45 | YES |
| 22 | SFN | SFN | SFN | 523 | 0.39 | 0.46 | YES |
| 23 | PTTG2 | PTTG2 | PTTG2 | 592 | 0.38 | 0.48 | YES |
| 24 | CCNE2 | CCNE2 | CCNE2 | 594 | 0.38 | 0.49 | YES |
| 25 | CCNA2 | CCNA2 | CCNA2 | 761 | 0.35 | 0.5 | YES |
| 26 | ESPL1 | ESPL1 | ESPL1 | 827 | 0.34 | 0.51 | YES |
| 27 | SMC1B | SMC1B | SMC1B | 840 | 0.34 | 0.53 | YES |
| 28 | CHEK1 | CHEK1 | CHEK1 | 988 | 0.32 | 0.53 | YES |
| 29 | MCM2 | MCM2 | MCM2 | 1208 | 0.3 | 0.53 | YES |
| 30 | E2F5 | E2F5 | E2F5 | 1252 | 0.29 | 0.54 | YES |
| 31 | E2F1 | E2F1 | E2F1 | 1302 | 0.29 | 0.55 | YES |
| 32 | RBL1 | RBL1 | RBL1 | 1350 | 0.28 | 0.56 | YES |
| 33 | CDC25B | CDC25B | CDC25B | 1373 | 0.28 | 0.58 | YES |
| 34 | CDC14A | CDC14A | CDC14A | 1941 | 0.24 | 0.55 | YES |
| 35 | CDKN2C | CDKN2C | CDKN2C | 2020 | 0.23 | 0.56 | YES |
| 36 | MCM4 | MCM4 | MCM4 | 2087 | 0.22 | 0.57 | YES |
| 37 | MCM6 | MCM6 | MCM6 | 2125 | 0.22 | 0.57 | YES |
| 38 | MCM7 | MCM7 | MCM7 | 2363 | 0.2 | 0.57 | YES |
| 39 | CDKN2D | CDKN2D | CDKN2D | 2541 | 0.2 | 0.57 | YES |
| 40 | E2F3 | E2F3 | E2F3 | 2796 | 0.18 | 0.56 | YES |
| 41 | CDKN2B | CDKN2B | CDKN2B | 2900 | 0.18 | 0.56 | YES |
| 42 | MAD2L2 | MAD2L2 | MAD2L2 | 2940 | 0.17 | 0.57 | YES |
| 43 | MCM5 | MCM5 | MCM5 | 3202 | 0.16 | 0.56 | YES |
| 44 | MCM3 | MCM3 | MCM3 | 3252 | 0.16 | 0.57 | YES |
| 45 | CDK4 | CDK4 | CDK4 | 3642 | 0.14 | 0.55 | YES |
| 46 | ZBTB17 | ZBTB17 | ZBTB17 | 3685 | 0.14 | 0.56 | YES |
| 47 | SKP2 | SKP2 | SKP2 | 3712 | 0.14 | 0.56 | YES |
| 48 | CCNA1 | CCNA1 | CCNA1 | 3776 | 0.14 | 0.56 | YES |
| 49 | CHEK2 | CHEK2 | CHEK2 | 3777 | 0.14 | 0.57 | YES |
| 50 | TGFB1 | TGFB1 | TGFB1 | 3846 | 0.14 | 0.57 | YES |
| 51 | HDAC2 | HDAC2 | HDAC2 | 3995 | 0.13 | 0.57 | YES |
| 52 | HDAC1 | HDAC1 | HDAC1 | 4063 | 0.13 | 0.57 | YES |
| 53 | CDK2 | CDK2 | CDK2 | 4189 | 0.12 | 0.57 | YES |
| 54 | YWHAZ | YWHAZ | YWHAZ | 4191 | 0.12 | 0.58 | YES |
| 55 | PCNA | PCNA | PCNA | 4203 | 0.12 | 0.58 | YES |
| 56 | ANAPC7 | ANAPC7 | ANAPC7 | 4525 | 0.12 | 0.57 | NO |
| 57 | PRKDC | PRKDC | PRKDC | 4906 | 0.1 | 0.55 | NO |
| 58 | E2F4 | E2F4 | E2F4 | 5060 | 0.1 | 0.55 | NO |
| 59 | CCND2 | CCND2 | CCND2 | 5106 | 0.098 | 0.55 | NO |
| 60 | TFDP2 | TFDP2 | TFDP2 | 5126 | 0.098 | 0.55 | NO |
| 61 | RAD21 | RAD21 | RAD21 | 5823 | 0.082 | 0.52 | NO |
| 62 | CDC27 | CDC27 | CDC27 | 6213 | 0.074 | 0.5 | NO |
| 63 | ANAPC11 | ANAPC11 | ANAPC11 | 6422 | 0.069 | 0.49 | NO |
| 64 | CCND3 | CCND3 | CCND3 | 6557 | 0.067 | 0.48 | NO |
| 65 | ANAPC4 | ANAPC4 | ANAPC4 | 6645 | 0.065 | 0.48 | NO |
| 66 | BUB3 | BUB3 | BUB3 | 6709 | 0.064 | 0.48 | NO |
| 67 | ORC2L | ORC2L | ORC2L | 6785 | 0.063 | 0.48 | NO |
| 68 | ATR | ATR | ATR | 7043 | 0.058 | 0.47 | NO |
| 69 | YWHAQ | YWHAQ | YWHAQ | 7052 | 0.058 | 0.47 | NO |
| 70 | TGFB2 | TGFB2 | TGFB2 | 7146 | 0.056 | 0.47 | NO |
| 71 | SMC1A | SMC1A | SMC1A | 7338 | 0.053 | 0.46 | NO |
| 72 | ORC4L | ORC4L | ORC4L | 7383 | 0.052 | 0.46 | NO |
| 73 | ANAPC1 | ANAPC1 | ANAPC1 | 7388 | 0.052 | 0.46 | NO |
| 74 | YWHAB | YWHAB | YWHAB | 7528 | 0.05 | 0.46 | NO |
| 75 | ANAPC5 | ANAPC5 | ANAPC5 | 7577 | 0.049 | 0.46 | NO |
| 76 | SMAD2 | SMAD2 | SMAD2 | 7750 | 0.047 | 0.45 | NO |
| 77 | RBX1 | RBX1 | RBX1 | 7795 | 0.046 | 0.45 | NO |
| 78 | MYC | MYC | MYC | 7910 | 0.044 | 0.44 | NO |
| 79 | CDC26 | CDC26 | CDC26 | 8124 | 0.04 | 0.43 | NO |
| 80 | YWHAH | YWHAH | YWHAH | 8161 | 0.04 | 0.43 | NO |
| 81 | ATM | ATM | ATM | 8223 | 0.038 | 0.43 | NO |
| 82 | TFDP1 | TFDP1 | TFDP1 | 8296 | 0.037 | 0.43 | NO |
| 83 | CDK7 | CDK7 | CDK7 | 8447 | 0.035 | 0.42 | NO |
| 84 | CDKN1C | CDKN1C | CDKN1C | 8503 | 0.034 | 0.42 | NO |
| 85 | ABL1 | ABL1 | ABL1 | 8520 | 0.034 | 0.42 | NO |
| 86 | YWHAG | YWHAG | YWHAG | 8613 | 0.032 | 0.42 | NO |
| 87 | WEE1 | WEE1 | WEE1 | 8696 | 0.031 | 0.41 | NO |
| 88 | CDC23 | CDC23 | CDC23 | 8771 | 0.03 | 0.41 | NO |
| 89 | ORC5L | ORC5L | ORC5L | 8875 | 0.028 | 0.41 | NO |
| 90 | CDK6 | CDK6 | CDK6 | 9179 | 0.024 | 0.39 | NO |
| 91 | YWHAE | YWHAE | YWHAE | 9643 | 0.017 | 0.36 | NO |
| 92 | ORC3L | ORC3L | ORC3L | 9681 | 0.016 | 0.36 | NO |
| 93 | MAD1L1 | MAD1L1 | MAD1L1 | 9918 | 0.013 | 0.35 | NO |
| 94 | CDC16 | CDC16 | CDC16 | 9966 | 0.012 | 0.35 | NO |
| 95 | CCNH | CCNH | CCNH | 10134 | 0.0092 | 0.34 | NO |
| 96 | STAG2 | STAG2 | STAG2 | 10240 | 0.0076 | 0.33 | NO |
| 97 | SKP1 | SKP1 | SKP1 | 10464 | 0.0046 | 0.32 | NO |
| 98 | ANAPC13 | ANAPC13 | ANAPC13 | 10774 | -0.00071 | 0.3 | NO |
| 99 | SMC3 | SMC3 | SMC3 | 10862 | -0.0021 | 0.3 | NO |
| 100 | CUL1 | CUL1 | CUL1 | 10916 | -0.003 | 0.3 | NO |
| 101 | GSK3B | GSK3B | GSK3B | 11142 | -0.0065 | 0.28 | NO |
| 102 | ANAPC2 | ANAPC2 | ANAPC2 | 11446 | -0.012 | 0.27 | NO |
| 103 | SMAD4 | SMAD4 | SMAD4 | 11504 | -0.013 | 0.26 | NO |
| 104 | CREBBP | CREBBP | CREBBP | 11627 | -0.015 | 0.26 | NO |
| 105 | MDM2 | MDM2 | MDM2 | 11919 | -0.021 | 0.24 | NO |
| 106 | WEE2 | WEE2 | WEE2 | 12026 | -0.023 | 0.24 | NO |
| 107 | ANAPC10 | ANAPC10 | ANAPC10 | 12098 | -0.025 | 0.23 | NO |
| 108 | RB1 | RB1 | RB1 | 12331 | -0.029 | 0.22 | NO |
| 109 | SMAD3 | SMAD3 | SMAD3 | 12611 | -0.034 | 0.21 | NO |
| 110 | CDKN1B | CDKN1B | CDKN1B | 12914 | -0.041 | 0.19 | NO |
| 111 | FZR1 | FZR1 | FZR1 | 12932 | -0.042 | 0.19 | NO |
| 112 | STAG1 | STAG1 | STAG1 | 13002 | -0.043 | 0.19 | NO |
| 113 | EP300 | EP300 | EP300 | 13199 | -0.048 | 0.18 | NO |
| 114 | TGFB3 | TGFB3 | TGFB3 | 13305 | -0.05 | 0.18 | NO |
| 115 | TP53 | TP53 | TP53 | 13942 | -0.068 | 0.14 | NO |
| 116 | CDKN1A | CDKN1A | CDKN1A | 14166 | -0.076 | 0.14 | NO |
| 117 | RBL2 | RBL2 | RBL2 | 15377 | -0.12 | 0.073 | NO |
| 118 | CCND1 | CCND1 | CCND1 | 15819 | -0.14 | 0.054 | NO |
| 119 | CCNB3 | CCNB3 | CCNB3 | 15847 | -0.15 | 0.06 | NO |
| 120 | GADD45B | GADD45B | GADD45B | 16911 | -0.25 | 0.01 | NO |
| 121 | GADD45A | GADD45A | GADD45A | 16946 | -0.26 | 0.02 | NO |
| 122 | GADD45G | GADD45G | GADD45G | 16977 | -0.26 | 0.03 | NO |
| 123 | CDC14B | CDC14B | CDC14B | 17064 | -0.28 | 0.038 | NO |
Figure S5. Get High-res Image This plot shows mRNAseq_cNMF expression data heatmap (on the left) a RunningEnrichmentScore(RES) plot (on the top right) and a Signal2Noise(S2N) plot (on the bottom right) of genes in the pathway: BIOCARTA MPR PATHWAY.
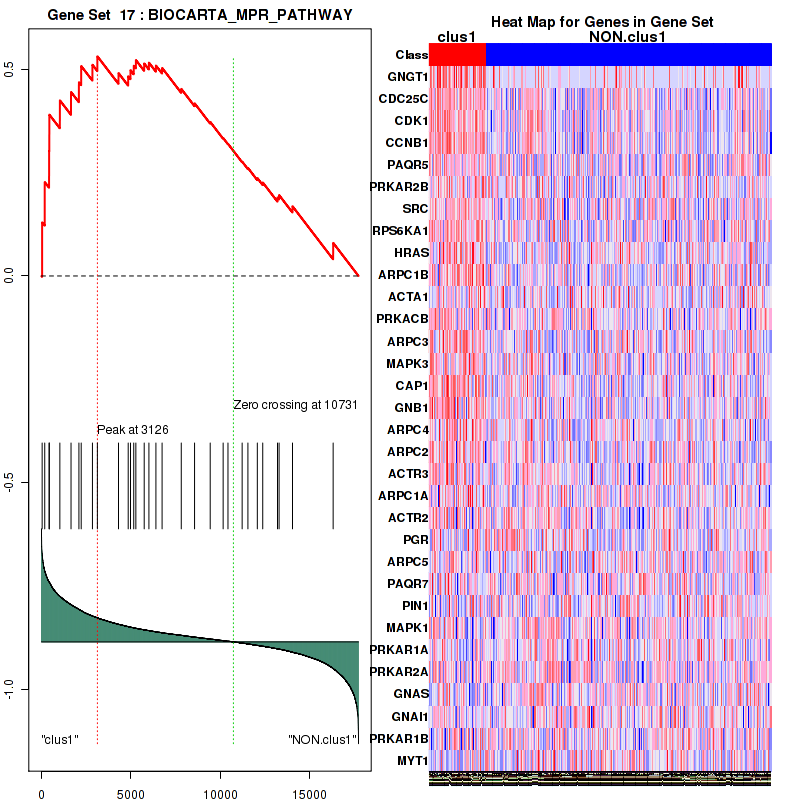
Figure S6. Get High-res Image For the top 5 core enriched genes in the pathway: BIOCARTA MPR PATHWAY, this volcano plot shows how much they are up/down-regulated and significant. The significance was calculated by empirical bayesian fit
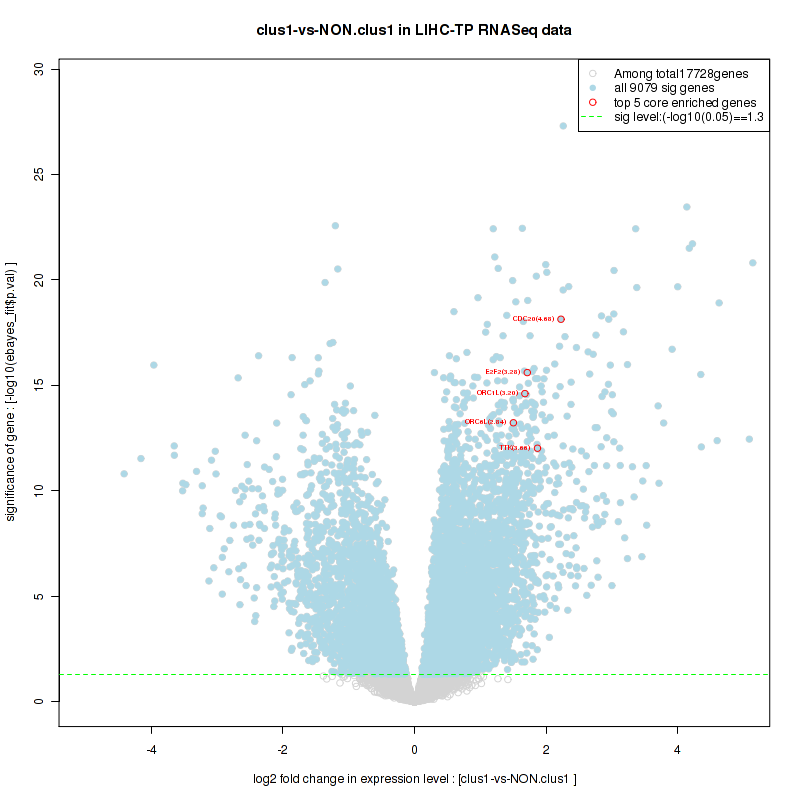
Table S4. Get Full Table This table shows a Running Enrichment Score (RES) of each gene in this pathway, that is, the enrichment score at this point in the ranked list of genes. All genes are ranked by Signal-to-Noise (S2N), a measure of similarity as default and are used to obtain ES matrix of all genes. In this way, GSEA tool uses expression pattern of not only overlapped genes but also not-overlapped genes to produce ES matrix.
| Rank | GENE | SYMBOL | DESC | LIST.LOC | S2N | RES | CORE_ENRICHMENT |
|---|---|---|---|---|---|---|---|
| 1 | RAD54L | RAD54L | RAD54L | 17 | 0.64 | 0.13 | YES |
| 2 | EME1 | EME1 | EME1 | 68 | 0.57 | 0.24 | YES |
| 3 | RAD51 | RAD51 | RAD51 | 100 | 0.54 | 0.35 | YES |
| 4 | BLM | BLM | BLM | 187 | 0.49 | 0.44 | YES |
| 5 | XRCC2 | XRCC2 | XRCC2 | 443 | 0.41 | 0.51 | YES |
| 6 | RAD54B | RAD54B | RAD54B | 791 | 0.34 | 0.56 | YES |
| 7 | BRCA2 | BRCA2 | BRCA2 | 1998 | 0.23 | 0.53 | YES |
| 8 | RAD51L1 | RAD51L1 | RAD51L1 | 2148 | 0.22 | 0.57 | YES |
| 9 | XRCC3 | XRCC3 | XRCC3 | 2361 | 0.2 | 0.6 | YES |
| 10 | RPA4 | RPA4 | RPA4 | 2393 | 0.2 | 0.64 | YES |
| 11 | POLD1 | POLD1 | POLD1 | 2456 | 0.2 | 0.67 | YES |
| 12 | POLD3 | POLD3 | POLD3 | 3632 | 0.14 | 0.64 | NO |
| 13 | RPA2 | RPA2 | RPA2 | 4240 | 0.12 | 0.63 | NO |
| 14 | MRE11A | MRE11A | MRE11A | 4254 | 0.12 | 0.65 | NO |
| 15 | RPA3 | RPA3 | RPA3 | 5228 | 0.095 | 0.62 | NO |
| 16 | RAD51L3 | RAD51L3 | RAD51L3 | 5410 | 0.091 | 0.62 | NO |
| 17 | NBN | NBN | NBN | 6172 | 0.074 | 0.59 | NO |
| 18 | SSBP1 | SSBP1 | SSBP1 | 6601 | 0.066 | 0.58 | NO |
| 19 | RPA1 | RPA1 | RPA1 | 6975 | 0.059 | 0.57 | NO |
| 20 | SHFM1 | SHFM1 | SHFM1 | 8539 | 0.034 | 0.49 | NO |
| 21 | MUS81 | MUS81 | MUS81 | 8978 | 0.027 | 0.47 | NO |
| 22 | POLD2 | POLD2 | POLD2 | 9017 | 0.026 | 0.48 | NO |
| 23 | TOP3A | TOP3A | TOP3A | 9301 | 0.022 | 0.46 | NO |
| 24 | TOP3B | TOP3B | TOP3B | 10567 | 0.003 | 0.39 | NO |
| 25 | RAD50 | RAD50 | RAD50 | 10796 | -0.0011 | 0.38 | NO |
| 26 | POLD4 | POLD4 | POLD4 | 11493 | -0.013 | 0.34 | NO |
| 27 | RAD52 | RAD52 | RAD52 | 12851 | -0.04 | 0.28 | NO |
Figure S7. Get High-res Image This plot shows mRNAseq_cNMF expression data heatmap (on the left) a RunningEnrichmentScore(RES) plot (on the top right) and a Signal2Noise(S2N) plot (on the bottom right) of genes in the pathway: BIOCARTA TOLL PATHWAY.
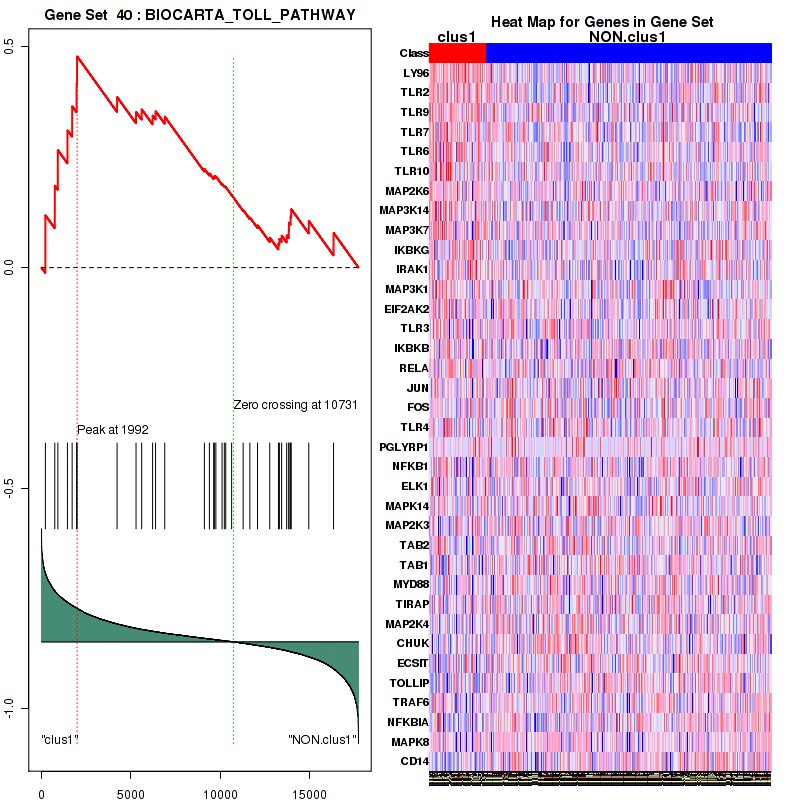
Figure S8. Get High-res Image For the top 5 core enriched genes in the pathway: BIOCARTA TOLL PATHWAY, this volcano plot shows how much they are up/down-regulated and significant. The significance was calculated by empirical bayesian fit
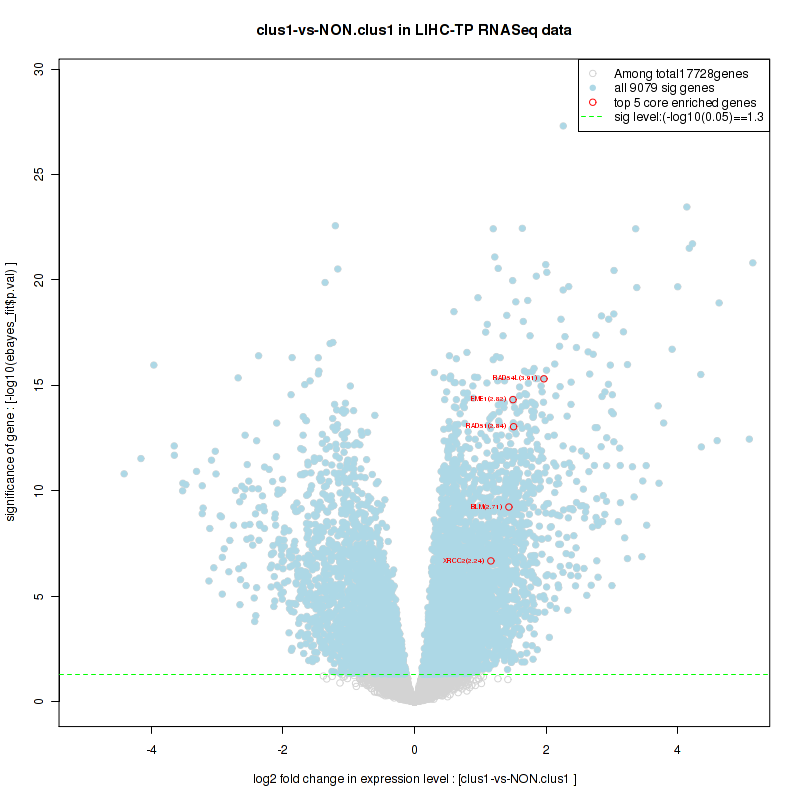
Table S5. Get Full Table This table shows a Running Enrichment Score (RES) of each gene in this pathway, that is, the enrichment score at this point in the ranked list of genes. All genes are ranked by Signal-to-Noise (S2N), a measure of similarity as default and are used to obtain ES matrix of all genes. In this way, GSEA tool uses expression pattern of not only overlapped genes but also not-overlapped genes to produce ES matrix.
| Rank | GENE | SYMBOL | DESC | LIST.LOC | S2N | RES | CORE_ENRICHMENT |
|---|---|---|---|---|---|---|---|
| 1 | POLE2 | POLE2 | POLE2 | 795 | 0.34 | 0.02 | YES |
| 2 | MCM2 | MCM2 | MCM2 | 1208 | 0.3 | 0.052 | YES |
| 3 | PRIM1 | PRIM1 | PRIM1 | 1446 | 0.27 | 0.09 | YES |
| 4 | RFC4 | RFC4 | RFC4 | 1606 | 0.26 | 0.13 | YES |
| 5 | DNA2 | DNA2 | DNA2 | 2035 | 0.23 | 0.15 | YES |
| 6 | POLA2 | POLA2 | POLA2 | 2068 | 0.23 | 0.19 | YES |
| 7 | MCM4 | MCM4 | MCM4 | 2087 | 0.22 | 0.23 | YES |
| 8 | RNASEH2A | RNASEH2A | RNASEH2A | 2123 | 0.22 | 0.27 | YES |
| 9 | MCM6 | MCM6 | MCM6 | 2125 | 0.22 | 0.31 | YES |
| 10 | PRIM2 | PRIM2 | PRIM2 | 2315 | 0.21 | 0.34 | YES |
| 11 | MCM7 | MCM7 | MCM7 | 2363 | 0.2 | 0.38 | YES |
| 12 | RPA4 | RPA4 | RPA4 | 2393 | 0.2 | 0.41 | YES |
| 13 | FEN1 | FEN1 | FEN1 | 2445 | 0.2 | 0.45 | YES |
| 14 | POLD1 | POLD1 | POLD1 | 2456 | 0.2 | 0.48 | YES |
| 15 | POLE4 | POLE4 | POLE4 | 2998 | 0.17 | 0.49 | YES |
| 16 | MCM5 | MCM5 | MCM5 | 3202 | 0.16 | 0.51 | YES |
| 17 | MCM3 | MCM3 | MCM3 | 3252 | 0.16 | 0.53 | YES |
| 18 | RFC3 | RFC3 | RFC3 | 3562 | 0.15 | 0.54 | YES |
| 19 | POLD3 | POLD3 | POLD3 | 3632 | 0.14 | 0.57 | YES |
| 20 | LIG1 | LIG1 | LIG1 | 4076 | 0.13 | 0.57 | YES |
| 21 | RFC2 | RFC2 | RFC2 | 4126 | 0.13 | 0.59 | YES |
| 22 | PCNA | PCNA | PCNA | 4203 | 0.12 | 0.61 | YES |
| 23 | RPA2 | RPA2 | RPA2 | 4240 | 0.12 | 0.63 | YES |
| 24 | RFC5 | RFC5 | RFC5 | 4800 | 0.11 | 0.62 | YES |
| 25 | POLE3 | POLE3 | POLE3 | 5119 | 0.098 | 0.62 | YES |
| 26 | RPA3 | RPA3 | RPA3 | 5228 | 0.095 | 0.63 | YES |
| 27 | RNASEH2B | RNASEH2B | RNASEH2B | 5972 | 0.079 | 0.6 | NO |
| 28 | RNASEH1 | RNASEH1 | RNASEH1 | 6474 | 0.068 | 0.59 | NO |
| 29 | SSBP1 | SSBP1 | SSBP1 | 6601 | 0.066 | 0.59 | NO |
| 30 | POLE | POLE | POLE | 6647 | 0.065 | 0.6 | NO |
| 31 | RPA1 | RPA1 | RPA1 | 6975 | 0.059 | 0.59 | NO |
| 32 | RNASEH2C | RNASEH2C | RNASEH2C | 8869 | 0.028 | 0.49 | NO |
| 33 | POLD2 | POLD2 | POLD2 | 9017 | 0.026 | 0.49 | NO |
| 34 | RFC1 | RFC1 | RFC1 | 10369 | 0.0057 | 0.41 | NO |
| 35 | POLD4 | POLD4 | POLD4 | 11493 | -0.013 | 0.35 | NO |
Figure S9. Get High-res Image This plot shows mRNAseq_cNMF expression data heatmap (on the left) a RunningEnrichmentScore(RES) plot (on the top right) and a Signal2Noise(S2N) plot (on the bottom right) of genes in the pathway: KEGG RNA DEGRADATION.
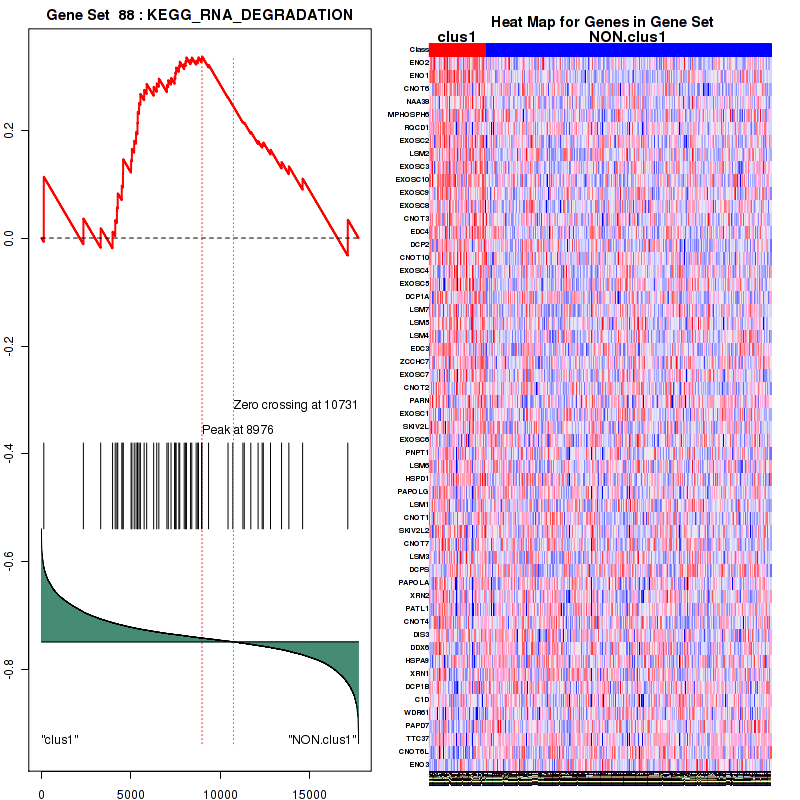
Figure S10. Get High-res Image For the top 5 core enriched genes in the pathway: KEGG RNA DEGRADATION, this volcano plot shows how much they are up/down-regulated and significant. The significance was calculated by empirical bayesian fit

Table S6. Get Full Table This table shows a Running Enrichment Score (RES) of each gene in this pathway, that is, the enrichment score at this point in the ranked list of genes. All genes are ranked by Signal-to-Noise (S2N), a measure of similarity as default and are used to obtain ES matrix of all genes. In this way, GSEA tool uses expression pattern of not only overlapped genes but also not-overlapped genes to produce ES matrix.
| Rank | GENE | SYMBOL | DESC | LIST.LOC | S2N | RES | CORE_ENRICHMENT |
|---|---|---|---|---|---|---|---|
| 1 | GNGT1 | GNGT1 | GNGT1 | 38 | 0.61 | 0.13 | YES |
| 2 | CDC25C | CDC25C | CDC25C | 182 | 0.49 | 0.23 | YES |
| 3 | CDK1 | CDK1 | CDK1 | 427 | 0.41 | 0.3 | YES |
| 4 | CCNB1 | CCNB1 | CCNB1 | 440 | 0.41 | 0.39 | YES |
| 5 | PAQR5 | PAQR5 | PAQR5 | 1029 | 0.31 | 0.42 | YES |
| 6 | PRKAR2B | PRKAR2B | PRKAR2B | 1653 | 0.26 | 0.44 | YES |
| 7 | SRC | SRC | SRC | 2094 | 0.22 | 0.47 | YES |
| 8 | RPS6KA1 | RPS6KA1 | RPS6KA1 | 2222 | 0.22 | 0.51 | YES |
| 9 | HRAS | HRAS | HRAS | 2849 | 0.18 | 0.51 | YES |
| 10 | ARPC1B | ARPC1B | ARPC1B | 3126 | 0.17 | 0.53 | YES |
| 11 | ACTA1 | ACTA1 | ACTA1 | 4308 | 0.12 | 0.49 | NO |
| 12 | PRKACB | PRKACB | PRKACB | 4849 | 0.1 | 0.48 | NO |
| 13 | ARPC3 | ARPC3 | ARPC3 | 4978 | 0.1 | 0.5 | NO |
| 14 | MAPK3 | MAPK3 | MAPK3 | 5160 | 0.097 | 0.51 | NO |
| 15 | CAP1 | CAP1 | CAP1 | 5279 | 0.094 | 0.52 | NO |
| 16 | GNB1 | GNB1 | GNB1 | 5744 | 0.083 | 0.51 | NO |
| 17 | ARPC4 | ARPC4 | ARPC4 | 6007 | 0.078 | 0.52 | NO |
| 18 | ARPC2 | ARPC2 | ARPC2 | 6399 | 0.07 | 0.51 | NO |
| 19 | ACTR3 | ACTR3 | ACTR3 | 6746 | 0.063 | 0.5 | NO |
| 20 | ARPC1A | ARPC1A | ARPC1A | 7816 | 0.045 | 0.45 | NO |
| 21 | ACTR2 | ACTR2 | ACTR2 | 8561 | 0.033 | 0.42 | NO |
| 22 | PGR | PGR | PGR | 9435 | 0.02 | 0.37 | NO |
| 23 | ARPC5 | ARPC5 | ARPC5 | 10158 | 0.0088 | 0.33 | NO |
| 24 | PAQR7 | PAQR7 | PAQR7 | 10427 | 0.005 | 0.32 | NO |
| 25 | PIN1 | PIN1 | PIN1 | 11221 | -0.0077 | 0.28 | NO |
| 26 | MAPK1 | MAPK1 | MAPK1 | 11544 | -0.014 | 0.26 | NO |
| 27 | PRKAR1A | PRKAR1A | PRKAR1A | 12070 | -0.024 | 0.24 | NO |
| 28 | PRKAR2A | PRKAR2A | PRKAR2A | 12373 | -0.03 | 0.23 | NO |
| 29 | GNAS | GNAS | GNAS | 13197 | -0.048 | 0.19 | NO |
| 30 | GNAI1 | GNAI1 | GNAI1 | 13286 | -0.05 | 0.2 | NO |
| 31 | PRKAR1B | PRKAR1B | PRKAR1B | 14035 | -0.071 | 0.17 | NO |
| 32 | MYT1 | MYT1 | MYT1 | 16310 | -0.18 | 0.08 | NO |
Figure S11. Get High-res Image This plot shows mRNAseq_cNMF expression data heatmap (on the left) a RunningEnrichmentScore(RES) plot (on the top right) and a Signal2Noise(S2N) plot (on the bottom right) of genes in the pathway: KEGG DNA REPLICATION.
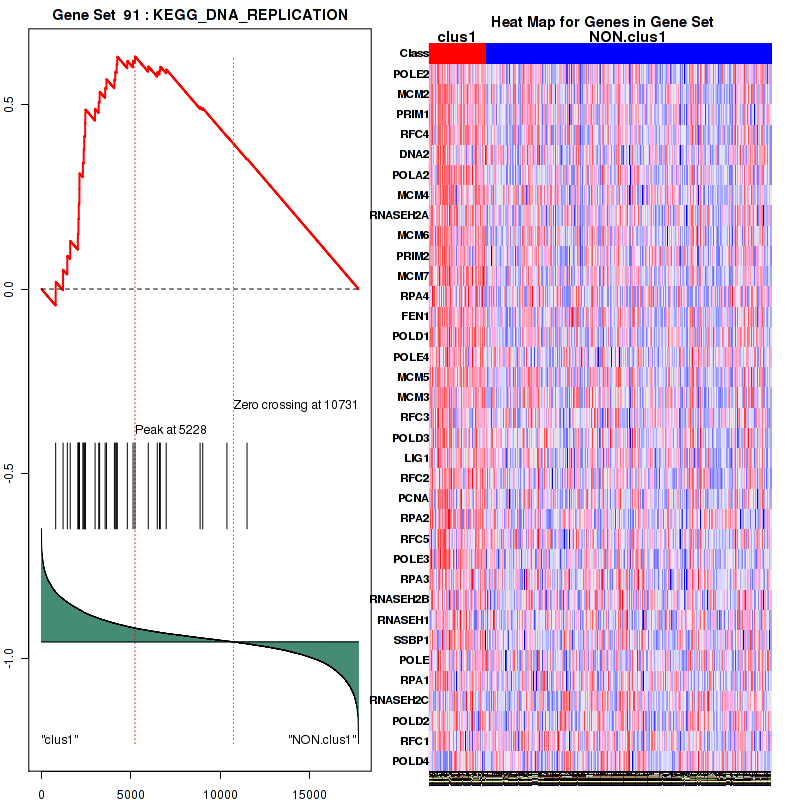
Figure S12. Get High-res Image For the top 5 core enriched genes in the pathway: KEGG DNA REPLICATION, this volcano plot shows how much they are up/down-regulated and significant. The significance was calculated by empirical bayesian fit

Table S7. Get Full Table This table shows a Running Enrichment Score (RES) of each gene in this pathway, that is, the enrichment score at this point in the ranked list of genes. All genes are ranked by Signal-to-Noise (S2N), a measure of similarity as default and are used to obtain ES matrix of all genes. In this way, GSEA tool uses expression pattern of not only overlapped genes but also not-overlapped genes to produce ES matrix.
| Rank | GENE | SYMBOL | DESC | LIST.LOC | S2N | RES | CORE_ENRICHMENT |
|---|---|---|---|---|---|---|---|
| 1 | GNGT1 | GNGT1 | GNGT1 | 38 | 0.61 | 0.17 | YES |
| 2 | PLCB1 | PLCB1 | PLCB1 | 535 | 0.39 | 0.26 | YES |
| 3 | NCF2 | NCF2 | NCF2 | 1007 | 0.32 | 0.32 | YES |
| 4 | FPR1 | FPR1 | FPR1 | 1246 | 0.29 | 0.39 | YES |
| 5 | NCF1C | NCF1C | NCF1C | 1487 | 0.27 | 0.46 | YES |
| 6 | MAP2K6 | MAP2K6 | MAP2K6 | 1992 | 0.23 | 0.5 | YES |
| 7 | HRAS | HRAS | HRAS | 2849 | 0.18 | 0.5 | YES |
| 8 | PAK1 | PAK1 | PAK1 | 4100 | 0.13 | 0.46 | NO |
| 9 | PIK3C2G | PIK3C2G | PIK3C2G | 4937 | 0.1 | 0.45 | NO |
| 10 | NFATC4 | NFATC4 | NFATC4 | 4963 | 0.1 | 0.48 | NO |
| 11 | MAPK3 | MAPK3 | MAPK3 | 5160 | 0.097 | 0.49 | NO |
| 12 | GNB1 | GNB1 | GNB1 | 5744 | 0.083 | 0.48 | NO |
| 13 | RAC1 | RAC1 | RAC1 | 6226 | 0.073 | 0.48 | NO |
| 14 | MAP3K1 | MAP3K1 | MAP3K1 | 6381 | 0.07 | 0.49 | NO |
| 15 | CAMK1G | CAMK1G | CAMK1G | 7022 | 0.058 | 0.47 | NO |
| 16 | MAP2K2 | MAP2K2 | MAP2K2 | 7689 | 0.048 | 0.44 | NO |
| 17 | CALM3 | CALM3 | CALM3 | 8302 | 0.037 | 0.42 | NO |
| 18 | CALM2 | CALM2 | CALM2 | 8639 | 0.032 | 0.41 | NO |
| 19 | PPP3CA | PPP3CA | PPP3CA | 8849 | 0.029 | 0.41 | NO |
| 20 | NFATC1 | NFATC1 | NFATC1 | 8895 | 0.028 | 0.41 | NO |
| 21 | CAMK1 | CAMK1 | CAMK1 | 9341 | 0.021 | 0.39 | NO |
| 22 | PPP3CC | PPP3CC | PPP3CC | 9383 | 0.021 | 0.4 | NO |
| 23 | RELA | RELA | RELA | 9629 | 0.017 | 0.39 | NO |
| 24 | PPP3CB | PPP3CB | PPP3CB | 10246 | 0.0076 | 0.36 | NO |
| 25 | NFKB1 | NFKB1 | NFKB1 | 10302 | 0.0068 | 0.36 | NO |
| 26 | ELK1 | ELK1 | ELK1 | 10634 | 0.0019 | 0.34 | NO |
| 27 | RAF1 | RAF1 | RAF1 | 11143 | -0.0065 | 0.31 | NO |
| 28 | MAP2K1 | MAP2K1 | MAP2K1 | 11250 | -0.0082 | 0.31 | NO |
| 29 | MAPK14 | MAPK14 | MAPK14 | 11276 | -0.0086 | 0.31 | NO |
| 30 | MAPK1 | MAPK1 | MAPK1 | 11544 | -0.014 | 0.3 | NO |
| 31 | MAP2K3 | MAP2K3 | MAP2K3 | 11653 | -0.016 | 0.3 | NO |
| 32 | NFATC3 | NFATC3 | NFATC3 | 11672 | -0.016 | 0.3 | NO |
| 33 | CALM1 | CALM1 | CALM1 | 12528 | -0.033 | 0.26 | NO |
| 34 | NFATC2 | NFATC2 | NFATC2 | 13238 | -0.049 | 0.23 | NO |
| 35 | NFKBIA | NFKBIA | NFKBIA | 13964 | -0.069 | 0.21 | NO |
Figure S13. Get High-res Image This plot shows mRNAseq_cNMF expression data heatmap (on the left) a RunningEnrichmentScore(RES) plot (on the top right) and a Signal2Noise(S2N) plot (on the bottom right) of genes in the pathway: KEGG SPLICEOSOME.
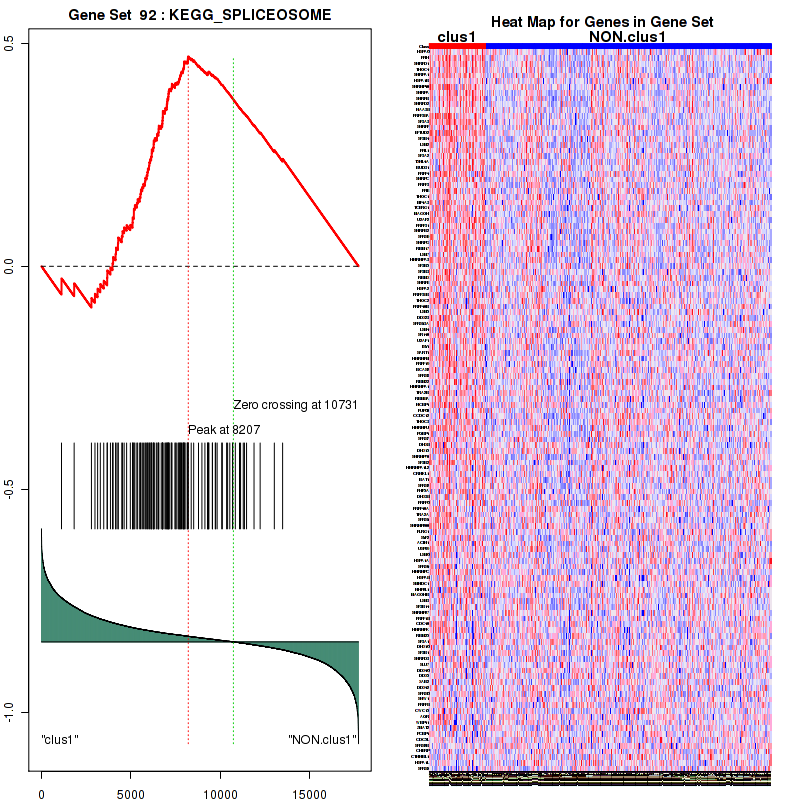
Figure S14. Get High-res Image For the top 5 core enriched genes in the pathway: KEGG SPLICEOSOME, this volcano plot shows how much they are up/down-regulated and significant. The significance was calculated by empirical bayesian fit

Table S8. Get Full Table This table shows a Running Enrichment Score (RES) of each gene in this pathway, that is, the enrichment score at this point in the ranked list of genes. All genes are ranked by Signal-to-Noise (S2N), a measure of similarity as default and are used to obtain ES matrix of all genes. In this way, GSEA tool uses expression pattern of not only overlapped genes but also not-overlapped genes to produce ES matrix.
| Rank | GENE | SYMBOL | DESC | LIST.LOC | S2N | RES | CORE_ENRICHMENT |
|---|---|---|---|---|---|---|---|
| 1 | CDC20 | CDC20 | CDC20 | 37 | 0.61 | 0.036 | YES |
| 2 | SGOL1 | SGOL1 | SGOL1 | 84 | 0.55 | 0.069 | YES |
| 3 | PLK1 | PLK1 | PLK1 | 109 | 0.53 | 0.1 | YES |
| 4 | PKMYT1 | PKMYT1 | PKMYT1 | 115 | 0.53 | 0.13 | YES |
| 5 | BUB1 | BUB1 | BUB1 | 134 | 0.52 | 0.17 | YES |
| 6 | PTTG1 | PTTG1 | PTTG1 | 138 | 0.51 | 0.2 | YES |
| 7 | CDC25C | CDC25C | CDC25C | 182 | 0.49 | 0.23 | YES |
| 8 | CCNB2 | CCNB2 | CCNB2 | 276 | 0.45 | 0.25 | YES |
| 9 | CDK1 | CDK1 | CDK1 | 427 | 0.41 | 0.27 | YES |
| 10 | FBXO43 | FBXO43 | FBXO43 | 430 | 0.41 | 0.29 | YES |
| 11 | CCNB1 | CCNB1 | CCNB1 | 440 | 0.41 | 0.32 | YES |
| 12 | CCNE1 | CCNE1 | CCNE1 | 461 | 0.41 | 0.34 | YES |
| 13 | MAD2L1 | MAD2L1 | MAD2L1 | 464 | 0.41 | 0.37 | YES |
| 14 | PTTG2 | PTTG2 | PTTG2 | 592 | 0.38 | 0.38 | YES |
| 15 | FBXO5 | FBXO5 | FBXO5 | 593 | 0.38 | 0.41 | YES |
| 16 | CCNE2 | CCNE2 | CCNE2 | 594 | 0.38 | 0.43 | YES |
| 17 | ESPL1 | ESPL1 | ESPL1 | 827 | 0.34 | 0.44 | YES |
| 18 | SMC1B | SMC1B | SMC1B | 840 | 0.34 | 0.46 | YES |
| 19 | ITPR3 | ITPR3 | ITPR3 | 1274 | 0.29 | 0.46 | NO |
| 20 | AURKA | AURKA | AURKA | 1861 | 0.24 | 0.44 | NO |
| 21 | SPDYA | SPDYA | SPDYA | 2031 | 0.23 | 0.44 | NO |
| 22 | RPS6KA1 | RPS6KA1 | RPS6KA1 | 2222 | 0.22 | 0.44 | NO |
| 23 | REC8 | REC8 | REC8 | 2431 | 0.2 | 0.45 | NO |
| 24 | RPS6KA6 | RPS6KA6 | RPS6KA6 | 2691 | 0.19 | 0.44 | NO |
| 25 | MAD2L2 | MAD2L2 | MAD2L2 | 2940 | 0.17 | 0.44 | NO |
| 26 | CHP2 | CHP2 | CHP2 | 3053 | 0.17 | 0.44 | NO |
| 27 | ADCY7 | ADCY7 | ADCY7 | 4061 | 0.13 | 0.4 | NO |
| 28 | CDK2 | CDK2 | CDK2 | 4189 | 0.12 | 0.4 | NO |
| 29 | YWHAZ | YWHAZ | YWHAZ | 4191 | 0.12 | 0.4 | NO |
| 30 | PPP1CC | PPP1CC | PPP1CC | 4477 | 0.12 | 0.4 | NO |
| 31 | ANAPC7 | ANAPC7 | ANAPC7 | 4525 | 0.12 | 0.4 | NO |
| 32 | PRKACB | PRKACB | PRKACB | 4849 | 0.1 | 0.39 | NO |
| 33 | MAPK3 | MAPK3 | MAPK3 | 5160 | 0.097 | 0.38 | NO |
| 34 | PRKX | PRKX | PRKX | 5275 | 0.094 | 0.38 | NO |
| 35 | MAPK12 | MAPK12 | MAPK12 | 5299 | 0.094 | 0.38 | NO |
| 36 | CDC27 | CDC27 | CDC27 | 6213 | 0.074 | 0.33 | NO |
| 37 | ITPR1 | ITPR1 | ITPR1 | 6264 | 0.072 | 0.34 | NO |
| 38 | RPS6KA3 | RPS6KA3 | RPS6KA3 | 6306 | 0.072 | 0.34 | NO |
| 39 | ANAPC11 | ANAPC11 | ANAPC11 | 6422 | 0.069 | 0.34 | NO |
| 40 | PPP1CA | PPP1CA | PPP1CA | 6492 | 0.068 | 0.34 | NO |
| 41 | ANAPC4 | ANAPC4 | ANAPC4 | 6645 | 0.065 | 0.33 | NO |
| 42 | CPEB1 | CPEB1 | CPEB1 | 6696 | 0.064 | 0.33 | NO |
| 43 | YWHAQ | YWHAQ | YWHAQ | 7052 | 0.058 | 0.32 | NO |
| 44 | PPP2R1A | PPP2R1A | PPP2R1A | 7316 | 0.053 | 0.3 | NO |
| 45 | SMC1A | SMC1A | SMC1A | 7338 | 0.053 | 0.31 | NO |
| 46 | ANAPC1 | ANAPC1 | ANAPC1 | 7388 | 0.052 | 0.31 | NO |
| 47 | YWHAB | YWHAB | YWHAB | 7528 | 0.05 | 0.3 | NO |
| 48 | ANAPC5 | ANAPC5 | ANAPC5 | 7577 | 0.049 | 0.3 | NO |
| 49 | RBX1 | RBX1 | RBX1 | 7795 | 0.046 | 0.29 | NO |
| 50 | CDC26 | CDC26 | CDC26 | 8124 | 0.04 | 0.28 | NO |
| 51 | YWHAH | YWHAH | YWHAH | 8161 | 0.04 | 0.28 | NO |
| 52 | CALM3 | CALM3 | CALM3 | 8302 | 0.037 | 0.27 | NO |
| 53 | PPP2CA | PPP2CA | PPP2CA | 8472 | 0.035 | 0.26 | NO |
| 54 | PPP1CB | PPP1CB | PPP1CB | 8515 | 0.034 | 0.26 | NO |
| 55 | YWHAG | YWHAG | YWHAG | 8613 | 0.032 | 0.26 | NO |
| 56 | CALM2 | CALM2 | CALM2 | 8639 | 0.032 | 0.26 | NO |
| 57 | CDC23 | CDC23 | CDC23 | 8771 | 0.03 | 0.26 | NO |
| 58 | PPP3CA | PPP3CA | PPP3CA | 8849 | 0.029 | 0.25 | NO |
| 59 | PPP2R5E | PPP2R5E | PPP2R5E | 8859 | 0.028 | 0.25 | NO |
| 60 | PPP2R5D | PPP2R5D | PPP2R5D | 8998 | 0.026 | 0.25 | NO |
| 61 | PPP2R5B | PPP2R5B | PPP2R5B | 9309 | 0.022 | 0.23 | NO |
| 62 | PPP3CC | PPP3CC | PPP3CC | 9383 | 0.021 | 0.23 | NO |
| 63 | PGR | PGR | PGR | 9435 | 0.02 | 0.23 | NO |
| 64 | YWHAE | YWHAE | YWHAE | 9643 | 0.017 | 0.22 | NO |
| 65 | CDC16 | CDC16 | CDC16 | 9966 | 0.012 | 0.2 | NO |
| 66 | PPP3CB | PPP3CB | PPP3CB | 10246 | 0.0076 | 0.18 | NO |
| 67 | SKP1 | SKP1 | SKP1 | 10464 | 0.0046 | 0.17 | NO |
| 68 | FBXW11 | FBXW11 | FBXW11 | 10468 | 0.0046 | 0.17 | NO |
| 69 | IGF1R | IGF1R | IGF1R | 10541 | 0.0033 | 0.17 | NO |
| 70 | ANAPC13 | ANAPC13 | ANAPC13 | 10774 | -0.00071 | 0.16 | NO |
| 71 | ADCY6 | ADCY6 | ADCY6 | 10805 | -0.0012 | 0.15 | NO |
| 72 | SMC3 | SMC3 | SMC3 | 10862 | -0.0021 | 0.15 | NO |
| 73 | CUL1 | CUL1 | CUL1 | 10916 | -0.003 | 0.15 | NO |
| 74 | CALML3 | CALML3 | CALML3 | 11111 | -0.0059 | 0.14 | NO |
| 75 | MAP2K1 | MAP2K1 | MAP2K1 | 11250 | -0.0082 | 0.13 | NO |
| 76 | CAMK2D | CAMK2D | CAMK2D | 11305 | -0.0091 | 0.13 | NO |
| 77 | ANAPC2 | ANAPC2 | ANAPC2 | 11446 | -0.012 | 0.12 | NO |
| 78 | MAPK1 | MAPK1 | MAPK1 | 11544 | -0.014 | 0.12 | NO |
| 79 | PPP3R1 | PPP3R1 | PPP3R1 | 11687 | -0.016 | 0.11 | NO |
| 80 | PPP2CB | PPP2CB | PPP2CB | 12034 | -0.023 | 0.09 | NO |
| 81 | ANAPC10 | ANAPC10 | ANAPC10 | 12098 | -0.025 | 0.088 | NO |
| 82 | CALM1 | CALM1 | CALM1 | 12528 | -0.033 | 0.065 | NO |
| 83 | CAMK2G | CAMK2G | CAMK2G | 12892 | -0.041 | 0.047 | NO |
| 84 | SLK | SLK | SLK | 12928 | -0.042 | 0.048 | NO |
| 85 | BTRC | BTRC | BTRC | 13100 | -0.046 | 0.041 | NO |
| 86 | PPP2R5C | PPP2R5C | PPP2R5C | 13147 | -0.046 | 0.042 | NO |
| 87 | ADCY2 | ADCY2 | ADCY2 | 13629 | -0.058 | 0.018 | NO |
| 88 | PPP2R5A | PPP2R5A | PPP2R5A | 14262 | -0.078 | -0.013 | NO |
| 89 | PRKACA | PRKACA | PRKACA | 14493 | -0.086 | -0.021 | NO |
| 90 | ADCY9 | ADCY9 | ADCY9 | 14637 | -0.09 | -0.023 | NO |
| 91 | ADCY5 | ADCY5 | ADCY5 | 15131 | -0.11 | -0.044 | NO |
| 92 | CHP | CHP | CHP | 15151 | -0.11 | -0.038 | NO |
| 93 | PPP2R1B | PPP2R1B | PPP2R1B | 15173 | -0.11 | -0.032 | NO |
| 94 | CALML6 | CALML6 | CALML6 | 15807 | -0.14 | -0.059 | NO |
| 95 | CAMK2A | CAMK2A | CAMK2A | 15907 | -0.15 | -0.055 | NO |
| 96 | ADCY8 | ADCY8 | ADCY8 | 15987 | -0.16 | -0.05 | NO |
| 97 | STAG3 | STAG3 | STAG3 | 16042 | -0.16 | -0.042 | NO |
| 98 | IGF1 | IGF1 | IGF1 | 16430 | -0.2 | -0.052 | NO |
| 99 | ITPR2 | ITPR2 | ITPR2 | 16601 | -0.21 | -0.048 | NO |
| 100 | ADCY1 | ADCY1 | ADCY1 | 16664 | -0.22 | -0.038 | NO |
| 101 | RPS6KA2 | RPS6KA2 | RPS6KA2 | 16863 | -0.24 | -0.034 | NO |
| 102 | SPDYC | SPDYC | SPDYC | 16990 | -0.26 | -0.024 | NO |
| 103 | AR | AR | AR | 17279 | -0.31 | -0.021 | NO |
| 104 | CAMK2B | CAMK2B | CAMK2B | 17306 | -0.32 | -0.0022 | NO |
| 105 | ADCY4 | ADCY4 | ADCY4 | 17572 | -0.41 | 0.0088 | NO |
Figure S15. Get High-res Image This plot shows mRNAseq_cNMF expression data heatmap (on the left) a RunningEnrichmentScore(RES) plot (on the top right) and a Signal2Noise(S2N) plot (on the bottom right) of genes in the pathway: KEGG BASE EXCISION REPAIR.
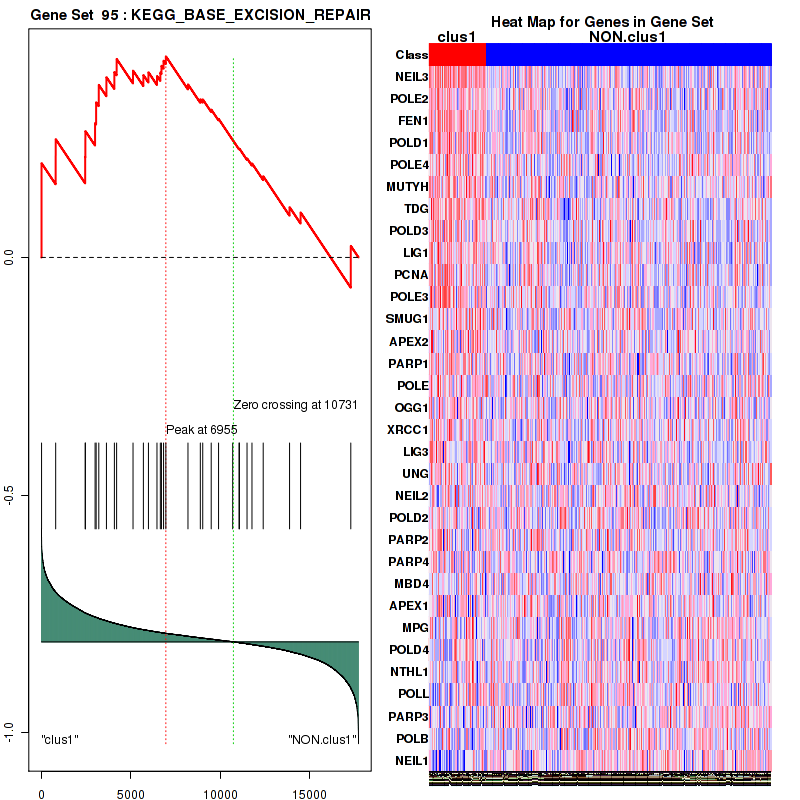
Figure S16. Get High-res Image For the top 5 core enriched genes in the pathway: KEGG BASE EXCISION REPAIR, this volcano plot shows how much they are up/down-regulated and significant. The significance was calculated by empirical bayesian fit

Table S9. Get Full Table This table shows a Running Enrichment Score (RES) of each gene in this pathway, that is, the enrichment score at this point in the ranked list of genes. All genes are ranked by Signal-to-Noise (S2N), a measure of similarity as default and are used to obtain ES matrix of all genes. In this way, GSEA tool uses expression pattern of not only overlapped genes but also not-overlapped genes to produce ES matrix.
| Rank | GENE | SYMBOL | DESC | LIST.LOC | S2N | RES | CORE_ENRICHMENT |
|---|---|---|---|---|---|---|---|
| 1 | ENO2 | ENO2 | ENO2 | 129 | 0.52 | 0.11 | YES |
| 2 | ENO1 | ENO1 | ENO1 | 2345 | 0.21 | 0.036 | YES |
| 3 | CNOT6 | CNOT6 | CNOT6 | 3311 | 0.16 | 0.018 | YES |
| 4 | NAA38 | NAA38 | NAA38 | 3975 | 0.13 | 0.012 | YES |
| 5 | MPHOSPH6 | MPHOSPH6 | MPHOSPH6 | 4124 | 0.13 | 0.033 | YES |
| 6 | RQCD1 | RQCD1 | RQCD1 | 4220 | 0.12 | 0.057 | YES |
| 7 | EXOSC2 | EXOSC2 | EXOSC2 | 4264 | 0.12 | 0.083 | YES |
| 8 | LSM2 | LSM2 | LSM2 | 4491 | 0.12 | 0.097 | YES |
| 9 | EXOSC3 | EXOSC3 | EXOSC3 | 4556 | 0.11 | 0.12 | YES |
| 10 | EXOSC10 | EXOSC10 | EXOSC10 | 4567 | 0.11 | 0.15 | YES |
| 11 | EXOSC9 | EXOSC9 | EXOSC9 | 5012 | 0.1 | 0.14 | YES |
| 12 | EXOSC8 | EXOSC8 | EXOSC8 | 5056 | 0.1 | 0.16 | YES |
| 13 | CNOT3 | CNOT3 | CNOT3 | 5186 | 0.096 | 0.18 | YES |
| 14 | EDC4 | EDC4 | EDC4 | 5290 | 0.094 | 0.2 | YES |
| 15 | DCP2 | DCP2 | DCP2 | 5369 | 0.092 | 0.21 | YES |
| 16 | CNOT10 | CNOT10 | CNOT10 | 5383 | 0.091 | 0.23 | YES |
| 17 | EXOSC4 | EXOSC4 | EXOSC4 | 5459 | 0.09 | 0.25 | YES |
| 18 | EXOSC5 | EXOSC5 | EXOSC5 | 5532 | 0.088 | 0.27 | YES |
| 19 | DCP1A | DCP1A | DCP1A | 5743 | 0.084 | 0.28 | YES |
| 20 | LSM7 | LSM7 | LSM7 | 5882 | 0.08 | 0.29 | YES |
| 21 | LSM5 | LSM5 | LSM5 | 6274 | 0.072 | 0.28 | YES |
| 22 | LSM4 | LSM4 | LSM4 | 6445 | 0.069 | 0.29 | YES |
| 23 | EDC3 | EDC3 | EDC3 | 6563 | 0.067 | 0.3 | YES |
| 24 | ZCCHC7 | ZCCHC7 | ZCCHC7 | 7014 | 0.058 | 0.28 | YES |
| 25 | EXOSC7 | EXOSC7 | EXOSC7 | 7091 | 0.057 | 0.29 | YES |
| 26 | CNOT2 | CNOT2 | CNOT2 | 7245 | 0.054 | 0.3 | YES |
| 27 | PARN | PARN | PARN | 7443 | 0.051 | 0.3 | YES |
| 28 | EXOSC1 | EXOSC1 | EXOSC1 | 7487 | 0.051 | 0.31 | YES |
| 29 | SKIV2L | SKIV2L | SKIV2L | 7532 | 0.05 | 0.32 | YES |
| 30 | EXOSC6 | EXOSC6 | EXOSC6 | 7681 | 0.048 | 0.32 | YES |
| 31 | PNPT1 | PNPT1 | PNPT1 | 7732 | 0.047 | 0.33 | YES |
| 32 | LSM6 | LSM6 | LSM6 | 7983 | 0.042 | 0.32 | YES |
| 33 | HSPD1 | HSPD1 | HSPD1 | 8059 | 0.041 | 0.33 | YES |
| 34 | PAPOLG | PAPOLG | PAPOLG | 8106 | 0.04 | 0.34 | YES |
| 35 | LSM1 | LSM1 | LSM1 | 8335 | 0.037 | 0.33 | YES |
| 36 | CNOT1 | CNOT1 | CNOT1 | 8407 | 0.036 | 0.34 | YES |
| 37 | SKIV2L2 | SKIV2L2 | SKIV2L2 | 8650 | 0.032 | 0.33 | YES |
| 38 | CNOT7 | CNOT7 | CNOT7 | 8739 | 0.03 | 0.33 | YES |
| 39 | LSM3 | LSM3 | LSM3 | 8781 | 0.03 | 0.34 | YES |
| 40 | DCPS | DCPS | DCPS | 8949 | 0.027 | 0.33 | YES |
| 41 | PAPOLA | PAPOLA | PAPOLA | 8976 | 0.027 | 0.34 | YES |
| 42 | XRN2 | XRN2 | XRN2 | 9344 | 0.021 | 0.32 | NO |
| 43 | PATL1 | PATL1 | PATL1 | 10432 | 0.005 | 0.26 | NO |
| 44 | CNOT4 | CNOT4 | CNOT4 | 10698 | 0.00066 | 0.25 | NO |
| 45 | DIS3 | DIS3 | DIS3 | 11265 | -0.0085 | 0.22 | NO |
| 46 | DDX6 | DDX6 | DDX6 | 11338 | -0.0098 | 0.21 | NO |
| 47 | HSPA9 | HSPA9 | HSPA9 | 11706 | -0.017 | 0.2 | NO |
| 48 | XRN1 | XRN1 | XRN1 | 12112 | -0.025 | 0.18 | NO |
| 49 | DCP1B | DCP1B | DCP1B | 12338 | -0.029 | 0.17 | NO |
| 50 | C1D | C1D | C1D | 12406 | -0.03 | 0.18 | NO |
| 51 | WDR61 | WDR61 | WDR61 | 12807 | -0.039 | 0.16 | NO |
| 52 | PAPD7 | PAPD7 | PAPD7 | 13426 | -0.053 | 0.14 | NO |
| 53 | TTC37 | TTC37 | TTC37 | 13831 | -0.064 | 0.13 | NO |
| 54 | CNOT6L | CNOT6L | CNOT6L | 14602 | -0.089 | 0.11 | NO |
| 55 | ENO3 | ENO3 | ENO3 | 17127 | -0.29 | 0.034 | NO |
Figure S17. Get High-res Image This plot shows mRNAseq_cNMF expression data heatmap (on the left) a RunningEnrichmentScore(RES) plot (on the top right) and a Signal2Noise(S2N) plot (on the bottom right) of genes in the pathway: KEGG NUCLEOTIDE EXCISION REPAIR.
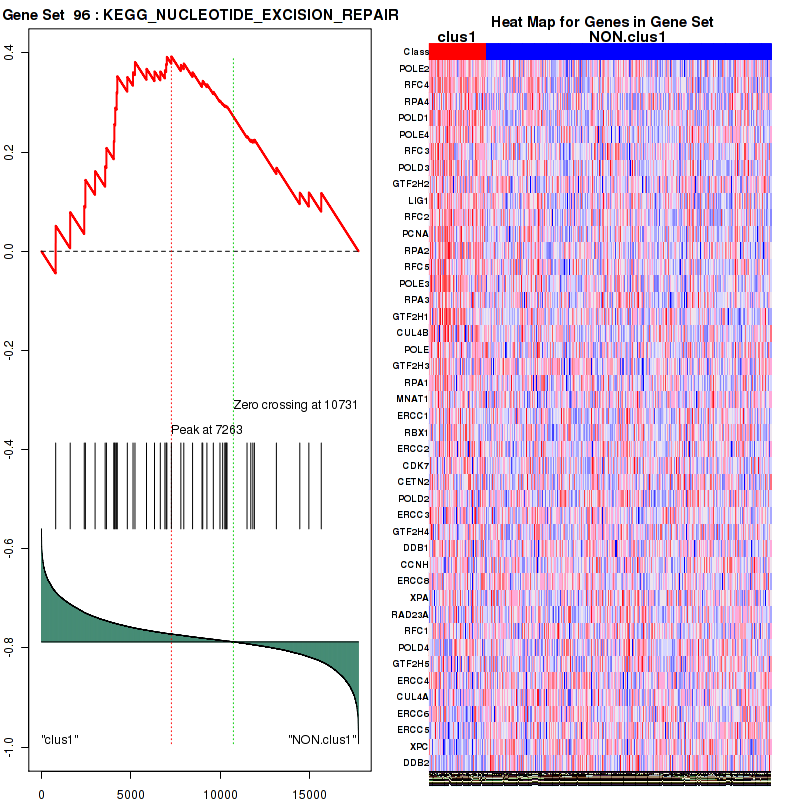
Figure S18. Get High-res Image For the top 5 core enriched genes in the pathway: KEGG NUCLEOTIDE EXCISION REPAIR, this volcano plot shows how much they are up/down-regulated and significant. The significance was calculated by empirical bayesian fit

Table S10. Get Full Table This table shows a Running Enrichment Score (RES) of each gene in this pathway, that is, the enrichment score at this point in the ranked list of genes. All genes are ranked by Signal-to-Noise (S2N), a measure of similarity as default and are used to obtain ES matrix of all genes. In this way, GSEA tool uses expression pattern of not only overlapped genes but also not-overlapped genes to produce ES matrix.
| Rank | GENE | SYMBOL | DESC | LIST.LOC | S2N | RES | CORE_ENRICHMENT |
|---|---|---|---|---|---|---|---|
| 1 | CDC25A | CDC25A | CDC25A | 107 | 0.54 | 0.15 | YES |
| 2 | CDKN2A | CDKN2A | CDKN2A | 417 | 0.42 | 0.25 | YES |
| 3 | CDK1 | CDK1 | CDK1 | 427 | 0.41 | 0.37 | YES |
| 4 | CCNE1 | CCNE1 | CCNE1 | 461 | 0.41 | 0.48 | YES |
| 5 | CDKN2B | CDKN2B | CDKN2B | 2900 | 0.18 | 0.39 | YES |
| 6 | CDK4 | CDK4 | CDK4 | 3642 | 0.14 | 0.39 | YES |
| 7 | SKP2 | SKP2 | SKP2 | 3712 | 0.14 | 0.43 | YES |
| 8 | CCNA1 | CCNA1 | CCNA1 | 3776 | 0.14 | 0.47 | YES |
| 9 | TGFB1 | TGFB1 | TGFB1 | 3846 | 0.14 | 0.5 | YES |
| 10 | HDAC1 | HDAC1 | HDAC1 | 4063 | 0.13 | 0.53 | YES |
| 11 | CDK2 | CDK2 | CDK2 | 4189 | 0.12 | 0.56 | YES |
| 12 | ATR | ATR | ATR | 7043 | 0.058 | 0.41 | NO |
| 13 | TGFB2 | TGFB2 | TGFB2 | 7146 | 0.056 | 0.42 | NO |
| 14 | ATM | ATM | ATM | 8223 | 0.038 | 0.37 | NO |
| 15 | TFDP1 | TFDP1 | TFDP1 | 8296 | 0.037 | 0.38 | NO |
| 16 | ABL1 | ABL1 | ABL1 | 8520 | 0.034 | 0.37 | NO |
| 17 | CDK6 | CDK6 | CDK6 | 9179 | 0.024 | 0.34 | NO |
| 18 | DHFR | DHFR | DHFR | 9211 | 0.023 | 0.35 | NO |
| 19 | GSK3B | GSK3B | GSK3B | 11142 | -0.0065 | 0.24 | NO |
| 20 | SMAD4 | SMAD4 | SMAD4 | 11504 | -0.013 | 0.22 | NO |
| 21 | RB1 | RB1 | RB1 | 12331 | -0.029 | 0.19 | NO |
| 22 | SMAD3 | SMAD3 | SMAD3 | 12611 | -0.034 | 0.18 | NO |
| 23 | CDKN1B | CDKN1B | CDKN1B | 12914 | -0.041 | 0.18 | NO |
| 24 | TGFB3 | TGFB3 | TGFB3 | 13305 | -0.05 | 0.17 | NO |
| 25 | TP53 | TP53 | TP53 | 13942 | -0.068 | 0.15 | NO |
| 26 | CDKN1A | CDKN1A | CDKN1A | 14166 | -0.076 | 0.16 | NO |
| 27 | CCND1 | CCND1 | CCND1 | 15819 | -0.14 | 0.11 | NO |
Figure S19. Get High-res Image This plot shows mRNAseq_cNMF expression data heatmap (on the left) a RunningEnrichmentScore(RES) plot (on the top right) and a Signal2Noise(S2N) plot (on the bottom right) of genes in the pathway: KEGG HOMOLOGOUS RECOMBINATION.
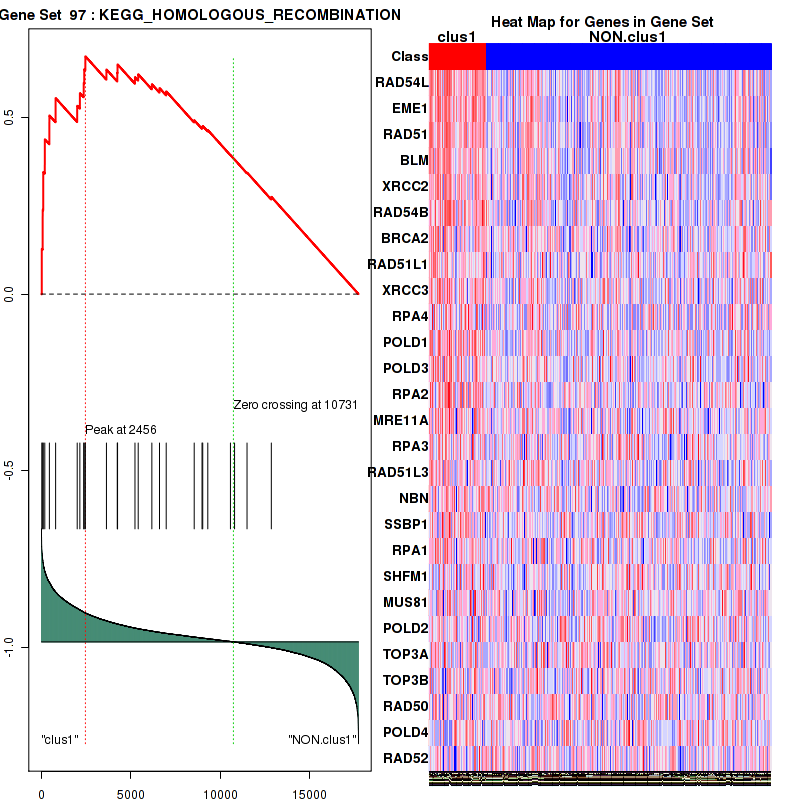
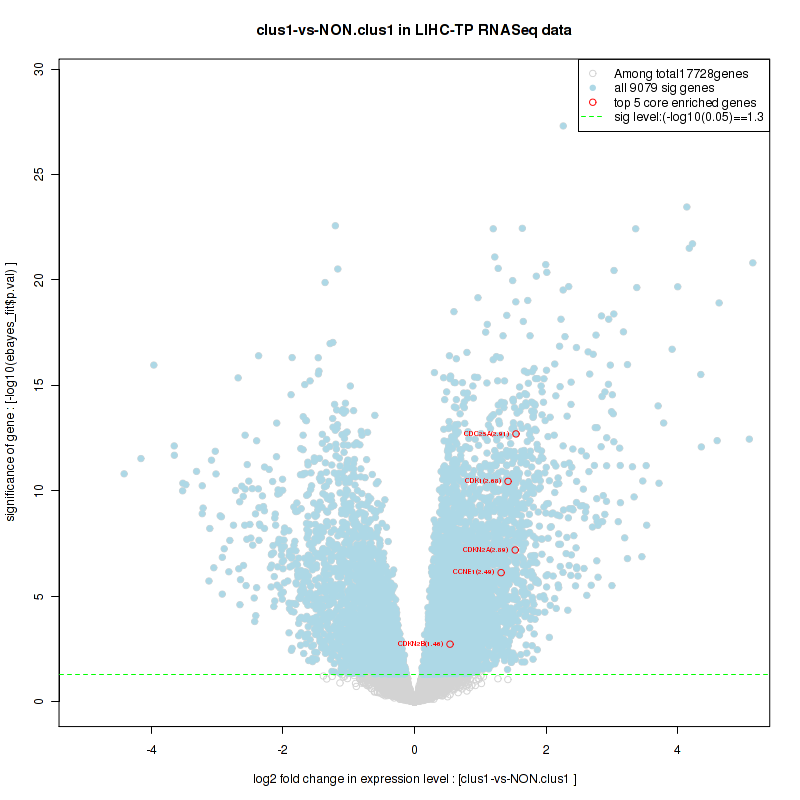
Figure S20. Get High-res Image For the top 5 core enriched genes in the pathway: KEGG HOMOLOGOUS RECOMBINATION, this volcano plot shows how much they are up/down-regulated and significant. The significance was calculated by empirical bayesian fit
For the top enriched genes, if you want to check whether they are
-
up-regulated, please check the list of up-regulated genes
-
down-regulated, please check the list of down-regulated genes
For the top enriched genes, if you want to check whether they are
-
highly expressed genes, please check the list of high (top 30%) expressed genes
-
low expressed genes, please check the list of low (bottom 30%) expressed genes
An expression pattern of top(30%)/middle(30%)/low(30%) in this subtype against other subtypes is available in a heatmap
For the top enriched genes, if you want to check whether they are
-
significantly differently expressed genes by eBayes lm fit, please check the list of significant genes
Table 4. Get Full Table This table shows top 10 pathways which are significantly enriched in cluster clus2. It displays only significant gene sets satisfying nom.p.val.threshold (-1), fwer.p.val.threshold (-1) , fdr.q.val.threshold (0.25) and the default table is sorted by Normalized Enrichment Score (NES). Further details on NES statistics, please visit The Broad GSEA website.
| GeneSet(GS) | Size(#genes) | genes.ES.table | ES | NES | NOM.p.val | FDR.q.val | FWER.p.val | Tag.. | Gene.. | Signal | FDR..median. | glob.p.val |
|---|---|---|---|---|---|---|---|---|---|---|---|---|
| KEGG GLYCOLYSIS GLUCONEOGENESIS | 59 | genes.ES.table | 0.5 | 1.6 | 0.018 | 0.11 | 0.71 | 0.37 | 0.094 | 0.34 | 0.064 | 0.002 |
| KEGG CITRATE CYCLE TCA CYCLE | 29 | genes.ES.table | 0.6 | 1.7 | 0.057 | 0.11 | 0.45 | 0.59 | 0.24 | 0.44 | 0 | 0.008 |
| KEGG PENTOSE AND GLUCURONATE INTERCONVERSIONS | 26 | genes.ES.table | 0.72 | 1.5 | 0.097 | 0.19 | 0.9 | 0.58 | 0.15 | 0.49 | 0.14 | 0.004 |
| KEGG FATTY ACID METABOLISM | 41 | genes.ES.table | 0.68 | 1.6 | 0.055 | 0.12 | 0.69 | 0.71 | 0.18 | 0.58 | 0.064 | 0.002 |
| KEGG STEROID HORMONE BIOSYNTHESIS | 51 | genes.ES.table | 0.71 | 1.6 | 0.033 | 0.12 | 0.73 | 0.55 | 0.11 | 0.49 | 0.069 | 0.002 |
| KEGG ALANINE ASPARTATE AND GLUTAMATE METABOLISM | 30 | genes.ES.table | 0.52 | 1.4 | 0.084 | 0.2 | 0.92 | 0.53 | 0.12 | 0.47 | 0.15 | 0.006 |
| KEGG GLYCINE SERINE AND THREONINE METABOLISM | 30 | genes.ES.table | 0.77 | 1.7 | 0.0041 | 0.093 | 0.51 | 0.8 | 0.18 | 0.66 | 0.038 | 0.002 |
| KEGG CYSTEINE AND METHIONINE METABOLISM | 33 | genes.ES.table | 0.57 | 1.8 | 0.0065 | 0.099 | 0.35 | 0.36 | 0.11 | 0.32 | 0 | 0.012 |
| KEGG VALINE LEUCINE AND ISOLEUCINE DEGRADATION | 43 | genes.ES.table | 0.64 | 1.7 | 0.034 | 0.098 | 0.47 | 0.74 | 0.19 | 0.61 | 0 | 0.004 |
| KEGG LYSINE DEGRADATION | 43 | genes.ES.table | 0.58 | 2 | 0.0062 | 0.051 | 0.043 | 0.3 | 0.11 | 0.27 | 0 | 0.019 |
Table S11. Get Full Table This table shows a Running Enrichment Score (RES) of each gene in this pathway, that is, the enrichment score at this point in the ranked list of genes. All genes are ranked by Signal-to-Noise (S2N), a measure of similarity as default and are used to obtain ES matrix of all genes. In this way, GSEA tool uses expression pattern of not only overlapped genes but also not-overlapped genes to produce ES matrix.
| Rank | GENE | SYMBOL | DESC | LIST.LOC | S2N | RES | CORE_ENRICHMENT |
|---|---|---|---|---|---|---|---|
| 1 | AADAT | AADAT | AADAT | 32 | 0.62 | 0.12 | YES |
| 2 | BBOX1 | BBOX1 | BBOX1 | 39 | 0.59 | 0.23 | YES |
| 3 | AASS | AASS | AASS | 165 | 0.44 | 0.31 | YES |
| 4 | OGDHL | OGDHL | OGDHL | 410 | 0.33 | 0.36 | YES |
| 5 | PIPOX | PIPOX | PIPOX | 530 | 0.3 | 0.41 | YES |
| 6 | GCDH | GCDH | GCDH | 1015 | 0.21 | 0.43 | YES |
| 7 | ALDH7A1 | ALDH7A1 | ALDH7A1 | 1215 | 0.19 | 0.45 | YES |
| 8 | ALDH2 | ALDH2 | ALDH2 | 1372 | 0.18 | 0.48 | YES |
| 9 | ACAT1 | ACAT1 | ACAT1 | 1623 | 0.15 | 0.49 | YES |
| 10 | SETD7 | SETD7 | SETD7 | 1740 | 0.14 | 0.52 | YES |
| 11 | ACAT2 | ACAT2 | ACAT2 | 1797 | 0.14 | 0.54 | YES |
| 12 | ALDH9A1 | ALDH9A1 | ALDH9A1 | 1944 | 0.13 | 0.56 | YES |
| 13 | HADH | HADH | HADH | 2029 | 0.13 | 0.58 | YES |
| 14 | ALDH1B1 | ALDH1B1 | ALDH1B1 | 3156 | 0.08 | 0.53 | NO |
| 15 | ECHS1 | ECHS1 | ECHS1 | 3249 | 0.077 | 0.54 | NO |
| 16 | OGDH | OGDH | OGDH | 3448 | 0.07 | 0.54 | NO |
| 17 | TMLHE | TMLHE | TMLHE | 3741 | 0.062 | 0.54 | NO |
| 18 | PLOD1 | PLOD1 | PLOD1 | 4294 | 0.048 | 0.52 | NO |
| 19 | HADHA | HADHA | HADHA | 4376 | 0.046 | 0.52 | NO |
| 20 | DLST | DLST | DLST | 4728 | 0.039 | 0.51 | NO |
| 21 | SETD2 | SETD2 | SETD2 | 4919 | 0.034 | 0.5 | NO |
| 22 | AASDH | AASDH | AASDH | 5559 | 0.023 | 0.47 | NO |
| 23 | SUV39H1 | SUV39H1 | SUV39H1 | 5727 | 0.02 | 0.47 | NO |
| 24 | SUV420H1 | SUV420H1 | SUV420H1 | 6009 | 0.015 | 0.45 | NO |
| 25 | AASDHPPT | AASDHPPT | AASDHPPT | 6845 | 0.0028 | 0.41 | NO |
| 26 | ALDH3A2 | ALDH3A2 | ALDH3A2 | 8173 | -0.016 | 0.34 | NO |
| 27 | PLOD3 | PLOD3 | PLOD3 | 8245 | -0.017 | 0.33 | NO |
| 28 | EHMT1 | EHMT1 | EHMT1 | 8495 | -0.02 | 0.32 | NO |
| 29 | SETD1A | SETD1A | SETD1A | 8557 | -0.022 | 0.32 | NO |
| 30 | DOT1L | DOT1L | DOT1L | 8752 | -0.025 | 0.32 | NO |
| 31 | WHSC1L1 | WHSC1L1 | WHSC1L1 | 9117 | -0.03 | 0.3 | NO |
| 32 | ASH1L | ASH1L | ASH1L | 9815 | -0.04 | 0.27 | NO |
| 33 | NSD1 | NSD1 | NSD1 | 9898 | -0.041 | 0.28 | NO |
| 34 | PLOD2 | PLOD2 | PLOD2 | 10451 | -0.049 | 0.25 | NO |
| 35 | SETMAR | SETMAR | SETMAR | 10797 | -0.055 | 0.25 | NO |
| 36 | SETD1B | SETD1B | SETD1B | 10937 | -0.058 | 0.25 | NO |
| 37 | SETDB2 | SETDB2 | SETDB2 | 11888 | -0.075 | 0.21 | NO |
| 38 | WHSC1 | WHSC1 | WHSC1 | 12125 | -0.08 | 0.21 | NO |
| 39 | SETD8 | SETD8 | SETD8 | 12301 | -0.084 | 0.22 | NO |
| 40 | SUV420H2 | SUV420H2 | SUV420H2 | 12367 | -0.085 | 0.23 | NO |
| 41 | SUV39H2 | SUV39H2 | SUV39H2 | 13582 | -0.12 | 0.18 | NO |
| 42 | SETDB1 | SETDB1 | SETDB1 | 13661 | -0.12 | 0.2 | NO |
| 43 | EHMT2 | EHMT2 | EHMT2 | 14254 | -0.14 | 0.2 | NO |
Figure S21. Get High-res Image This plot shows mRNAseq_cNMF expression data heatmap (on the left) a RunningEnrichmentScore(RES) plot (on the top right) and a Signal2Noise(S2N) plot (on the bottom right) of genes in the pathway: KEGG GLYCOLYSIS GLUCONEOGENESIS.
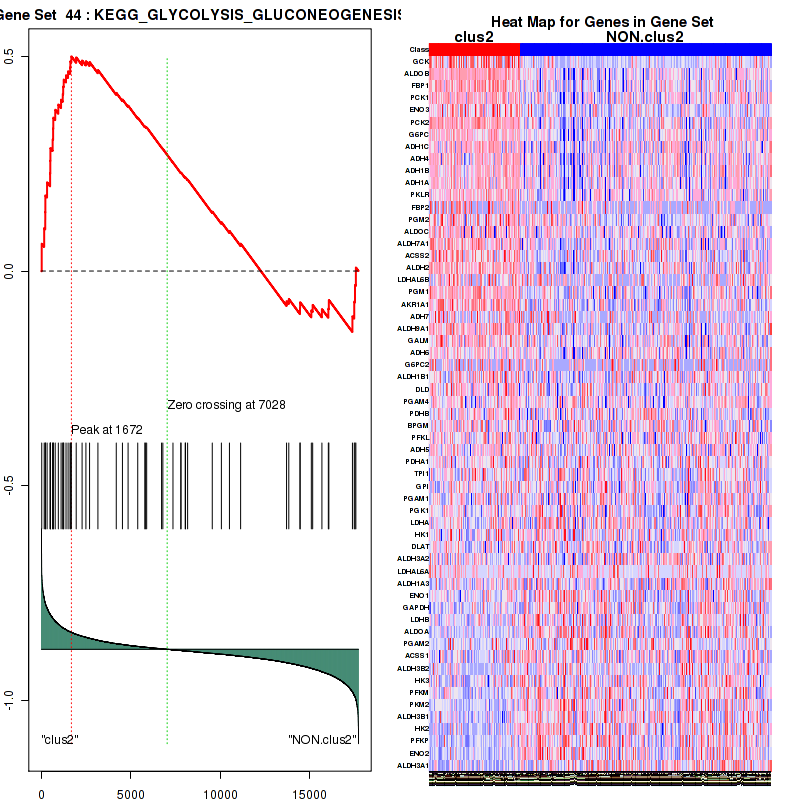
Figure S22. Get High-res Image For the top 5 core enriched genes in the pathway: KEGG GLYCOLYSIS GLUCONEOGENESIS, this volcano plot shows how much they are up/down-regulated and significant. The significance was calculated by empirical bayesian fit
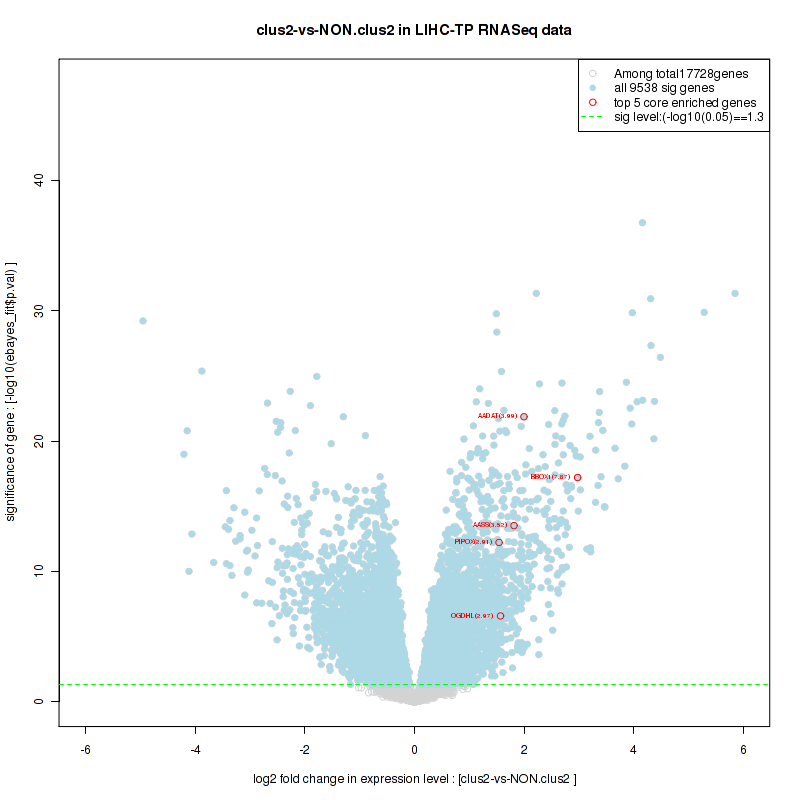
Table S12. Get Full Table This table shows a Running Enrichment Score (RES) of each gene in this pathway, that is, the enrichment score at this point in the ranked list of genes. All genes are ranked by Signal-to-Noise (S2N), a measure of similarity as default and are used to obtain ES matrix of all genes. In this way, GSEA tool uses expression pattern of not only overlapped genes but also not-overlapped genes to produce ES matrix.
| Rank | GENE | SYMBOL | DESC | LIST.LOC | S2N | RES | CORE_ENRICHMENT |
|---|---|---|---|---|---|---|---|
| 1 | ACACB | ACACB | ACACB | 391 | 0.34 | 0.054 | YES |
| 2 | ALDH6A1 | ALDH6A1 | ALDH6A1 | 433 | 0.32 | 0.12 | YES |
| 3 | ABAT | ABAT | ABAT | 444 | 0.32 | 0.2 | YES |
| 4 | EHHADH | EHHADH | EHHADH | 518 | 0.3 | 0.26 | YES |
| 5 | MUT | MUT | MUT | 965 | 0.22 | 0.28 | YES |
| 6 | ACADM | ACADM | ACADM | 1075 | 0.2 | 0.32 | YES |
| 7 | ALDH7A1 | ALDH7A1 | ALDH7A1 | 1215 | 0.19 | 0.36 | YES |
| 8 | ACSS2 | ACSS2 | ACSS2 | 1245 | 0.19 | 0.4 | YES |
| 9 | ALDH2 | ALDH2 | ALDH2 | 1372 | 0.18 | 0.43 | YES |
| 10 | LDHAL6B | LDHAL6B | LDHAL6B | 1489 | 0.16 | 0.46 | YES |
| 11 | MLYCD | MLYCD | MLYCD | 1545 | 0.16 | 0.49 | YES |
| 12 | ACAT1 | ACAT1 | ACAT1 | 1623 | 0.15 | 0.52 | YES |
| 13 | ACAT2 | ACAT2 | ACAT2 | 1797 | 0.14 | 0.55 | YES |
| 14 | MCEE | MCEE | MCEE | 1812 | 0.14 | 0.58 | YES |
| 15 | SUCLG2 | SUCLG2 | SUCLG2 | 1865 | 0.14 | 0.6 | YES |
| 16 | PCCA | PCCA | PCCA | 1939 | 0.13 | 0.63 | YES |
| 17 | ALDH9A1 | ALDH9A1 | ALDH9A1 | 1944 | 0.13 | 0.66 | YES |
| 18 | PCCB | PCCB | PCCB | 2299 | 0.12 | 0.67 | YES |
| 19 | HIBCH | HIBCH | HIBCH | 2444 | 0.11 | 0.68 | YES |
| 20 | SUCLG1 | SUCLG1 | SUCLG1 | 2518 | 0.1 | 0.7 | YES |
| 21 | ACSS3 | ACSS3 | ACSS3 | 2884 | 0.09 | 0.7 | YES |
| 22 | ALDH1B1 | ALDH1B1 | ALDH1B1 | 3156 | 0.08 | 0.7 | YES |
| 23 | ECHS1 | ECHS1 | ECHS1 | 3249 | 0.077 | 0.72 | YES |
| 24 | HADHA | HADHA | HADHA | 4376 | 0.046 | 0.66 | NO |
| 25 | LDHA | LDHA | LDHA | 7802 | -0.011 | 0.47 | NO |
| 26 | ALDH3A2 | ALDH3A2 | ALDH3A2 | 8173 | -0.016 | 0.45 | NO |
| 27 | SUCLA2 | SUCLA2 | SUCLA2 | 8485 | -0.02 | 0.44 | NO |
| 28 | LDHAL6A | LDHAL6A | LDHAL6A | 9550 | -0.036 | 0.39 | NO |
| 29 | ACACA | ACACA | ACACA | 11225 | -0.063 | 0.31 | NO |
| 30 | LDHB | LDHB | LDHB | 13706 | -0.12 | 0.2 | NO |
| 31 | ACSS1 | ACSS1 | ACSS1 | 14462 | -0.14 | 0.18 | NO |
Figure S23. Get High-res Image This plot shows mRNAseq_cNMF expression data heatmap (on the left) a RunningEnrichmentScore(RES) plot (on the top right) and a Signal2Noise(S2N) plot (on the bottom right) of genes in the pathway: KEGG CITRATE CYCLE TCA CYCLE.
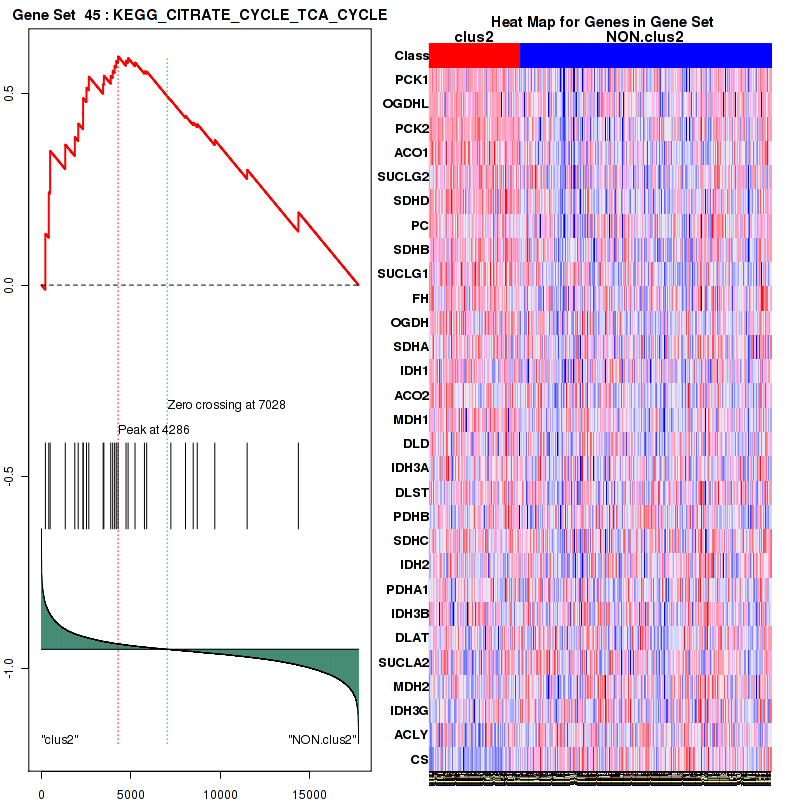
Figure S24. Get High-res Image For the top 5 core enriched genes in the pathway: KEGG CITRATE CYCLE TCA CYCLE, this volcano plot shows how much they are up/down-regulated and significant. The significance was calculated by empirical bayesian fit
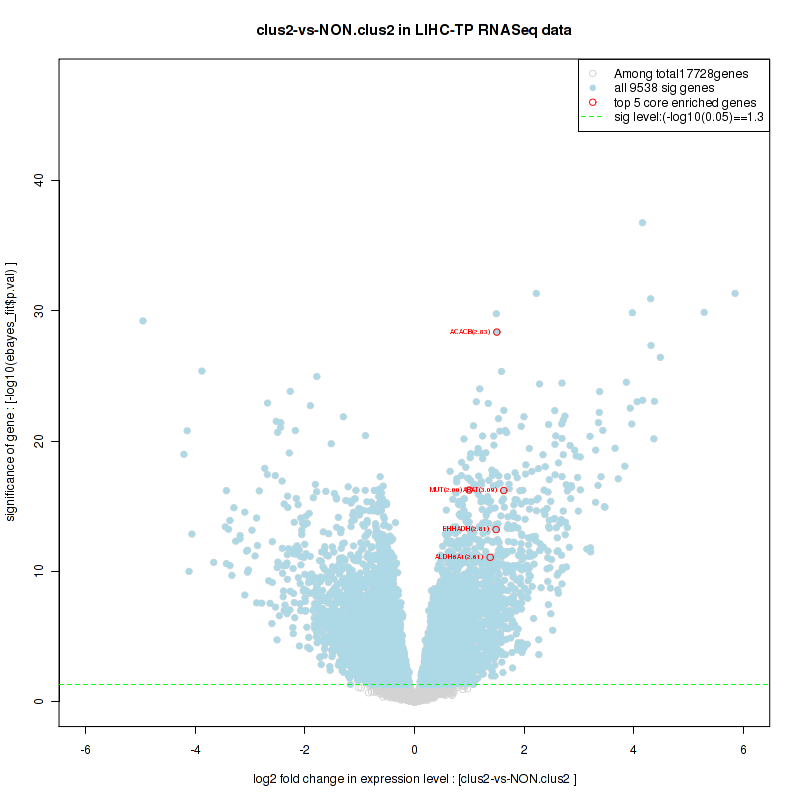
Table S13. Get Full Table This table shows a Running Enrichment Score (RES) of each gene in this pathway, that is, the enrichment score at this point in the ranked list of genes. All genes are ranked by Signal-to-Noise (S2N), a measure of similarity as default and are used to obtain ES matrix of all genes. In this way, GSEA tool uses expression pattern of not only overlapped genes but also not-overlapped genes to produce ES matrix.
| Rank | GENE | SYMBOL | DESC | LIST.LOC | S2N | RES | CORE_ENRICHMENT |
|---|---|---|---|---|---|---|---|
| 1 | ACOT12 | ACOT12 | ACOT12 | 131 | 0.47 | 0.08 | YES |
| 2 | PCK1 | PCK1 | PCK1 | 219 | 0.41 | 0.15 | YES |
| 3 | ACACB | ACACB | ACACB | 391 | 0.34 | 0.2 | YES |
| 4 | PCK2 | PCK2 | PCK2 | 484 | 0.31 | 0.26 | YES |
| 5 | LDHD | LDHD | LDHD | 752 | 0.25 | 0.29 | YES |
| 6 | PKLR | PKLR | PKLR | 770 | 0.25 | 0.34 | YES |
| 7 | HAGH | HAGH | HAGH | 939 | 0.22 | 0.37 | YES |
| 8 | ALDH7A1 | ALDH7A1 | ALDH7A1 | 1215 | 0.19 | 0.39 | YES |
| 9 | ACSS2 | ACSS2 | ACSS2 | 1245 | 0.19 | 0.42 | YES |
| 10 | ACYP2 | ACYP2 | ACYP2 | 1302 | 0.18 | 0.45 | YES |
| 11 | ALDH2 | ALDH2 | ALDH2 | 1372 | 0.18 | 0.48 | YES |
| 12 | LDHAL6B | LDHAL6B | LDHAL6B | 1489 | 0.16 | 0.51 | YES |
| 13 | GRHPR | GRHPR | GRHPR | 1597 | 0.16 | 0.53 | YES |
| 14 | ACAT1 | ACAT1 | ACAT1 | 1623 | 0.15 | 0.56 | YES |
| 15 | ACAT2 | ACAT2 | ACAT2 | 1797 | 0.14 | 0.57 | YES |
| 16 | ALDH9A1 | ALDH9A1 | ALDH9A1 | 1944 | 0.13 | 0.59 | YES |
| 17 | PC | PC | PC | 2328 | 0.11 | 0.59 | NO |
| 18 | ALDH1B1 | ALDH1B1 | ALDH1B1 | 3156 | 0.08 | 0.56 | NO |
| 19 | MDH1 | MDH1 | MDH1 | 4089 | 0.052 | 0.52 | NO |
| 20 | DLD | DLD | DLD | 4182 | 0.05 | 0.52 | NO |
| 21 | PDHB | PDHB | PDHB | 4843 | 0.036 | 0.49 | NO |
| 22 | ME1 | ME1 | ME1 | 5265 | 0.028 | 0.47 | NO |
| 23 | ME3 | ME3 | ME3 | 5324 | 0.027 | 0.47 | NO |
| 24 | GLO1 | GLO1 | GLO1 | 5726 | 0.02 | 0.45 | NO |
| 25 | PDHA1 | PDHA1 | PDHA1 | 5883 | 0.017 | 0.45 | NO |
| 26 | LDHA | LDHA | LDHA | 7802 | -0.011 | 0.34 | NO |
| 27 | DLAT | DLAT | DLAT | 8055 | -0.015 | 0.33 | NO |
| 28 | ALDH3A2 | ALDH3A2 | ALDH3A2 | 8173 | -0.016 | 0.33 | NO |
| 29 | MDH2 | MDH2 | MDH2 | 8710 | -0.024 | 0.3 | NO |
| 30 | ME2 | ME2 | ME2 | 9546 | -0.036 | 0.26 | NO |
| 31 | LDHAL6A | LDHAL6A | LDHAL6A | 9550 | -0.036 | 0.27 | NO |
| 32 | ACACA | ACACA | ACACA | 11225 | -0.063 | 0.18 | NO |
| 33 | ACYP1 | ACYP1 | ACYP1 | 12162 | -0.081 | 0.15 | NO |
| 34 | AKR1B1 | AKR1B1 | AKR1B1 | 12989 | -0.099 | 0.12 | NO |
| 35 | LDHB | LDHB | LDHB | 13706 | -0.12 | 0.1 | NO |
| 36 | ACSS1 | ACSS1 | ACSS1 | 14462 | -0.14 | 0.084 | NO |
| 37 | PKM2 | PKM2 | PKM2 | 16041 | -0.22 | 0.036 | NO |
| 38 | HAGHL | HAGHL | HAGHL | 17036 | -0.31 | 0.039 | NO |
Figure S25. Get High-res Image This plot shows mRNAseq_cNMF expression data heatmap (on the left) a RunningEnrichmentScore(RES) plot (on the top right) and a Signal2Noise(S2N) plot (on the bottom right) of genes in the pathway: KEGG PENTOSE AND GLUCURONATE INTERCONVERSIONS.
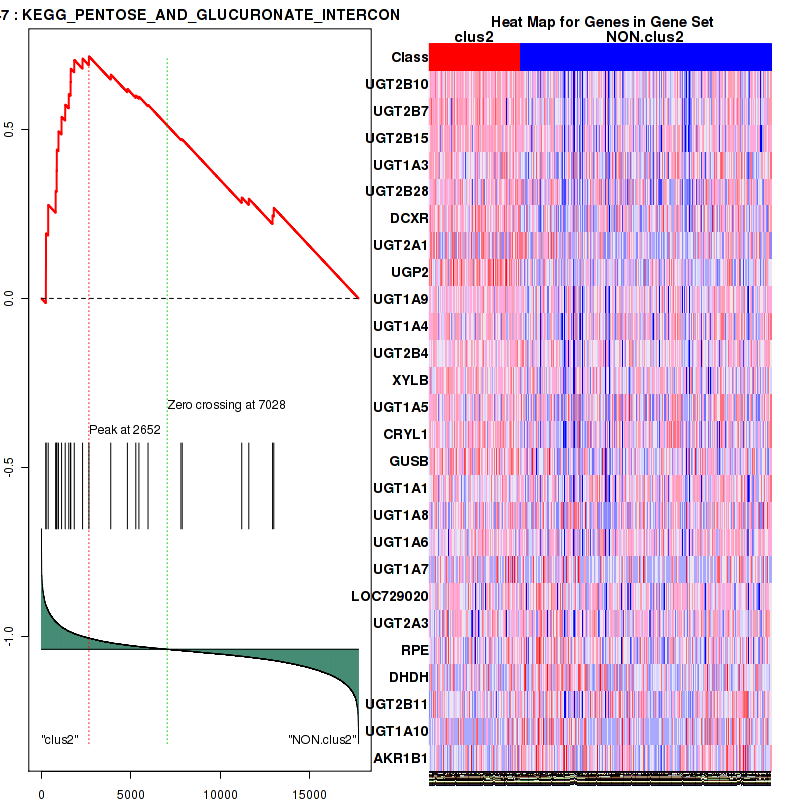
Figure S26. Get High-res Image For the top 5 core enriched genes in the pathway: KEGG PENTOSE AND GLUCURONATE INTERCONVERSIONS, this volcano plot shows how much they are up/down-regulated and significant. The significance was calculated by empirical bayesian fit

Table S14. Get Full Table This table shows a Running Enrichment Score (RES) of each gene in this pathway, that is, the enrichment score at this point in the ranked list of genes. All genes are ranked by Signal-to-Noise (S2N), a measure of similarity as default and are used to obtain ES matrix of all genes. In this way, GSEA tool uses expression pattern of not only overlapped genes but also not-overlapped genes to produce ES matrix.
| Rank | GENE | SYMBOL | DESC | LIST.LOC | S2N | RES | CORE_ENRICHMENT |
|---|---|---|---|---|---|---|---|
| 1 | HAO2 | HAO2 | HAO2 | 7 | 0.79 | 0.07 | YES |
| 2 | XDH | XDH | XDH | 38 | 0.6 | 0.12 | YES |
| 3 | DAO | DAO | DAO | 94 | 0.51 | 0.16 | YES |
| 4 | SLC27A2 | SLC27A2 | SLC27A2 | 269 | 0.38 | 0.19 | YES |
| 5 | AGXT | AGXT | AGXT | 276 | 0.38 | 0.22 | YES |
| 6 | PEX11G | PEX11G | PEX11G | 406 | 0.33 | 0.24 | YES |
| 7 | HAO1 | HAO1 | HAO1 | 473 | 0.31 | 0.27 | YES |
| 8 | EHHADH | EHHADH | EHHADH | 518 | 0.3 | 0.29 | YES |
| 9 | PIPOX | PIPOX | PIPOX | 530 | 0.3 | 0.32 | YES |
| 10 | EPHX2 | EPHX2 | EPHX2 | 552 | 0.29 | 0.34 | YES |
| 11 | ACSL1 | ACSL1 | ACSL1 | 582 | 0.29 | 0.37 | YES |
| 12 | PXMP2 | PXMP2 | PXMP2 | 605 | 0.28 | 0.39 | YES |
| 13 | SCP2 | SCP2 | SCP2 | 760 | 0.25 | 0.4 | YES |
| 14 | BAAT | BAAT | BAAT | 824 | 0.24 | 0.42 | YES |
| 15 | NUDT12 | NUDT12 | NUDT12 | 899 | 0.23 | 0.44 | YES |
| 16 | NOS2 | NOS2 | NOS2 | 923 | 0.23 | 0.46 | YES |
| 17 | CAT | CAT | CAT | 991 | 0.22 | 0.47 | YES |
| 18 | DHRS4 | DHRS4 | DHRS4 | 1275 | 0.18 | 0.47 | YES |
| 19 | PHYH | PHYH | PHYH | 1364 | 0.18 | 0.48 | YES |
| 20 | ACOX1 | ACOX1 | ACOX1 | 1382 | 0.17 | 0.5 | YES |
| 21 | MLYCD | MLYCD | MLYCD | 1545 | 0.16 | 0.5 | YES |
| 22 | HACL1 | HACL1 | HACL1 | 1602 | 0.16 | 0.52 | YES |
| 23 | MPV17L | MPV17L | MPV17L | 1676 | 0.15 | 0.52 | YES |
| 24 | PECR | PECR | PECR | 1816 | 0.14 | 0.53 | YES |
| 25 | HMGCL | HMGCL | HMGCL | 1952 | 0.13 | 0.53 | YES |
| 26 | PECI | PECI | PECI | 2114 | 0.12 | 0.54 | YES |
| 27 | DDO | DDO | DDO | 2115 | 0.12 | 0.55 | YES |
| 28 | ACAA1 | ACAA1 | ACAA1 | 2133 | 0.12 | 0.56 | YES |
| 29 | GSTK1 | GSTK1 | GSTK1 | 2156 | 0.12 | 0.56 | YES |
| 30 | PEX1 | PEX1 | PEX1 | 2174 | 0.12 | 0.57 | YES |
| 31 | PEX14 | PEX14 | PEX14 | 2289 | 0.12 | 0.58 | YES |
| 32 | PEX7 | PEX7 | PEX7 | 2387 | 0.11 | 0.58 | YES |
| 33 | PAOX | PAOX | PAOX | 2392 | 0.11 | 0.59 | YES |
| 34 | PXMP4 | PXMP4 | PXMP4 | 2551 | 0.1 | 0.59 | YES |
| 35 | CRAT | CRAT | CRAT | 2874 | 0.09 | 0.58 | YES |
| 36 | SOD1 | SOD1 | SOD1 | 2920 | 0.089 | 0.59 | YES |
| 37 | PEX3 | PEX3 | PEX3 | 2960 | 0.088 | 0.59 | YES |
| 38 | ACOX3 | ACOX3 | ACOX3 | 2985 | 0.087 | 0.6 | YES |
| 39 | SLC25A17 | SLC25A17 | SLC25A17 | 3041 | 0.085 | 0.6 | YES |
| 40 | HSD17B4 | HSD17B4 | HSD17B4 | 3057 | 0.084 | 0.61 | YES |
| 41 | PEX12 | PEX12 | PEX12 | 3070 | 0.083 | 0.62 | YES |
| 42 | PEX16 | PEX16 | PEX16 | 3115 | 0.082 | 0.62 | YES |
| 43 | CROT | CROT | CROT | 3138 | 0.081 | 0.63 | YES |
| 44 | PEX19 | PEX19 | PEX19 | 3141 | 0.08 | 0.64 | YES |
| 45 | ACOT8 | ACOT8 | ACOT8 | 3717 | 0.063 | 0.61 | NO |
| 46 | IDH1 | IDH1 | IDH1 | 3873 | 0.058 | 0.6 | NO |
| 47 | ECH1 | ECH1 | ECH1 | 3896 | 0.057 | 0.61 | NO |
| 48 | ABCD4 | ABCD4 | ABCD4 | 3977 | 0.055 | 0.61 | NO |
| 49 | DECR2 | DECR2 | DECR2 | 4002 | 0.054 | 0.61 | NO |
| 50 | PEX6 | PEX6 | PEX6 | 4119 | 0.052 | 0.61 | NO |
| 51 | PEX13 | PEX13 | PEX13 | 4237 | 0.049 | 0.61 | NO |
| 52 | ABCD3 | ABCD3 | ABCD3 | 4587 | 0.042 | 0.59 | NO |
| 53 | PRDX5 | PRDX5 | PRDX5 | 5113 | 0.031 | 0.56 | NO |
| 54 | PEX10 | PEX10 | PEX10 | 5182 | 0.03 | 0.56 | NO |
| 55 | SOD2 | SOD2 | SOD2 | 5402 | 0.025 | 0.55 | NO |
| 56 | ACSL5 | ACSL5 | ACSL5 | 5664 | 0.021 | 0.54 | NO |
| 57 | PEX26 | PEX26 | PEX26 | 5688 | 0.021 | 0.54 | NO |
| 58 | IDH2 | IDH2 | IDH2 | 5757 | 0.02 | 0.54 | NO |
| 59 | PMVK | PMVK | PMVK | 5874 | 0.018 | 0.53 | NO |
| 60 | PRDX1 | PRDX1 | PRDX1 | 5970 | 0.016 | 0.53 | NO |
| 61 | AMACR | AMACR | AMACR | 6044 | 0.015 | 0.53 | NO |
| 62 | MVK | MVK | MVK | 6944 | 0.0013 | 0.48 | NO |
| 63 | PEX5 | PEX5 | PEX5 | 7353 | -0.0045 | 0.45 | NO |
| 64 | PEX11A | PEX11A | PEX11A | 7469 | -0.0064 | 0.45 | NO |
| 65 | NUDT19 | NUDT19 | NUDT19 | 7927 | -0.013 | 0.42 | NO |
| 66 | PEX11B | PEX11B | PEX11B | 8755 | -0.025 | 0.38 | NO |
| 67 | PEX2 | PEX2 | PEX2 | 10033 | -0.043 | 0.31 | NO |
| 68 | AGPS | AGPS | AGPS | 11463 | -0.067 | 0.24 | NO |
| 69 | FAR1 | FAR1 | FAR1 | 14034 | -0.13 | 0.1 | NO |
| 70 | ABCD1 | ABCD1 | ABCD1 | 14063 | -0.13 | 0.11 | NO |
| 71 | ACSL6 | ACSL6 | ACSL6 | 14264 | -0.14 | 0.11 | NO |
| 72 | GNPAT | GNPAT | GNPAT | 14323 | -0.14 | 0.12 | NO |
| 73 | ACSL3 | ACSL3 | ACSL3 | 14440 | -0.14 | 0.13 | NO |
| 74 | MPV17 | MPV17 | MPV17 | 14758 | -0.16 | 0.12 | NO |
| 75 | ABCD2 | ABCD2 | ABCD2 | 14781 | -0.16 | 0.14 | NO |
| 76 | FAR2 | FAR2 | FAR2 | 15110 | -0.17 | 0.13 | NO |
| 77 | ACSL4 | ACSL4 | ACSL4 | 15355 | -0.18 | 0.13 | NO |
Figure S27. Get High-res Image This plot shows mRNAseq_cNMF expression data heatmap (on the left) a RunningEnrichmentScore(RES) plot (on the top right) and a Signal2Noise(S2N) plot (on the bottom right) of genes in the pathway: KEGG FATTY ACID METABOLISM.
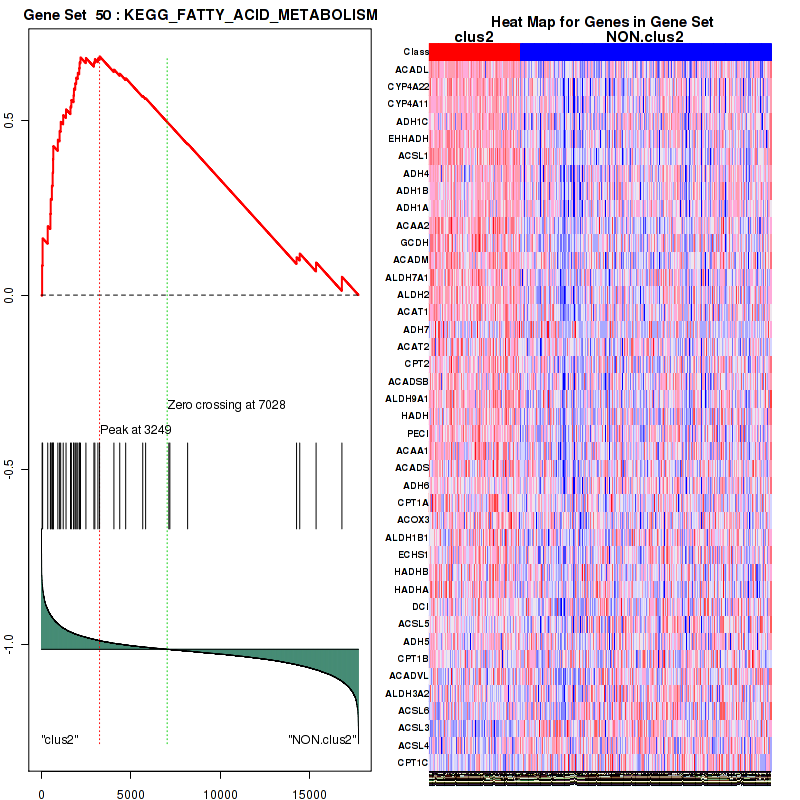
Figure S28. Get High-res Image For the top 5 core enriched genes in the pathway: KEGG FATTY ACID METABOLISM, this volcano plot shows how much they are up/down-regulated and significant. The significance was calculated by empirical bayesian fit
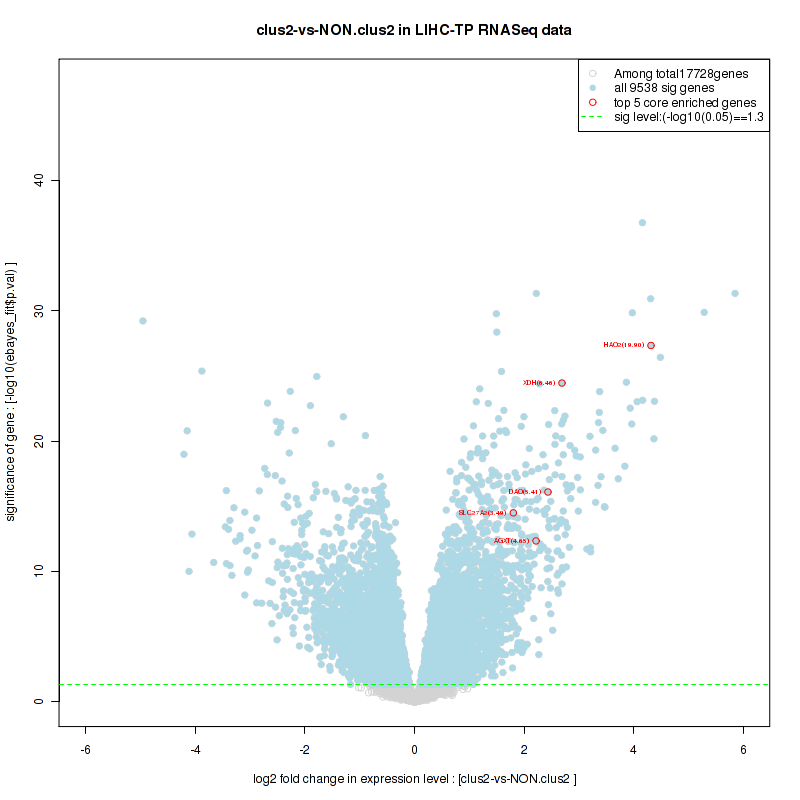
Table S15. Get Full Table This table shows a Running Enrichment Score (RES) of each gene in this pathway, that is, the enrichment score at this point in the ranked list of genes. All genes are ranked by Signal-to-Noise (S2N), a measure of similarity as default and are used to obtain ES matrix of all genes. In this way, GSEA tool uses expression pattern of not only overlapped genes but also not-overlapped genes to produce ES matrix.
| Rank | GENE | SYMBOL | DESC | LIST.LOC | S2N | RES | CORE_ENRICHMENT |
|---|---|---|---|---|---|---|---|
| 1 | TAT | TAT | TAT | 29 | 0.62 | 0.1 | YES |
| 2 | SDS | SDS | SDS | 34 | 0.62 | 0.21 | YES |
| 3 | DNMT3L | DNMT3L | DNMT3L | 54 | 0.57 | 0.31 | YES |
| 4 | BHMT | BHMT | BHMT | 110 | 0.49 | 0.39 | YES |
| 5 | CTH | CTH | CTH | 344 | 0.36 | 0.44 | YES |
| 6 | CBS | CBS | CBS | 568 | 0.29 | 0.47 | YES |
| 7 | CDO1 | CDO1 | CDO1 | 615 | 0.28 | 0.52 | YES |
| 8 | MAT1A | MAT1A | MAT1A | 1070 | 0.21 | 0.53 | YES |
| 9 | LDHAL6B | LDHAL6B | LDHAL6B | 1489 | 0.16 | 0.53 | YES |
| 10 | ADI1 | ADI1 | ADI1 | 1805 | 0.14 | 0.54 | YES |
| 11 | GOT2 | GOT2 | GOT2 | 2004 | 0.13 | 0.55 | YES |
| 12 | GOT1 | GOT1 | GOT1 | 2007 | 0.13 | 0.57 | YES |
| 13 | AHCYL2 | AHCYL2 | AHCYL2 | 2853 | 0.091 | 0.54 | NO |
| 14 | MAT2B | MAT2B | MAT2B | 3838 | 0.059 | 0.49 | NO |
| 15 | MPST | MPST | MPST | 4519 | 0.043 | 0.46 | NO |
| 16 | AHCY | AHCY | AHCY | 4856 | 0.036 | 0.45 | NO |
| 17 | MAT2A | MAT2A | MAT2A | 5097 | 0.031 | 0.44 | NO |
| 18 | MTAP | MTAP | MTAP | 5943 | 0.016 | 0.4 | NO |
| 19 | AHCYL1 | AHCYL1 | AHCYL1 | 6179 | 0.013 | 0.39 | NO |
| 20 | LDHA | LDHA | LDHA | 7802 | -0.011 | 0.3 | NO |
| 21 | LDHAL6A | LDHAL6A | LDHAL6A | 9550 | -0.036 | 0.2 | NO |
| 22 | DNMT1 | DNMT1 | DNMT1 | 9612 | -0.037 | 0.21 | NO |
| 23 | APIP | APIP | APIP | 10459 | -0.049 | 0.17 | NO |
| 24 | ENOPH1 | ENOPH1 | ENOPH1 | 10628 | -0.052 | 0.17 | NO |
| 25 | TRDMT1 | TRDMT1 | TRDMT1 | 11598 | -0.07 | 0.12 | NO |
| 26 | AMD1 | AMD1 | AMD1 | 11675 | -0.071 | 0.13 | NO |
| 27 | SRM | SRM | SRM | 11779 | -0.073 | 0.14 | NO |
| 28 | SMS | SMS | SMS | 12158 | -0.081 | 0.13 | NO |
| 29 | LDHB | LDHB | LDHB | 13706 | -0.12 | 0.064 | NO |
| 30 | MTR | MTR | MTR | 14136 | -0.13 | 0.063 | NO |
| 31 | DNMT3B | DNMT3B | DNMT3B | 15367 | -0.18 | 0.024 | NO |
| 32 | DNMT3A | DNMT3A | DNMT3A | 16547 | -0.26 | 0.0022 | NO |
| 33 | IL4I1 | IL4I1 | IL4I1 | 17380 | -0.38 | 0.02 | NO |
Figure S29. Get High-res Image This plot shows mRNAseq_cNMF expression data heatmap (on the left) a RunningEnrichmentScore(RES) plot (on the top right) and a Signal2Noise(S2N) plot (on the bottom right) of genes in the pathway: KEGG STEROID HORMONE BIOSYNTHESIS.
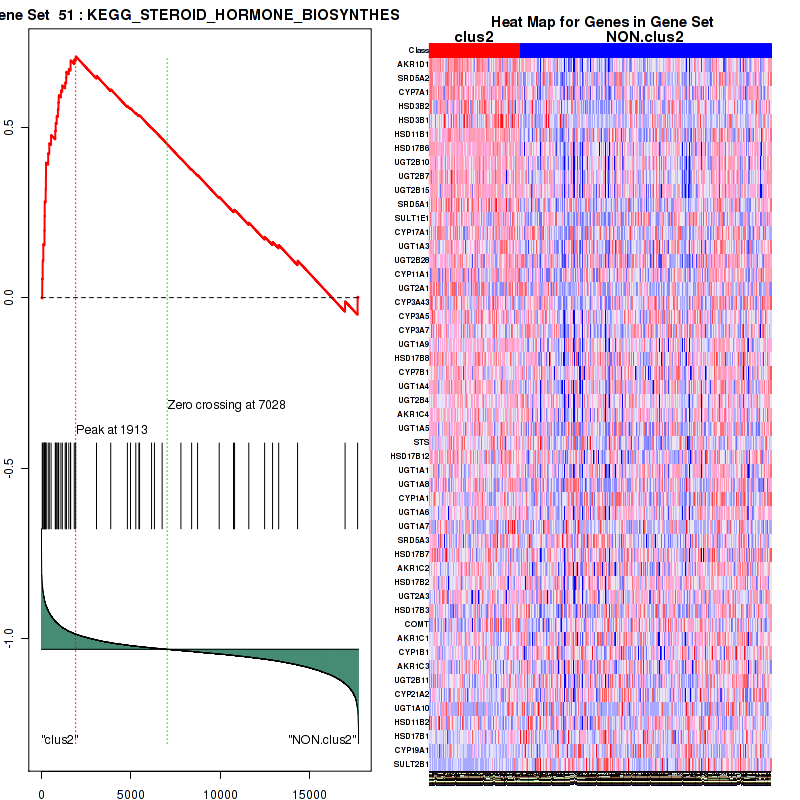
Figure S30. Get High-res Image For the top 5 core enriched genes in the pathway: KEGG STEROID HORMONE BIOSYNTHESIS, this volcano plot shows how much they are up/down-regulated and significant. The significance was calculated by empirical bayesian fit
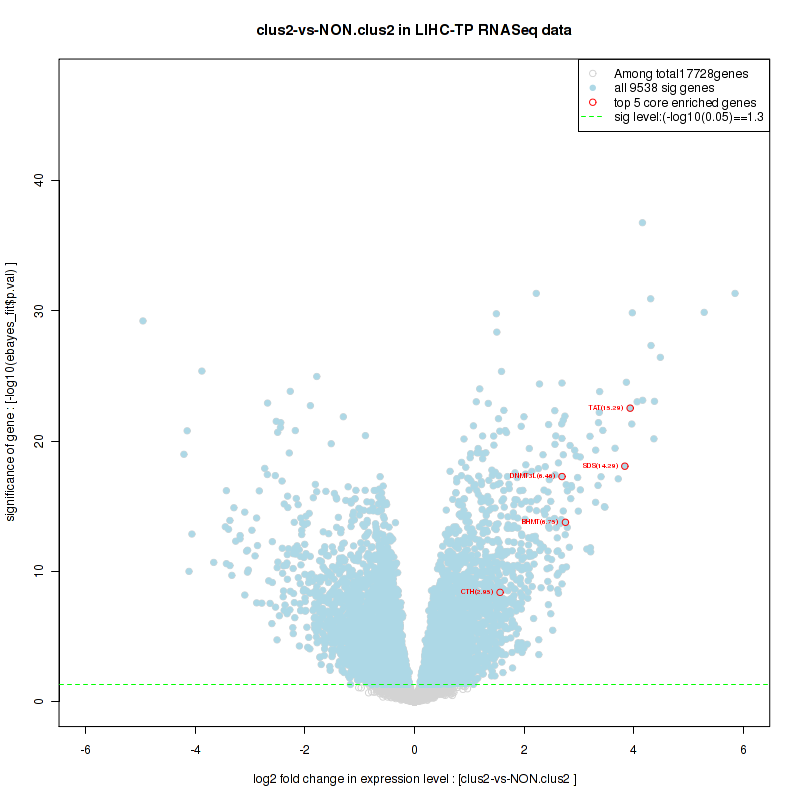
Table S16. Get Full Table This table shows a Running Enrichment Score (RES) of each gene in this pathway, that is, the enrichment score at this point in the ranked list of genes. All genes are ranked by Signal-to-Noise (S2N), a measure of similarity as default and are used to obtain ES matrix of all genes. In this way, GSEA tool uses expression pattern of not only overlapped genes but also not-overlapped genes to produce ES matrix.
| Rank | GENE | SYMBOL | DESC | LIST.LOC | S2N | RES | CORE_ENRICHMENT |
|---|---|---|---|---|---|---|---|
| 1 | CYP2A7 | CYP2A7 | CYP2A7 | 1 | 1.1 | 0.095 | YES |
| 2 | CYP2A13 | CYP2A13 | CYP2A13 | 2 | 0.87 | 0.17 | YES |
| 3 | CYP2A6 | CYP2A6 | CYP2A6 | 6 | 0.82 | 0.24 | YES |
| 4 | XDH | XDH | XDH | 38 | 0.6 | 0.3 | YES |
| 5 | CDA | CDA | CDA | 100 | 0.5 | 0.34 | YES |
| 6 | UPP2 | UPP2 | UPP2 | 121 | 0.48 | 0.38 | YES |
| 7 | NAT2 | NAT2 | NAT2 | 179 | 0.43 | 0.41 | YES |
| 8 | UGT2B10 | UGT2B10 | UGT2B10 | 249 | 0.39 | 0.44 | YES |
| 9 | UGT2B7 | UGT2B7 | UGT2B7 | 254 | 0.39 | 0.48 | YES |
| 10 | UPB1 | UPB1 | UPB1 | 315 | 0.37 | 0.51 | YES |
| 11 | UGT2B15 | UGT2B15 | UGT2B15 | 376 | 0.34 | 0.54 | YES |
| 12 | DPYS | DPYS | DPYS | 422 | 0.33 | 0.56 | YES |
| 13 | NAT1 | NAT1 | NAT1 | 563 | 0.29 | 0.58 | YES |
| 14 | CES7 | CES7 | CES7 | 593 | 0.29 | 0.6 | YES |
| 15 | UGT1A3 | UGT1A3 | UGT1A3 | 793 | 0.25 | 0.61 | YES |
| 16 | CES2 | CES2 | CES2 | 803 | 0.24 | 0.64 | YES |
| 17 | UGT2B28 | UGT2B28 | UGT2B28 | 850 | 0.24 | 0.65 | YES |
| 18 | DPYD | DPYD | DPYD | 905 | 0.23 | 0.67 | YES |
| 19 | UGT2A1 | UGT2A1 | UGT2A1 | 950 | 0.22 | 0.69 | YES |
| 20 | CYP3A43 | CYP3A43 | CYP3A43 | 966 | 0.22 | 0.71 | YES |
| 21 | CYP3A5 | CYP3A5 | CYP3A5 | 1088 | 0.2 | 0.72 | YES |
| 22 | CYP3A7 | CYP3A7 | CYP3A7 | 1165 | 0.19 | 0.73 | YES |
| 23 | UGT1A9 | UGT1A9 | UGT1A9 | 1328 | 0.18 | 0.74 | YES |
| 24 | UGT1A4 | UGT1A4 | UGT1A4 | 1528 | 0.16 | 0.74 | YES |
| 25 | UGT2B4 | UGT2B4 | UGT2B4 | 1628 | 0.15 | 0.75 | YES |
| 26 | CES1 | CES1 | CES1 | 1759 | 0.14 | 0.76 | YES |
| 27 | UGT1A5 | UGT1A5 | UGT1A5 | 1834 | 0.14 | 0.76 | YES |
| 28 | GUSB | GUSB | GUSB | 2652 | 0.1 | 0.73 | NO |
| 29 | TPMT | TPMT | TPMT | 3123 | 0.081 | 0.71 | NO |
| 30 | HPRT1 | HPRT1 | HPRT1 | 3261 | 0.076 | 0.7 | NO |
| 31 | TYMP | TYMP | TYMP | 3379 | 0.072 | 0.7 | NO |
| 32 | UGT1A1 | UGT1A1 | UGT1A1 | 3874 | 0.058 | 0.68 | NO |
| 33 | TK2 | TK2 | TK2 | 3915 | 0.057 | 0.68 | NO |
| 34 | UGT1A8 | UGT1A8 | UGT1A8 | 4805 | 0.037 | 0.64 | NO |
| 35 | UGT1A6 | UGT1A6 | UGT1A6 | 5275 | 0.028 | 0.61 | NO |
| 36 | UGT1A7 | UGT1A7 | UGT1A7 | 5450 | 0.024 | 0.61 | NO |
| 37 | UCK1 | UCK1 | UCK1 | 6471 | 0.0083 | 0.55 | NO |
| 38 | UCKL1 | UCKL1 | UCKL1 | 6955 | 0.0011 | 0.52 | NO |
| 39 | UPP1 | UPP1 | UPP1 | 7157 | -0.0018 | 0.51 | NO |
| 40 | UMPS | UMPS | UMPS | 7354 | -0.0045 | 0.5 | NO |
| 41 | UGT2A3 | UGT2A3 | UGT2A3 | 7796 | -0.011 | 0.48 | NO |
| 42 | GMPS | GMPS | GMPS | 10669 | -0.053 | 0.32 | NO |
| 43 | UGT2B11 | UGT2B11 | UGT2B11 | 11592 | -0.07 | 0.27 | NO |
| 44 | TK1 | TK1 | TK1 | 11686 | -0.072 | 0.27 | NO |
| 45 | UGT1A10 | UGT1A10 | UGT1A10 | 12920 | -0.098 | 0.21 | NO |
| 46 | IMPDH2 | IMPDH2 | IMPDH2 | 13043 | -0.1 | 0.22 | NO |
| 47 | ITPA | ITPA | ITPA | 13531 | -0.11 | 0.2 | NO |
| 48 | UCK2 | UCK2 | UCK2 | 14192 | -0.13 | 0.17 | NO |
| 49 | IMPDH1 | IMPDH1 | IMPDH1 | 17067 | -0.32 | 0.037 | NO |
Figure S31. Get High-res Image This plot shows mRNAseq_cNMF expression data heatmap (on the left) a RunningEnrichmentScore(RES) plot (on the top right) and a Signal2Noise(S2N) plot (on the bottom right) of genes in the pathway: KEGG ALANINE ASPARTATE AND GLUTAMATE METABOLISM.
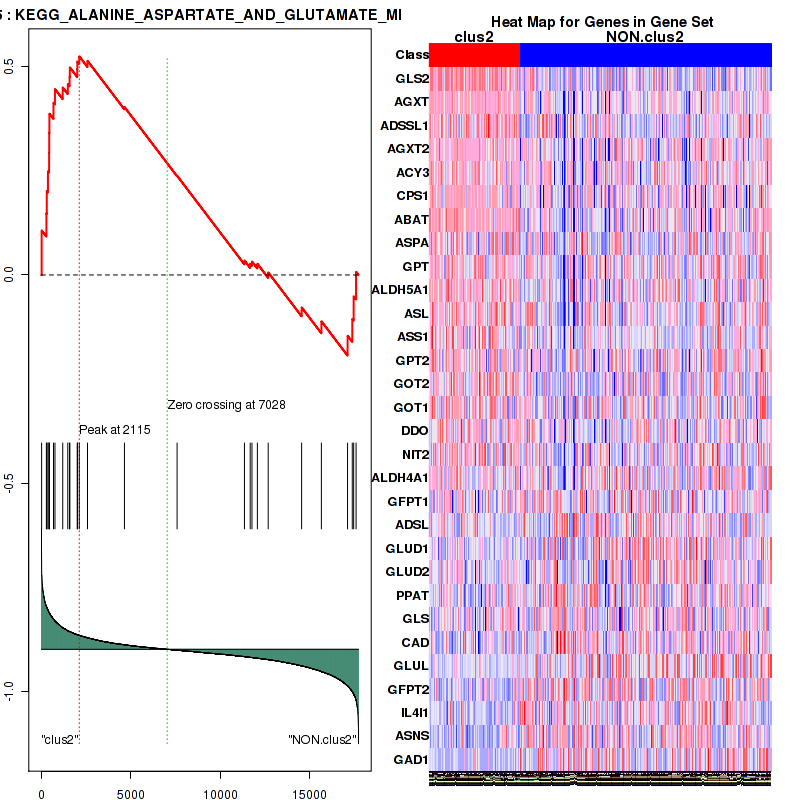
Figure S32. Get High-res Image For the top 5 core enriched genes in the pathway: KEGG ALANINE ASPARTATE AND GLUTAMATE METABOLISM, this volcano plot shows how much they are up/down-regulated and significant. The significance was calculated by empirical bayesian fit

Table S17. Get Full Table This table shows a Running Enrichment Score (RES) of each gene in this pathway, that is, the enrichment score at this point in the ranked list of genes. All genes are ranked by Signal-to-Noise (S2N), a measure of similarity as default and are used to obtain ES matrix of all genes. In this way, GSEA tool uses expression pattern of not only overlapped genes but also not-overlapped genes to produce ES matrix.
| Rank | GENE | SYMBOL | DESC | LIST.LOC | S2N | RES | CORE_ENRICHMENT |
|---|---|---|---|---|---|---|---|
| 1 | PCK1 | PCK1 | PCK1 | 219 | 0.41 | 0.13 | YES |
| 2 | OGDHL | OGDHL | OGDHL | 410 | 0.33 | 0.24 | YES |
| 3 | PCK2 | PCK2 | PCK2 | 484 | 0.31 | 0.35 | YES |
| 4 | ACO1 | ACO1 | ACO1 | 1331 | 0.18 | 0.37 | YES |
| 5 | SUCLG2 | SUCLG2 | SUCLG2 | 1865 | 0.14 | 0.39 | YES |
| 6 | SDHD | SDHD | SDHD | 2056 | 0.13 | 0.42 | YES |
| 7 | PC | PC | PC | 2328 | 0.11 | 0.45 | YES |
| 8 | SDHB | SDHB | SDHB | 2330 | 0.11 | 0.49 | YES |
| 9 | SUCLG1 | SUCLG1 | SUCLG1 | 2518 | 0.1 | 0.52 | YES |
| 10 | FH | FH | FH | 2648 | 0.1 | 0.54 | YES |
| 11 | OGDH | OGDH | OGDH | 3448 | 0.07 | 0.52 | YES |
| 12 | SDHA | SDHA | SDHA | 3489 | 0.069 | 0.55 | YES |
| 13 | IDH1 | IDH1 | IDH1 | 3873 | 0.058 | 0.55 | YES |
| 14 | ACO2 | ACO2 | ACO2 | 3982 | 0.055 | 0.56 | YES |
| 15 | MDH1 | MDH1 | MDH1 | 4089 | 0.052 | 0.57 | YES |
| 16 | DLD | DLD | DLD | 4182 | 0.05 | 0.59 | YES |
| 17 | IDH3A | IDH3A | IDH3A | 4286 | 0.048 | 0.6 | YES |
| 18 | DLST | DLST | DLST | 4728 | 0.039 | 0.59 | NO |
| 19 | PDHB | PDHB | PDHB | 4843 | 0.036 | 0.59 | NO |
| 20 | SDHC | SDHC | SDHC | 5232 | 0.029 | 0.58 | NO |
| 21 | IDH2 | IDH2 | IDH2 | 5757 | 0.02 | 0.56 | NO |
| 22 | PDHA1 | PDHA1 | PDHA1 | 5883 | 0.017 | 0.56 | NO |
| 23 | IDH3B | IDH3B | IDH3B | 7235 | -0.0028 | 0.48 | NO |
| 24 | DLAT | DLAT | DLAT | 8055 | -0.015 | 0.44 | NO |
| 25 | SUCLA2 | SUCLA2 | SUCLA2 | 8485 | -0.02 | 0.42 | NO |
| 26 | MDH2 | MDH2 | MDH2 | 8710 | -0.024 | 0.42 | NO |
| 27 | IDH3G | IDH3G | IDH3G | 9692 | -0.038 | 0.38 | NO |
| 28 | ACLY | ACLY | ACLY | 11501 | -0.068 | 0.3 | NO |
| 29 | CS | CS | CS | 14366 | -0.14 | 0.19 | NO |
Figure S33. Get High-res Image This plot shows mRNAseq_cNMF expression data heatmap (on the left) a RunningEnrichmentScore(RES) plot (on the top right) and a Signal2Noise(S2N) plot (on the bottom right) of genes in the pathway: KEGG GLYCINE SERINE AND THREONINE METABOLISM.
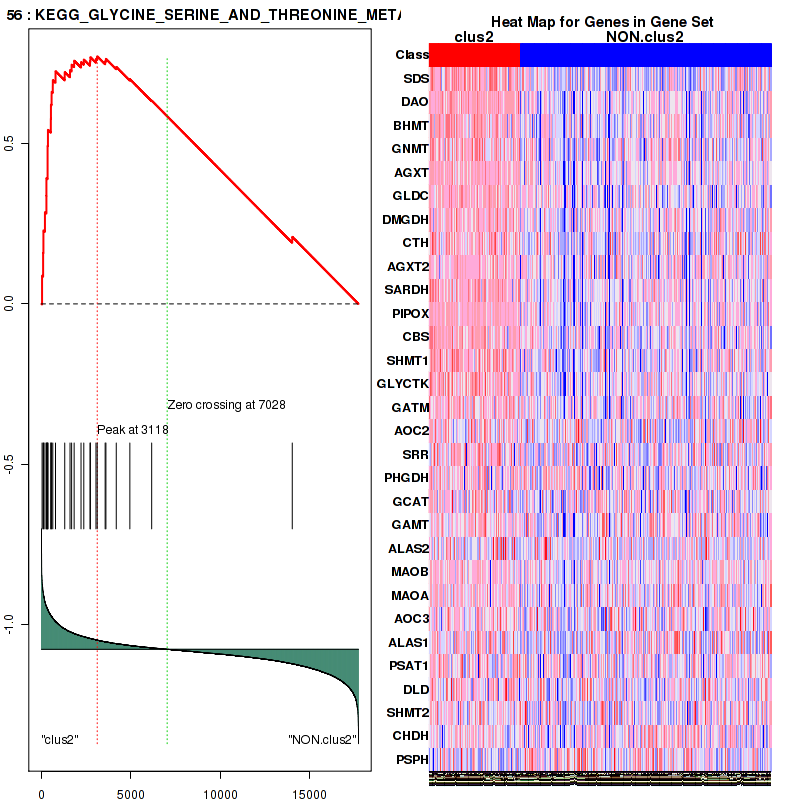
Figure S34. Get High-res Image For the top 5 core enriched genes in the pathway: KEGG GLYCINE SERINE AND THREONINE METABOLISM, this volcano plot shows how much they are up/down-regulated and significant. The significance was calculated by empirical bayesian fit

Table S18. Get Full Table This table shows a Running Enrichment Score (RES) of each gene in this pathway, that is, the enrichment score at this point in the ranked list of genes. All genes are ranked by Signal-to-Noise (S2N), a measure of similarity as default and are used to obtain ES matrix of all genes. In this way, GSEA tool uses expression pattern of not only overlapped genes but also not-overlapped genes to produce ES matrix.
| Rank | GENE | SYMBOL | DESC | LIST.LOC | S2N | RES | CORE_ENRICHMENT |
|---|---|---|---|---|---|---|---|
| 1 | ALDH6A1 | ALDH6A1 | ALDH6A1 | 433 | 0.32 | 0.028 | YES |
| 2 | ABAT | ABAT | ABAT | 444 | 0.32 | 0.079 | YES |
| 3 | EHHADH | EHHADH | EHHADH | 518 | 0.3 | 0.12 | YES |
| 4 | HMGCS2 | HMGCS2 | HMGCS2 | 584 | 0.29 | 0.17 | YES |
| 5 | BCKDHB | BCKDHB | BCKDHB | 834 | 0.24 | 0.19 | YES |
| 6 | ACAA2 | ACAA2 | ACAA2 | 916 | 0.23 | 0.22 | YES |
| 7 | MUT | MUT | MUT | 965 | 0.22 | 0.26 | YES |
| 8 | ACADM | ACADM | ACADM | 1075 | 0.2 | 0.28 | YES |
| 9 | ALDH7A1 | ALDH7A1 | ALDH7A1 | 1215 | 0.19 | 0.3 | YES |
| 10 | ALDH2 | ALDH2 | ALDH2 | 1372 | 0.18 | 0.32 | YES |
| 11 | IVD | IVD | IVD | 1434 | 0.17 | 0.35 | YES |
| 12 | DBT | DBT | DBT | 1488 | 0.16 | 0.37 | YES |
| 13 | ACAT1 | ACAT1 | ACAT1 | 1623 | 0.15 | 0.39 | YES |
| 14 | ACAT2 | ACAT2 | ACAT2 | 1797 | 0.14 | 0.4 | YES |
| 15 | MCEE | MCEE | MCEE | 1812 | 0.14 | 0.42 | YES |
| 16 | ACADSB | ACADSB | ACADSB | 1889 | 0.14 | 0.44 | YES |
| 17 | PCCA | PCCA | PCCA | 1939 | 0.13 | 0.46 | YES |
| 18 | ALDH9A1 | ALDH9A1 | ALDH9A1 | 1944 | 0.13 | 0.48 | YES |
| 19 | HMGCL | HMGCL | HMGCL | 1952 | 0.13 | 0.5 | YES |
| 20 | HADH | HADH | HADH | 2029 | 0.13 | 0.52 | YES |
| 21 | ACAA1 | ACAA1 | ACAA1 | 2133 | 0.12 | 0.53 | YES |
| 22 | ACADS | ACADS | ACADS | 2183 | 0.12 | 0.55 | YES |
| 23 | HMGCS1 | HMGCS1 | HMGCS1 | 2251 | 0.12 | 0.56 | YES |
| 24 | PCCB | PCCB | PCCB | 2299 | 0.12 | 0.58 | YES |
| 25 | HSD17B10 | HSD17B10 | HSD17B10 | 2329 | 0.11 | 0.6 | YES |
| 26 | HIBCH | HIBCH | HIBCH | 2444 | 0.11 | 0.61 | YES |
| 27 | MCCC1 | MCCC1 | MCCC1 | 2560 | 0.1 | 0.62 | YES |
| 28 | ACAD8 | ACAD8 | ACAD8 | 2603 | 0.1 | 0.63 | YES |
| 29 | BCKDHA | BCKDHA | BCKDHA | 3035 | 0.085 | 0.62 | YES |
| 30 | ALDH1B1 | ALDH1B1 | ALDH1B1 | 3156 | 0.08 | 0.63 | YES |
| 31 | ECHS1 | ECHS1 | ECHS1 | 3249 | 0.077 | 0.64 | YES |
| 32 | MCCC2 | MCCC2 | MCCC2 | 3336 | 0.074 | 0.64 | YES |
| 33 | BCAT2 | BCAT2 | BCAT2 | 3857 | 0.058 | 0.62 | NO |
| 34 | HADHB | HADHB | HADHB | 4052 | 0.053 | 0.62 | NO |
| 35 | DLD | DLD | DLD | 4182 | 0.05 | 0.62 | NO |
| 36 | HIBADH | HIBADH | HIBADH | 4264 | 0.049 | 0.62 | NO |
| 37 | HADHA | HADHA | HADHA | 4376 | 0.046 | 0.62 | NO |
| 38 | AUH | AUH | AUH | 5003 | 0.032 | 0.6 | NO |
| 39 | ALDH3A2 | ALDH3A2 | ALDH3A2 | 8173 | -0.016 | 0.42 | NO |
| 40 | AOX1 | AOX1 | AOX1 | 9394 | -0.034 | 0.36 | NO |
| 41 | OXCT2 | OXCT2 | OXCT2 | 15021 | -0.17 | 0.063 | NO |
| 42 | OXCT1 | OXCT1 | OXCT1 | 15345 | -0.18 | 0.074 | NO |
| 43 | IL4I1 | IL4I1 | IL4I1 | 17380 | -0.38 | 0.02 | NO |
Figure S35. Get High-res Image This plot shows mRNAseq_cNMF expression data heatmap (on the left) a RunningEnrichmentScore(RES) plot (on the top right) and a Signal2Noise(S2N) plot (on the bottom right) of genes in the pathway: KEGG CYSTEINE AND METHIONINE METABOLISM.
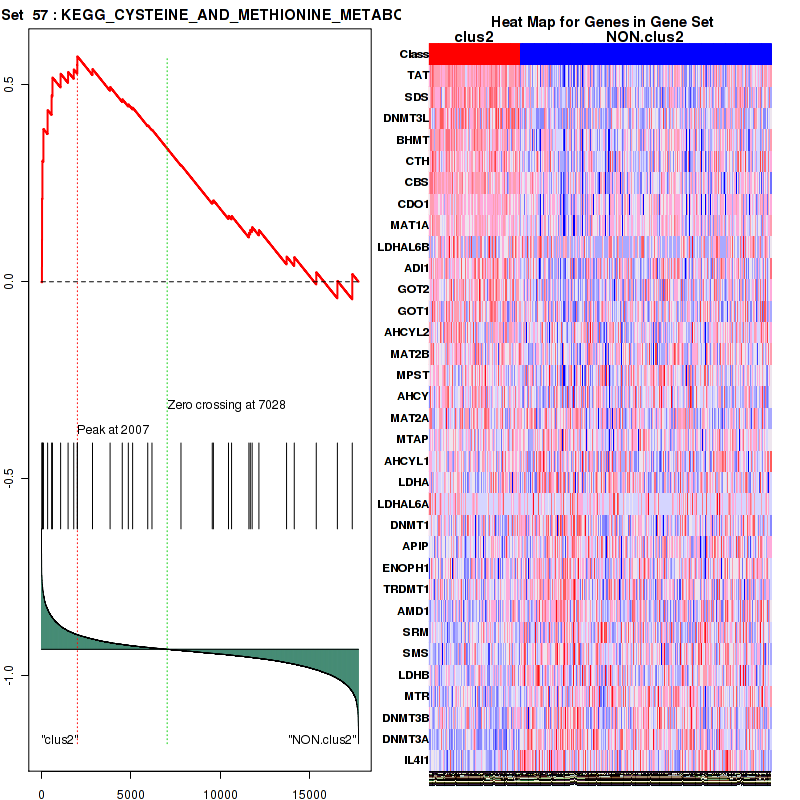
Figure S36. Get High-res Image For the top 5 core enriched genes in the pathway: KEGG CYSTEINE AND METHIONINE METABOLISM, this volcano plot shows how much they are up/down-regulated and significant. The significance was calculated by empirical bayesian fit
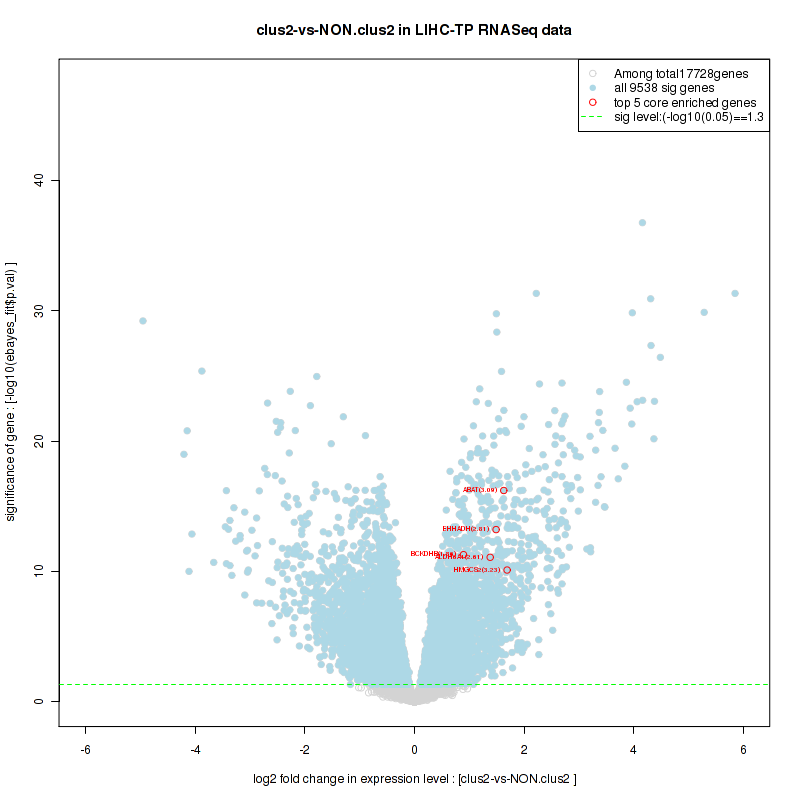
Table S19. Get Full Table This table shows a Running Enrichment Score (RES) of each gene in this pathway, that is, the enrichment score at this point in the ranked list of genes. All genes are ranked by Signal-to-Noise (S2N), a measure of similarity as default and are used to obtain ES matrix of all genes. In this way, GSEA tool uses expression pattern of not only overlapped genes but also not-overlapped genes to produce ES matrix.
| Rank | GENE | SYMBOL | DESC | LIST.LOC | S2N | RES | CORE_ENRICHMENT |
|---|---|---|---|---|---|---|---|
| 1 | GBA3 | GBA3 | GBA3 | 13 | 0.7 | 0.073 | YES |
| 2 | GCK | GCK | GCK | 14 | 0.66 | 0.14 | YES |
| 3 | GYS2 | GYS2 | GYS2 | 21 | 0.65 | 0.21 | YES |
| 4 | AMY2B | AMY2B | AMY2B | 217 | 0.41 | 0.24 | YES |
| 5 | AMY1A | AMY1A | AMY1A | 237 | 0.4 | 0.29 | YES |
| 6 | AMY2A | AMY2A | AMY2A | 245 | 0.39 | 0.33 | YES |
| 7 | UGT2B10 | UGT2B10 | UGT2B10 | 249 | 0.39 | 0.37 | YES |
| 8 | UGT2B7 | UGT2B7 | UGT2B7 | 254 | 0.39 | 0.41 | YES |
| 9 | UGT2B15 | UGT2B15 | UGT2B15 | 376 | 0.34 | 0.44 | YES |
| 10 | G6PC | G6PC | G6PC | 494 | 0.31 | 0.47 | YES |
| 11 | AGL | AGL | AGL | 643 | 0.27 | 0.49 | YES |
| 12 | UGT1A3 | UGT1A3 | UGT1A3 | 793 | 0.25 | 0.5 | YES |
| 13 | UGT2B28 | UGT2B28 | UGT2B28 | 850 | 0.24 | 0.53 | YES |
| 14 | TREH | TREH | TREH | 880 | 0.23 | 0.55 | YES |
| 15 | UGT2A1 | UGT2A1 | UGT2A1 | 950 | 0.22 | 0.57 | YES |
| 16 | PGM2 | PGM2 | PGM2 | 1096 | 0.2 | 0.58 | YES |
| 17 | UGP2 | UGP2 | UGP2 | 1123 | 0.2 | 0.6 | YES |
| 18 | PYGL | PYGL | PYGL | 1158 | 0.2 | 0.62 | YES |
| 19 | UGT1A9 | UGT1A9 | UGT1A9 | 1328 | 0.18 | 0.63 | YES |
| 20 | UGT1A4 | UGT1A4 | UGT1A4 | 1528 | 0.16 | 0.64 | YES |
| 21 | PGM1 | PGM1 | PGM1 | 1605 | 0.16 | 0.65 | YES |
| 22 | UGT2B4 | UGT2B4 | UGT2B4 | 1628 | 0.15 | 0.66 | YES |
| 23 | UGT1A5 | UGT1A5 | UGT1A5 | 1834 | 0.14 | 0.67 | YES |
| 24 | GBE1 | GBE1 | GBE1 | 1852 | 0.14 | 0.68 | YES |
| 25 | GANC | GANC | GANC | 1943 | 0.13 | 0.69 | YES |
| 26 | ENPP1 | ENPP1 | ENPP1 | 2278 | 0.12 | 0.68 | NO |
| 27 | GUSB | GUSB | GUSB | 2652 | 0.1 | 0.67 | NO |
| 28 | G6PC2 | G6PC2 | G6PC2 | 2688 | 0.098 | 0.68 | NO |
| 29 | GAA | GAA | GAA | 3403 | 0.072 | 0.65 | NO |
| 30 | UGT1A1 | UGT1A1 | UGT1A1 | 3874 | 0.058 | 0.63 | NO |
| 31 | UGT1A8 | UGT1A8 | UGT1A8 | 4805 | 0.037 | 0.58 | NO |
| 32 | UGT1A6 | UGT1A6 | UGT1A6 | 5275 | 0.028 | 0.56 | NO |
| 33 | UGT1A7 | UGT1A7 | UGT1A7 | 5450 | 0.024 | 0.55 | NO |
| 34 | GPI | GPI | GPI | 6786 | 0.0036 | 0.47 | NO |
| 35 | UGT2A3 | UGT2A3 | UGT2A3 | 7796 | -0.011 | 0.42 | NO |
| 36 | HK1 | HK1 | HK1 | 8036 | -0.014 | 0.4 | NO |
| 37 | UGDH | UGDH | UGDH | 8922 | -0.028 | 0.36 | NO |
| 38 | ENPP3 | ENPP3 | ENPP3 | 10124 | -0.044 | 0.3 | NO |
| 39 | PYGB | PYGB | PYGB | 11275 | -0.064 | 0.24 | NO |
| 40 | UGT2B11 | UGT2B11 | UGT2B11 | 11592 | -0.07 | 0.23 | NO |
| 41 | GYS1 | GYS1 | GYS1 | 11891 | -0.075 | 0.22 | NO |
| 42 | PYGM | PYGM | PYGM | 12596 | -0.09 | 0.19 | NO |
| 43 | UGT1A10 | UGT1A10 | UGT1A10 | 12920 | -0.098 | 0.18 | NO |
| 44 | MGAM | MGAM | MGAM | 13833 | -0.12 | 0.14 | NO |
| 45 | HK3 | HK3 | HK3 | 15164 | -0.17 | 0.084 | NO |
| 46 | PGM2L1 | PGM2L1 | PGM2L1 | 15657 | -0.2 | 0.077 | NO |
| 47 | HK2 | HK2 | HK2 | 17388 | -0.38 | 0.019 | NO |
Figure S37. Get High-res Image This plot shows mRNAseq_cNMF expression data heatmap (on the left) a RunningEnrichmentScore(RES) plot (on the top right) and a Signal2Noise(S2N) plot (on the bottom right) of genes in the pathway: KEGG VALINE LEUCINE AND ISOLEUCINE DEGRADATION.
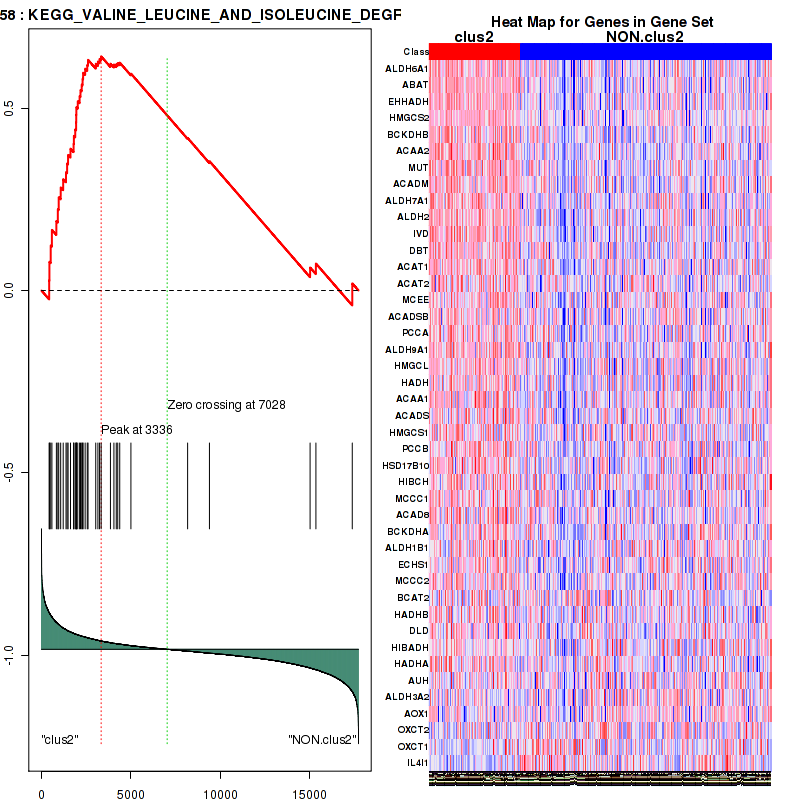
Figure S38. Get High-res Image For the top 5 core enriched genes in the pathway: KEGG VALINE LEUCINE AND ISOLEUCINE DEGRADATION, this volcano plot shows how much they are up/down-regulated and significant. The significance was calculated by empirical bayesian fit
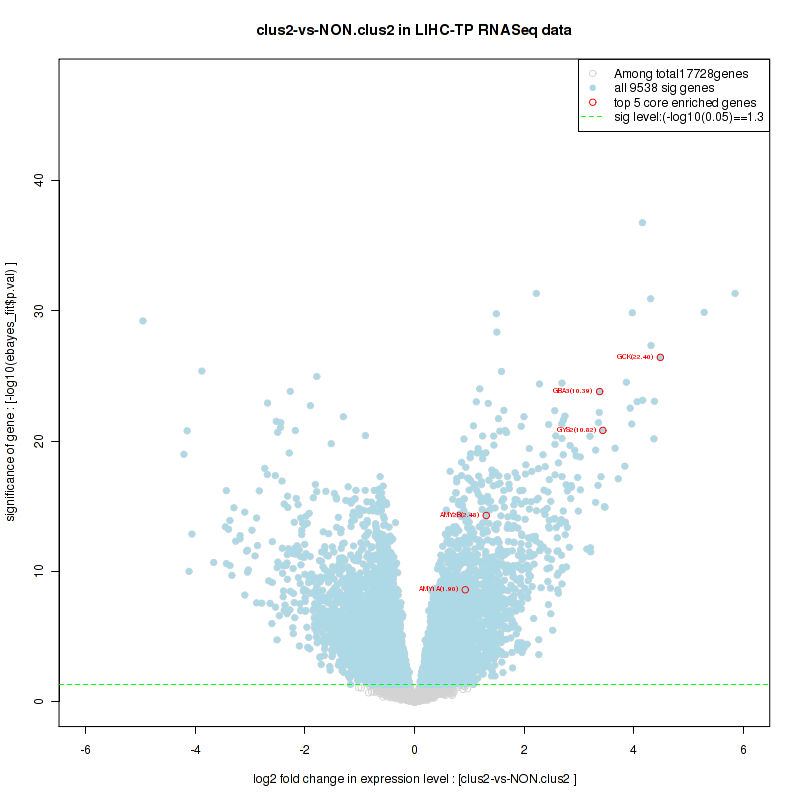
Table S20. Get Full Table This table shows a Running Enrichment Score (RES) of each gene in this pathway, that is, the enrichment score at this point in the ranked list of genes. All genes are ranked by Signal-to-Noise (S2N), a measure of similarity as default and are used to obtain ES matrix of all genes. In this way, GSEA tool uses expression pattern of not only overlapped genes but also not-overlapped genes to produce ES matrix.
| Rank | GENE | SYMBOL | DESC | LIST.LOC | S2N | RES | CORE_ENRICHMENT |
|---|---|---|---|---|---|---|---|
| 1 | SDS | SDS | SDS | 34 | 0.62 | 0.088 | YES |
| 2 | DAO | DAO | DAO | 94 | 0.51 | 0.16 | YES |
| 3 | BHMT | BHMT | BHMT | 110 | 0.49 | 0.23 | YES |
| 4 | GNMT | GNMT | GNMT | 194 | 0.42 | 0.29 | YES |
| 5 | AGXT | AGXT | AGXT | 276 | 0.38 | 0.34 | YES |
| 6 | GLDC | GLDC | GLDC | 278 | 0.38 | 0.39 | YES |
| 7 | DMGDH | DMGDH | DMGDH | 343 | 0.36 | 0.44 | YES |
| 8 | CTH | CTH | CTH | 344 | 0.36 | 0.49 | YES |
| 9 | AGXT2 | AGXT2 | AGXT2 | 363 | 0.35 | 0.54 | YES |
| 10 | SARDH | SARDH | SARDH | 524 | 0.3 | 0.58 | YES |
| 11 | PIPOX | PIPOX | PIPOX | 530 | 0.3 | 0.62 | YES |
| 12 | CBS | CBS | CBS | 568 | 0.29 | 0.66 | YES |
| 13 | SHMT1 | SHMT1 | SHMT1 | 634 | 0.28 | 0.7 | YES |
| 14 | GLYCTK | GLYCTK | GLYCTK | 786 | 0.25 | 0.73 | YES |
| 15 | GATM | GATM | GATM | 1301 | 0.18 | 0.72 | YES |
| 16 | AOC2 | AOC2 | AOC2 | 1596 | 0.16 | 0.73 | YES |
| 17 | SRR | SRR | SRR | 1685 | 0.15 | 0.75 | YES |
| 18 | PHGDH | PHGDH | PHGDH | 1828 | 0.14 | 0.76 | YES |
| 19 | GCAT | GCAT | GCAT | 2214 | 0.12 | 0.76 | YES |
| 20 | GAMT | GAMT | GAMT | 2366 | 0.11 | 0.76 | YES |
| 21 | ALAS2 | ALAS2 | ALAS2 | 2716 | 0.097 | 0.76 | YES |
| 22 | MAOB | MAOB | MAOB | 2736 | 0.096 | 0.77 | YES |
| 23 | MAOA | MAOA | MAOA | 3046 | 0.084 | 0.76 | YES |
| 24 | AOC3 | AOC3 | AOC3 | 3118 | 0.082 | 0.77 | YES |
| 25 | ALAS1 | ALAS1 | ALAS1 | 3562 | 0.067 | 0.76 | NO |
| 26 | PSAT1 | PSAT1 | PSAT1 | 3602 | 0.066 | 0.76 | NO |
| 27 | DLD | DLD | DLD | 4182 | 0.05 | 0.74 | NO |
| 28 | SHMT2 | SHMT2 | SHMT2 | 4941 | 0.034 | 0.7 | NO |
| 29 | CHDH | CHDH | CHDH | 6163 | 0.013 | 0.64 | NO |
| 30 | PSPH | PSPH | PSPH | 14022 | -0.13 | 0.21 | NO |
Figure S39. Get High-res Image This plot shows mRNAseq_cNMF expression data heatmap (on the left) a RunningEnrichmentScore(RES) plot (on the top right) and a Signal2Noise(S2N) plot (on the bottom right) of genes in the pathway: KEGG LYSINE DEGRADATION.
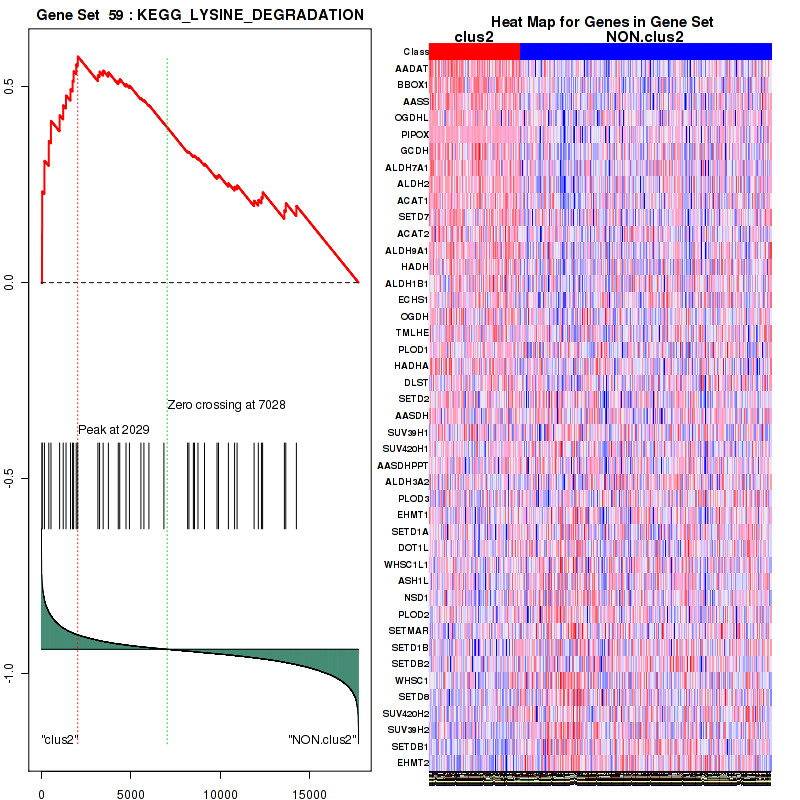
Figure S40. Get High-res Image For the top 5 core enriched genes in the pathway: KEGG LYSINE DEGRADATION, this volcano plot shows how much they are up/down-regulated and significant. The significance was calculated by empirical bayesian fit
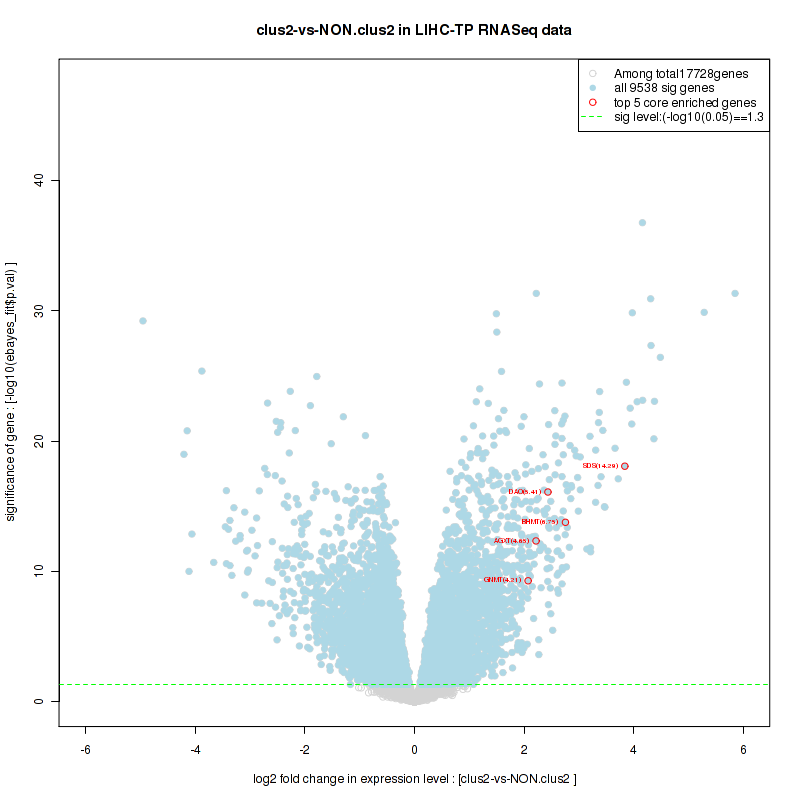
For the top enriched genes, if you want to check whether they are
-
up-regulated, please check the list of up-regulated genes
-
down-regulated, please check the list of down-regulated genes
For the top enriched genes, if you want to check whether they are
-
highly expressed genes, please check the list of high (top 30%) expressed genes
-
low expressed genes, please check the list of low (bottom 30%) expressed genes
An expression pattern of top(30%)/middle(30%)/low(30%) in this subtype against other subtypes is available in a heatmap
For the top enriched genes, if you want to check whether they are
-
significantly differently expressed genes by eBayes lm fit, please check the list of significant genes
Table 5. Get Full Table This table shows top 10 pathways which are significantly enriched in cluster clus3. It displays only significant gene sets satisfying nom.p.val.threshold (-1), fwer.p.val.threshold (-1) , fdr.q.val.threshold (0.25) and the default table is sorted by Normalized Enrichment Score (NES). Further details on NES statistics, please visit The Broad GSEA website.
| GeneSet(GS) | Size(#genes) | genes.ES.table | ES | NES | NOM.p.val | FDR.q.val | FWER.p.val | Tag.. | Gene.. | Signal | FDR..median. | glob.p.val |
|---|---|---|---|---|---|---|---|---|---|---|---|---|
| BIOCARTA G1 PATHWAY | 27 | genes.ES.table | 0.34 | 0.96 | 0.51 | 1 | 1 | 0.22 | 0.13 | 0.19 | 1 | 0.8 |
| BIOCARTA MPR PATHWAY | 32 | genes.ES.table | 0.46 | 1.5 | 0.076 | 1 | 0.92 | 0.19 | 0.065 | 0.18 | 1 | 0.84 |
| BIOCARTA INTEGRIN PATHWAY | 37 | genes.ES.table | 0.25 | 0.98 | 0.46 | 1 | 1 | 0.081 | 0.083 | 0.074 | 1 | 0.79 |
| BIOCARTA WNT PATHWAY | 25 | genes.ES.table | 0.31 | 1.1 | 0.39 | 1 | 1 | 0.4 | 0.33 | 0.27 | 1 | 0.77 |
| KEGG INOSITOL PHOSPHATE METABOLISM | 53 | genes.ES.table | 0.3 | 0.99 | 0.49 | 1 | 1 | 0.19 | 0.16 | 0.16 | 1 | 0.8 |
| KEGG ETHER LIPID METABOLISM | 26 | genes.ES.table | 0.44 | 1.2 | 0.23 | 1 | 1 | 0.35 | 0.15 | 0.29 | 1 | 0.72 |
| KEGG SPHINGOLIPID METABOLISM | 36 | genes.ES.table | 0.35 | 1.1 | 0.36 | 1 | 1 | 0.11 | 0.04 | 0.11 | 1 | 0.81 |
| KEGG GLYCOSPHINGOLIPID BIOSYNTHESIS LACTO AND NEOLACTO SERIES | 25 | genes.ES.table | 0.37 | 0.95 | 0.52 | 1 | 1 | 0.28 | 0.13 | 0.24 | 1 | 0.81 |
| KEGG RIBOSOME | 85 | genes.ES.table | 0.57 | 1.4 | 0.21 | 1 | 0.95 | 0.73 | 0.26 | 0.55 | 1 | 0.8 |
| KEGG DNA REPLICATION | 35 | genes.ES.table | 0.52 | 1.4 | 0.21 | 1 | 0.96 | 0.6 | 0.28 | 0.43 | 1 | 0.67 |
Table S21. Get Full Table This table shows a Running Enrichment Score (RES) of each gene in this pathway, that is, the enrichment score at this point in the ranked list of genes. All genes are ranked by Signal-to-Noise (S2N), a measure of similarity as default and are used to obtain ES matrix of all genes. In this way, GSEA tool uses expression pattern of not only overlapped genes but also not-overlapped genes to produce ES matrix.
| Rank | GENE | SYMBOL | DESC | LIST.LOC | S2N | RES | CORE_ENRICHMENT |
|---|---|---|---|---|---|---|---|
| 1 | MYT1 | MYT1 | MYT1 | 87 | 0.54 | 0.14 | YES |
| 2 | ACTA1 | ACTA1 | ACTA1 | 327 | 0.39 | 0.23 | YES |
| 3 | CDK1 | CDK1 | CDK1 | 597 | 0.32 | 0.3 | YES |
| 4 | CDC25C | CDC25C | CDC25C | 878 | 0.27 | 0.35 | YES |
| 5 | SRC | SRC | SRC | 1102 | 0.24 | 0.4 | YES |
| 6 | CCNB1 | CCNB1 | CCNB1 | 1154 | 0.23 | 0.46 | YES |
| 7 | GNAS | GNAS | GNAS | 2731 | 0.13 | 0.41 | NO |
| 8 | PAQR5 | PAQR5 | PAQR5 | 4020 | 0.087 | 0.36 | NO |
| 9 | ARPC3 | ARPC3 | ARPC3 | 5455 | 0.057 | 0.29 | NO |
| 10 | PAQR7 | PAQR7 | PAQR7 | 6123 | 0.045 | 0.26 | NO |
| 11 | MAPK1 | MAPK1 | MAPK1 | 6795 | 0.034 | 0.24 | NO |
| 12 | ARPC1A | ARPC1A | ARPC1A | 6907 | 0.032 | 0.24 | NO |
| 13 | ARPC4 | ARPC4 | ARPC4 | 7143 | 0.028 | 0.23 | NO |
| 14 | PIN1 | PIN1 | PIN1 | 7383 | 0.025 | 0.22 | NO |
| 15 | ARPC2 | ARPC2 | ARPC2 | 7719 | 0.02 | 0.21 | NO |
| 16 | PRKAR2B | PRKAR2B | PRKAR2B | 8848 | 0.0035 | 0.15 | NO |
| 17 | ACTR2 | ACTR2 | ACTR2 | 9134 | -0.0012 | 0.13 | NO |
| 18 | ACTR3 | ACTR3 | ACTR3 | 9203 | -0.0022 | 0.13 | NO |
| 19 | ARPC5 | ARPC5 | ARPC5 | 9251 | -0.0029 | 0.13 | NO |
| 20 | MAPK3 | MAPK3 | MAPK3 | 9334 | -0.0044 | 0.12 | NO |
| 21 | ARPC1B | ARPC1B | ARPC1B | 9731 | -0.011 | 0.1 | NO |
| 22 | HRAS | HRAS | HRAS | 9801 | -0.012 | 0.1 | NO |
| 23 | PRKAR1B | PRKAR1B | PRKAR1B | 9997 | -0.015 | 0.097 | NO |
| 24 | PRKAR1A | PRKAR1A | PRKAR1A | 11606 | -0.043 | 0.018 | NO |
| 25 | GNB1 | GNB1 | GNB1 | 12939 | -0.071 | -0.039 | NO |
| 26 | CAP1 | CAP1 | CAP1 | 13823 | -0.094 | -0.064 | NO |
| 27 | GNAI1 | GNAI1 | GNAI1 | 14036 | -0.1 | -0.049 | NO |
| 28 | PGR | PGR | PGR | 14693 | -0.12 | -0.054 | NO |
| 29 | PRKACB | PRKACB | PRKACB | 15897 | -0.18 | -0.073 | NO |
| 30 | PRKAR2A | PRKAR2A | PRKAR2A | 15937 | -0.19 | -0.026 | NO |
| 31 | GNGT1 | GNGT1 | GNGT1 | 16287 | -0.21 | 0.0099 | NO |
| 32 | RPS6KA1 | RPS6KA1 | RPS6KA1 | 16864 | -0.27 | 0.049 | NO |
Figure S41. Get High-res Image This plot shows mRNAseq_cNMF expression data heatmap (on the left) a RunningEnrichmentScore(RES) plot (on the top right) and a Signal2Noise(S2N) plot (on the bottom right) of genes in the pathway: BIOCARTA G1 PATHWAY.
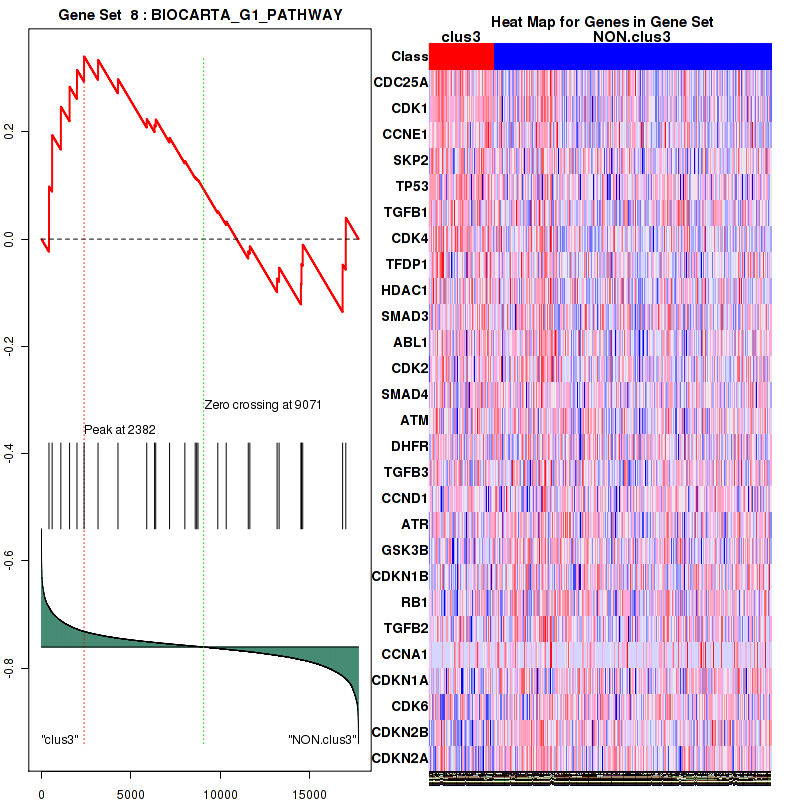
Figure S42. Get High-res Image For the top 5 core enriched genes in the pathway: BIOCARTA G1 PATHWAY, this volcano plot shows how much they are up/down-regulated and significant. The significance was calculated by empirical bayesian fit
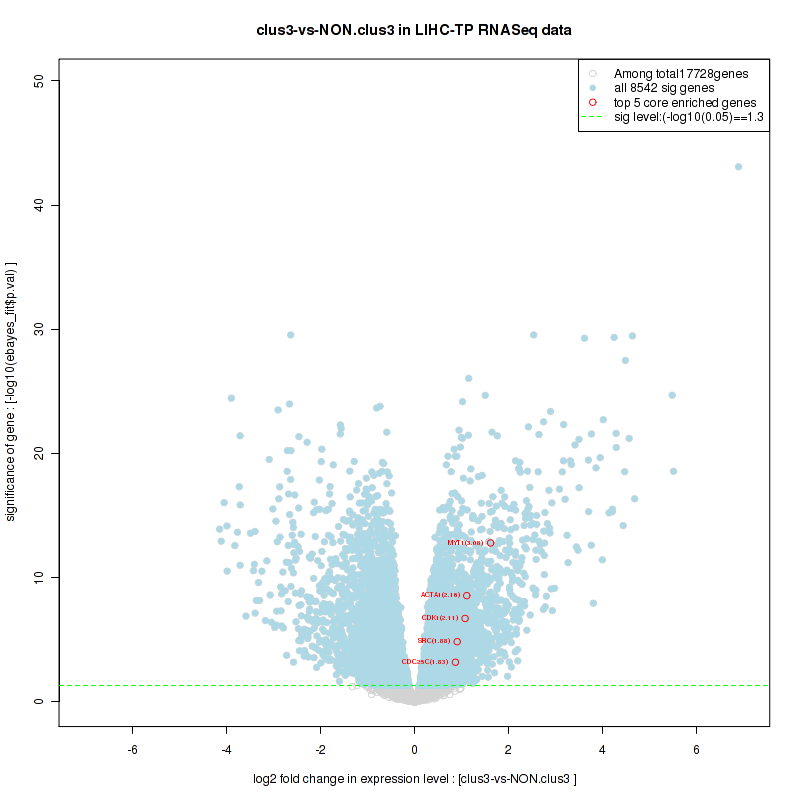
Table S22. Get Full Table This table shows a Running Enrichment Score (RES) of each gene in this pathway, that is, the enrichment score at this point in the ranked list of genes. All genes are ranked by Signal-to-Noise (S2N), a measure of similarity as default and are used to obtain ES matrix of all genes. In this way, GSEA tool uses expression pattern of not only overlapped genes but also not-overlapped genes to produce ES matrix.
| Rank | GENE | SYMBOL | DESC | LIST.LOC | S2N | RES | CORE_ENRICHMENT |
|---|---|---|---|---|---|---|---|
| 1 | RPL21 | RPL21 | RPL21 | 1135 | 0.24 | -0.036 | YES |
| 2 | RPL22L1 | RPL22L1 | RPL22L1 | 1349 | 0.21 | -0.023 | YES |
| 3 | RPL36A | RPL36A | RPL36A | 1551 | 0.2 | -0.011 | YES |
| 4 | RPL9 | RPL9 | RPL9 | 1974 | 0.17 | -0.015 | YES |
| 5 | RPS24 | RPS24 | RPS24 | 1994 | 0.16 | 0.0036 | YES |
| 6 | RPSA | RPSA | RPSA | 2282 | 0.15 | 0.005 | YES |
| 7 | RPS19 | RPS19 | RPS19 | 2307 | 0.15 | 0.021 | YES |
| 8 | RPLP0 | RPLP0 | RPLP0 | 2528 | 0.14 | 0.025 | YES |
| 9 | RPS21 | RPS21 | RPS21 | 2641 | 0.13 | 0.034 | YES |
| 10 | RPS10 | RPS10 | RPS10 | 2678 | 0.13 | 0.048 | YES |
| 11 | RPS18 | RPS18 | RPS18 | 2743 | 0.13 | 0.059 | YES |
| 12 | RPS12 | RPS12 | RPS12 | 2750 | 0.13 | 0.074 | YES |
| 13 | RPS3 | RPS3 | RPS3 | 2784 | 0.13 | 0.087 | YES |
| 14 | RPL27A | RPL27A | RPL27A | 2805 | 0.12 | 0.1 | YES |
| 15 | RPS7 | RPS7 | RPS7 | 2834 | 0.12 | 0.11 | YES |
| 16 | RPL18A | RPL18A | RPL18A | 2870 | 0.12 | 0.13 | YES |
| 17 | RPS17 | RPS17 | RPS17 | 2892 | 0.12 | 0.14 | YES |
| 18 | RPL39 | RPL39 | RPL39 | 2918 | 0.12 | 0.15 | YES |
| 19 | RPS27 | RPS27 | RPS27 | 2921 | 0.12 | 0.17 | YES |
| 20 | RPL26 | RPL26 | RPL26 | 2930 | 0.12 | 0.18 | YES |
| 21 | RPS15 | RPS15 | RPS15 | 2940 | 0.12 | 0.2 | YES |
| 22 | RPS27A | RPS27A | RPS27A | 2953 | 0.12 | 0.21 | YES |
| 23 | RPS5 | RPS5 | RPS5 | 2973 | 0.12 | 0.22 | YES |
| 24 | RPL7 | RPL7 | RPL7 | 3006 | 0.12 | 0.23 | YES |
| 25 | RPL23A | RPL23A | RPL23A | 3022 | 0.12 | 0.25 | YES |
| 26 | RPL28 | RPL28 | RPL28 | 3061 | 0.12 | 0.26 | YES |
| 27 | RPS29 | RPS29 | RPS29 | 3211 | 0.11 | 0.26 | YES |
| 28 | RPL7A | RPL7A | RPL7A | 3227 | 0.11 | 0.28 | YES |
| 29 | RPL36 | RPL36 | RPL36 | 3262 | 0.11 | 0.29 | YES |
| 30 | RPS4X | RPS4X | RPS4X | 3271 | 0.11 | 0.3 | YES |
| 31 | RPL37A | RPL37A | RPL37A | 3309 | 0.11 | 0.31 | YES |
| 32 | RPL17 | RPL17 | RPL17 | 3321 | 0.11 | 0.32 | YES |
| 33 | RPL31 | RPL31 | RPL31 | 3380 | 0.11 | 0.33 | YES |
| 34 | RPL32 | RPL32 | RPL32 | 3385 | 0.1 | 0.34 | YES |
| 35 | RPL3 | RPL3 | RPL3 | 3446 | 0.1 | 0.35 | YES |
| 36 | RPL6 | RPL6 | RPL6 | 3450 | 0.1 | 0.36 | YES |
| 37 | RPLP2 | RPLP2 | RPLP2 | 3457 | 0.1 | 0.38 | YES |
| 38 | RPL13A | RPL13A | RPL13A | 3476 | 0.1 | 0.39 | YES |
| 39 | RPL27 | RPL27 | RPL27 | 3605 | 0.098 | 0.39 | YES |
| 40 | RPL14 | RPL14 | RPL14 | 3661 | 0.097 | 0.4 | YES |
| 41 | RPL38 | RPL38 | RPL38 | 3691 | 0.096 | 0.41 | YES |
| 42 | RPL10A | RPL10A | RPL10A | 3695 | 0.096 | 0.42 | YES |
| 43 | RPS16 | RPS16 | RPS16 | 3777 | 0.094 | 0.43 | YES |
| 44 | RPL4 | RPL4 | RPL4 | 3786 | 0.094 | 0.44 | YES |
| 45 | RPL35A | RPL35A | RPL35A | 3794 | 0.093 | 0.45 | YES |
| 46 | RPS11 | RPS11 | RPS11 | 3810 | 0.093 | 0.46 | YES |
| 47 | RPS28 | RPS28 | RPS28 | 4052 | 0.087 | 0.46 | YES |
| 48 | RPL35 | RPL35 | RPL35 | 4059 | 0.086 | 0.47 | YES |
| 49 | RPS6 | RPS6 | RPS6 | 4095 | 0.086 | 0.48 | YES |
| 50 | RPL8 | RPL8 | RPL8 | 4118 | 0.085 | 0.48 | YES |
| 51 | RPL23 | RPL23 | RPL23 | 4192 | 0.083 | 0.49 | YES |
| 52 | RPS25 | RPS25 | RPS25 | 4209 | 0.083 | 0.5 | YES |
| 53 | RPS9 | RPS9 | RPS9 | 4287 | 0.081 | 0.5 | YES |
| 54 | RPL37 | RPL37 | RPL37 | 4309 | 0.08 | 0.51 | YES |
| 55 | RPS2 | RPS2 | RPS2 | 4358 | 0.079 | 0.52 | YES |
| 56 | RPL41 | RPL41 | RPL41 | 4375 | 0.079 | 0.53 | YES |
| 57 | RPS23 | RPS23 | RPS23 | 4376 | 0.079 | 0.54 | YES |
| 58 | RPL30 | RPL30 | RPL30 | 4396 | 0.078 | 0.55 | YES |
| 59 | RPS13 | RPS13 | RPS13 | 4480 | 0.076 | 0.55 | YES |
| 60 | RPL24 | RPL24 | RPL24 | 4503 | 0.076 | 0.56 | YES |
| 61 | RPL29 | RPL29 | RPL29 | 4526 | 0.075 | 0.57 | YES |
| 62 | RPL12 | RPL12 | RPL12 | 4528 | 0.075 | 0.57 | YES |
| 63 | RPLP1 | RPLP1 | RPLP1 | 4804 | 0.07 | 0.57 | NO |
| 64 | RPL15 | RPL15 | RPL15 | 4832 | 0.069 | 0.57 | NO |
| 65 | RPS20 | RPS20 | RPS20 | 5006 | 0.066 | 0.57 | NO |
| 66 | RPL10 | RPL10 | RPL10 | 5269 | 0.06 | 0.56 | NO |
| 67 | RPS3A | RPS3A | RPS3A | 5281 | 0.06 | 0.57 | NO |
| 68 | RPL5 | RPL5 | RPL5 | 5438 | 0.058 | 0.57 | NO |
| 69 | UBA52 | UBA52 | UBA52 | 5468 | 0.057 | 0.57 | NO |
| 70 | RPL19 | RPL19 | RPL19 | 5826 | 0.05 | 0.56 | NO |
| 71 | RPL34 | RPL34 | RPL34 | 5869 | 0.05 | 0.56 | NO |
| 72 | RPS8 | RPS8 | RPS8 | 6048 | 0.046 | 0.56 | NO |
| 73 | RSL24D1 | RSL24D1 | RSL24D1 | 6068 | 0.046 | 0.56 | NO |
| 74 | RPL13 | RPL13 | RPL13 | 6101 | 0.045 | 0.57 | NO |
| 75 | RPS15A | RPS15A | RPS15A | 6400 | 0.041 | 0.56 | NO |
| 76 | RPS26 | RPS26 | RPS26 | 6757 | 0.035 | 0.54 | NO |
| 77 | FAU | FAU | FAU | 6788 | 0.034 | 0.54 | NO |
| 78 | RPL11 | RPL11 | RPL11 | 7181 | 0.028 | 0.52 | NO |
| 79 | RPL22 | RPL22 | RPL22 | 7420 | 0.025 | 0.51 | NO |
| 80 | MRPL13 | MRPL13 | MRPL13 | 7818 | 0.019 | 0.49 | NO |
| 81 | RPL36AL | RPL36AL | RPL36AL | 8160 | 0.013 | 0.47 | NO |
| 82 | RPS27L | RPS27L | RPS27L | 9733 | -0.011 | 0.39 | NO |
| 83 | RPL26L1 | RPL26L1 | RPL26L1 | 13955 | -0.098 | 0.16 | NO |
| 84 | RPL10L | RPL10L | RPL10L | 16136 | -0.2 | 0.059 | NO |
| 85 | RPS4Y1 | RPS4Y1 | RPS4Y1 | 16812 | -0.26 | 0.052 | NO |
Figure S43. Get High-res Image This plot shows mRNAseq_cNMF expression data heatmap (on the left) a RunningEnrichmentScore(RES) plot (on the top right) and a Signal2Noise(S2N) plot (on the bottom right) of genes in the pathway: BIOCARTA MPR PATHWAY.
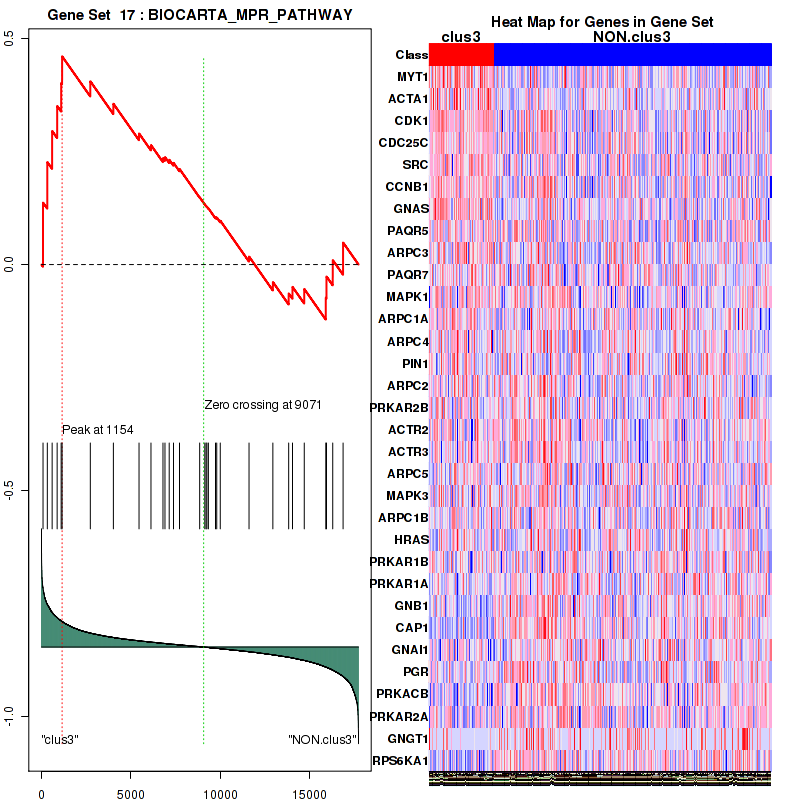
Figure S44. Get High-res Image For the top 5 core enriched genes in the pathway: BIOCARTA MPR PATHWAY, this volcano plot shows how much they are up/down-regulated and significant. The significance was calculated by empirical bayesian fit
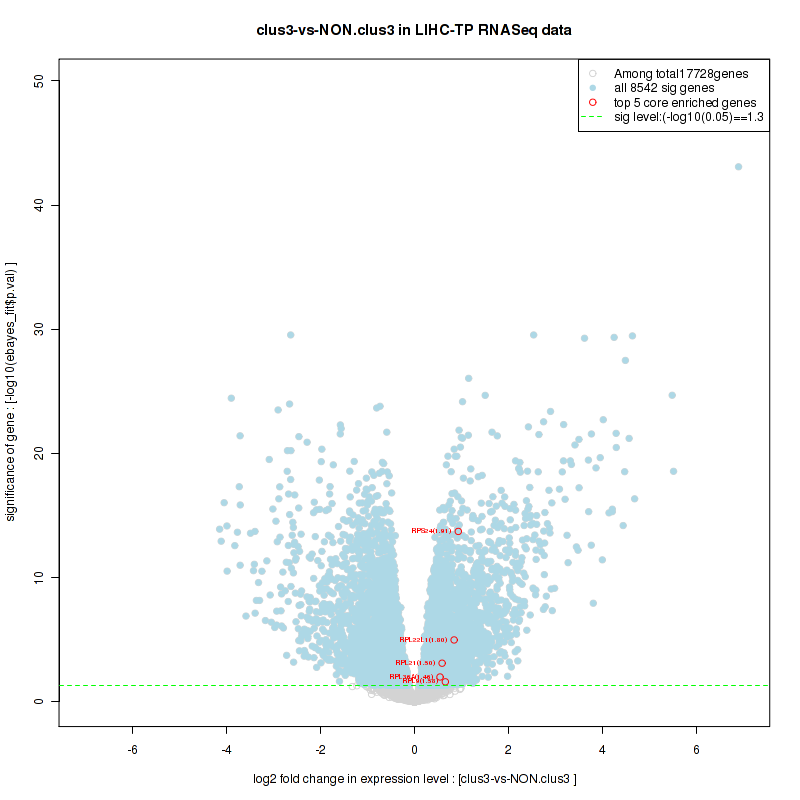
Table S23. Get Full Table This table shows a Running Enrichment Score (RES) of each gene in this pathway, that is, the enrichment score at this point in the ranked list of genes. All genes are ranked by Signal-to-Noise (S2N), a measure of similarity as default and are used to obtain ES matrix of all genes. In this way, GSEA tool uses expression pattern of not only overlapped genes but also not-overlapped genes to produce ES matrix.
| Rank | GENE | SYMBOL | DESC | LIST.LOC | S2N | RES | CORE_ENRICHMENT |
|---|---|---|---|---|---|---|---|
| 1 | TUBB8 | TUBB8 | TUBB8 | 262 | 0.42 | 0.058 | YES |
| 2 | TUBB4Q | TUBB4Q | TUBB4Q | 320 | 0.39 | 0.12 | YES |
| 3 | TUBB1 | TUBB1 | TUBB1 | 342 | 0.39 | 0.19 | YES |
| 4 | NCK2 | NCK2 | NCK2 | 382 | 0.38 | 0.25 | YES |
| 5 | TUBA8 | TUBA8 | TUBA8 | 456 | 0.35 | 0.31 | YES |
| 6 | TLR5 | TLR5 | TLR5 | 725 | 0.29 | 0.35 | YES |
| 7 | ARHGEF2 | ARHGEF2 | ARHGEF2 | 849 | 0.27 | 0.39 | YES |
| 8 | CLDN1 | CLDN1 | CLDN1 | 2273 | 0.15 | 0.34 | NO |
| 9 | TUBB4 | TUBB4 | TUBB4 | 2712 | 0.13 | 0.33 | NO |
| 10 | CDH1 | CDH1 | CDH1 | 3126 | 0.11 | 0.33 | NO |
| 11 | ARPC5L | ARPC5L | ARPC5L | 4304 | 0.08 | 0.28 | NO |
| 12 | TUBB3 | TUBB3 | TUBB3 | 4419 | 0.078 | 0.28 | NO |
| 13 | OCLN | OCLN | OCLN | 5235 | 0.061 | 0.25 | NO |
| 14 | ARPC3 | ARPC3 | ARPC3 | 5455 | 0.057 | 0.25 | NO |
| 15 | YWHAZ | YWHAZ | YWHAZ | 5548 | 0.055 | 0.25 | NO |
| 16 | YWHAQ | YWHAQ | YWHAQ | 5609 | 0.054 | 0.26 | NO |
| 17 | ABL1 | ABL1 | ABL1 | 6388 | 0.041 | 0.22 | NO |
| 18 | TUBB | TUBB | TUBB | 6428 | 0.04 | 0.22 | NO |
| 19 | ACTG1 | ACTG1 | ACTG1 | 6558 | 0.038 | 0.22 | NO |
| 20 | NCL | NCL | NCL | 6639 | 0.037 | 0.23 | NO |
| 21 | ARPC1A | ARPC1A | ARPC1A | 6907 | 0.032 | 0.22 | NO |
| 22 | TUBA1B | TUBA1B | TUBA1B | 6920 | 0.032 | 0.22 | NO |
| 23 | TUBB6 | TUBB6 | TUBB6 | 7047 | 0.03 | 0.22 | NO |
| 24 | ARPC4 | ARPC4 | ARPC4 | 7143 | 0.028 | 0.22 | NO |
| 25 | ARPC2 | ARPC2 | ARPC2 | 7719 | 0.02 | 0.19 | NO |
| 26 | KRT18 | KRT18 | KRT18 | 8199 | 0.013 | 0.17 | NO |
| 27 | TUBB2A | TUBB2A | TUBB2A | 8226 | 0.012 | 0.17 | NO |
| 28 | TUBB2C | TUBB2C | TUBB2C | 8254 | 0.012 | 0.17 | NO |
| 29 | ITGB1 | ITGB1 | ITGB1 | 8319 | 0.011 | 0.16 | NO |
| 30 | TUBA1C | TUBA1C | TUBA1C | 8513 | 0.0084 | 0.16 | NO |
| 31 | EZR | EZR | EZR | 8549 | 0.008 | 0.16 | NO |
| 32 | TUBA1A | TUBA1A | TUBA1A | 9007 | 0.0013 | 0.13 | NO |
| 33 | TUBB2B | TUBB2B | TUBB2B | 9045 | 0.00053 | 0.13 | NO |
| 34 | ARPC5 | ARPC5 | ARPC5 | 9251 | -0.0029 | 0.12 | NO |
| 35 | ARPC1B | ARPC1B | ARPC1B | 9731 | -0.011 | 0.091 | NO |
| 36 | CTTN | CTTN | CTTN | 9781 | -0.012 | 0.09 | NO |
| 37 | CTNNB1 | CTNNB1 | CTNNB1 | 9917 | -0.014 | 0.085 | NO |
| 38 | PRKCA | PRKCA | PRKCA | 10055 | -0.016 | 0.08 | NO |
| 39 | ACTB | ACTB | ACTB | 10249 | -0.02 | 0.073 | NO |
| 40 | WASL | WASL | WASL | 10408 | -0.022 | 0.068 | NO |
| 41 | ROCK1 | ROCK1 | ROCK1 | 11098 | -0.034 | 0.035 | NO |
| 42 | RHOA | RHOA | RHOA | 11212 | -0.036 | 0.035 | NO |
| 43 | TUBA4A | TUBA4A | TUBA4A | 11915 | -0.049 | 0.0035 | NO |
| 44 | WAS | WAS | WAS | 12319 | -0.058 | -0.0092 | NO |
| 45 | HCLS1 | HCLS1 | HCLS1 | 12397 | -0.059 | -0.0032 | NO |
| 46 | TUBA3E | TUBA3E | TUBA3E | 12440 | -0.06 | 0.005 | NO |
| 47 | TUBA3D | TUBA3D | TUBA3D | 12747 | -0.067 | -0.00053 | NO |
| 48 | CDC42 | CDC42 | CDC42 | 12940 | -0.071 | 0.0011 | NO |
| 49 | ROCK2 | ROCK2 | ROCK2 | 13246 | -0.079 | -0.0024 | NO |
| 50 | NCK1 | NCK1 | NCK1 | 13809 | -0.093 | -0.018 | NO |
| 51 | FYN | FYN | FYN | 15153 | -0.14 | -0.069 | NO |
| 52 | CD14 | CD14 | CD14 | 15680 | -0.17 | -0.069 | NO |
| 53 | TUBAL3 | TUBAL3 | TUBAL3 | 15882 | -0.18 | -0.048 | NO |
| 54 | TLR4 | TLR4 | TLR4 | 16615 | -0.24 | -0.047 | NO |
| 55 | TUBA3C | TUBA3C | TUBA3C | 17016 | -0.29 | -0.018 | NO |
| 56 | LY96 | LY96 | LY96 | 17249 | -0.33 | 0.027 | NO |
Figure S45. Get High-res Image This plot shows mRNAseq_cNMF expression data heatmap (on the left) a RunningEnrichmentScore(RES) plot (on the top right) and a Signal2Noise(S2N) plot (on the bottom right) of genes in the pathway: BIOCARTA INTEGRIN PATHWAY.
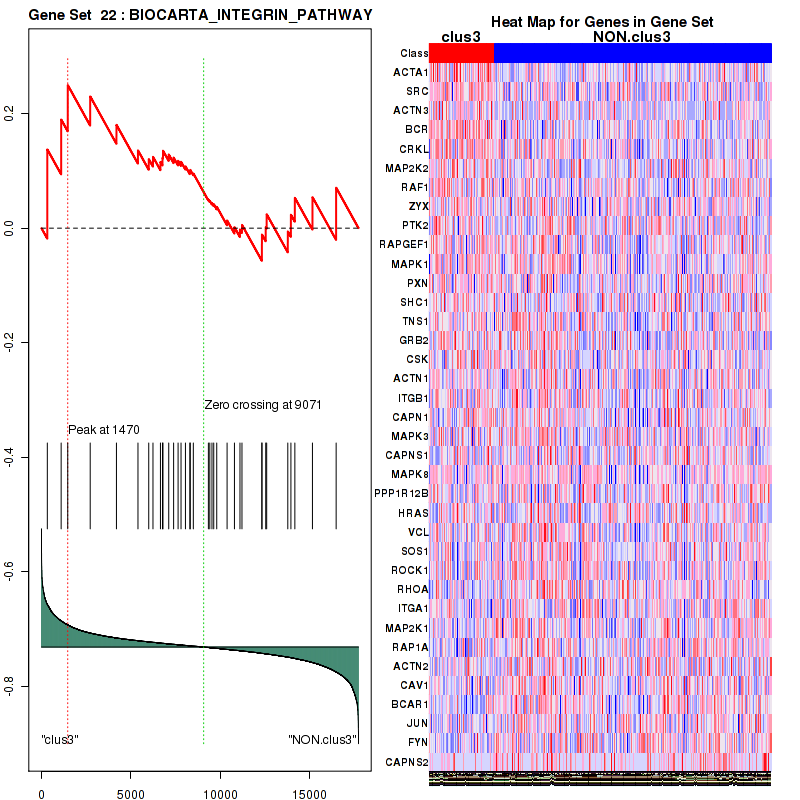
Figure S46. Get High-res Image For the top 5 core enriched genes in the pathway: BIOCARTA INTEGRIN PATHWAY, this volcano plot shows how much they are up/down-regulated and significant. The significance was calculated by empirical bayesian fit
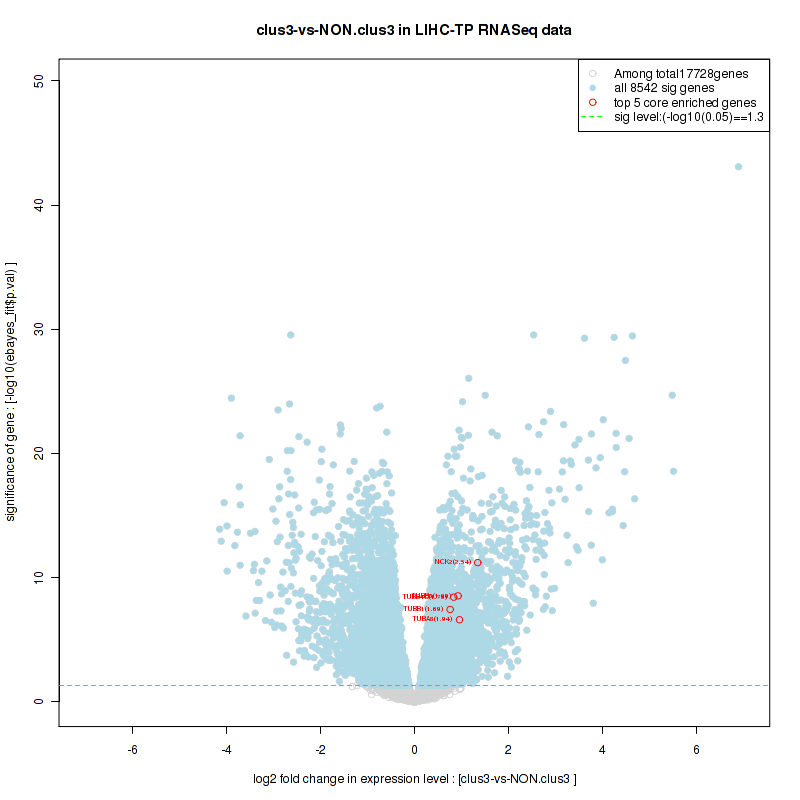
Table S24. Get Full Table This table shows a Running Enrichment Score (RES) of each gene in this pathway, that is, the enrichment score at this point in the ranked list of genes. All genes are ranked by Signal-to-Noise (S2N), a measure of similarity as default and are used to obtain ES matrix of all genes. In this way, GSEA tool uses expression pattern of not only overlapped genes but also not-overlapped genes to produce ES matrix.
| Rank | GENE | SYMBOL | DESC | LIST.LOC | S2N | RES | CORE_ENRICHMENT |
|---|---|---|---|---|---|---|---|
| 1 | POLE2 | POLE2 | POLE2 | 596 | 0.32 | 0.071 | YES |
| 2 | DNA2 | DNA2 | DNA2 | 784 | 0.28 | 0.15 | YES |
| 3 | LIG1 | LIG1 | LIG1 | 2090 | 0.16 | 0.13 | YES |
| 4 | RFC4 | RFC4 | RFC4 | 2741 | 0.13 | 0.14 | YES |
| 5 | MCM2 | MCM2 | MCM2 | 2863 | 0.12 | 0.17 | YES |
| 6 | PRIM2 | PRIM2 | PRIM2 | 3103 | 0.12 | 0.2 | YES |
| 7 | POLD1 | POLD1 | POLD1 | 3129 | 0.11 | 0.23 | YES |
| 8 | PRIM1 | PRIM1 | PRIM1 | 3192 | 0.11 | 0.27 | YES |
| 9 | FEN1 | FEN1 | FEN1 | 3393 | 0.1 | 0.29 | YES |
| 10 | MCM5 | MCM5 | MCM5 | 3481 | 0.1 | 0.32 | YES |
| 11 | MCM4 | MCM4 | MCM4 | 3628 | 0.098 | 0.34 | YES |
| 12 | RNASEH2C | RNASEH2C | RNASEH2C | 3705 | 0.096 | 0.37 | YES |
| 13 | MCM3 | MCM3 | MCM3 | 3747 | 0.095 | 0.4 | YES |
| 14 | RNASEH2B | RNASEH2B | RNASEH2B | 4322 | 0.08 | 0.39 | YES |
| 15 | MCM6 | MCM6 | MCM6 | 4339 | 0.08 | 0.42 | YES |
| 16 | MCM7 | MCM7 | MCM7 | 4539 | 0.075 | 0.43 | YES |
| 17 | POLD3 | POLD3 | POLD3 | 4817 | 0.069 | 0.44 | YES |
| 18 | RNASEH2A | RNASEH2A | RNASEH2A | 4820 | 0.069 | 0.46 | YES |
| 19 | RFC2 | RFC2 | RFC2 | 4829 | 0.069 | 0.48 | YES |
| 20 | RFC5 | RFC5 | RFC5 | 4913 | 0.067 | 0.5 | YES |
| 21 | RFC1 | RFC1 | RFC1 | 5016 | 0.065 | 0.52 | YES |
| 22 | RPA1 | RPA1 | RPA1 | 5719 | 0.052 | 0.5 | NO |
| 23 | POLA2 | POLA2 | POLA2 | 6402 | 0.041 | 0.47 | NO |
| 24 | POLE | POLE | POLE | 6597 | 0.038 | 0.47 | NO |
| 25 | RFC3 | RFC3 | RFC3 | 7222 | 0.027 | 0.44 | NO |
| 26 | PCNA | PCNA | PCNA | 8450 | 0.0091 | 0.38 | NO |
| 27 | SSBP1 | SSBP1 | SSBP1 | 8517 | 0.0084 | 0.38 | NO |
| 28 | POLE3 | POLE3 | POLE3 | 8970 | 0.0018 | 0.35 | NO |
| 29 | RNASEH1 | RNASEH1 | RNASEH1 | 9847 | -0.013 | 0.31 | NO |
| 30 | POLD2 | POLD2 | POLD2 | 10622 | -0.026 | 0.27 | NO |
| 31 | POLD4 | POLD4 | POLD4 | 12254 | -0.056 | 0.2 | NO |
| 32 | RPA3 | RPA3 | RPA3 | 13092 | -0.074 | 0.18 | NO |
| 33 | RPA2 | RPA2 | RPA2 | 13282 | -0.08 | 0.19 | NO |
| 34 | RPA4 | RPA4 | RPA4 | 13563 | -0.086 | 0.2 | NO |
| 35 | POLE4 | POLE4 | POLE4 | 13834 | -0.094 | 0.22 | NO |
Figure S47. Get High-res Image This plot shows mRNAseq_cNMF expression data heatmap (on the left) a RunningEnrichmentScore(RES) plot (on the top right) and a Signal2Noise(S2N) plot (on the bottom right) of genes in the pathway: BIOCARTA WNT PATHWAY.
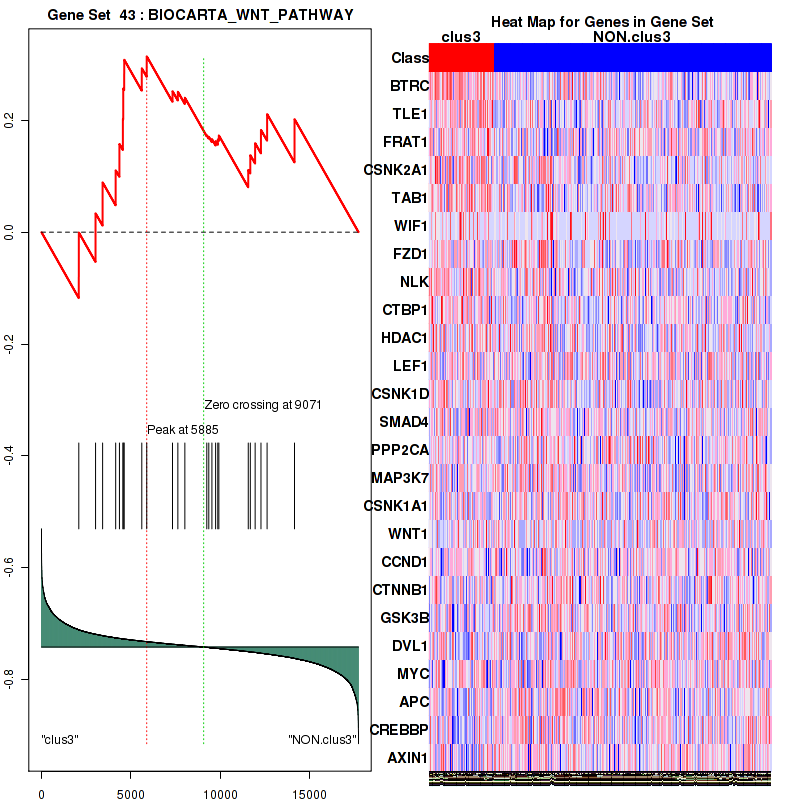
Figure S48. Get High-res Image For the top 5 core enriched genes in the pathway: BIOCARTA WNT PATHWAY, this volcano plot shows how much they are up/down-regulated and significant. The significance was calculated by empirical bayesian fit

Table S25. Get Full Table This table shows a Running Enrichment Score (RES) of each gene in this pathway, that is, the enrichment score at this point in the ranked list of genes. All genes are ranked by Signal-to-Noise (S2N), a measure of similarity as default and are used to obtain ES matrix of all genes. In this way, GSEA tool uses expression pattern of not only overlapped genes but also not-overlapped genes to produce ES matrix.
| Rank | GENE | SYMBOL | DESC | LIST.LOC | S2N | RES | CORE_ENRICHMENT |
|---|---|---|---|---|---|---|---|
| 1 | ATP1B2 | ATP1B2 | ATP1B2 | 34 | 0.63 | 0.086 | YES |
| 2 | TNNT2 | TNNT2 | TNNT2 | 51 | 0.6 | 0.17 | YES |
| 3 | CACNA2D2 | CACNA2D2 | CACNA2D2 | 59 | 0.57 | 0.25 | YES |
| 4 | FXYD2 | FXYD2 | FXYD2 | 91 | 0.54 | 0.32 | YES |
| 5 | TNNC1 | TNNC1 | TNNC1 | 190 | 0.45 | 0.38 | YES |
| 6 | CACNG4 | CACNG4 | CACNG4 | 304 | 0.4 | 0.43 | YES |
| 7 | CACNA1D | CACNA1D | CACNA1D | 576 | 0.32 | 0.46 | YES |
| 8 | TNNI3 | TNNI3 | TNNI3 | 1488 | 0.2 | 0.43 | NO |
| 9 | CACNB3 | CACNB3 | CACNB3 | 2040 | 0.16 | 0.42 | NO |
| 10 | CACNA1F | CACNA1F | CACNA1F | 2285 | 0.15 | 0.43 | NO |
| 11 | CACNB2 | CACNB2 | CACNB2 | 2580 | 0.13 | 0.43 | NO |
| 12 | CACNG1 | CACNG1 | CACNG1 | 2684 | 0.13 | 0.44 | NO |
| 13 | CACNB1 | CACNB1 | CACNB1 | 3374 | 0.11 | 0.42 | NO |
| 14 | MYL3 | MYL3 | MYL3 | 3965 | 0.089 | 0.4 | NO |
| 15 | CACNB4 | CACNB4 | CACNB4 | 4166 | 0.084 | 0.4 | NO |
| 16 | TPM4 | TPM4 | TPM4 | 4359 | 0.079 | 0.4 | NO |
| 17 | COX6B1 | COX6B1 | COX6B1 | 5334 | 0.059 | 0.35 | NO |
| 18 | ATP1B1 | ATP1B1 | ATP1B1 | 5833 | 0.05 | 0.33 | NO |
| 19 | COX7A2L | COX7A2L | COX7A2L | 5839 | 0.05 | 0.34 | NO |
| 20 | TPM3 | TPM3 | TPM3 | 5988 | 0.047 | 0.34 | NO |
| 21 | ATP1A1 | ATP1A1 | ATP1A1 | 6216 | 0.044 | 0.33 | NO |
| 22 | COX4I2 | COX4I2 | COX4I2 | 6493 | 0.039 | 0.32 | NO |
| 23 | TPM1 | TPM1 | TPM1 | 6541 | 0.039 | 0.32 | NO |
| 24 | TPM2 | TPM2 | TPM2 | 6631 | 0.037 | 0.32 | NO |
| 25 | CACNA1C | CACNA1C | CACNA1C | 7509 | 0.023 | 0.28 | NO |
| 26 | UQCR11 | UQCR11 | UQCR11 | 7869 | 0.018 | 0.26 | NO |
| 27 | COX5A | COX5A | COX5A | 7875 | 0.018 | 0.26 | NO |
| 28 | UQCRB | UQCRB | UQCRB | 7940 | 0.017 | 0.26 | NO |
| 29 | UQCRFS1 | UQCRFS1 | UQCRFS1 | 8098 | 0.014 | 0.25 | NO |
| 30 | UQCR10 | UQCR10 | UQCR10 | 8483 | 0.0087 | 0.23 | NO |
| 31 | ATP2A2 | ATP2A2 | ATP2A2 | 8528 | 0.0082 | 0.23 | NO |
| 32 | COX5B | COX5B | COX5B | 8929 | 0.0024 | 0.21 | NO |
| 33 | ATP1A4 | ATP1A4 | ATP1A4 | 9038 | 0.00061 | 0.2 | NO |
| 34 | COX8A | COX8A | COX8A | 9075 | -0.000091 | 0.2 | NO |
| 35 | COX6A1 | COX6A1 | COX6A1 | 9379 | -0.0052 | 0.18 | NO |
| 36 | COX6C | COX6C | COX6C | 9385 | -0.0053 | 0.18 | NO |
| 37 | UQCRHL | UQCRHL | UQCRHL | 9512 | -0.0072 | 0.18 | NO |
| 38 | COX7A2 | COX7A2 | COX7A2 | 9667 | -0.0096 | 0.17 | NO |
| 39 | CYC1 | CYC1 | CYC1 | 9949 | -0.014 | 0.16 | NO |
| 40 | COX7C | COX7C | COX7C | 10084 | -0.017 | 0.15 | NO |
| 41 | CACNA1S | CACNA1S | CACNA1S | 10107 | -0.017 | 0.15 | NO |
| 42 | UQCRH | UQCRH | UQCRH | 10331 | -0.021 | 0.14 | NO |
| 43 | COX7A1 | COX7A1 | COX7A1 | 10986 | -0.032 | 0.11 | NO |
| 44 | CACNA2D4 | CACNA2D4 | CACNA2D4 | 11070 | -0.033 | 0.11 | NO |
| 45 | COX7B | COX7B | COX7B | 11567 | -0.042 | 0.087 | NO |
| 46 | RYR2 | RYR2 | RYR2 | 11872 | -0.048 | 0.077 | NO |
| 47 | CACNA2D3 | CACNA2D3 | CACNA2D3 | 12022 | -0.051 | 0.075 | NO |
| 48 | CACNA2D1 | CACNA2D1 | CACNA2D1 | 12336 | -0.058 | 0.066 | NO |
| 49 | ATP1B3 | ATP1B3 | ATP1B3 | 12369 | -0.059 | 0.072 | NO |
| 50 | COX4I1 | COX4I1 | COX4I1 | 12512 | -0.062 | 0.072 | NO |
| 51 | SLC9A1 | SLC9A1 | SLC9A1 | 12665 | -0.065 | 0.073 | NO |
| 52 | COX6B2 | COX6B2 | COX6B2 | 12749 | -0.067 | 0.078 | NO |
| 53 | ATP1A2 | ATP1A2 | ATP1A2 | 12914 | -0.07 | 0.078 | NO |
| 54 | UQCRC1 | UQCRC1 | UQCRC1 | 13121 | -0.075 | 0.077 | NO |
| 55 | ATP1A3 | ATP1A3 | ATP1A3 | 13272 | -0.079 | 0.079 | NO |
| 56 | UQCRQ | UQCRQ | UQCRQ | 14472 | -0.12 | 0.028 | NO |
| 57 | ACTC1 | ACTC1 | ACTC1 | 14559 | -0.12 | 0.039 | NO |
| 58 | SLC9A6 | SLC9A6 | SLC9A6 | 14882 | -0.13 | 0.039 | NO |
| 59 | SLC8A1 | SLC8A1 | SLC8A1 | 16520 | -0.23 | -0.021 | NO |
| 60 | COX6A2 | COX6A2 | COX6A2 | 16863 | -0.27 | -0.0031 | NO |
| 61 | COX7B2 | COX7B2 | COX7B2 | 17385 | -0.37 | 0.019 | NO |
Figure S49. Get High-res Image This plot shows mRNAseq_cNMF expression data heatmap (on the left) a RunningEnrichmentScore(RES) plot (on the top right) and a Signal2Noise(S2N) plot (on the bottom right) of genes in the pathway: KEGG INOSITOL PHOSPHATE METABOLISM.
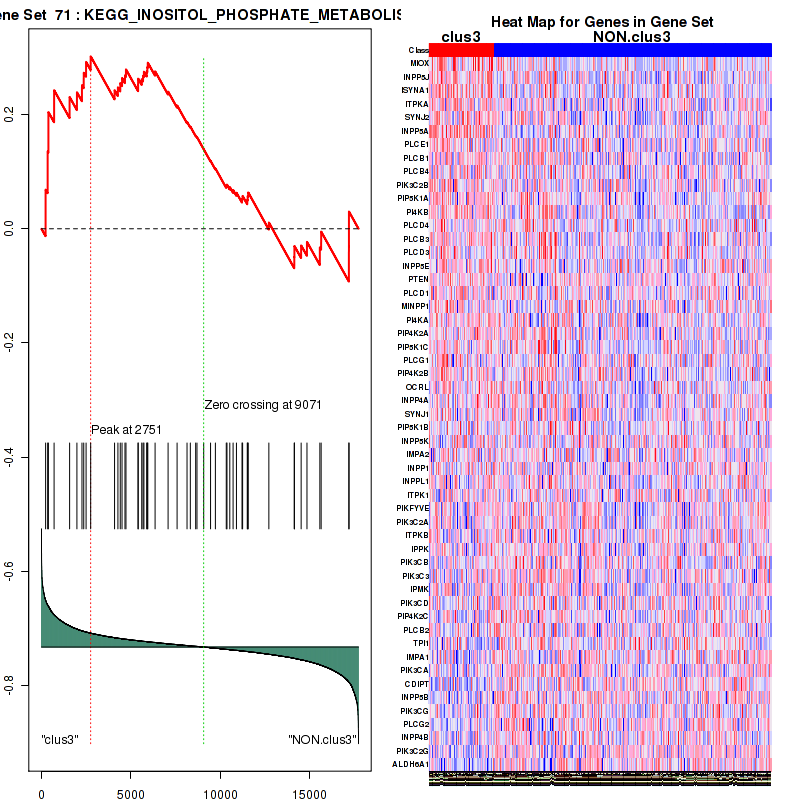
Figure S50. Get High-res Image For the top 5 core enriched genes in the pathway: KEGG INOSITOL PHOSPHATE METABOLISM, this volcano plot shows how much they are up/down-regulated and significant. The significance was calculated by empirical bayesian fit
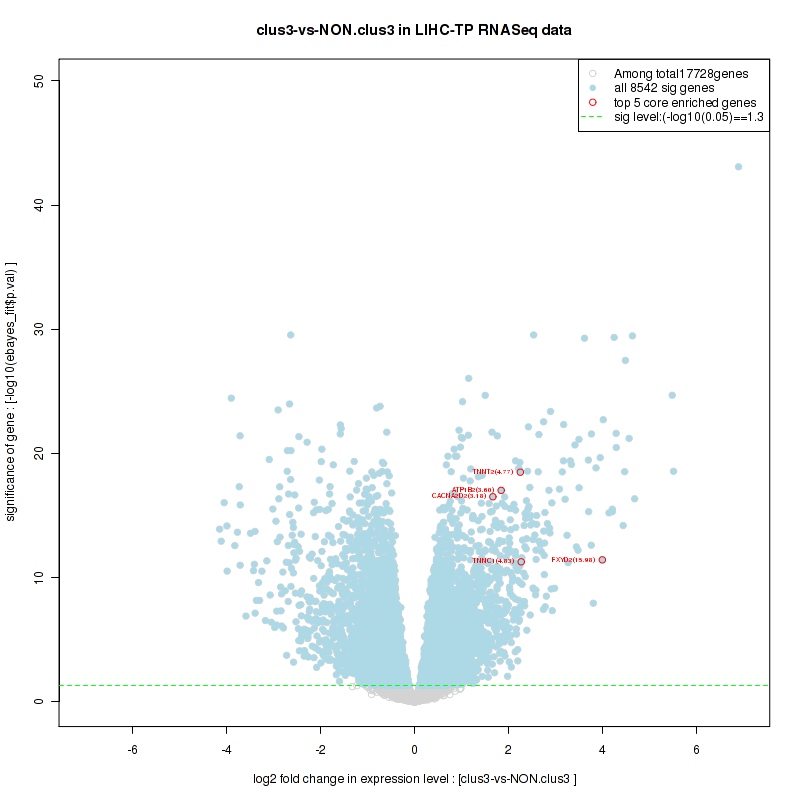
Table S26. Get Full Table This table shows a Running Enrichment Score (RES) of each gene in this pathway, that is, the enrichment score at this point in the ranked list of genes. All genes are ranked by Signal-to-Noise (S2N), a measure of similarity as default and are used to obtain ES matrix of all genes. In this way, GSEA tool uses expression pattern of not only overlapped genes but also not-overlapped genes to produce ES matrix.
| Rank | GENE | SYMBOL | DESC | LIST.LOC | S2N | RES | CORE_ENRICHMENT |
|---|---|---|---|---|---|---|---|
| 1 | SNRPA1 | SNRPA1 | SNRPA1 | 2271 | 0.15 | -0.11 | YES |
| 2 | SNRPE | SNRPE | SNRPE | 2438 | 0.14 | -0.093 | YES |
| 3 | SF3A2 | SF3A2 | SF3A2 | 2510 | 0.14 | -0.075 | YES |
| 4 | THOC1 | THOC1 | THOC1 | 2687 | 0.13 | -0.065 | YES |
| 5 | SNRPD1 | SNRPD1 | SNRPD1 | 2749 | 0.13 | -0.048 | YES |
| 6 | HSPA1L | HSPA1L | HSPA1L | 2846 | 0.12 | -0.034 | YES |
| 7 | LSM7 | LSM7 | LSM7 | 2859 | 0.12 | -0.016 | YES |
| 8 | SNRPF | SNRPF | SNRPF | 3002 | 0.12 | -0.0051 | YES |
| 9 | LSM2 | LSM2 | LSM2 | 3379 | 0.11 | -0.0098 | YES |
| 10 | THOC4 | THOC4 | THOC4 | 3422 | 0.1 | 0.0042 | YES |
| 11 | SNRPB | SNRPB | SNRPB | 3539 | 0.1 | 0.013 | YES |
| 12 | SR140 | SR140 | SR140 | 3633 | 0.098 | 0.024 | YES |
| 13 | HNRNPA1 | HNRNPA1 | HNRNPA1 | 3667 | 0.097 | 0.037 | YES |
| 14 | TCERG1 | TCERG1 | TCERG1 | 3684 | 0.096 | 0.051 | YES |
| 15 | HNRNPA1L2 | HNRNPA1L2 | HNRNPA1L2 | 3697 | 0.096 | 0.066 | YES |
| 16 | USP39 | USP39 | USP39 | 3962 | 0.089 | 0.065 | YES |
| 17 | NHP2L1 | NHP2L1 | NHP2L1 | 4065 | 0.086 | 0.073 | YES |
| 18 | SNRPG | SNRPG | SNRPG | 4163 | 0.084 | 0.08 | YES |
| 19 | PRPF3 | PRPF3 | PRPF3 | 4417 | 0.078 | 0.078 | YES |
| 20 | U2AF1 | U2AF1 | U2AF1 | 4420 | 0.078 | 0.09 | YES |
| 21 | ACIN1 | ACIN1 | ACIN1 | 4454 | 0.077 | 0.1 | YES |
| 22 | RBM8A | RBM8A | RBM8A | 4458 | 0.077 | 0.11 | YES |
| 23 | PQBP1 | PQBP1 | PQBP1 | 4562 | 0.075 | 0.12 | YES |
| 24 | SNRPA | SNRPA | SNRPA | 4825 | 0.069 | 0.12 | YES |
| 25 | SNRNP70 | SNRNP70 | SNRNP70 | 4872 | 0.068 | 0.12 | YES |
| 26 | SNRPD3 | SNRPD3 | SNRPD3 | 4894 | 0.068 | 0.13 | YES |
| 27 | RBMX | RBMX | RBMX | 4898 | 0.068 | 0.14 | YES |
| 28 | SFRS9 | SFRS9 | SFRS9 | 4899 | 0.068 | 0.15 | YES |
| 29 | SF3B4 | SF3B4 | SF3B4 | 4907 | 0.067 | 0.16 | YES |
| 30 | HNRNPA3 | HNRNPA3 | HNRNPA3 | 5058 | 0.064 | 0.16 | YES |
| 31 | PHF5A | PHF5A | PHF5A | 5253 | 0.061 | 0.16 | YES |
| 32 | PRPF6 | PRPF6 | PRPF6 | 5256 | 0.061 | 0.17 | YES |
| 33 | SFRS3 | SFRS3 | SFRS3 | 5270 | 0.06 | 0.18 | YES |
| 34 | PPIL1 | PPIL1 | PPIL1 | 5274 | 0.06 | 0.19 | YES |
| 35 | RBM17 | RBM17 | RBM17 | 5336 | 0.059 | 0.2 | YES |
| 36 | SFRS6 | SFRS6 | SFRS6 | 5347 | 0.059 | 0.21 | YES |
| 37 | SNRPD2 | SNRPD2 | SNRPD2 | 5373 | 0.059 | 0.21 | YES |
| 38 | HNRNPU | HNRNPU | HNRNPU | 5472 | 0.057 | 0.22 | YES |
| 39 | MAGOHB | MAGOHB | MAGOHB | 5623 | 0.054 | 0.22 | YES |
| 40 | SFRS7 | SFRS7 | SFRS7 | 5701 | 0.052 | 0.22 | YES |
| 41 | CCDC12 | CCDC12 | CCDC12 | 5789 | 0.051 | 0.22 | YES |
| 42 | LSM4 | LSM4 | LSM4 | 5903 | 0.049 | 0.22 | YES |
| 43 | SNRPB2 | SNRPB2 | SNRPB2 | 5910 | 0.049 | 0.23 | YES |
| 44 | SMNDC1 | SMNDC1 | SMNDC1 | 6063 | 0.046 | 0.23 | YES |
| 45 | HSPA2 | HSPA2 | HSPA2 | 6065 | 0.046 | 0.24 | YES |
| 46 | RBM25 | RBM25 | RBM25 | 6147 | 0.045 | 0.24 | YES |
| 47 | U2AF2 | U2AF2 | U2AF2 | 6168 | 0.044 | 0.25 | YES |
| 48 | CRNKL1 | CRNKL1 | CRNKL1 | 6261 | 0.043 | 0.25 | YES |
| 49 | WBP11 | WBP11 | WBP11 | 6338 | 0.042 | 0.25 | YES |
| 50 | SNRPC | SNRPC | SNRPC | 6363 | 0.041 | 0.26 | YES |
| 51 | DDX42 | DDX42 | DDX42 | 6412 | 0.041 | 0.26 | YES |
| 52 | XAB2 | XAB2 | XAB2 | 6419 | 0.04 | 0.27 | YES |
| 53 | HNRNPC | HNRNPC | HNRNPC | 6420 | 0.04 | 0.27 | YES |
| 54 | CWC15 | CWC15 | CWC15 | 6443 | 0.04 | 0.28 | YES |
| 55 | PRPF40B | PRPF40B | PRPF40B | 6508 | 0.039 | 0.28 | YES |
| 56 | TXNL4A | TXNL4A | TXNL4A | 6509 | 0.039 | 0.29 | YES |
| 57 | THOC3 | THOC3 | THOC3 | 6577 | 0.038 | 0.29 | YES |
| 58 | BAT1 | BAT1 | BAT1 | 6589 | 0.038 | 0.29 | YES |
| 59 | TRA2B | TRA2B | TRA2B | 6616 | 0.037 | 0.3 | YES |
| 60 | SFRS2 | SFRS2 | SFRS2 | 6660 | 0.036 | 0.3 | YES |
| 61 | NAA38 | NAA38 | NAA38 | 6670 | 0.036 | 0.31 | YES |
| 62 | TRA2A | TRA2A | TRA2A | 6672 | 0.036 | 0.31 | YES |
| 63 | SNW1 | SNW1 | SNW1 | 6714 | 0.035 | 0.32 | YES |
| 64 | DDX46 | DDX46 | DDX46 | 6746 | 0.035 | 0.32 | YES |
| 65 | HNRNPM | HNRNPM | HNRNPM | 6791 | 0.034 | 0.32 | YES |
| 66 | PRPF31 | PRPF31 | PRPF31 | 6845 | 0.033 | 0.32 | YES |
| 67 | SF3B14 | SF3B14 | SF3B14 | 6918 | 0.032 | 0.32 | YES |
| 68 | SFRS1 | SFRS1 | SFRS1 | 7019 | 0.03 | 0.32 | NO |
| 69 | LSM3 | LSM3 | LSM3 | 7152 | 0.028 | 0.32 | NO |
| 70 | THOC2 | THOC2 | THOC2 | 7419 | 0.025 | 0.31 | NO |
| 71 | ISY1 | ISY1 | ISY1 | 7644 | 0.021 | 0.3 | NO |
| 72 | PRPF40A | PRPF40A | PRPF40A | 7664 | 0.021 | 0.3 | NO |
| 73 | CHERP | CHERP | CHERP | 7739 | 0.02 | 0.3 | NO |
| 74 | SF3B5 | SF3B5 | SF3B5 | 7779 | 0.019 | 0.3 | NO |
| 75 | DHX15 | DHX15 | DHX15 | 7780 | 0.019 | 0.3 | NO |
| 76 | SF3B1 | SF3B1 | SF3B1 | 7817 | 0.019 | 0.31 | NO |
| 77 | SART1 | SART1 | SART1 | 8013 | 0.015 | 0.3 | NO |
| 78 | PRPF8 | PRPF8 | PRPF8 | 8071 | 0.015 | 0.3 | NO |
| 79 | PUF60 | PUF60 | PUF60 | 8167 | 0.013 | 0.29 | NO |
| 80 | EFTUD2 | EFTUD2 | EFTUD2 | 8260 | 0.012 | 0.29 | NO |
| 81 | EIF4A3 | EIF4A3 | EIF4A3 | 8357 | 0.01 | 0.29 | NO |
| 82 | BUD31 | BUD31 | BUD31 | 8378 | 0.01 | 0.29 | NO |
| 83 | RBM22 | RBM22 | RBM22 | 8410 | 0.0096 | 0.29 | NO |
| 84 | HSPA6 | HSPA6 | HSPA6 | 8449 | 0.0091 | 0.29 | NO |
| 85 | DDX23 | DDX23 | DDX23 | 8539 | 0.0081 | 0.28 | NO |
| 86 | PRPF38B | PRPF38B | PRPF38B | 8631 | 0.0067 | 0.28 | NO |
| 87 | SFRS5 | SFRS5 | SFRS5 | 8641 | 0.0065 | 0.28 | NO |
| 88 | DHX16 | DHX16 | DHX16 | 8686 | 0.0059 | 0.28 | NO |
| 89 | PRPF18 | PRPF18 | PRPF18 | 8704 | 0.0057 | 0.28 | NO |
| 90 | PRPF4 | PRPF4 | PRPF4 | 8835 | 0.0038 | 0.27 | NO |
| 91 | SF3B2 | SF3B2 | SF3B2 | 8905 | 0.0027 | 0.27 | NO |
| 92 | PRPF19 | PRPF19 | PRPF19 | 8907 | 0.0027 | 0.27 | NO |
| 93 | CTNNBL1 | CTNNBL1 | CTNNBL1 | 8915 | 0.0026 | 0.27 | NO |
| 94 | LSM6 | LSM6 | LSM6 | 9109 | -0.00064 | 0.26 | NO |
| 95 | HNRNPK | HNRNPK | HNRNPK | 9199 | -0.0021 | 0.25 | NO |
| 96 | PCBP1 | PCBP1 | PCBP1 | 9217 | -0.0024 | 0.25 | NO |
| 97 | SNRNP200 | SNRNP200 | SNRNP200 | 9324 | -0.0042 | 0.24 | NO |
| 98 | SNRNP40 | SNRNP40 | SNRNP40 | 9631 | -0.0091 | 0.23 | NO |
| 99 | SFRS13A | SFRS13A | SFRS13A | 9965 | -0.015 | 0.21 | NO |
| 100 | HSPA8 | HSPA8 | HSPA8 | 10033 | -0.016 | 0.21 | NO |
| 101 | CDC5L | CDC5L | CDC5L | 10046 | -0.016 | 0.21 | NO |
| 102 | NCBP1 | NCBP1 | NCBP1 | 10173 | -0.018 | 0.21 | NO |
| 103 | SF3A1 | SF3A1 | SF3A1 | 10438 | -0.023 | 0.2 | NO |
| 104 | DHX8 | DHX8 | DHX8 | 11174 | -0.035 | 0.16 | NO |
| 105 | PPIE | PPIE | PPIE | 11280 | -0.037 | 0.16 | NO |
| 106 | DDX5 | DDX5 | DDX5 | 11307 | -0.037 | 0.17 | NO |
| 107 | SNRNP27 | SNRNP27 | SNRNP27 | 11400 | -0.039 | 0.17 | NO |
| 108 | AQR | AQR | AQR | 11432 | -0.04 | 0.17 | NO |
| 109 | PRPF38A | PRPF38A | PRPF38A | 11579 | -0.042 | 0.17 | NO |
| 110 | CDC40 | CDC40 | CDC40 | 11731 | -0.045 | 0.17 | NO |
| 111 | SLU7 | SLU7 | SLU7 | 11785 | -0.046 | 0.17 | NO |
| 112 | SF3B3 | SF3B3 | SF3B3 | 11832 | -0.047 | 0.18 | NO |
| 113 | SFRS4 | SFRS4 | SFRS4 | 11877 | -0.048 | 0.18 | NO |
| 114 | PPIH | PPIH | PPIH | 11933 | -0.049 | 0.19 | NO |
| 115 | HSPA1A | HSPA1A | HSPA1A | 11974 | -0.05 | 0.19 | NO |
| 116 | MAGOH | MAGOH | MAGOH | 11985 | -0.05 | 0.2 | NO |
| 117 | ZMAT2 | ZMAT2 | ZMAT2 | 12115 | -0.053 | 0.2 | NO |
| 118 | LSM5 | LSM5 | LSM5 | 12330 | -0.058 | 0.2 | NO |
| 119 | SF3A3 | SF3A3 | SF3A3 | 12354 | -0.058 | 0.2 | NO |
| 120 | SYF2 | SYF2 | SYF2 | 12928 | -0.071 | 0.18 | NO |
| 121 | DHX38 | DHX38 | DHX38 | 13124 | -0.076 | 0.18 | NO |
| 122 | BCAS2 | BCAS2 | BCAS2 | 13626 | -0.088 | 0.17 | NO |
| 123 | PLRG1 | PLRG1 | PLRG1 | 13769 | -0.092 | 0.18 | NO |
| 124 | HSPA1B | HSPA1B | HSPA1B | 15331 | -0.15 | 0.11 | NO |
| 125 | SFRS2B | SFRS2B | SFRS2B | 15405 | -0.15 | 0.13 | NO |
Figure S51. Get High-res Image This plot shows mRNAseq_cNMF expression data heatmap (on the left) a RunningEnrichmentScore(RES) plot (on the top right) and a Signal2Noise(S2N) plot (on the bottom right) of genes in the pathway: KEGG ETHER LIPID METABOLISM.
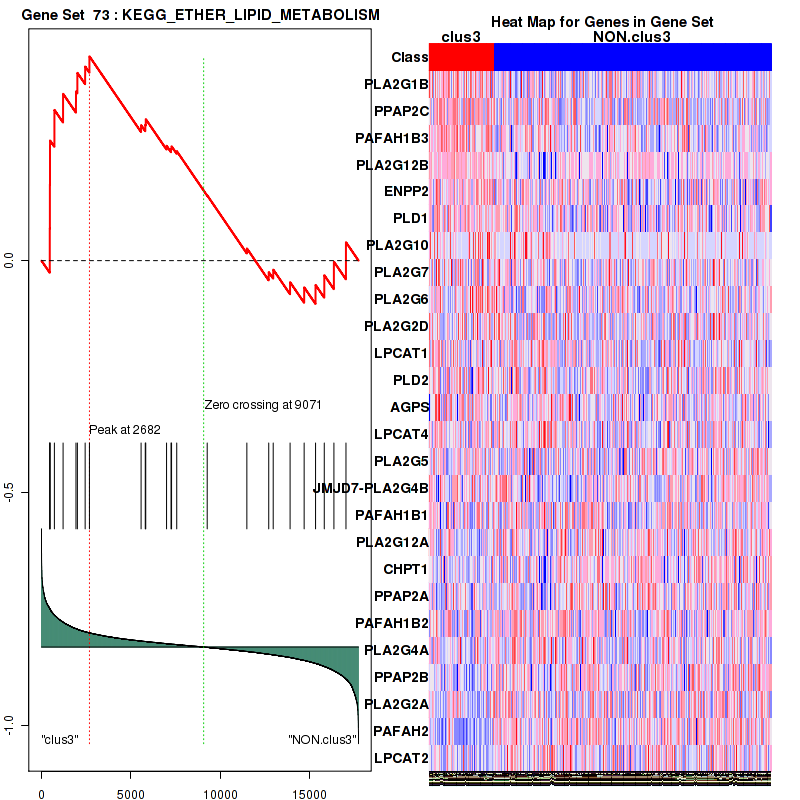
Figure S52. Get High-res Image For the top 5 core enriched genes in the pathway: KEGG ETHER LIPID METABOLISM, this volcano plot shows how much they are up/down-regulated and significant. The significance was calculated by empirical bayesian fit
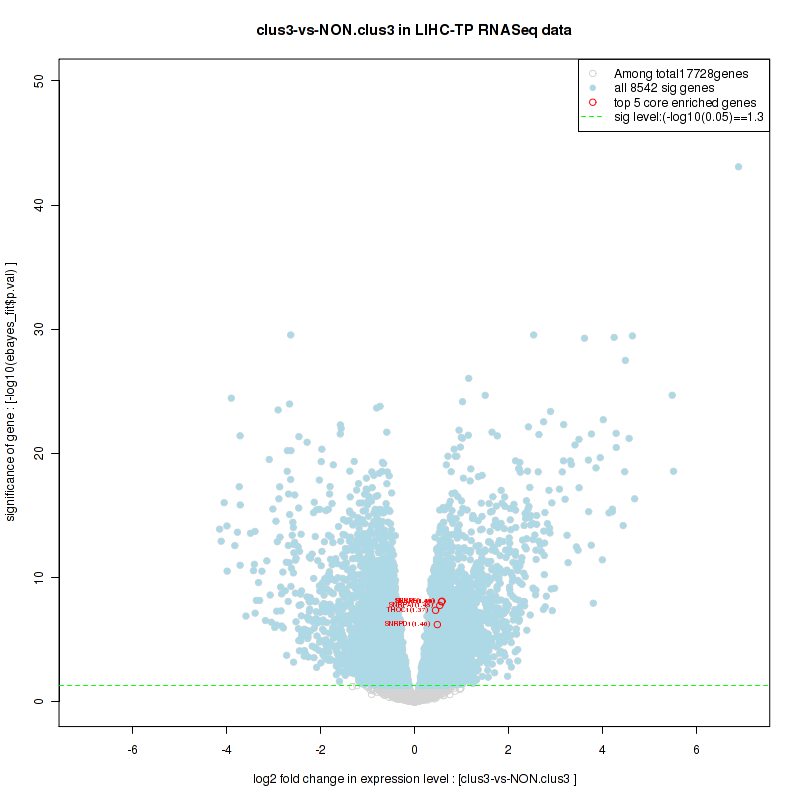
Table S27. Get Full Table This table shows a Running Enrichment Score (RES) of each gene in this pathway, that is, the enrichment score at this point in the ranked list of genes. All genes are ranked by Signal-to-Noise (S2N), a measure of similarity as default and are used to obtain ES matrix of all genes. In this way, GSEA tool uses expression pattern of not only overlapped genes but also not-overlapped genes to produce ES matrix.
| Rank | GENE | SYMBOL | DESC | LIST.LOC | S2N | RES | CORE_ENRICHMENT |
|---|---|---|---|---|---|---|---|
| 1 | DTX1 | DTX1 | DTX1 | 519 | 0.34 | 0.06 | YES |
| 2 | DTX3 | DTX3 | DTX3 | 621 | 0.31 | 0.14 | YES |
| 3 | LFNG | LFNG | LFNG | 1086 | 0.24 | 0.18 | YES |
| 4 | CTBP2 | CTBP2 | CTBP2 | 1420 | 0.21 | 0.21 | YES |
| 5 | DLL3 | DLL3 | DLL3 | 1764 | 0.18 | 0.24 | YES |
| 6 | NOTCH1 | NOTCH1 | NOTCH1 | 2015 | 0.16 | 0.27 | YES |
| 7 | DTX4 | DTX4 | DTX4 | 2126 | 0.16 | 0.3 | YES |
| 8 | DVL2 | DVL2 | DVL2 | 2280 | 0.15 | 0.33 | YES |
| 9 | KAT2A | KAT2A | KAT2A | 3540 | 0.1 | 0.29 | YES |
| 10 | HDAC2 | HDAC2 | HDAC2 | 3891 | 0.091 | 0.29 | YES |
| 11 | HES1 | HES1 | HES1 | 4323 | 0.08 | 0.29 | YES |
| 12 | JAG1 | JAG1 | JAG1 | 4439 | 0.078 | 0.3 | YES |
| 13 | DVL3 | DVL3 | DVL3 | 4452 | 0.077 | 0.32 | YES |
| 14 | MAML1 | MAML1 | MAML1 | 4584 | 0.074 | 0.34 | YES |
| 15 | JAG2 | JAG2 | JAG2 | 4587 | 0.074 | 0.35 | YES |
| 16 | APH1A | APH1A | APH1A | 5197 | 0.062 | 0.34 | YES |
| 17 | DLL4 | DLL4 | DLL4 | 5357 | 0.059 | 0.34 | YES |
| 18 | EP300 | EP300 | EP300 | 5371 | 0.059 | 0.36 | YES |
| 19 | CTBP1 | CTBP1 | CTBP1 | 5610 | 0.054 | 0.36 | YES |
| 20 | HDAC1 | HDAC1 | HDAC1 | 5885 | 0.049 | 0.36 | YES |
| 21 | RBPJ | RBPJ | RBPJ | 6026 | 0.047 | 0.36 | YES |
| 22 | DTX2 | DTX2 | DTX2 | 6035 | 0.047 | 0.37 | YES |
| 23 | NCOR2 | NCOR2 | NCOR2 | 6712 | 0.036 | 0.34 | NO |
| 24 | SNW1 | SNW1 | SNW1 | 6714 | 0.035 | 0.35 | NO |
| 25 | NOTCH3 | NOTCH3 | NOTCH3 | 6741 | 0.035 | 0.36 | NO |
| 26 | NCSTN | NCSTN | NCSTN | 6829 | 0.034 | 0.36 | NO |
| 27 | ADAM17 | ADAM17 | ADAM17 | 7760 | 0.02 | 0.32 | NO |
| 28 | PSEN1 | PSEN1 | PSEN1 | 7893 | 0.018 | 0.31 | NO |
| 29 | HES5 | HES5 | HES5 | 8205 | 0.013 | 0.3 | NO |
| 30 | PSEN2 | PSEN2 | PSEN2 | 8264 | 0.012 | 0.3 | NO |
| 31 | CIR1 | CIR1 | CIR1 | 8353 | 0.01 | 0.3 | NO |
| 32 | NUMB | NUMB | NUMB | 8689 | 0.0059 | 0.28 | NO |
| 33 | NOTCH2 | NOTCH2 | NOTCH2 | 9369 | -0.0051 | 0.24 | NO |
| 34 | NOTCH4 | NOTCH4 | NOTCH4 | 10274 | -0.02 | 0.2 | NO |
| 35 | NUMBL | NUMBL | NUMBL | 10628 | -0.026 | 0.18 | NO |
| 36 | DTX3L | DTX3L | DTX3L | 10667 | -0.026 | 0.19 | NO |
| 37 | PSENEN | PSENEN | PSENEN | 10729 | -0.028 | 0.19 | NO |
| 38 | DVL1 | DVL1 | DVL1 | 11678 | -0.044 | 0.15 | NO |
| 39 | PTCRA | PTCRA | PTCRA | 12351 | -0.058 | 0.13 | NO |
| 40 | CREBBP | CREBBP | CREBBP | 12617 | -0.064 | 0.13 | NO |
| 41 | RFNG | RFNG | RFNG | 12658 | -0.065 | 0.14 | NO |
| 42 | DLL1 | DLL1 | DLL1 | 13691 | -0.09 | 0.11 | NO |
| 43 | MAML2 | MAML2 | MAML2 | 13804 | -0.093 | 0.13 | NO |
| 44 | MAML3 | MAML3 | MAML3 | 14963 | -0.13 | 0.099 | NO |
| 45 | KAT2B | KAT2B | KAT2B | 16360 | -0.22 | 0.077 | NO |
Figure S53. Get High-res Image This plot shows mRNAseq_cNMF expression data heatmap (on the left) a RunningEnrichmentScore(RES) plot (on the top right) and a Signal2Noise(S2N) plot (on the bottom right) of genes in the pathway: KEGG SPHINGOLIPID METABOLISM.
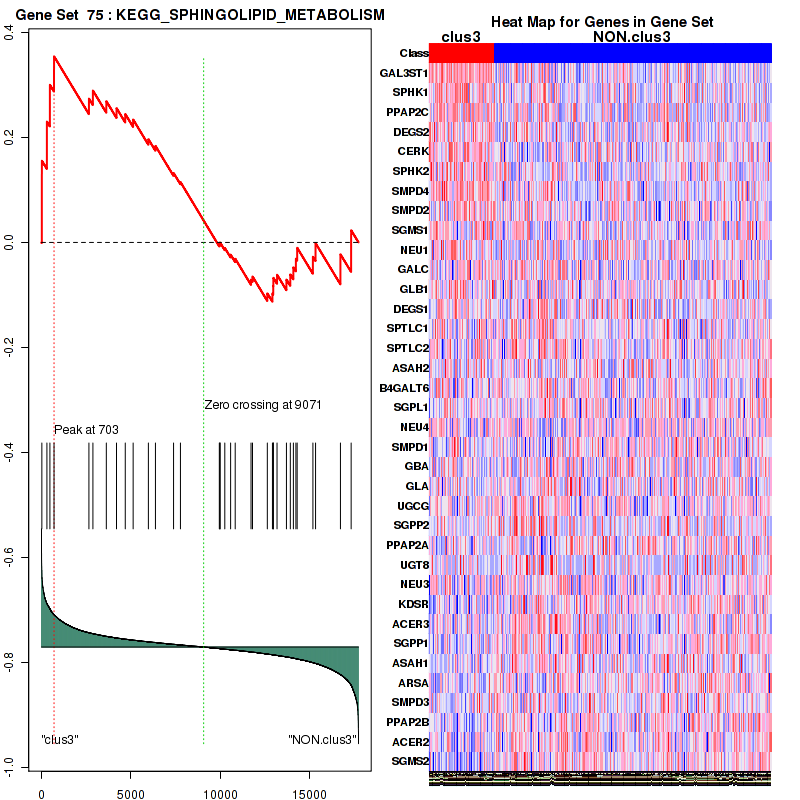
Figure S54. Get High-res Image For the top 5 core enriched genes in the pathway: KEGG SPHINGOLIPID METABOLISM, this volcano plot shows how much they are up/down-regulated and significant. The significance was calculated by empirical bayesian fit
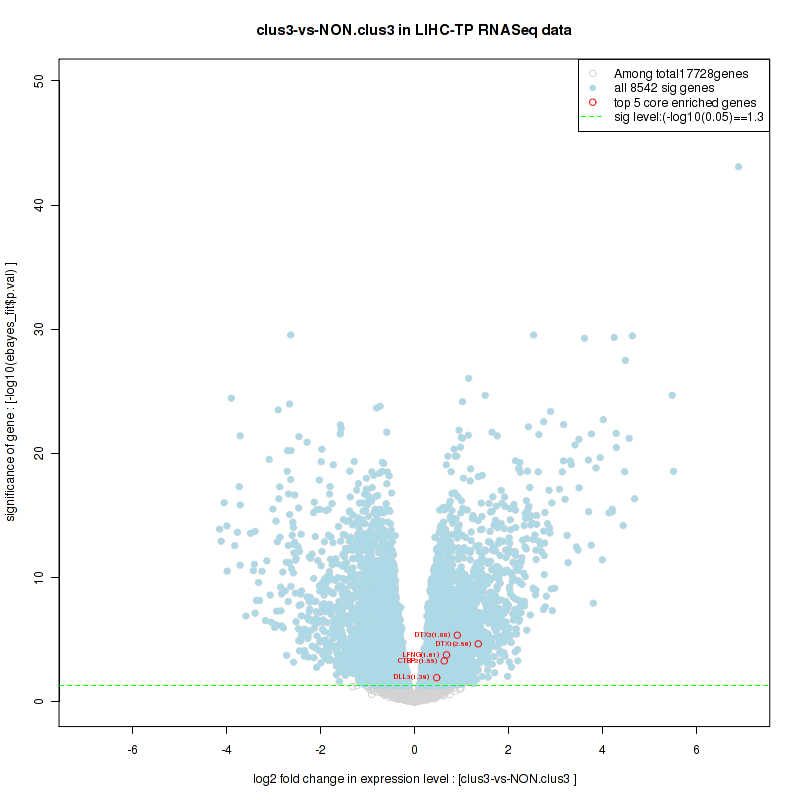
Table S28. Get Full Table This table shows a Running Enrichment Score (RES) of each gene in this pathway, that is, the enrichment score at this point in the ranked list of genes. All genes are ranked by Signal-to-Noise (S2N), a measure of similarity as default and are used to obtain ES matrix of all genes. In this way, GSEA tool uses expression pattern of not only overlapped genes but also not-overlapped genes to produce ES matrix.
| Rank | GENE | SYMBOL | DESC | LIST.LOC | S2N | RES | CORE_ENRICHMENT |
|---|---|---|---|---|---|---|---|
| 1 | MAPK13 | MAPK13 | MAPK13 | 125 | 0.5 | 0.052 | YES |
| 2 | PLA2G1B | PLA2G1B | PLA2G1B | 464 | 0.35 | 0.074 | YES |
| 3 | CACNA1D | CACNA1D | CACNA1D | 576 | 0.32 | 0.1 | YES |
| 4 | PLA2G12B | PLA2G12B | PLA2G12B | 724 | 0.29 | 0.13 | YES |
| 5 | PRKX | PRKX | PRKX | 754 | 0.29 | 0.16 | YES |
| 6 | SRC | SRC | SRC | 1102 | 0.24 | 0.17 | YES |
| 7 | CALML6 | CALML6 | CALML6 | 1590 | 0.19 | 0.17 | YES |
| 8 | PRKCD | PRKCD | PRKCD | 1804 | 0.18 | 0.18 | YES |
| 9 | PLD1 | PLD1 | PLD1 | 1930 | 0.17 | 0.19 | YES |
| 10 | PLA2G10 | PLA2G10 | PLA2G10 | 2008 | 0.16 | 0.2 | YES |
| 11 | ITPR3 | ITPR3 | ITPR3 | 2258 | 0.15 | 0.21 | YES |
| 12 | CACNA1F | CACNA1F | CACNA1F | 2285 | 0.15 | 0.22 | YES |
| 13 | ADCY5 | ADCY5 | ADCY5 | 2286 | 0.15 | 0.24 | YES |
| 14 | PLCB1 | PLCB1 | PLCB1 | 2364 | 0.14 | 0.25 | YES |
| 15 | CAMK2B | CAMK2B | CAMK2B | 2370 | 0.14 | 0.27 | YES |
| 16 | CGA | CGA | CGA | 2420 | 0.14 | 0.28 | YES |
| 17 | PLCB4 | PLCB4 | PLCB4 | 2494 | 0.14 | 0.29 | YES |
| 18 | MAP3K4 | MAP3K4 | MAP3K4 | 2515 | 0.14 | 0.31 | YES |
| 19 | PLA2G6 | PLA2G6 | PLA2G6 | 2682 | 0.13 | 0.32 | YES |
| 20 | GNRH1 | GNRH1 | GNRH1 | 2685 | 0.13 | 0.33 | YES |
| 21 | LHB | LHB | LHB | 2707 | 0.13 | 0.34 | YES |
| 22 | GNAS | GNAS | GNAS | 2731 | 0.13 | 0.36 | YES |
| 23 | ADCY6 | ADCY6 | ADCY6 | 2934 | 0.12 | 0.36 | YES |
| 24 | MAPK12 | MAPK12 | MAPK12 | 3617 | 0.098 | 0.33 | NO |
| 25 | MAPK7 | MAPK7 | MAPK7 | 3749 | 0.095 | 0.34 | NO |
| 26 | ATF4 | ATF4 | ATF4 | 3977 | 0.089 | 0.33 | NO |
| 27 | PLCB3 | PLCB3 | PLCB3 | 4506 | 0.076 | 0.31 | NO |
| 28 | KRAS | KRAS | KRAS | 4510 | 0.076 | 0.32 | NO |
| 29 | MAPK9 | MAPK9 | MAPK9 | 4597 | 0.074 | 0.33 | NO |
| 30 | MAP2K7 | MAP2K7 | MAP2K7 | 4667 | 0.072 | 0.33 | NO |
| 31 | PRKACA | PRKACA | PRKACA | 4903 | 0.067 | 0.32 | NO |
| 32 | MAP2K4 | MAP2K4 | MAP2K4 | 5112 | 0.063 | 0.32 | NO |
| 33 | MAP2K2 | MAP2K2 | MAP2K2 | 5395 | 0.058 | 0.31 | NO |
| 34 | MAP3K1 | MAP3K1 | MAP3K1 | 5458 | 0.057 | 0.32 | NO |
| 35 | PLA2G2D | PLA2G2D | PLA2G2D | 5570 | 0.055 | 0.32 | NO |
| 36 | PLD2 | PLD2 | PLD2 | 5831 | 0.05 | 0.31 | NO |
| 37 | RAF1 | RAF1 | RAF1 | 5999 | 0.047 | 0.3 | NO |
| 38 | CAMK2G | CAMK2G | CAMK2G | 6111 | 0.045 | 0.3 | NO |
| 39 | MAPK14 | MAPK14 | MAPK14 | 6352 | 0.042 | 0.29 | NO |
| 40 | CAMK2A | CAMK2A | CAMK2A | 6682 | 0.036 | 0.28 | NO |
| 41 | MAPK1 | MAPK1 | MAPK1 | 6795 | 0.034 | 0.28 | NO |
| 42 | CALM2 | CALM2 | CALM2 | 6970 | 0.031 | 0.27 | NO |
| 43 | GNAQ | GNAQ | GNAQ | 7273 | 0.026 | 0.26 | NO |
| 44 | PLA2G5 | PLA2G5 | PLA2G5 | 7274 | 0.026 | 0.26 | NO |
| 45 | CALM3 | CALM3 | CALM3 | 7452 | 0.024 | 0.25 | NO |
| 46 | CACNA1C | CACNA1C | CACNA1C | 7509 | 0.023 | 0.25 | NO |
| 47 | JMJD7-PLA2G4B | JMJD7-PLA2G4B | JMJD7-PLA2G4B | 7564 | 0.022 | 0.25 | NO |
| 48 | MAP2K6 | MAP2K6 | MAP2K6 | 7622 | 0.021 | 0.25 | NO |
| 49 | CAMK2D | CAMK2D | CAMK2D | 7746 | 0.02 | 0.24 | NO |
| 50 | GRB2 | GRB2 | GRB2 | 7803 | 0.019 | 0.24 | NO |
| 51 | MMP2 | MMP2 | MMP2 | 8229 | 0.012 | 0.22 | NO |
| 52 | ELK1 | ELK1 | ELK1 | 9001 | 0.0014 | 0.18 | NO |
| 53 | MMP14 | MMP14 | MMP14 | 9105 | -0.00058 | 0.17 | NO |
| 54 | CALM1 | CALM1 | CALM1 | 9200 | -0.0021 | 0.17 | NO |
| 55 | MAPK3 | MAPK3 | MAPK3 | 9334 | -0.0044 | 0.16 | NO |
| 56 | MAPK8 | MAPK8 | MAPK8 | 9533 | -0.0075 | 0.15 | NO |
| 57 | SOS2 | SOS2 | SOS2 | 9594 | -0.0084 | 0.15 | NO |
| 58 | HRAS | HRAS | HRAS | 9801 | -0.012 | 0.14 | NO |
| 59 | ADCY7 | ADCY7 | ADCY7 | 9888 | -0.014 | 0.13 | NO |
| 60 | PRKCA | PRKCA | PRKCA | 10055 | -0.016 | 0.13 | NO |
| 61 | GNRHR | GNRHR | GNRHR | 10073 | -0.016 | 0.13 | NO |
| 62 | CACNA1S | CACNA1S | CACNA1S | 10107 | -0.017 | 0.13 | NO |
| 63 | MAPK11 | MAPK11 | MAPK11 | 10775 | -0.028 | 0.093 | NO |
| 64 | SOS1 | SOS1 | SOS1 | 10789 | -0.028 | 0.096 | NO |
| 65 | MAP3K3 | MAP3K3 | MAP3K3 | 10819 | -0.029 | 0.097 | NO |
| 66 | MAP2K3 | MAP2K3 | MAP2K3 | 11044 | -0.033 | 0.088 | NO |
| 67 | NRAS | NRAS | NRAS | 11057 | -0.033 | 0.092 | NO |
| 68 | ADCY2 | ADCY2 | ADCY2 | 11135 | -0.034 | 0.091 | NO |
| 69 | ADCY4 | ADCY4 | ADCY4 | 11340 | -0.038 | 0.084 | NO |
| 70 | PLA2G12A | PLA2G12A | PLA2G12A | 11485 | -0.041 | 0.081 | NO |
| 71 | PLCB2 | PLCB2 | PLCB2 | 11530 | -0.041 | 0.083 | NO |
| 72 | MAP2K1 | MAP2K1 | MAP2K1 | 12327 | -0.058 | 0.045 | NO |
| 73 | ITPR2 | ITPR2 | ITPR2 | 12396 | -0.059 | 0.048 | NO |
| 74 | EGFR | EGFR | EGFR | 12438 | -0.06 | 0.053 | NO |
| 75 | GNA11 | GNA11 | GNA11 | 12625 | -0.064 | 0.05 | NO |
| 76 | CDC42 | CDC42 | CDC42 | 12940 | -0.071 | 0.04 | NO |
| 77 | PRKCB | PRKCB | PRKCB | 13209 | -0.078 | 0.034 | NO |
| 78 | ADCY1 | ADCY1 | ADCY1 | 13610 | -0.088 | 0.022 | NO |
| 79 | ADCY9 | ADCY9 | ADCY9 | 13852 | -0.094 | 0.019 | NO |
| 80 | CALML3 | CALML3 | CALML3 | 14040 | -0.1 | 0.02 | NO |
| 81 | JUN | JUN | JUN | 14167 | -0.1 | 0.026 | NO |
| 82 | MAPK10 | MAPK10 | MAPK10 | 14342 | -0.11 | 0.029 | NO |
| 83 | PLA2G4A | PLA2G4A | PLA2G4A | 14689 | -0.12 | 0.023 | NO |
| 84 | PTK2B | PTK2B | PTK2B | 14719 | -0.12 | 0.036 | NO |
| 85 | HBEGF | HBEGF | HBEGF | 14792 | -0.13 | 0.047 | NO |
| 86 | PLA2G2A | PLA2G2A | PLA2G2A | 15814 | -0.18 | 0.01 | NO |
| 87 | PRKACB | PRKACB | PRKACB | 15897 | -0.18 | 0.027 | NO |
| 88 | MAP3K2 | MAP3K2 | MAP3K2 | 16019 | -0.19 | 0.043 | NO |
| 89 | ITPR1 | ITPR1 | ITPR1 | 16035 | -0.19 | 0.064 | NO |
| 90 | ADCY8 | ADCY8 | ADCY8 | 16845 | -0.27 | 0.05 | NO |
Figure S55. Get High-res Image This plot shows mRNAseq_cNMF expression data heatmap (on the left) a RunningEnrichmentScore(RES) plot (on the top right) and a Signal2Noise(S2N) plot (on the bottom right) of genes in the pathway: KEGG GLYCOSPHINGOLIPID BIOSYNTHESIS LACTO AND NEOLACTO SERIES.
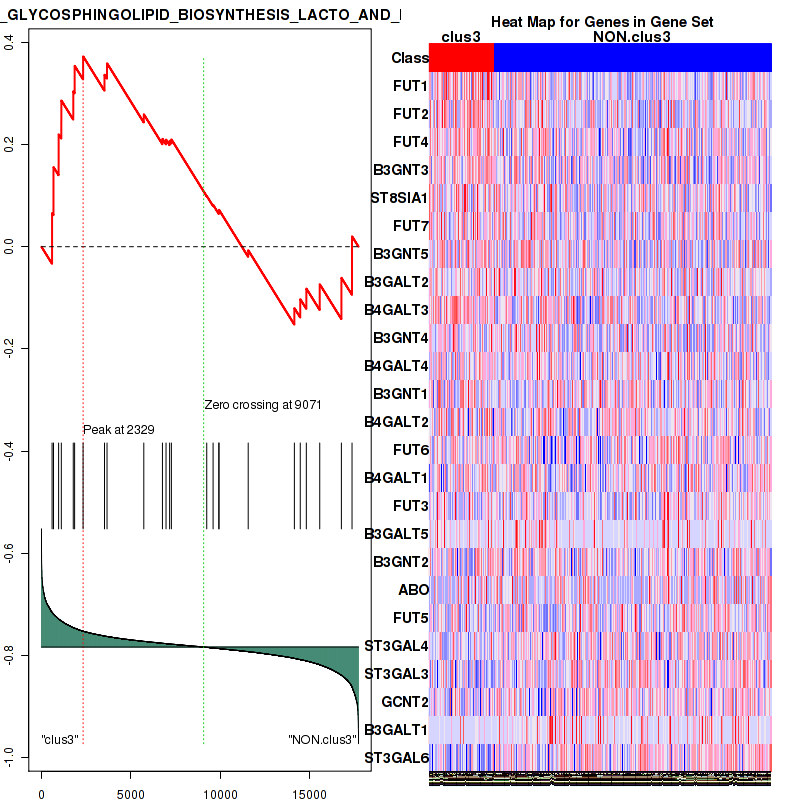
Figure S56. Get High-res Image For the top 5 core enriched genes in the pathway: KEGG GLYCOSPHINGOLIPID BIOSYNTHESIS LACTO AND NEOLACTO SERIES, this volcano plot shows how much they are up/down-regulated and significant. The significance was calculated by empirical bayesian fit
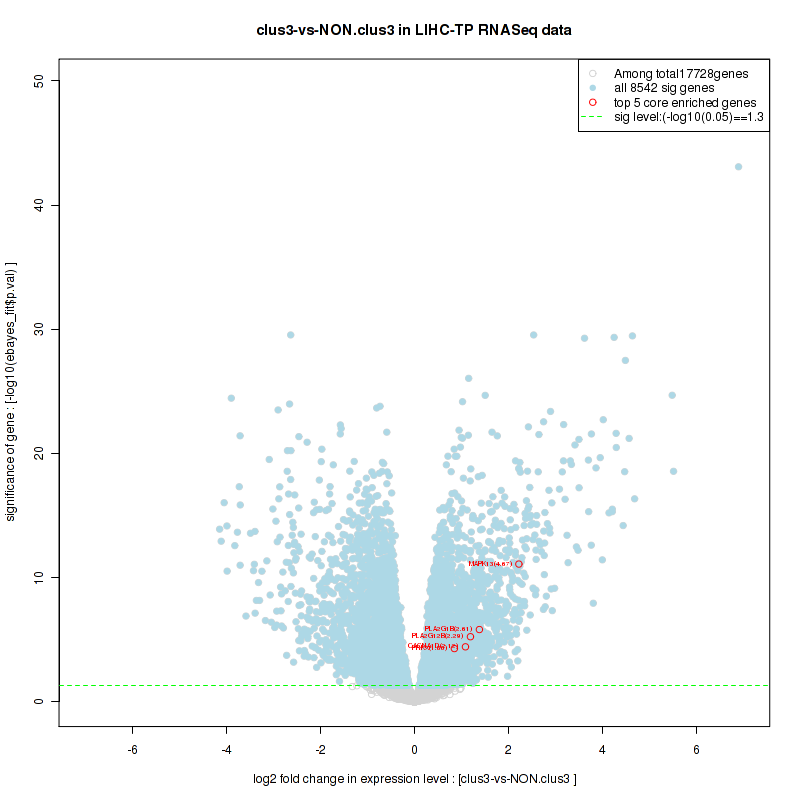
Table S29. Get Full Table This table shows a Running Enrichment Score (RES) of each gene in this pathway, that is, the enrichment score at this point in the ranked list of genes. All genes are ranked by Signal-to-Noise (S2N), a measure of similarity as default and are used to obtain ES matrix of all genes. In this way, GSEA tool uses expression pattern of not only overlapped genes but also not-overlapped genes to produce ES matrix.
| Rank | GENE | SYMBOL | DESC | LIST.LOC | S2N | RES | CORE_ENRICHMENT |
|---|---|---|---|---|---|---|---|
| 1 | PLA2G1B | PLA2G1B | PLA2G1B | 464 | 0.35 | 0.07 | YES |
| 2 | PPAP2C | PPAP2C | PPAP2C | 471 | 0.35 | 0.16 | YES |
| 3 | PAFAH1B3 | PAFAH1B3 | PAFAH1B3 | 479 | 0.35 | 0.26 | YES |
| 4 | PLA2G12B | PLA2G12B | PLA2G12B | 724 | 0.29 | 0.32 | YES |
| 5 | ENPP2 | ENPP2 | ENPP2 | 1208 | 0.23 | 0.36 | YES |
| 6 | PLD1 | PLD1 | PLD1 | 1930 | 0.17 | 0.36 | YES |
| 7 | PLA2G10 | PLA2G10 | PLA2G10 | 2008 | 0.16 | 0.4 | YES |
| 8 | PLA2G7 | PLA2G7 | PLA2G7 | 2443 | 0.14 | 0.42 | YES |
| 9 | PLA2G6 | PLA2G6 | PLA2G6 | 2682 | 0.13 | 0.44 | YES |
| 10 | PLA2G2D | PLA2G2D | PLA2G2D | 5570 | 0.055 | 0.29 | NO |
| 11 | LPCAT1 | LPCAT1 | LPCAT1 | 5805 | 0.051 | 0.29 | NO |
| 12 | PLD2 | PLD2 | PLD2 | 5831 | 0.05 | 0.3 | NO |
| 13 | AGPS | AGPS | AGPS | 6994 | 0.031 | 0.25 | NO |
| 14 | LPCAT4 | LPCAT4 | LPCAT4 | 7245 | 0.027 | 0.24 | NO |
| 15 | PLA2G5 | PLA2G5 | PLA2G5 | 7274 | 0.026 | 0.25 | NO |
| 16 | JMJD7-PLA2G4B | JMJD7-PLA2G4B | JMJD7-PLA2G4B | 7564 | 0.022 | 0.24 | NO |
| 17 | PAFAH1B1 | PAFAH1B1 | PAFAH1B1 | 9268 | -0.0031 | 0.14 | NO |
| 18 | PLA2G12A | PLA2G12A | PLA2G12A | 11485 | -0.041 | 0.026 | NO |
| 19 | CHPT1 | CHPT1 | CHPT1 | 12707 | -0.066 | -0.025 | NO |
| 20 | PPAP2A | PPAP2A | PPAP2A | 12959 | -0.072 | -0.019 | NO |
| 21 | PAFAH1B2 | PAFAH1B2 | PAFAH1B2 | 13901 | -0.096 | -0.046 | NO |
| 22 | PLA2G4A | PLA2G4A | PLA2G4A | 14689 | -0.12 | -0.057 | NO |
| 23 | PPAP2B | PPAP2B | PPAP2B | 15325 | -0.15 | -0.052 | NO |
| 24 | PLA2G2A | PLA2G2A | PLA2G2A | 15814 | -0.18 | -0.031 | NO |
| 25 | PAFAH2 | PAFAH2 | PAFAH2 | 16351 | -0.22 | -0.0023 | NO |
| 26 | LPCAT2 | LPCAT2 | LPCAT2 | 17025 | -0.29 | 0.04 | NO |
Figure S57. Get High-res Image This plot shows mRNAseq_cNMF expression data heatmap (on the left) a RunningEnrichmentScore(RES) plot (on the top right) and a Signal2Noise(S2N) plot (on the bottom right) of genes in the pathway: KEGG RIBOSOME.
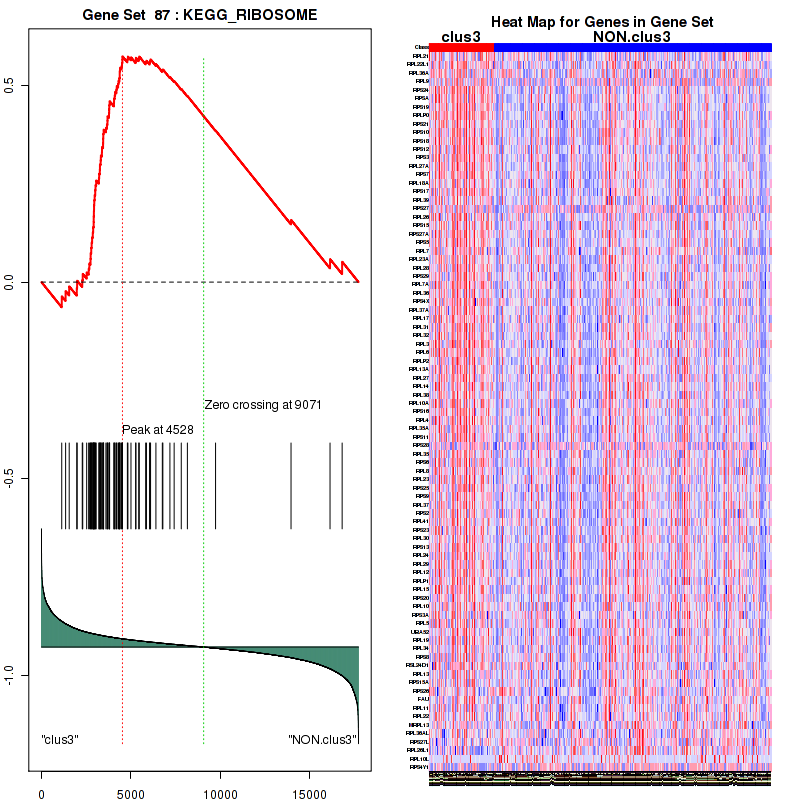
Figure S58. Get High-res Image For the top 5 core enriched genes in the pathway: KEGG RIBOSOME, this volcano plot shows how much they are up/down-regulated and significant. The significance was calculated by empirical bayesian fit
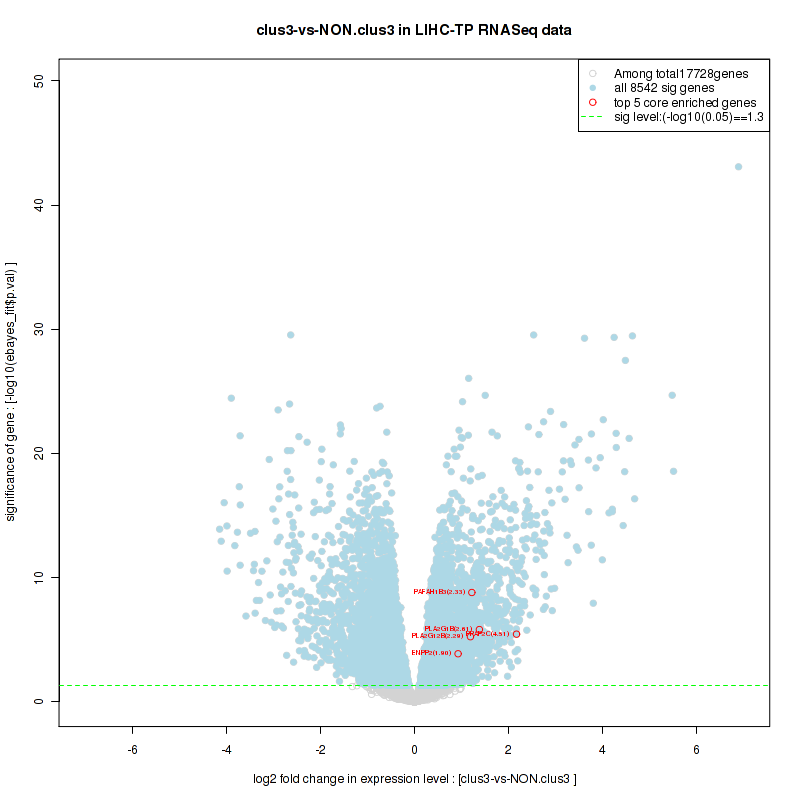
Table S30. Get Full Table This table shows a Running Enrichment Score (RES) of each gene in this pathway, that is, the enrichment score at this point in the ranked list of genes. All genes are ranked by Signal-to-Noise (S2N), a measure of similarity as default and are used to obtain ES matrix of all genes. In this way, GSEA tool uses expression pattern of not only overlapped genes but also not-overlapped genes to produce ES matrix.
| Rank | GENE | SYMBOL | DESC | LIST.LOC | S2N | RES | CORE_ENRICHMENT |
|---|---|---|---|---|---|---|---|
| 1 | CDC25A | CDC25A | CDC25A | 421 | 0.37 | 0.0042 | YES |
| 2 | TTK | TTK | TTK | 450 | 0.36 | 0.03 | YES |
| 3 | CCNB2 | CCNB2 | CCNB2 | 523 | 0.34 | 0.051 | YES |
| 4 | CDKN1C | CDKN1C | CDKN1C | 552 | 0.33 | 0.075 | YES |
| 5 | CDK1 | CDK1 | CDK1 | 597 | 0.32 | 0.097 | YES |
| 6 | BUB1B | BUB1B | BUB1B | 766 | 0.28 | 0.11 | YES |
| 7 | ESPL1 | ESPL1 | ESPL1 | 797 | 0.28 | 0.13 | YES |
| 8 | CDC25C | CDC25C | CDC25C | 878 | 0.27 | 0.14 | YES |
| 9 | PLK1 | PLK1 | PLK1 | 941 | 0.26 | 0.16 | YES |
| 10 | BUB1 | BUB1 | BUB1 | 982 | 0.25 | 0.18 | YES |
| 11 | PTTG1 | PTTG1 | PTTG1 | 1019 | 0.25 | 0.2 | YES |
| 12 | CCNE1 | CCNE1 | CCNE1 | 1085 | 0.24 | 0.21 | YES |
| 13 | CCNB1 | CCNB1 | CCNB1 | 1154 | 0.23 | 0.22 | YES |
| 14 | CDC6 | CDC6 | CDC6 | 1241 | 0.22 | 0.24 | YES |
| 15 | CCNB3 | CCNB3 | CCNB3 | 1294 | 0.22 | 0.25 | YES |
| 16 | CCNA2 | CCNA2 | CCNA2 | 1331 | 0.22 | 0.26 | YES |
| 17 | CDC20 | CDC20 | CDC20 | 1397 | 0.21 | 0.28 | YES |
| 18 | SKP2 | SKP2 | SKP2 | 1572 | 0.19 | 0.28 | YES |
| 19 | CDC45 | CDC45 | CDC45 | 1694 | 0.18 | 0.29 | YES |
| 20 | CHEK2 | CHEK2 | CHEK2 | 1792 | 0.18 | 0.3 | YES |
| 21 | ORC6L | ORC6L | ORC6L | 1849 | 0.17 | 0.31 | YES |
| 22 | TP53 | TP53 | TP53 | 1986 | 0.16 | 0.31 | YES |
| 23 | TGFB1 | TGFB1 | TGFB1 | 2382 | 0.14 | 0.3 | YES |
| 24 | CDK7 | CDK7 | CDK7 | 2439 | 0.14 | 0.31 | YES |
| 25 | E2F1 | E2F1 | E2F1 | 2533 | 0.14 | 0.31 | YES |
| 26 | SMC3 | SMC3 | SMC3 | 2608 | 0.13 | 0.32 | YES |
| 27 | WEE1 | WEE1 | WEE1 | 2694 | 0.13 | 0.32 | YES |
| 28 | MAD2L1 | MAD2L1 | MAD2L1 | 2771 | 0.13 | 0.33 | YES |
| 29 | MCM2 | MCM2 | MCM2 | 2863 | 0.12 | 0.33 | YES |
| 30 | CCNE2 | CCNE2 | CCNE2 | 3081 | 0.12 | 0.33 | YES |
| 31 | CDK4 | CDK4 | CDK4 | 3164 | 0.11 | 0.33 | YES |
| 32 | CHEK1 | CHEK1 | CHEK1 | 3218 | 0.11 | 0.34 | YES |
| 33 | RBL1 | RBL1 | RBL1 | 3451 | 0.1 | 0.33 | YES |
| 34 | MCM5 | MCM5 | MCM5 | 3481 | 0.1 | 0.34 | YES |
| 35 | WEE2 | WEE2 | WEE2 | 3616 | 0.098 | 0.34 | YES |
| 36 | MCM4 | MCM4 | MCM4 | 3628 | 0.098 | 0.35 | YES |
| 37 | CDC7 | CDC7 | CDC7 | 3645 | 0.097 | 0.35 | YES |
| 38 | PTTG2 | PTTG2 | PTTG2 | 3677 | 0.096 | 0.36 | YES |
| 39 | MCM3 | MCM3 | MCM3 | 3747 | 0.095 | 0.36 | YES |
| 40 | ANAPC4 | ANAPC4 | ANAPC4 | 3879 | 0.092 | 0.36 | YES |
| 41 | HDAC2 | HDAC2 | HDAC2 | 3891 | 0.091 | 0.37 | YES |
| 42 | ANAPC7 | ANAPC7 | ANAPC7 | 3995 | 0.088 | 0.37 | YES |
| 43 | ORC2L | ORC2L | ORC2L | 4056 | 0.087 | 0.37 | YES |
| 44 | E2F3 | E2F3 | E2F3 | 4226 | 0.082 | 0.37 | YES |
| 45 | TFDP1 | TFDP1 | TFDP1 | 4277 | 0.081 | 0.37 | YES |
| 46 | FZR1 | FZR1 | FZR1 | 4289 | 0.081 | 0.38 | YES |
| 47 | MCM6 | MCM6 | MCM6 | 4339 | 0.08 | 0.38 | YES |
| 48 | SMC1B | SMC1B | SMC1B | 4479 | 0.076 | 0.38 | YES |
| 49 | MCM7 | MCM7 | MCM7 | 4539 | 0.075 | 0.38 | YES |
| 50 | E2F2 | E2F2 | E2F2 | 4599 | 0.074 | 0.38 | YES |
| 51 | ORC1L | ORC1L | ORC1L | 4712 | 0.071 | 0.38 | NO |
| 52 | ANAPC1 | ANAPC1 | ANAPC1 | 4917 | 0.067 | 0.38 | NO |
| 53 | CDC16 | CDC16 | CDC16 | 4940 | 0.067 | 0.38 | NO |
| 54 | RBX1 | RBX1 | RBX1 | 5113 | 0.063 | 0.38 | NO |
| 55 | EP300 | EP300 | EP300 | 5371 | 0.059 | 0.37 | NO |
| 56 | YWHAZ | YWHAZ | YWHAZ | 5548 | 0.055 | 0.36 | NO |
| 57 | BUB3 | BUB3 | BUB3 | 5562 | 0.055 | 0.36 | NO |
| 58 | YWHAQ | YWHAQ | YWHAQ | 5609 | 0.054 | 0.36 | NO |
| 59 | HDAC1 | HDAC1 | HDAC1 | 5885 | 0.049 | 0.35 | NO |
| 60 | YWHAH | YWHAH | YWHAH | 6050 | 0.046 | 0.35 | NO |
| 61 | CDC26 | CDC26 | CDC26 | 6106 | 0.045 | 0.35 | NO |
| 62 | ANAPC5 | ANAPC5 | ANAPC5 | 6144 | 0.045 | 0.35 | NO |
| 63 | SMAD3 | SMAD3 | SMAD3 | 6323 | 0.042 | 0.34 | NO |
| 64 | ABL1 | ABL1 | ABL1 | 6388 | 0.041 | 0.34 | NO |
| 65 | MAD1L1 | MAD1L1 | MAD1L1 | 6635 | 0.037 | 0.33 | NO |
| 66 | CDC23 | CDC23 | CDC23 | 6848 | 0.033 | 0.32 | NO |
| 67 | STAG1 | STAG1 | STAG1 | 7106 | 0.029 | 0.31 | NO |
| 68 | CDK2 | CDK2 | CDK2 | 7162 | 0.028 | 0.31 | NO |
| 69 | YWHAE | YWHAE | YWHAE | 7249 | 0.027 | 0.3 | NO |
| 70 | CDKN2D | CDKN2D | CDKN2D | 7306 | 0.026 | 0.3 | NO |
| 71 | RAD21 | RAD21 | RAD21 | 7350 | 0.025 | 0.3 | NO |
| 72 | ORC3L | ORC3L | ORC3L | 7592 | 0.022 | 0.29 | NO |
| 73 | E2F5 | E2F5 | E2F5 | 7743 | 0.02 | 0.28 | NO |
| 74 | ANAPC11 | ANAPC11 | ANAPC11 | 7943 | 0.017 | 0.27 | NO |
| 75 | SMAD4 | SMAD4 | SMAD4 | 8018 | 0.015 | 0.27 | NO |
| 76 | PRKDC | PRKDC | PRKDC | 8262 | 0.012 | 0.26 | NO |
| 77 | CDC27 | CDC27 | CDC27 | 8324 | 0.011 | 0.26 | NO |
| 78 | ORC4L | ORC4L | ORC4L | 8382 | 0.01 | 0.25 | NO |
| 79 | PCNA | PCNA | PCNA | 8450 | 0.0091 | 0.25 | NO |
| 80 | ATM | ATM | ATM | 8598 | 0.0072 | 0.24 | NO |
| 81 | TGFB3 | TGFB3 | TGFB3 | 8750 | 0.0051 | 0.23 | NO |
| 82 | ORC5L | ORC5L | ORC5L | 8840 | 0.0038 | 0.23 | NO |
| 83 | E2F4 | E2F4 | E2F4 | 9113 | -0.00071 | 0.21 | NO |
| 84 | CCND2 | CCND2 | CCND2 | 9267 | -0.0031 | 0.2 | NO |
| 85 | SKP1 | SKP1 | SKP1 | 9611 | -0.0087 | 0.19 | NO |
| 86 | CDC25B | CDC25B | CDC25B | 9654 | -0.0094 | 0.18 | NO |
| 87 | PKMYT1 | PKMYT1 | PKMYT1 | 9746 | -0.011 | 0.18 | NO |
| 88 | YWHAB | YWHAB | YWHAB | 9837 | -0.013 | 0.18 | NO |
| 89 | CCND1 | CCND1 | CCND1 | 9861 | -0.013 | 0.18 | NO |
| 90 | SMAD2 | SMAD2 | SMAD2 | 10108 | -0.017 | 0.16 | NO |
| 91 | ANAPC2 | ANAPC2 | ANAPC2 | 10182 | -0.018 | 0.16 | NO |
| 92 | CDC14A | CDC14A | CDC14A | 10321 | -0.021 | 0.15 | NO |
| 93 | ATR | ATR | ATR | 10330 | -0.021 | 0.16 | NO |
| 94 | ANAPC13 | ANAPC13 | ANAPC13 | 10343 | -0.021 | 0.16 | NO |
| 95 | STAG2 | STAG2 | STAG2 | 10756 | -0.028 | 0.14 | NO |
| 96 | SMC1A | SMC1A | SMC1A | 10904 | -0.03 | 0.13 | NO |
| 97 | GSK3B | GSK3B | GSK3B | 11562 | -0.042 | 0.095 | NO |
| 98 | YWHAG | YWHAG | YWHAG | 11626 | -0.043 | 0.095 | NO |
| 99 | CDKN1B | CDKN1B | CDKN1B | 11651 | -0.044 | 0.097 | NO |
| 100 | MDM2 | MDM2 | MDM2 | 11766 | -0.046 | 0.094 | NO |
| 101 | MYC | MYC | MYC | 11947 | -0.049 | 0.087 | NO |
| 102 | TFDP2 | TFDP2 | TFDP2 | 12497 | -0.061 | 0.061 | NO |
| 103 | ZBTB17 | ZBTB17 | ZBTB17 | 12501 | -0.062 | 0.065 | NO |
| 104 | CUL1 | CUL1 | CUL1 | 12539 | -0.062 | 0.068 | NO |
| 105 | CREBBP | CREBBP | CREBBP | 12617 | -0.064 | 0.069 | NO |
| 106 | RB1 | RB1 | RB1 | 13175 | -0.077 | 0.043 | NO |
| 107 | TGFB2 | TGFB2 | TGFB2 | 13288 | -0.08 | 0.043 | NO |
| 108 | GADD45B | GADD45B | GADD45B | 13662 | -0.089 | 0.028 | NO |
| 109 | CCND3 | CCND3 | CCND3 | 13780 | -0.092 | 0.029 | NO |
| 110 | CDKN2C | CDKN2C | CDKN2C | 13940 | -0.097 | 0.027 | NO |
| 111 | CCNH | CCNH | CCNH | 13975 | -0.098 | 0.033 | NO |
| 112 | ANAPC10 | ANAPC10 | ANAPC10 | 14153 | -0.1 | 0.03 | NO |
| 113 | CCNA1 | CCNA1 | CCNA1 | 14508 | -0.12 | 0.019 | NO |
| 114 | CDKN1A | CDKN1A | CDKN1A | 14538 | -0.12 | 0.027 | NO |
| 115 | CDK6 | CDK6 | CDK6 | 14608 | -0.12 | 0.032 | NO |
| 116 | SFN | SFN | SFN | 15778 | -0.18 | -0.021 | NO |
| 117 | MAD2L2 | MAD2L2 | MAD2L2 | 15825 | -0.18 | -0.01 | NO |
| 118 | RBL2 | RBL2 | RBL2 | 16131 | -0.2 | -0.012 | NO |
| 119 | GADD45A | GADD45A | GADD45A | 16704 | -0.25 | -0.025 | NO |
| 120 | GADD45G | GADD45G | GADD45G | 16716 | -0.25 | -0.0066 | NO |
| 121 | CDKN2B | CDKN2B | CDKN2B | 16839 | -0.27 | 0.0069 | NO |
| 122 | CDC14B | CDC14B | CDC14B | 16899 | -0.28 | 0.025 | NO |
| 123 | CDKN2A | CDKN2A | CDKN2A | 17017 | -0.29 | 0.04 | NO |
Figure S59. Get High-res Image This plot shows mRNAseq_cNMF expression data heatmap (on the left) a RunningEnrichmentScore(RES) plot (on the top right) and a Signal2Noise(S2N) plot (on the bottom right) of genes in the pathway: KEGG DNA REPLICATION.
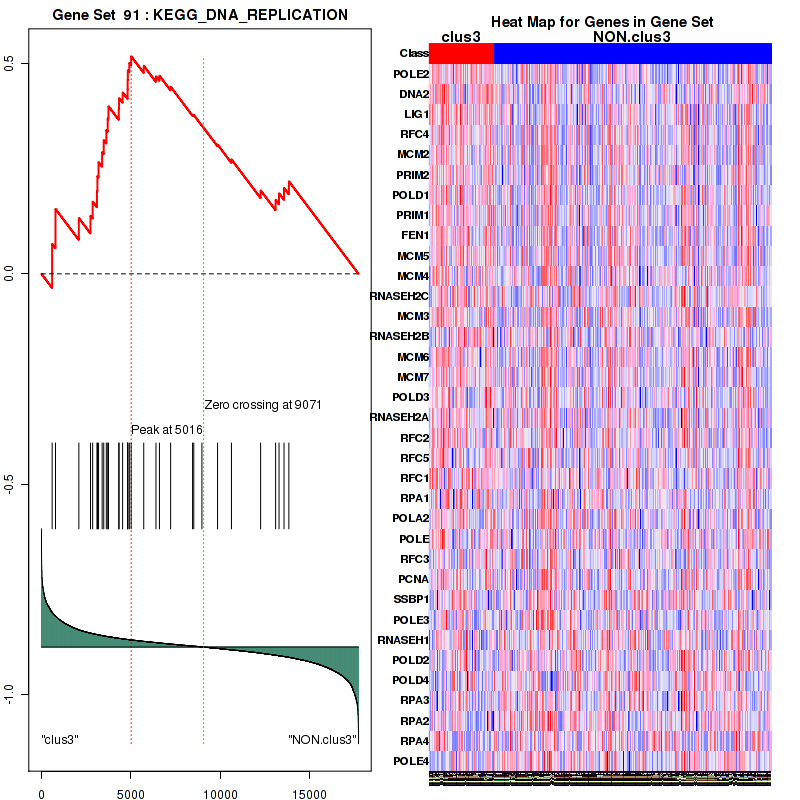
Figure S60. Get High-res Image For the top 5 core enriched genes in the pathway: KEGG DNA REPLICATION, this volcano plot shows how much they are up/down-regulated and significant. The significance was calculated by empirical bayesian fit
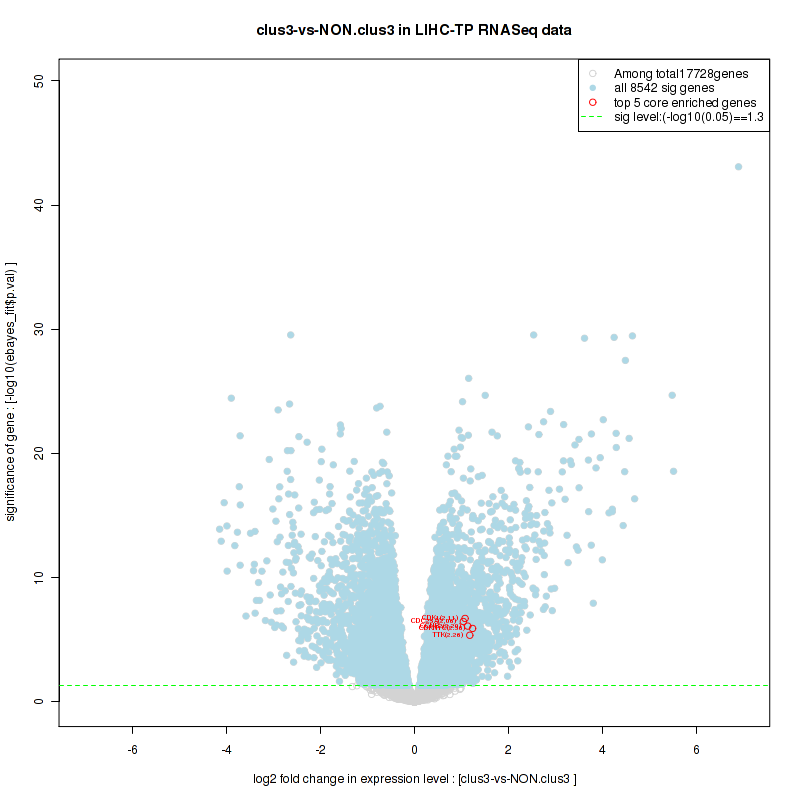
For the top enriched genes, if you want to check whether they are
-
up-regulated, please check the list of up-regulated genes
-
down-regulated, please check the list of down-regulated genes
For the top enriched genes, if you want to check whether they are
-
highly expressed genes, please check the list of high (top 30%) expressed genes
-
low expressed genes, please check the list of low (bottom 30%) expressed genes
An expression pattern of top(30%)/middle(30%)/low(30%) in this subtype against other subtypes is available in a heatmap
For the top enriched genes, if you want to check whether they are
-
significantly differently expressed genes by eBayes lm fit, please check the list of significant genes
Table 6. Get Full Table This table shows top 10 pathways which are significantly enriched in cluster clus4. It displays only significant gene sets satisfying nom.p.val.threshold (-1), fwer.p.val.threshold (-1) , fdr.q.val.threshold (0.25) and the default table is sorted by Normalized Enrichment Score (NES). Further details on NES statistics, please visit The Broad GSEA website.
| GeneSet(GS) | Size(#genes) | genes.ES.table | ES | NES | NOM.p.val | FDR.q.val | FWER.p.val | Tag.. | Gene.. | Signal | FDR..median. | glob.p.val |
|---|---|---|---|---|---|---|---|---|---|---|---|---|
| BIOCARTA NO1 PATHWAY | 28 | genes.ES.table | 0.59 | 1.5 | 0.046 | 0.093 | 0.83 | 0.46 | 0.23 | 0.36 | 0.061 | 0 |
| BIOCARTA AGR PATHWAY | 35 | genes.ES.table | 0.45 | 1.4 | 0.05 | 0.13 | 0.92 | 0.6 | 0.42 | 0.35 | 0.098 | 0 |
| BIOCARTA ALK PATHWAY | 33 | genes.ES.table | 0.5 | 1.5 | 0.051 | 0.1 | 0.87 | 0.48 | 0.3 | 0.34 | 0.072 | 0 |
| BIOCARTA BCR PATHWAY | 33 | genes.ES.table | 0.51 | 1.4 | 0.11 | 0.13 | 0.93 | 0.24 | 0.14 | 0.21 | 0.098 | 0 |
| BIOCARTA CARM ER PATHWAY | 34 | genes.ES.table | 0.34 | 1.3 | 0.18 | 0.24 | 0.99 | 0.18 | 0.27 | 0.13 | 0.2 | 0 |
| BIOCARTA HDAC PATHWAY | 26 | genes.ES.table | 0.46 | 1.4 | 0.11 | 0.14 | 0.93 | 0.15 | 0.1 | 0.14 | 0.11 | 0 |
| BIOCARTA EGF PATHWAY | 30 | genes.ES.table | 0.38 | 1.3 | 0.24 | 0.24 | 0.99 | 0.5 | 0.41 | 0.3 | 0.21 | 0 |
| BIOCARTA ERK PATHWAY | 27 | genes.ES.table | 0.53 | 1.6 | 0.028 | 0.06 | 0.67 | 0.18 | 0.11 | 0.16 | 0.035 | 0 |
| BIOCARTA FAS PATHWAY | 29 | genes.ES.table | 0.42 | 1.4 | 0.16 | 0.15 | 0.95 | 0.66 | 0.48 | 0.34 | 0.12 | 0 |
| BIOCARTA FCER1 PATHWAY | 37 | genes.ES.table | 0.61 | 1.7 | 0.012 | 0.053 | 0.56 | 0.27 | 0.12 | 0.24 | 0.026 | 0 |
Table S31. Get Full Table This table shows a Running Enrichment Score (RES) of each gene in this pathway, that is, the enrichment score at this point in the ranked list of genes. All genes are ranked by Signal-to-Noise (S2N), a measure of similarity as default and are used to obtain ES matrix of all genes. In this way, GSEA tool uses expression pattern of not only overlapped genes but also not-overlapped genes to produce ES matrix.
| Rank | GENE | SYMBOL | DESC | LIST.LOC | S2N | RES | CORE_ENRICHMENT |
|---|---|---|---|---|---|---|---|
| 1 | PRKAR2B | PRKAR2B | PRKAR2B | 475 | 0.51 | 0.029 | YES |
| 2 | ENDOD1 | ENDOD1 | ENDOD1 | 512 | 0.5 | 0.081 | YES |
| 3 | IRAK3 | IRAK3 | IRAK3 | 536 | 0.49 | 0.13 | YES |
| 4 | AKT3 | AKT3 | AKT3 | 748 | 0.44 | 0.17 | YES |
| 5 | PRKX | PRKX | PRKX | 766 | 0.44 | 0.22 | YES |
| 6 | BCL2 | BCL2 | BCL2 | 912 | 0.41 | 0.25 | YES |
| 7 | CSF2RB | CSF2RB | CSF2RB | 1163 | 0.38 | 0.28 | YES |
| 8 | IL1B | IL1B | IL1B | 1250 | 0.37 | 0.32 | YES |
| 9 | PIK3R5 | PIK3R5 | PIK3R5 | 1370 | 0.36 | 0.35 | YES |
| 10 | NGF | NGF | NGF | 1508 | 0.34 | 0.38 | YES |
| 11 | BIRC3 | BIRC3 | BIRC3 | 1774 | 0.31 | 0.39 | YES |
| 12 | TNF | TNF | TNF | 1799 | 0.31 | 0.43 | YES |
| 13 | PIK3CG | PIK3CG | PIK3CG | 1828 | 0.31 | 0.46 | YES |
| 14 | PIK3CD | PIK3CD | PIK3CD | 1884 | 0.3 | 0.49 | YES |
| 15 | TNFRSF10C | TNFRSF10C | TNFRSF10C | 2157 | 0.28 | 0.5 | YES |
| 16 | NTRK1 | NTRK1 | NTRK1 | 2427 | 0.26 | 0.52 | YES |
| 17 | PRKAR1B | PRKAR1B | PRKAR1B | 2672 | 0.24 | 0.53 | YES |
| 18 | TNFRSF10A | TNFRSF10A | TNFRSF10A | 2873 | 0.22 | 0.54 | YES |
| 19 | IL3RA | IL3RA | IL3RA | 3001 | 0.22 | 0.56 | YES |
| 20 | CAPN2 | CAPN2 | CAPN2 | 3864 | 0.16 | 0.53 | NO |
| 21 | TP53 | TP53 | TP53 | 4408 | 0.13 | 0.51 | NO |
| 22 | PIK3R3 | PIK3R3 | PIK3R3 | 4569 | 0.12 | 0.51 | NO |
| 23 | NFKB1 | NFKB1 | NFKB1 | 4811 | 0.11 | 0.51 | NO |
| 24 | PPP3CC | PPP3CC | PPP3CC | 5721 | 0.078 | 0.47 | NO |
| 25 | PPP3CA | PPP3CA | PPP3CA | 5725 | 0.078 | 0.48 | NO |
| 26 | CFLAR | CFLAR | CFLAR | 5922 | 0.072 | 0.47 | NO |
| 27 | IL1R1 | IL1R1 | IL1R1 | 5938 | 0.072 | 0.48 | NO |
| 28 | IKBKB | IKBKB | IKBKB | 5986 | 0.07 | 0.49 | NO |
| 29 | FAS | FAS | FAS | 6001 | 0.07 | 0.49 | NO |
| 30 | TRADD | TRADD | TRADD | 6045 | 0.069 | 0.5 | NO |
| 31 | CASP6 | CASP6 | CASP6 | 6081 | 0.068 | 0.5 | NO |
| 32 | CASP10 | CASP10 | CASP10 | 6611 | 0.056 | 0.48 | NO |
| 33 | CASP7 | CASP7 | CASP7 | 6615 | 0.056 | 0.49 | NO |
| 34 | TNFRSF1A | TNFRSF1A | TNFRSF1A | 6754 | 0.052 | 0.48 | NO |
| 35 | CAPN1 | CAPN1 | CAPN1 | 6755 | 0.052 | 0.49 | NO |
| 36 | IL1A | IL1A | IL1A | 6924 | 0.049 | 0.48 | NO |
| 37 | BID | BID | BID | 7073 | 0.046 | 0.48 | NO |
| 38 | BCL2L1 | BCL2L1 | BCL2L1 | 7085 | 0.045 | 0.49 | NO |
| 39 | PRKACA | PRKACA | PRKACA | 7142 | 0.044 | 0.49 | NO |
| 40 | NFKBIA | NFKBIA | NFKBIA | 7273 | 0.041 | 0.48 | NO |
| 41 | CYCS | CYCS | CYCS | 7422 | 0.038 | 0.48 | NO |
| 42 | IRAK1 | IRAK1 | IRAK1 | 7500 | 0.037 | 0.48 | NO |
| 43 | TNFRSF10B | TNFRSF10B | TNFRSF10B | 7583 | 0.036 | 0.48 | NO |
| 44 | AKT1 | AKT1 | AKT1 | 7775 | 0.032 | 0.47 | NO |
| 45 | IRAK4 | IRAK4 | IRAK4 | 7924 | 0.03 | 0.47 | NO |
| 46 | BAX | BAX | BAX | 7969 | 0.029 | 0.47 | NO |
| 47 | ATM | ATM | ATM | 7989 | 0.029 | 0.47 | NO |
| 48 | BAD | BAD | BAD | 8004 | 0.029 | 0.47 | NO |
| 49 | PIK3CA | PIK3CA | PIK3CA | 8136 | 0.026 | 0.47 | NO |
| 50 | CHP | CHP | CHP | 8154 | 0.026 | 0.47 | NO |
| 51 | PPP3CB | PPP3CB | PPP3CB | 8192 | 0.026 | 0.47 | NO |
| 52 | FADD | FADD | FADD | 8409 | 0.023 | 0.46 | NO |
| 53 | XIAP | XIAP | XIAP | 8458 | 0.022 | 0.46 | NO |
| 54 | CASP8 | CASP8 | CASP8 | 8991 | 0.014 | 0.43 | NO |
| 55 | IL1RAP | IL1RAP | IL1RAP | 9056 | 0.013 | 0.43 | NO |
| 56 | DFFB | DFFB | DFFB | 9593 | 0.0066 | 0.4 | NO |
| 57 | AIFM1 | AIFM1 | AIFM1 | 9599 | 0.0066 | 0.4 | NO |
| 58 | MAP3K14 | MAP3K14 | MAP3K14 | 9628 | 0.0061 | 0.4 | NO |
| 59 | IKBKG | IKBKG | IKBKG | 9663 | 0.0055 | 0.4 | NO |
| 60 | PIK3CB | PIK3CB | PIK3CB | 9781 | 0.0041 | 0.39 | NO |
| 61 | CHP2 | CHP2 | CHP2 | 9981 | 0.0016 | 0.38 | NO |
| 62 | CHUK | CHUK | CHUK | 10385 | -0.003 | 0.36 | NO |
| 63 | CASP3 | CASP3 | CASP3 | 10465 | -0.0041 | 0.35 | NO |
| 64 | TRAF2 | TRAF2 | TRAF2 | 10663 | -0.0065 | 0.34 | NO |
| 65 | APAF1 | APAF1 | APAF1 | 10809 | -0.0082 | 0.34 | NO |
| 66 | PRKACB | PRKACB | PRKACB | 10812 | -0.0082 | 0.34 | NO |
| 67 | PRKAR1A | PRKAR1A | PRKAR1A | 10918 | -0.0096 | 0.33 | NO |
| 68 | RELA | RELA | RELA | 11131 | -0.012 | 0.32 | NO |
| 69 | TNFRSF10D | TNFRSF10D | TNFRSF10D | 11488 | -0.016 | 0.3 | NO |
| 70 | RIPK1 | RIPK1 | RIPK1 | 11493 | -0.017 | 0.3 | NO |
| 71 | DFFA | DFFA | DFFA | 11507 | -0.017 | 0.31 | NO |
| 72 | PIK3R2 | PIK3R2 | PIK3R2 | 11746 | -0.02 | 0.29 | NO |
| 73 | TNFSF10 | TNFSF10 | TNFSF10 | 11893 | -0.022 | 0.29 | NO |
| 74 | EXOG | EXOG | EXOG | 12035 | -0.024 | 0.28 | NO |
| 75 | BIRC2 | BIRC2 | BIRC2 | 12209 | -0.026 | 0.28 | NO |
| 76 | AKT2 | AKT2 | AKT2 | 12348 | -0.028 | 0.27 | NO |
| 77 | IRAK2 | IRAK2 | IRAK2 | 12372 | -0.028 | 0.27 | NO |
| 78 | PPP3R1 | PPP3R1 | PPP3R1 | 12388 | -0.028 | 0.28 | NO |
| 79 | MYD88 | MYD88 | MYD88 | 12856 | -0.034 | 0.25 | NO |
| 80 | CASP9 | CASP9 | CASP9 | 13049 | -0.037 | 0.24 | NO |
| 81 | ENDOG | ENDOG | ENDOG | 13227 | -0.04 | 0.24 | NO |
| 82 | PIK3R1 | PIK3R1 | PIK3R1 | 14760 | -0.07 | 0.16 | NO |
| 83 | PRKAR2A | PRKAR2A | PRKAR2A | 14856 | -0.072 | 0.16 | NO |
Figure S61. Get High-res Image This plot shows mRNAseq_cNMF expression data heatmap (on the left) a RunningEnrichmentScore(RES) plot (on the top right) and a Signal2Noise(S2N) plot (on the bottom right) of genes in the pathway: BIOCARTA NO1 PATHWAY.
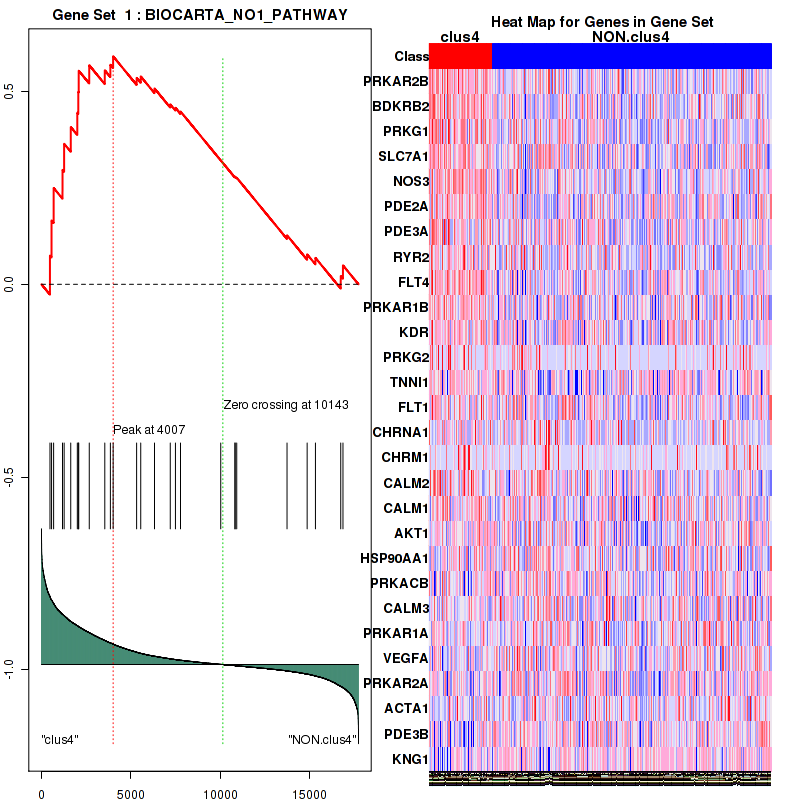
Figure S62. Get High-res Image For the top 5 core enriched genes in the pathway: BIOCARTA NO1 PATHWAY, this volcano plot shows how much they are up/down-regulated and significant. The significance was calculated by empirical bayesian fit
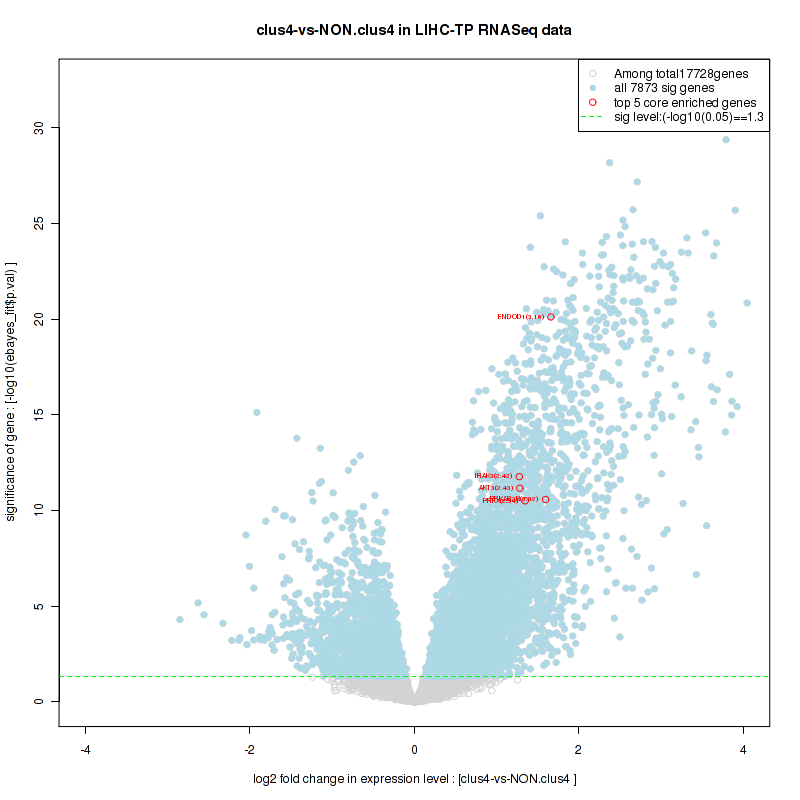
Table S32. Get Full Table This table shows a Running Enrichment Score (RES) of each gene in this pathway, that is, the enrichment score at this point in the ranked list of genes. All genes are ranked by Signal-to-Noise (S2N), a measure of similarity as default and are used to obtain ES matrix of all genes. In this way, GSEA tool uses expression pattern of not only overlapped genes but also not-overlapped genes to produce ES matrix.
| Rank | GENE | SYMBOL | DESC | LIST.LOC | S2N | RES | CORE_ENRICHMENT |
|---|---|---|---|---|---|---|---|
| 1 | PRICKLE1 | PRICKLE1 | PRICKLE1 | 14 | 0.84 | 0.033 | YES |
| 2 | SFRP4 | SFRP4 | SFRP4 | 61 | 0.73 | 0.059 | YES |
| 3 | SFRP1 | SFRP1 | SFRP1 | 98 | 0.7 | 0.085 | YES |
| 4 | MAPK10 | MAPK10 | MAPK10 | 102 | 0.7 | 0.11 | YES |
| 5 | WNT4 | WNT4 | WNT4 | 162 | 0.65 | 0.14 | YES |
| 6 | WNT2 | WNT2 | WNT2 | 171 | 0.64 | 0.16 | YES |
| 7 | DKK2 | DKK2 | DKK2 | 180 | 0.64 | 0.18 | YES |
| 8 | FZD2 | FZD2 | FZD2 | 198 | 0.63 | 0.21 | YES |
| 9 | MMP7 | MMP7 | MMP7 | 264 | 0.59 | 0.23 | YES |
| 10 | NKD2 | NKD2 | NKD2 | 298 | 0.57 | 0.25 | YES |
| 11 | WNT2B | WNT2B | WNT2B | 315 | 0.56 | 0.27 | YES |
| 12 | PLCB4 | PLCB4 | PLCB4 | 362 | 0.54 | 0.29 | YES |
| 13 | FZD10 | FZD10 | FZD10 | 377 | 0.54 | 0.31 | YES |
| 14 | SFRP5 | SFRP5 | SFRP5 | 478 | 0.51 | 0.32 | YES |
| 15 | VANGL2 | VANGL2 | VANGL2 | 497 | 0.5 | 0.34 | YES |
| 16 | NFATC1 | NFATC1 | NFATC1 | 575 | 0.48 | 0.36 | YES |
| 17 | WNT10A | WNT10A | WNT10A | 605 | 0.48 | 0.38 | YES |
| 18 | FZD1 | FZD1 | FZD1 | 695 | 0.46 | 0.39 | YES |
| 19 | WNT9A | WNT9A | WNT9A | 702 | 0.45 | 0.41 | YES |
| 20 | FZD7 | FZD7 | FZD7 | 713 | 0.45 | 0.42 | YES |
| 21 | FZD8 | FZD8 | FZD8 | 729 | 0.45 | 0.44 | YES |
| 22 | PRKX | PRKX | PRKX | 766 | 0.44 | 0.46 | YES |
| 23 | CTBP2 | CTBP2 | CTBP2 | 868 | 0.42 | 0.47 | YES |
| 24 | SFRP2 | SFRP2 | SFRP2 | 893 | 0.42 | 0.48 | YES |
| 25 | WNT10B | WNT10B | WNT10B | 901 | 0.41 | 0.5 | YES |
| 26 | PRICKLE2 | PRICKLE2 | PRICKLE2 | 930 | 0.41 | 0.51 | YES |
| 27 | WNT7B | WNT7B | WNT7B | 1003 | 0.4 | 0.52 | YES |
| 28 | SOX17 | SOX17 | SOX17 | 1102 | 0.39 | 0.54 | YES |
| 29 | NFATC4 | NFATC4 | NFATC4 | 1297 | 0.36 | 0.54 | YES |
| 30 | CCND2 | CCND2 | CCND2 | 1353 | 0.36 | 0.55 | YES |
| 31 | PRKCB | PRKCB | PRKCB | 1538 | 0.33 | 0.55 | YES |
| 32 | PLCB2 | PLCB2 | PLCB2 | 1612 | 0.33 | 0.56 | YES |
| 33 | FOSL1 | FOSL1 | FOSL1 | 1633 | 0.32 | 0.57 | YES |
| 34 | RAC2 | RAC2 | RAC2 | 1875 | 0.3 | 0.57 | YES |
| 35 | WNT7A | WNT7A | WNT7A | 1877 | 0.3 | 0.58 | YES |
| 36 | WNT11 | WNT11 | WNT11 | 2070 | 0.28 | 0.58 | YES |
| 37 | WNT1 | WNT1 | WNT1 | 2139 | 0.28 | 0.59 | YES |
| 38 | LEF1 | LEF1 | LEF1 | 2213 | 0.27 | 0.6 | YES |
| 39 | WNT3A | WNT3A | WNT3A | 2845 | 0.23 | 0.57 | NO |
| 40 | CAMK2A | CAMK2A | CAMK2A | 3350 | 0.19 | 0.55 | NO |
| 41 | FZD6 | FZD6 | FZD6 | 3357 | 0.19 | 0.56 | NO |
| 42 | WNT9B | WNT9B | WNT9B | 3585 | 0.18 | 0.55 | NO |
| 43 | WNT6 | WNT6 | WNT6 | 3803 | 0.16 | 0.55 | NO |
| 44 | FZD3 | FZD3 | FZD3 | 3841 | 0.16 | 0.55 | NO |
| 45 | MYC | MYC | MYC | 3924 | 0.16 | 0.55 | NO |
| 46 | CAMK2B | CAMK2B | CAMK2B | 4018 | 0.15 | 0.55 | NO |
| 47 | APC2 | APC2 | APC2 | 4125 | 0.15 | 0.55 | NO |
| 48 | TP53 | TP53 | TP53 | 4408 | 0.13 | 0.54 | NO |
| 49 | CCND3 | CCND3 | CCND3 | 4612 | 0.12 | 0.53 | NO |
| 50 | CCND1 | CCND1 | CCND1 | 4814 | 0.11 | 0.53 | NO |
| 51 | WNT16 | WNT16 | WNT16 | 4844 | 0.11 | 0.53 | NO |
| 52 | NFATC2 | NFATC2 | NFATC2 | 4845 | 0.11 | 0.53 | NO |
| 53 | VANGL1 | VANGL1 | VANGL1 | 5031 | 0.1 | 0.53 | NO |
| 54 | PORCN | PORCN | PORCN | 5043 | 0.1 | 0.53 | NO |
| 55 | AXIN1 | AXIN1 | AXIN1 | 5274 | 0.094 | 0.52 | NO |
| 56 | PPARD | PPARD | PPARD | 5458 | 0.087 | 0.52 | NO |
| 57 | PPP2CB | PPP2CB | PPP2CB | 5634 | 0.081 | 0.51 | NO |
| 58 | PPP3CC | PPP3CC | PPP3CC | 5721 | 0.078 | 0.51 | NO |
| 59 | PPP3CA | PPP3CA | PPP3CA | 5725 | 0.078 | 0.51 | NO |
| 60 | PLCB3 | PLCB3 | PLCB3 | 5773 | 0.077 | 0.51 | NO |
| 61 | PPP2R5E | PPP2R5E | PPP2R5E | 5912 | 0.073 | 0.5 | NO |
| 62 | FBXW11 | FBXW11 | FBXW11 | 6207 | 0.065 | 0.49 | NO |
| 63 | CSNK1E | CSNK1E | CSNK1E | 6271 | 0.063 | 0.49 | NO |
| 64 | NFAT5 | NFAT5 | NFAT5 | 6319 | 0.062 | 0.49 | NO |
| 65 | DAAM1 | DAAM1 | DAAM1 | 6346 | 0.061 | 0.49 | NO |
| 66 | PPP2R1A | PPP2R1A | PPP2R1A | 6792 | 0.051 | 0.47 | NO |
| 67 | DAAM2 | DAAM2 | DAAM2 | 6813 | 0.051 | 0.47 | NO |
| 68 | SMAD2 | SMAD2 | SMAD2 | 6912 | 0.049 | 0.46 | NO |
| 69 | PRKACA | PRKACA | PRKACA | 7142 | 0.044 | 0.45 | NO |
| 70 | RAC1 | RAC1 | RAC1 | 7148 | 0.044 | 0.46 | NO |
| 71 | FZD4 | FZD4 | FZD4 | 7183 | 0.043 | 0.46 | NO |
| 72 | WNT5A | WNT5A | WNT5A | 7279 | 0.041 | 0.45 | NO |
| 73 | CAMK2D | CAMK2D | CAMK2D | 7283 | 0.041 | 0.45 | NO |
| 74 | WNT5B | WNT5B | WNT5B | 7290 | 0.041 | 0.45 | NO |
| 75 | SKP1 | SKP1 | SKP1 | 7885 | 0.03 | 0.42 | NO |
| 76 | ROCK1 | ROCK1 | ROCK1 | 7930 | 0.03 | 0.42 | NO |
| 77 | CSNK1A1 | CSNK1A1 | CSNK1A1 | 7949 | 0.03 | 0.42 | NO |
| 78 | APC | APC | APC | 8023 | 0.028 | 0.42 | NO |
| 79 | CHP | CHP | CHP | 8154 | 0.026 | 0.41 | NO |
| 80 | PPP3CB | PPP3CB | PPP3CB | 8192 | 0.026 | 0.41 | NO |
| 81 | JUN | JUN | JUN | 8506 | 0.021 | 0.39 | NO |
| 82 | CSNK2A1 | CSNK2A1 | CSNK2A1 | 8629 | 0.02 | 0.39 | NO |
| 83 | SIAH1 | SIAH1 | SIAH1 | 8709 | 0.018 | 0.38 | NO |
| 84 | MAPK9 | MAPK9 | MAPK9 | 8780 | 0.017 | 0.38 | NO |
| 85 | TBL1XR1 | TBL1XR1 | TBL1XR1 | 9048 | 0.013 | 0.36 | NO |
| 86 | PSEN1 | PSEN1 | PSEN1 | 9126 | 0.012 | 0.36 | NO |
| 87 | TCF7L2 | TCF7L2 | TCF7L2 | 9172 | 0.012 | 0.36 | NO |
| 88 | MAPK8 | MAPK8 | MAPK8 | 9184 | 0.012 | 0.36 | NO |
| 89 | RHOA | RHOA | RHOA | 9253 | 0.011 | 0.36 | NO |
| 90 | CSNK2A2 | CSNK2A2 | CSNK2A2 | 9394 | 0.009 | 0.35 | NO |
| 91 | RBX1 | RBX1 | RBX1 | 9482 | 0.0079 | 0.34 | NO |
| 92 | CAMK2G | CAMK2G | CAMK2G | 9541 | 0.0072 | 0.34 | NO |
| 93 | CREBBP | CREBBP | CREBBP | 9648 | 0.0058 | 0.33 | NO |
| 94 | BTRC | BTRC | BTRC | 9979 | 0.0016 | 0.32 | NO |
| 95 | CHP2 | CHP2 | CHP2 | 9981 | 0.0016 | 0.32 | NO |
| 96 | RUVBL1 | RUVBL1 | RUVBL1 | 10139 | 0.000041 | 0.31 | NO |
| 97 | SMAD3 | SMAD3 | SMAD3 | 10237 | -0.0012 | 0.3 | NO |
| 98 | CTBP1 | CTBP1 | CTBP1 | 10395 | -0.0031 | 0.29 | NO |
| 99 | PPP2R5C | PPP2R5C | PPP2R5C | 10424 | -0.0035 | 0.29 | NO |
| 100 | PPP2CA | PPP2CA | PPP2CA | 10592 | -0.0057 | 0.28 | NO |
| 101 | TCF7L1 | TCF7L1 | TCF7L1 | 10620 | -0.006 | 0.28 | NO |
| 102 | FZD9 | FZD9 | FZD9 | 10675 | -0.0067 | 0.28 | NO |
| 103 | WNT3 | WNT3 | WNT3 | 10734 | -0.0072 | 0.27 | NO |
| 104 | PRKACB | PRKACB | PRKACB | 10812 | -0.0082 | 0.27 | NO |
| 105 | LRP5 | LRP5 | LRP5 | 10843 | -0.0087 | 0.27 | NO |
| 106 | CUL1 | CUL1 | CUL1 | 10947 | -0.0099 | 0.26 | NO |
| 107 | CHD8 | CHD8 | CHD8 | 11055 | -0.011 | 0.26 | NO |
| 108 | SMAD4 | SMAD4 | SMAD4 | 11225 | -0.013 | 0.25 | NO |
| 109 | DVL3 | DVL3 | DVL3 | 11435 | -0.016 | 0.24 | NO |
| 110 | AXIN2 | AXIN2 | AXIN2 | 11458 | -0.016 | 0.24 | NO |
| 111 | EP300 | EP300 | EP300 | 11540 | -0.017 | 0.23 | NO |
| 112 | GSK3B | GSK3B | GSK3B | 11610 | -0.018 | 0.23 | NO |
| 113 | PPP2R1B | PPP2R1B | PPP2R1B | 12056 | -0.024 | 0.2 | NO |
| 114 | PPP3R1 | PPP3R1 | PPP3R1 | 12388 | -0.028 | 0.19 | NO |
| 115 | DVL1 | DVL1 | DVL1 | 12659 | -0.032 | 0.17 | NO |
| 116 | MAP3K7 | MAP3K7 | MAP3K7 | 12693 | -0.032 | 0.17 | NO |
| 117 | PRKCG | PRKCG | PRKCG | 12717 | -0.032 | 0.17 | NO |
| 118 | DVL2 | DVL2 | DVL2 | 12767 | -0.033 | 0.17 | NO |
| 119 | CTNNB1 | CTNNB1 | CTNNB1 | 12896 | -0.035 | 0.16 | NO |
| 120 | FRAT2 | FRAT2 | FRAT2 | 13094 | -0.038 | 0.16 | NO |
| 121 | LRP6 | LRP6 | LRP6 | 13144 | -0.038 | 0.15 | NO |
| 122 | NFATC3 | NFATC3 | NFATC3 | 13325 | -0.041 | 0.15 | NO |
| 123 | CSNK1A1L | CSNK1A1L | CSNK1A1L | 13468 | -0.043 | 0.14 | NO |
| 124 | ROCK2 | ROCK2 | ROCK2 | 13528 | -0.044 | 0.14 | NO |
| 125 | PPP2R5A | PPP2R5A | PPP2R5A | 13662 | -0.047 | 0.13 | NO |
| 126 | NLK | NLK | NLK | 13680 | -0.047 | 0.13 | NO |
| 127 | CACYBP | CACYBP | CACYBP | 13906 | -0.051 | 0.12 | NO |
| 128 | DKK1 | DKK1 | DKK1 | 14104 | -0.055 | 0.11 | NO |
| 129 | TBL1X | TBL1X | TBL1X | 14774 | -0.07 | 0.078 | NO |
| 130 | CSNK2B | CSNK2B | CSNK2B | 14910 | -0.073 | 0.073 | NO |
| 131 | CXXC4 | CXXC4 | CXXC4 | 14924 | -0.073 | 0.075 | NO |
| 132 | SENP2 | SENP2 | SENP2 | 15004 | -0.076 | 0.074 | NO |
| 133 | FZD5 | FZD5 | FZD5 | 15131 | -0.08 | 0.07 | NO |
| 134 | FRAT1 | FRAT1 | FRAT1 | 15184 | -0.081 | 0.07 | NO |
| 135 | PPP2R5D | PPP2R5D | PPP2R5D | 15205 | -0.082 | 0.072 | NO |
| 136 | PRKCA | PRKCA | PRKCA | 15772 | -0.1 | 0.044 | NO |
| 137 | CTNNBIP1 | CTNNBIP1 | CTNNBIP1 | 15867 | -0.11 | 0.043 | NO |
| 138 | PLCB1 | PLCB1 | PLCB1 | 16037 | -0.12 | 0.038 | NO |
| 139 | DKK4 | DKK4 | DKK4 | 16334 | -0.14 | 0.027 | NO |
| 140 | TBL1Y | TBL1Y | TBL1Y | 16446 | -0.14 | 0.026 | NO |
| 141 | NKD1 | NKD1 | NKD1 | 16488 | -0.15 | 0.029 | NO |
| 142 | WNT8B | WNT8B | WNT8B | 17064 | -0.19 | 0.0044 | NO |
| 143 | TCF7 | TCF7 | TCF7 | 17245 | -0.22 | 0.0029 | NO |
| 144 | WIF1 | WIF1 | WIF1 | 17569 | -0.3 | -0.0038 | NO |
| 145 | RAC3 | RAC3 | RAC3 | 17620 | -0.32 | 0.0061 | NO |
Figure S63. Get High-res Image This plot shows mRNAseq_cNMF expression data heatmap (on the left) a RunningEnrichmentScore(RES) plot (on the top right) and a Signal2Noise(S2N) plot (on the bottom right) of genes in the pathway: BIOCARTA AGR PATHWAY.
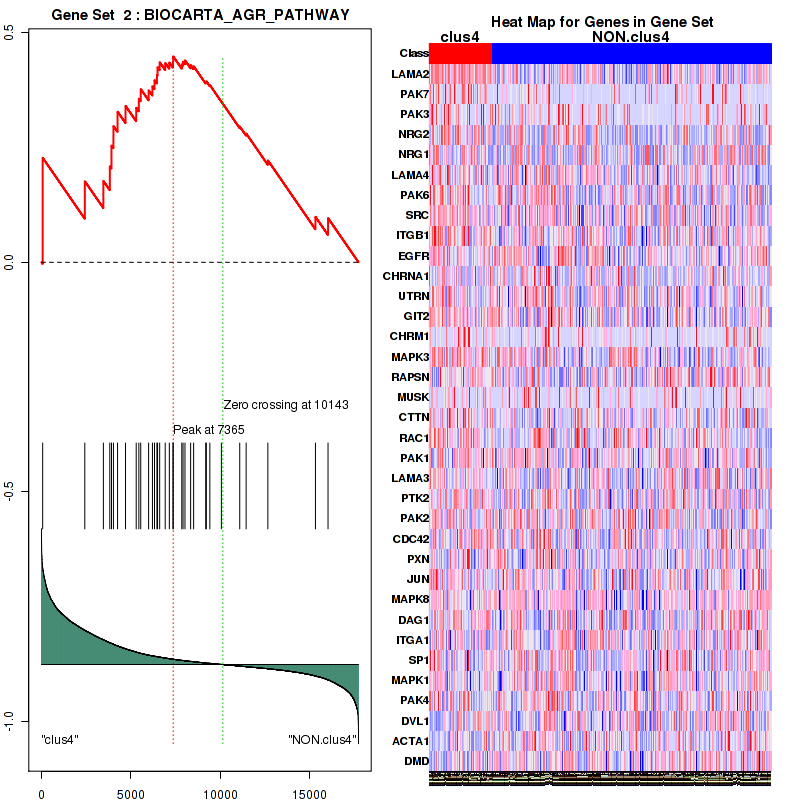
Figure S64. Get High-res Image For the top 5 core enriched genes in the pathway: BIOCARTA AGR PATHWAY, this volcano plot shows how much they are up/down-regulated and significant. The significance was calculated by empirical bayesian fit

Table S33. Get Full Table This table shows a Running Enrichment Score (RES) of each gene in this pathway, that is, the enrichment score at this point in the ranked list of genes. All genes are ranked by Signal-to-Noise (S2N), a measure of similarity as default and are used to obtain ES matrix of all genes. In this way, GSEA tool uses expression pattern of not only overlapped genes but also not-overlapped genes to produce ES matrix.
| Rank | GENE | SYMBOL | DESC | LIST.LOC | S2N | RES | CORE_ENRICHMENT |
|---|---|---|---|---|---|---|---|
| 1 | MAPK10 | MAPK10 | MAPK10 | 102 | 0.7 | 0.08 | YES |
| 2 | CXCL1 | CXCL1 | CXCL1 | 468 | 0.51 | 0.12 | YES |
| 3 | JAM2 | JAM2 | JAM2 | 545 | 0.49 | 0.18 | YES |
| 4 | IL8 | IL8 | IL8 | 631 | 0.47 | 0.23 | YES |
| 5 | PTPRZ1 | PTPRZ1 | PTPRZ1 | 883 | 0.42 | 0.27 | YES |
| 6 | CXCR2 | CXCR2 | CXCR2 | 993 | 0.4 | 0.31 | YES |
| 7 | IGSF5 | IGSF5 | IGSF5 | 1754 | 0.31 | 0.31 | YES |
| 8 | JAM3 | JAM3 | JAM3 | 1860 | 0.3 | 0.34 | YES |
| 9 | CXCR1 | CXCR1 | CXCR1 | 1866 | 0.3 | 0.37 | YES |
| 10 | MAPK12 | MAPK12 | MAPK12 | 1899 | 0.3 | 0.41 | YES |
| 11 | MAPK11 | MAPK11 | MAPK11 | 2005 | 0.29 | 0.44 | YES |
| 12 | ATP6V1B1 | ATP6V1B1 | ATP6V1B1 | 2846 | 0.23 | 0.42 | YES |
| 13 | CCL5 | CCL5 | CCL5 | 2848 | 0.23 | 0.45 | YES |
| 14 | HBEGF | HBEGF | HBEGF | 2975 | 0.22 | 0.47 | YES |
| 15 | MAPK13 | MAPK13 | MAPK13 | 3056 | 0.21 | 0.49 | YES |
| 16 | NOD1 | NOD1 | NOD1 | 3460 | 0.19 | 0.49 | YES |
| 17 | LYN | LYN | LYN | 3620 | 0.18 | 0.5 | YES |
| 18 | ATP6V0D2 | ATP6V0D2 | ATP6V0D2 | 4052 | 0.15 | 0.49 | YES |
| 19 | ADAM17 | ADAM17 | ADAM17 | 4316 | 0.14 | 0.5 | YES |
| 20 | PLCG2 | PLCG2 | PLCG2 | 4644 | 0.12 | 0.49 | YES |
| 21 | ATP6V1H | ATP6V1H | ATP6V1H | 4656 | 0.12 | 0.51 | YES |
| 22 | SRC | SRC | SRC | 4700 | 0.12 | 0.52 | YES |
| 23 | NFKB1 | NFKB1 | NFKB1 | 4811 | 0.11 | 0.53 | YES |
| 24 | TCIRG1 | TCIRG1 | TCIRG1 | 4847 | 0.11 | 0.54 | YES |
| 25 | EGFR | EGFR | EGFR | 5445 | 0.088 | 0.52 | NO |
| 26 | ATP6V1E2 | ATP6V1E2 | ATP6V1E2 | 5446 | 0.088 | 0.53 | NO |
| 27 | ADAM10 | ADAM10 | ADAM10 | 5579 | 0.083 | 0.53 | NO |
| 28 | IKBKB | IKBKB | IKBKB | 5986 | 0.07 | 0.51 | NO |
| 29 | GIT1 | GIT1 | GIT1 | 6114 | 0.067 | 0.52 | NO |
| 30 | F11R | F11R | F11R | 6149 | 0.066 | 0.52 | NO |
| 31 | ATP6V1B2 | ATP6V1B2 | ATP6V1B2 | 6174 | 0.066 | 0.53 | NO |
| 32 | ATP6V0D1 | ATP6V0D1 | ATP6V0D1 | 6509 | 0.058 | 0.52 | NO |
| 33 | TJP1 | TJP1 | TJP1 | 6765 | 0.052 | 0.51 | NO |
| 34 | ATP6V1E1 | ATP6V1E1 | ATP6V1E1 | 6944 | 0.048 | 0.5 | NO |
| 35 | ATP6V1F | ATP6V1F | ATP6V1F | 7028 | 0.047 | 0.5 | NO |
| 36 | RAC1 | RAC1 | RAC1 | 7148 | 0.044 | 0.5 | NO |
| 37 | MAP2K4 | MAP2K4 | MAP2K4 | 7250 | 0.042 | 0.5 | NO |
| 38 | NFKBIA | NFKBIA | NFKBIA | 7273 | 0.041 | 0.51 | NO |
| 39 | ATP6V0C | ATP6V0C | ATP6V0C | 7342 | 0.04 | 0.51 | NO |
| 40 | PAK1 | PAK1 | PAK1 | 7355 | 0.04 | 0.51 | NO |
| 41 | ATP6V1C1 | ATP6V1C1 | ATP6V1C1 | 7418 | 0.039 | 0.51 | NO |
| 42 | ATP6V0B | ATP6V0B | ATP6V0B | 7477 | 0.037 | 0.52 | NO |
| 43 | ATP6V1D | ATP6V1D | ATP6V1D | 7803 | 0.032 | 0.5 | NO |
| 44 | CDC42 | CDC42 | CDC42 | 8025 | 0.028 | 0.49 | NO |
| 45 | ATP6V1G2 | ATP6V1G2 | ATP6V1G2 | 8114 | 0.027 | 0.49 | NO |
| 46 | ATP6V0A4 | ATP6V0A4 | ATP6V0A4 | 8263 | 0.025 | 0.48 | NO |
| 47 | JUN | JUN | JUN | 8506 | 0.021 | 0.47 | NO |
| 48 | ATP6V1A | ATP6V1A | ATP6V1A | 8524 | 0.021 | 0.48 | NO |
| 49 | MAPK9 | MAPK9 | MAPK9 | 8780 | 0.017 | 0.46 | NO |
| 50 | ATP6V1G1 | ATP6V1G1 | ATP6V1G1 | 9165 | 0.012 | 0.44 | NO |
| 51 | MAPK8 | MAPK8 | MAPK8 | 9184 | 0.012 | 0.44 | NO |
| 52 | ATP6V0A1 | ATP6V0A1 | ATP6V0A1 | 9203 | 0.011 | 0.44 | NO |
| 53 | MAP3K14 | MAP3K14 | MAP3K14 | 9628 | 0.0061 | 0.42 | NO |
| 54 | IKBKG | IKBKG | IKBKG | 9663 | 0.0055 | 0.42 | NO |
| 55 | CSK | CSK | CSK | 9715 | 0.0049 | 0.42 | NO |
| 56 | CHUK | CHUK | CHUK | 10385 | -0.003 | 0.38 | NO |
| 57 | CASP3 | CASP3 | CASP3 | 10465 | -0.0041 | 0.38 | NO |
| 58 | ATP6AP1 | ATP6AP1 | ATP6AP1 | 10715 | -0.007 | 0.36 | NO |
| 59 | PTPN11 | PTPN11 | PTPN11 | 10976 | -0.01 | 0.35 | NO |
| 60 | RELA | RELA | RELA | 11131 | -0.012 | 0.34 | NO |
| 61 | PLCG1 | PLCG1 | PLCG1 | 11593 | -0.018 | 0.32 | NO |
| 62 | ATP6V1C2 | ATP6V1C2 | ATP6V1C2 | 11990 | -0.023 | 0.3 | NO |
| 63 | MAPK14 | MAPK14 | MAPK14 | 12885 | -0.035 | 0.25 | NO |
| 64 | ATP6V0A2 | ATP6V0A2 | ATP6V0A2 | 13112 | -0.038 | 0.24 | NO |
| 65 | ATP6V0E2 | ATP6V0E2 | ATP6V0E2 | 14276 | -0.059 | 0.18 | NO |
| 66 | MET | MET | MET | 15509 | -0.093 | 0.13 | NO |
Figure S65. Get High-res Image This plot shows mRNAseq_cNMF expression data heatmap (on the left) a RunningEnrichmentScore(RES) plot (on the top right) and a Signal2Noise(S2N) plot (on the bottom right) of genes in the pathway: BIOCARTA ALK PATHWAY.
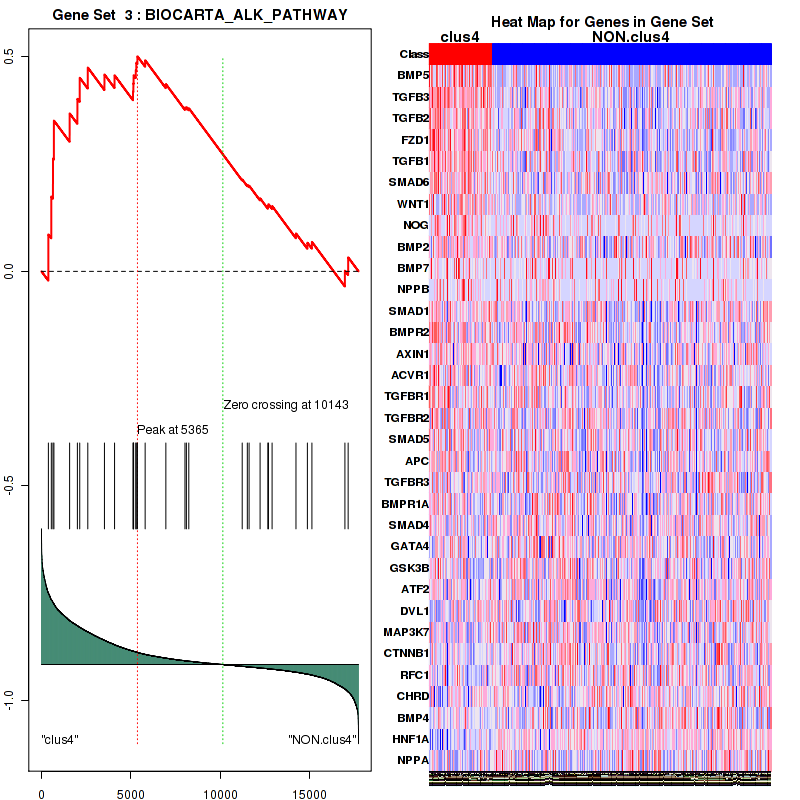
Figure S66. Get High-res Image For the top 5 core enriched genes in the pathway: BIOCARTA ALK PATHWAY, this volcano plot shows how much they are up/down-regulated and significant. The significance was calculated by empirical bayesian fit
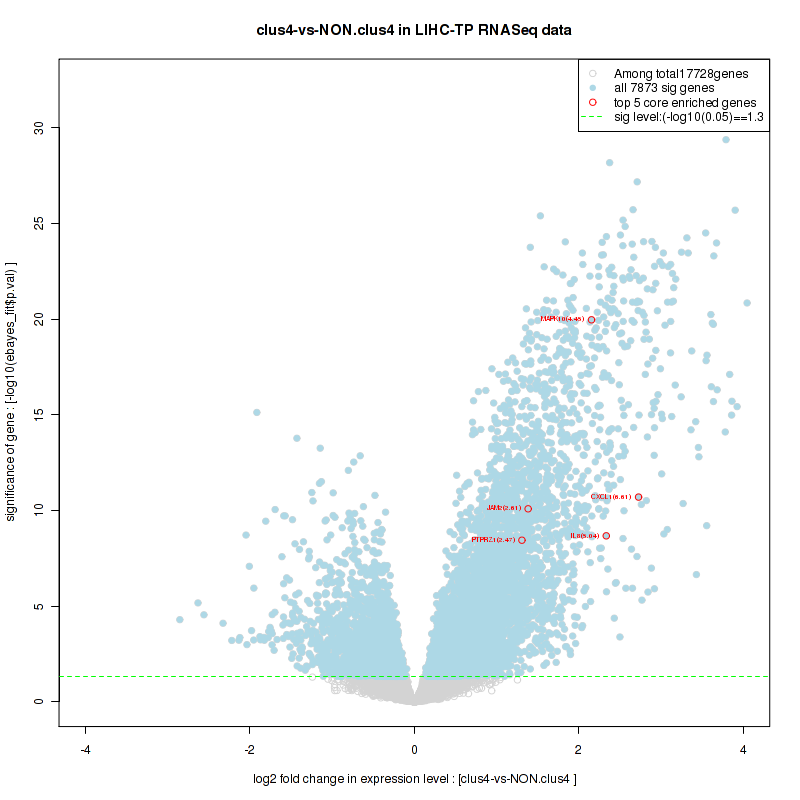
Table S34. Get Full Table This table shows a Running Enrichment Score (RES) of each gene in this pathway, that is, the enrichment score at this point in the ranked list of genes. All genes are ranked by Signal-to-Noise (S2N), a measure of similarity as default and are used to obtain ES matrix of all genes. In this way, GSEA tool uses expression pattern of not only overlapped genes but also not-overlapped genes to produce ES matrix.
| Rank | GENE | SYMBOL | DESC | LIST.LOC | S2N | RES | CORE_ENRICHMENT |
|---|---|---|---|---|---|---|---|
| 1 | SFRP4 | SFRP4 | SFRP4 | 61 | 0.73 | 0.047 | YES |
| 2 | SFRP1 | SFRP1 | SFRP1 | 98 | 0.7 | 0.093 | YES |
| 3 | WNT4 | WNT4 | WNT4 | 162 | 0.65 | 0.13 | YES |
| 4 | WNT2 | WNT2 | WNT2 | 171 | 0.64 | 0.18 | YES |
| 5 | FZD2 | FZD2 | FZD2 | 198 | 0.63 | 0.22 | YES |
| 6 | WNT2B | WNT2B | WNT2B | 315 | 0.56 | 0.25 | YES |
| 7 | WISP1 | WISP1 | WISP1 | 327 | 0.56 | 0.29 | YES |
| 8 | WNT10A | WNT10A | WNT10A | 605 | 0.48 | 0.31 | YES |
| 9 | FRZB | FRZB | FRZB | 609 | 0.47 | 0.34 | YES |
| 10 | FZD1 | FZD1 | FZD1 | 695 | 0.46 | 0.37 | YES |
| 11 | WNT9A | WNT9A | WNT9A | 702 | 0.45 | 0.4 | YES |
| 12 | FZD7 | FZD7 | FZD7 | 713 | 0.45 | 0.43 | YES |
| 13 | FZD8 | FZD8 | FZD8 | 729 | 0.45 | 0.46 | YES |
| 14 | CTBP2 | CTBP2 | CTBP2 | 868 | 0.42 | 0.48 | YES |
| 15 | PYGO1 | PYGO1 | PYGO1 | 990 | 0.4 | 0.5 | YES |
| 16 | WNT7B | WNT7B | WNT7B | 1003 | 0.4 | 0.53 | YES |
| 17 | SOX17 | SOX17 | SOX17 | 1102 | 0.39 | 0.55 | YES |
| 18 | CCND2 | CCND2 | CCND2 | 1353 | 0.36 | 0.56 | YES |
| 19 | FOSL1 | FOSL1 | FOSL1 | 1633 | 0.32 | 0.56 | YES |
| 20 | WNT7A | WNT7A | WNT7A | 1877 | 0.3 | 0.57 | YES |
| 21 | WNT11 | WNT11 | WNT11 | 2070 | 0.28 | 0.58 | YES |
| 22 | WNT1 | WNT1 | WNT1 | 2139 | 0.28 | 0.6 | YES |
| 23 | LEF1 | LEF1 | LEF1 | 2213 | 0.27 | 0.61 | YES |
| 24 | FZD6 | FZD6 | FZD6 | 3357 | 0.19 | 0.56 | NO |
| 25 | WNT6 | WNT6 | WNT6 | 3803 | 0.16 | 0.55 | NO |
| 26 | FZD3 | FZD3 | FZD3 | 3841 | 0.16 | 0.55 | NO |
| 27 | MYC | MYC | MYC | 3924 | 0.16 | 0.56 | NO |
| 28 | CCND3 | CCND3 | CCND3 | 4612 | 0.12 | 0.53 | NO |
| 29 | CCND1 | CCND1 | CCND1 | 4814 | 0.11 | 0.53 | NO |
| 30 | WNT16 | WNT16 | WNT16 | 4844 | 0.11 | 0.53 | NO |
| 31 | TLE2 | TLE2 | TLE2 | 4920 | 0.11 | 0.54 | NO |
| 32 | PORCN | PORCN | PORCN | 5043 | 0.1 | 0.54 | NO |
| 33 | AXIN1 | AXIN1 | AXIN1 | 5274 | 0.094 | 0.53 | NO |
| 34 | B2M | B2M | B2M | 5567 | 0.083 | 0.52 | NO |
| 35 | DIXDC1 | DIXDC1 | DIXDC1 | 5582 | 0.083 | 0.52 | NO |
| 36 | FBXW11 | FBXW11 | FBXW11 | 6207 | 0.065 | 0.49 | NO |
| 37 | DAAM1 | DAAM1 | DAAM1 | 6346 | 0.061 | 0.49 | NO |
| 38 | PPP2R1A | PPP2R1A | PPP2R1A | 6792 | 0.051 | 0.47 | NO |
| 39 | AES | AES | AES | 6951 | 0.048 | 0.46 | NO |
| 40 | FZD4 | FZD4 | FZD4 | 7183 | 0.043 | 0.45 | NO |
| 41 | WNT5A | WNT5A | WNT5A | 7279 | 0.041 | 0.45 | NO |
| 42 | WNT5B | WNT5B | WNT5B | 7290 | 0.041 | 0.45 | NO |
| 43 | KREMEN1 | KREMEN1 | KREMEN1 | 7331 | 0.04 | 0.45 | NO |
| 44 | ACTB | ACTB | ACTB | 7606 | 0.035 | 0.44 | NO |
| 45 | CSNK1A1 | CSNK1A1 | CSNK1A1 | 7949 | 0.03 | 0.42 | NO |
| 46 | APC | APC | APC | 8023 | 0.028 | 0.42 | NO |
| 47 | JUN | JUN | JUN | 8506 | 0.021 | 0.39 | NO |
| 48 | CSNK2A1 | CSNK2A1 | CSNK2A1 | 8629 | 0.02 | 0.39 | NO |
| 49 | GSK3A | GSK3A | GSK3A | 8644 | 0.019 | 0.39 | NO |
| 50 | GAPDH | GAPDH | GAPDH | 9243 | 0.011 | 0.36 | NO |
| 51 | CSNK1G1 | CSNK1G1 | CSNK1G1 | 9355 | 0.0095 | 0.35 | NO |
| 52 | FBXW4 | FBXW4 | FBXW4 | 9914 | 0.0023 | 0.32 | NO |
| 53 | BTRC | BTRC | BTRC | 9979 | 0.0016 | 0.31 | NO |
| 54 | CTBP1 | CTBP1 | CTBP1 | 10395 | -0.0031 | 0.29 | NO |
| 55 | RPL13A | RPL13A | RPL13A | 10437 | -0.0037 | 0.29 | NO |
| 56 | PPP2CA | PPP2CA | PPP2CA | 10592 | -0.0057 | 0.28 | NO |
| 57 | TCF7L1 | TCF7L1 | TCF7L1 | 10620 | -0.006 | 0.28 | NO |
| 58 | WNT3 | WNT3 | WNT3 | 10734 | -0.0072 | 0.27 | NO |
| 59 | LRP5 | LRP5 | LRP5 | 10843 | -0.0087 | 0.27 | NO |
| 60 | BCL9 | BCL9 | BCL9 | 11272 | -0.014 | 0.24 | NO |
| 61 | EP300 | EP300 | EP300 | 11540 | -0.017 | 0.23 | NO |
| 62 | GSK3B | GSK3B | GSK3B | 11610 | -0.018 | 0.23 | NO |
| 63 | FBXW2 | FBXW2 | FBXW2 | 11717 | -0.02 | 0.22 | NO |
| 64 | DVL1 | DVL1 | DVL1 | 12659 | -0.032 | 0.17 | NO |
| 65 | DVL2 | DVL2 | DVL2 | 12767 | -0.033 | 0.17 | NO |
| 66 | CTNNB1 | CTNNB1 | CTNNB1 | 12896 | -0.035 | 0.16 | NO |
| 67 | CSNK1D | CSNK1D | CSNK1D | 13008 | -0.036 | 0.16 | NO |
| 68 | PITX2 | PITX2 | PITX2 | 13031 | -0.037 | 0.16 | NO |
| 69 | LRP6 | LRP6 | LRP6 | 13144 | -0.038 | 0.16 | NO |
| 70 | RHOU | RHOU | RHOU | 13431 | -0.043 | 0.14 | NO |
| 71 | NLK | NLK | NLK | 13680 | -0.047 | 0.13 | NO |
| 72 | DKK1 | DKK1 | DKK1 | 14104 | -0.055 | 0.11 | NO |
| 73 | CXXC4 | CXXC4 | CXXC4 | 14924 | -0.073 | 0.071 | NO |
| 74 | SENP2 | SENP2 | SENP2 | 15004 | -0.076 | 0.072 | NO |
| 75 | SLC9A3R1 | SLC9A3R1 | SLC9A3R1 | 15105 | -0.079 | 0.072 | NO |
| 76 | FZD5 | FZD5 | FZD5 | 15131 | -0.08 | 0.076 | NO |
| 77 | TLE1 | TLE1 | TLE1 | 15137 | -0.08 | 0.081 | NO |
| 78 | FRAT1 | FRAT1 | FRAT1 | 15184 | -0.081 | 0.084 | NO |
| 79 | HPRT1 | HPRT1 | HPRT1 | 15716 | -0.1 | 0.061 | NO |
| 80 | CTNNBIP1 | CTNNBIP1 | CTNNBIP1 | 15867 | -0.11 | 0.06 | NO |
| 81 | NKD1 | NKD1 | NKD1 | 16488 | -0.15 | 0.035 | NO |
| 82 | TCF7 | TCF7 | TCF7 | 17245 | -0.22 | 0.007 | NO |
| 83 | WIF1 | WIF1 | WIF1 | 17569 | -0.3 | 0.009 | NO |
Figure S67. Get High-res Image This plot shows mRNAseq_cNMF expression data heatmap (on the left) a RunningEnrichmentScore(RES) plot (on the top right) and a Signal2Noise(S2N) plot (on the bottom right) of genes in the pathway: BIOCARTA BCR PATHWAY.
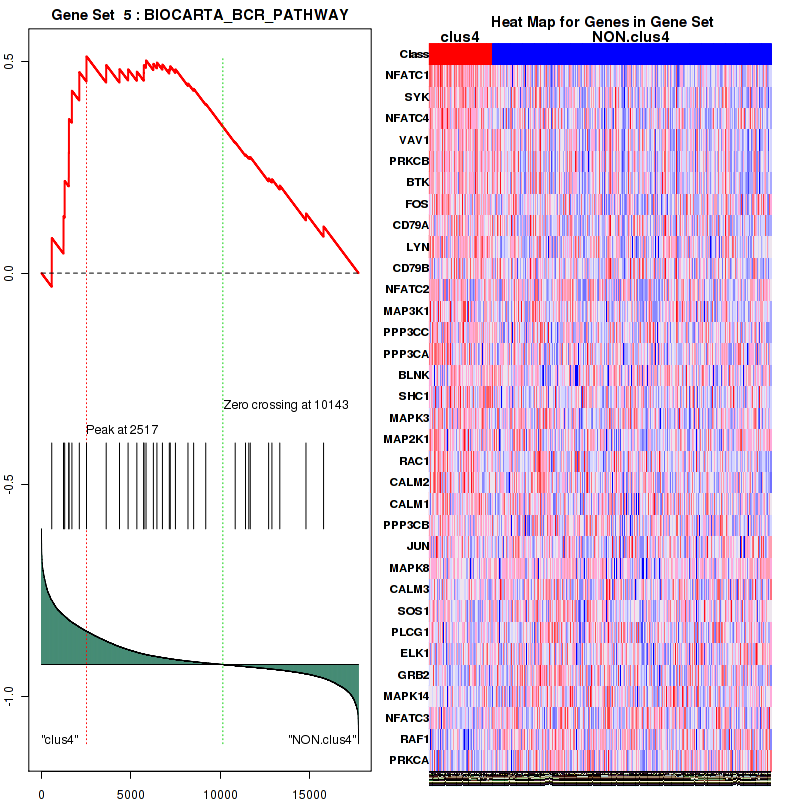
Figure S68. Get High-res Image For the top 5 core enriched genes in the pathway: BIOCARTA BCR PATHWAY, this volcano plot shows how much they are up/down-regulated and significant. The significance was calculated by empirical bayesian fit

Table S35. Get Full Table This table shows a Running Enrichment Score (RES) of each gene in this pathway, that is, the enrichment score at this point in the ranked list of genes. All genes are ranked by Signal-to-Noise (S2N), a measure of similarity as default and are used to obtain ES matrix of all genes. In this way, GSEA tool uses expression pattern of not only overlapped genes but also not-overlapped genes to produce ES matrix.
| Rank | GENE | SYMBOL | DESC | LIST.LOC | S2N | RES | CORE_ENRICHMENT |
|---|---|---|---|---|---|---|---|
| 1 | WNT4 | WNT4 | WNT4 | 162 | 0.65 | 0.028 | YES |
| 2 | WNT2 | WNT2 | WNT2 | 171 | 0.64 | 0.064 | YES |
| 3 | ADCY5 | ADCY5 | ADCY5 | 196 | 0.63 | 0.098 | YES |
| 4 | FZD2 | FZD2 | FZD2 | 198 | 0.63 | 0.13 | YES |
| 5 | CREB3L1 | CREB3L1 | CREB3L1 | 206 | 0.63 | 0.17 | YES |
| 6 | WNT2B | WNT2B | WNT2B | 315 | 0.56 | 0.2 | YES |
| 7 | PLCB4 | PLCB4 | PLCB4 | 362 | 0.54 | 0.22 | YES |
| 8 | FZD10 | FZD10 | FZD10 | 377 | 0.54 | 0.25 | YES |
| 9 | WNT10A | WNT10A | WNT10A | 605 | 0.48 | 0.27 | YES |
| 10 | FZD1 | FZD1 | FZD1 | 695 | 0.46 | 0.29 | YES |
| 11 | WNT9A | WNT9A | WNT9A | 702 | 0.45 | 0.31 | YES |
| 12 | FZD7 | FZD7 | FZD7 | 713 | 0.45 | 0.34 | YES |
| 13 | FZD8 | FZD8 | FZD8 | 729 | 0.45 | 0.36 | YES |
| 14 | PRKX | PRKX | PRKX | 766 | 0.44 | 0.38 | YES |
| 15 | MITF | MITF | MITF | 768 | 0.44 | 0.41 | YES |
| 16 | ADCY2 | ADCY2 | ADCY2 | 778 | 0.44 | 0.43 | YES |
| 17 | EDN1 | EDN1 | EDN1 | 780 | 0.44 | 0.46 | YES |
| 18 | WNT10B | WNT10B | WNT10B | 901 | 0.41 | 0.48 | YES |
| 19 | WNT7B | WNT7B | WNT7B | 1003 | 0.4 | 0.49 | YES |
| 20 | ADCY4 | ADCY4 | ADCY4 | 1133 | 0.38 | 0.51 | YES |
| 21 | POMC | POMC | POMC | 1179 | 0.38 | 0.53 | YES |
| 22 | PRKCB | PRKCB | PRKCB | 1538 | 0.33 | 0.52 | YES |
| 23 | PLCB2 | PLCB2 | PLCB2 | 1612 | 0.33 | 0.54 | YES |
| 24 | WNT7A | WNT7A | WNT7A | 1877 | 0.3 | 0.54 | YES |
| 25 | KIT | KIT | KIT | 1957 | 0.3 | 0.55 | YES |
| 26 | ADCY7 | ADCY7 | ADCY7 | 1992 | 0.29 | 0.57 | YES |
| 27 | WNT11 | WNT11 | WNT11 | 2070 | 0.28 | 0.58 | YES |
| 28 | WNT1 | WNT1 | WNT1 | 2139 | 0.28 | 0.59 | YES |
| 29 | LEF1 | LEF1 | LEF1 | 2213 | 0.27 | 0.6 | YES |
| 30 | GNAO1 | GNAO1 | GNAO1 | 2369 | 0.26 | 0.61 | YES |
| 31 | WNT3A | WNT3A | WNT3A | 2845 | 0.23 | 0.6 | YES |
| 32 | EDNRB | EDNRB | EDNRB | 3006 | 0.22 | 0.6 | YES |
| 33 | CAMK2A | CAMK2A | CAMK2A | 3350 | 0.19 | 0.59 | YES |
| 34 | FZD6 | FZD6 | FZD6 | 3357 | 0.19 | 0.6 | YES |
| 35 | MC1R | MC1R | MC1R | 3531 | 0.18 | 0.6 | YES |
| 36 | WNT9B | WNT9B | WNT9B | 3585 | 0.18 | 0.61 | YES |
| 37 | WNT6 | WNT6 | WNT6 | 3803 | 0.16 | 0.6 | YES |
| 38 | FZD3 | FZD3 | FZD3 | 3841 | 0.16 | 0.61 | YES |
| 39 | CAMK2B | CAMK2B | CAMK2B | 4018 | 0.15 | 0.61 | NO |
| 40 | WNT16 | WNT16 | WNT16 | 4844 | 0.11 | 0.57 | NO |
| 41 | PLCB3 | PLCB3 | PLCB3 | 5773 | 0.077 | 0.52 | NO |
| 42 | CREB3 | CREB3 | CREB3 | 6068 | 0.068 | 0.51 | NO |
| 43 | KITLG | KITLG | KITLG | 6417 | 0.06 | 0.49 | NO |
| 44 | MAPK3 | MAPK3 | MAPK3 | 6456 | 0.059 | 0.49 | NO |
| 45 | MAP2K1 | MAP2K1 | MAP2K1 | 6763 | 0.052 | 0.48 | NO |
| 46 | KRAS | KRAS | KRAS | 7083 | 0.045 | 0.46 | NO |
| 47 | PRKACA | PRKACA | PRKACA | 7142 | 0.044 | 0.46 | NO |
| 48 | FZD4 | FZD4 | FZD4 | 7183 | 0.043 | 0.46 | NO |
| 49 | CALM2 | CALM2 | CALM2 | 7201 | 0.043 | 0.46 | NO |
| 50 | WNT5A | WNT5A | WNT5A | 7279 | 0.041 | 0.46 | NO |
| 51 | CAMK2D | CAMK2D | CAMK2D | 7283 | 0.041 | 0.46 | NO |
| 52 | WNT5B | WNT5B | WNT5B | 7290 | 0.041 | 0.47 | NO |
| 53 | ADCY1 | ADCY1 | ADCY1 | 7396 | 0.039 | 0.46 | NO |
| 54 | CALM1 | CALM1 | CALM1 | 7491 | 0.037 | 0.46 | NO |
| 55 | ADCY9 | ADCY9 | ADCY9 | 7590 | 0.036 | 0.46 | NO |
| 56 | CREB1 | CREB1 | CREB1 | 7857 | 0.031 | 0.44 | NO |
| 57 | GNAI3 | GNAI3 | GNAI3 | 8086 | 0.027 | 0.43 | NO |
| 58 | GNAS | GNAS | GNAS | 8249 | 0.025 | 0.42 | NO |
| 59 | GNAI2 | GNAI2 | GNAI2 | 8547 | 0.021 | 0.41 | NO |
| 60 | ADCY6 | ADCY6 | ADCY6 | 9127 | 0.012 | 0.38 | NO |
| 61 | TCF7L2 | TCF7L2 | TCF7L2 | 9172 | 0.012 | 0.37 | NO |
| 62 | CAMK2G | CAMK2G | CAMK2G | 9541 | 0.0072 | 0.35 | NO |
| 63 | CREBBP | CREBBP | CREBBP | 9648 | 0.0058 | 0.35 | NO |
| 64 | MAP2K2 | MAP2K2 | MAP2K2 | 9712 | 0.0049 | 0.34 | NO |
| 65 | GNAQ | GNAQ | GNAQ | 9746 | 0.0044 | 0.34 | NO |
| 66 | TYRP1 | TYRP1 | TYRP1 | 10258 | -0.0015 | 0.31 | NO |
| 67 | TCF7L1 | TCF7L1 | TCF7L1 | 10620 | -0.006 | 0.29 | NO |
| 68 | FZD9 | FZD9 | FZD9 | 10675 | -0.0067 | 0.29 | NO |
| 69 | WNT3 | WNT3 | WNT3 | 10734 | -0.0072 | 0.29 | NO |
| 70 | PRKACB | PRKACB | PRKACB | 10812 | -0.0082 | 0.28 | NO |
| 71 | CALM3 | CALM3 | CALM3 | 10832 | -0.0086 | 0.28 | NO |
| 72 | HRAS | HRAS | HRAS | 10983 | -0.01 | 0.28 | NO |
| 73 | ASIP | ASIP | ASIP | 11017 | -0.011 | 0.28 | NO |
| 74 | MAPK1 | MAPK1 | MAPK1 | 11085 | -0.012 | 0.27 | NO |
| 75 | DVL3 | DVL3 | DVL3 | 11435 | -0.016 | 0.25 | NO |
| 76 | EP300 | EP300 | EP300 | 11540 | -0.017 | 0.25 | NO |
| 77 | GSK3B | GSK3B | GSK3B | 11610 | -0.018 | 0.24 | NO |
| 78 | ADCY8 | ADCY8 | ADCY8 | 12247 | -0.026 | 0.21 | NO |
| 79 | DVL1 | DVL1 | DVL1 | 12659 | -0.032 | 0.19 | NO |
| 80 | PRKCG | PRKCG | PRKCG | 12717 | -0.032 | 0.19 | NO |
| 81 | DVL2 | DVL2 | DVL2 | 12767 | -0.033 | 0.19 | NO |
| 82 | CTNNB1 | CTNNB1 | CTNNB1 | 12896 | -0.035 | 0.18 | NO |
| 83 | NRAS | NRAS | NRAS | 13162 | -0.039 | 0.17 | NO |
| 84 | CREB3L2 | CREB3L2 | CREB3L2 | 13508 | -0.044 | 0.15 | NO |
| 85 | DCT | DCT | DCT | 14132 | -0.056 | 0.12 | NO |
| 86 | RAF1 | RAF1 | RAF1 | 14790 | -0.07 | 0.086 | NO |
| 87 | FZD5 | FZD5 | FZD5 | 15131 | -0.08 | 0.071 | NO |
| 88 | CALML3 | CALML3 | CALML3 | 15209 | -0.082 | 0.071 | NO |
| 89 | CREB3L3 | CREB3L3 | CREB3L3 | 15592 | -0.096 | 0.055 | NO |
| 90 | PRKCA | PRKCA | PRKCA | 15772 | -0.1 | 0.051 | NO |
| 91 | GNAI1 | GNAI1 | GNAI1 | 15958 | -0.11 | 0.047 | NO |
| 92 | PLCB1 | PLCB1 | PLCB1 | 16037 | -0.12 | 0.049 | NO |
| 93 | CREB3L4 | CREB3L4 | CREB3L4 | 16484 | -0.14 | 0.032 | NO |
| 94 | WNT8B | WNT8B | WNT8B | 17064 | -0.19 | 0.01 | NO |
| 95 | TCF7 | TCF7 | TCF7 | 17245 | -0.22 | 0.012 | NO |
| 96 | CALML6 | CALML6 | CALML6 | 17488 | -0.27 | 0.014 | NO |
Figure S69. Get High-res Image This plot shows mRNAseq_cNMF expression data heatmap (on the left) a RunningEnrichmentScore(RES) plot (on the top right) and a Signal2Noise(S2N) plot (on the bottom right) of genes in the pathway: BIOCARTA CARM ER PATHWAY.
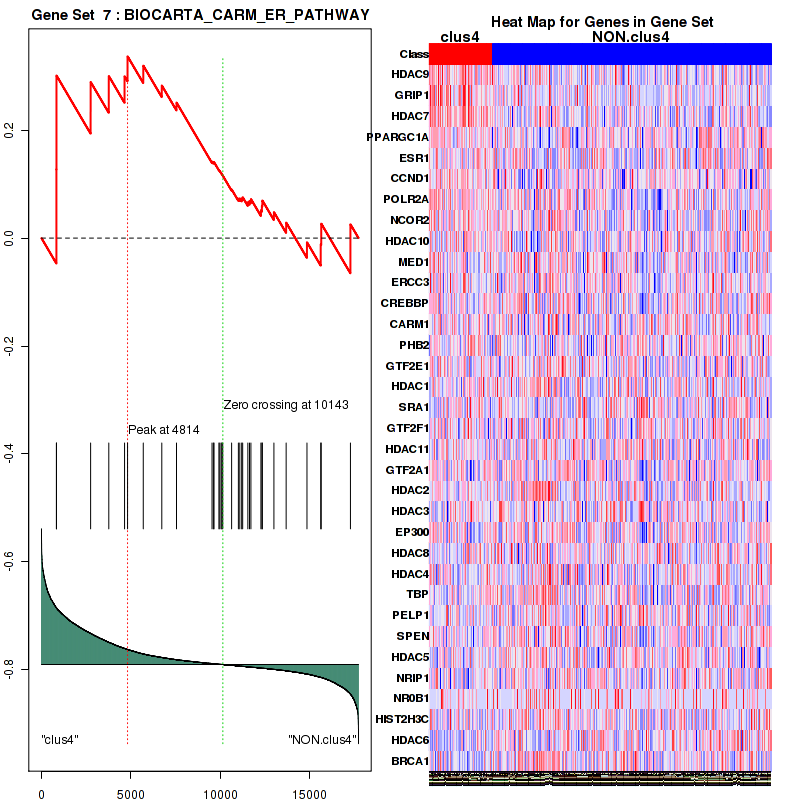
Figure S70. Get High-res Image For the top 5 core enriched genes in the pathway: BIOCARTA CARM ER PATHWAY, this volcano plot shows how much they are up/down-regulated and significant. The significance was calculated by empirical bayesian fit

Table S36. Get Full Table This table shows a Running Enrichment Score (RES) of each gene in this pathway, that is, the enrichment score at this point in the ranked list of genes. All genes are ranked by Signal-to-Noise (S2N), a measure of similarity as default and are used to obtain ES matrix of all genes. In this way, GSEA tool uses expression pattern of not only overlapped genes but also not-overlapped genes to produce ES matrix.
| Rank | GENE | SYMBOL | DESC | LIST.LOC | S2N | RES | CORE_ENRICHMENT |
|---|---|---|---|---|---|---|---|
| 1 | PDGFRA | PDGFRA | PDGFRA | 146 | 0.66 | 0.026 | YES |
| 2 | IGF1R | IGF1R | IGF1R | 511 | 0.5 | 0.032 | YES |
| 3 | EHD3 | EHD3 | EHD3 | 719 | 0.45 | 0.044 | YES |
| 4 | IQSEC2 | IQSEC2 | IQSEC2 | 813 | 0.43 | 0.061 | YES |
| 5 | RAB31 | RAB31 | RAB31 | 907 | 0.41 | 0.078 | YES |
| 6 | F2R | F2R | F2R | 973 | 0.4 | 0.095 | YES |
| 7 | CXCR2 | CXCR2 | CXCR2 | 993 | 0.4 | 0.12 | YES |
| 8 | DNM3 | DNM3 | DNM3 | 1037 | 0.4 | 0.13 | YES |
| 9 | RET | RET | RET | 1208 | 0.37 | 0.14 | YES |
| 10 | CCR5 | CCR5 | CCR5 | 1251 | 0.37 | 0.16 | YES |
| 11 | ACAP1 | ACAP1 | ACAP1 | 1463 | 0.34 | 0.17 | YES |
| 12 | EPN3 | EPN3 | EPN3 | 1648 | 0.32 | 0.17 | YES |
| 13 | FGFR2 | FGFR2 | FGFR2 | 1727 | 0.32 | 0.19 | YES |
| 14 | EHD2 | EHD2 | EHD2 | 1788 | 0.31 | 0.2 | YES |
| 15 | IL2RA | IL2RA | IL2RA | 1816 | 0.31 | 0.21 | YES |
| 16 | CXCR1 | CXCR1 | CXCR1 | 1866 | 0.3 | 0.23 | YES |
| 17 | ARAP3 | ARAP3 | ARAP3 | 1878 | 0.3 | 0.24 | YES |
| 18 | KIT | KIT | KIT | 1957 | 0.3 | 0.25 | YES |
| 19 | IL2RG | IL2RG | IL2RG | 2106 | 0.28 | 0.26 | YES |
| 20 | ERBB4 | ERBB4 | ERBB4 | 2173 | 0.28 | 0.27 | YES |
| 21 | CSF1R | CSF1R | CSF1R | 2182 | 0.28 | 0.28 | YES |
| 22 | DNM1 | DNM1 | DNM1 | 2201 | 0.27 | 0.3 | YES |
| 23 | DAB2 | DAB2 | DAB2 | 2339 | 0.26 | 0.3 | YES |
| 24 | CXCR4 | CXCR4 | CXCR4 | 2362 | 0.26 | 0.32 | YES |
| 25 | NTRK1 | NTRK1 | NTRK1 | 2427 | 0.26 | 0.33 | YES |
| 26 | ARAP2 | ARAP2 | ARAP2 | 2525 | 0.25 | 0.33 | YES |
| 27 | IL2RB | IL2RB | IL2RB | 2558 | 0.25 | 0.34 | YES |
| 28 | RAB11FIP5 | RAB11FIP5 | RAB11FIP5 | 2570 | 0.25 | 0.36 | YES |
| 29 | PIP5K1B | PIP5K1B | PIP5K1B | 2887 | 0.22 | 0.35 | YES |
| 30 | PLD1 | PLD1 | PLD1 | 2930 | 0.22 | 0.36 | YES |
| 31 | DNAJC6 | DNAJC6 | DNAJC6 | 2939 | 0.22 | 0.37 | YES |
| 32 | HSPA2 | HSPA2 | HSPA2 | 3245 | 0.2 | 0.36 | YES |
| 33 | ASAP1 | ASAP1 | ASAP1 | 3447 | 0.19 | 0.36 | YES |
| 34 | KDR | KDR | KDR | 3540 | 0.18 | 0.37 | YES |
| 35 | GRK5 | GRK5 | GRK5 | 3656 | 0.17 | 0.37 | YES |
| 36 | PLD2 | PLD2 | PLD2 | 3661 | 0.17 | 0.38 | YES |
| 37 | EGF | EGF | EGF | 3750 | 0.17 | 0.38 | YES |
| 38 | ADRB3 | ADRB3 | ADRB3 | 3784 | 0.17 | 0.39 | YES |
| 39 | ARRB1 | ARRB1 | ARRB1 | 3796 | 0.16 | 0.4 | YES |
| 40 | HSPA6 | HSPA6 | HSPA6 | 3855 | 0.16 | 0.4 | YES |
| 41 | CBL | CBL | CBL | 3919 | 0.16 | 0.41 | YES |
| 42 | PSD | PSD | PSD | 3942 | 0.16 | 0.42 | YES |
| 43 | PIP5K1C | PIP5K1C | PIP5K1C | 4092 | 0.15 | 0.41 | YES |
| 44 | RAB11FIP1 | RAB11FIP1 | RAB11FIP1 | 4256 | 0.14 | 0.41 | YES |
| 45 | HLA-G | HLA-G | HLA-G | 4428 | 0.13 | 0.41 | YES |
| 46 | SH3GL2 | SH3GL2 | SH3GL2 | 4565 | 0.12 | 0.41 | YES |
| 47 | SRC | SRC | SRC | 4700 | 0.12 | 0.41 | YES |
| 48 | VPS24 | VPS24 | VPS24 | 4727 | 0.12 | 0.41 | YES |
| 49 | CBLB | CBLB | CBLB | 4807 | 0.11 | 0.41 | YES |
| 50 | HLA-B | HLA-B | HLA-B | 4822 | 0.11 | 0.42 | YES |
| 51 | CHMP4C | CHMP4C | CHMP4C | 4903 | 0.11 | 0.42 | YES |
| 52 | SH3KBP1 | SH3KBP1 | SH3KBP1 | 4957 | 0.11 | 0.42 | YES |
| 53 | CLTB | CLTB | CLTB | 4976 | 0.11 | 0.43 | YES |
| 54 | HLA-F | HLA-F | HLA-F | 5013 | 0.1 | 0.43 | YES |
| 55 | AGAP2 | AGAP2 | AGAP2 | 5134 | 0.1 | 0.43 | YES |
| 56 | AGAP1 | AGAP1 | AGAP1 | 5229 | 0.096 | 0.43 | YES |
| 57 | VPS37B | VPS37B | VPS37B | 5269 | 0.095 | 0.43 | YES |
| 58 | FLT1 | FLT1 | FLT1 | 5322 | 0.092 | 0.43 | YES |
| 59 | ASAP2 | ASAP2 | ASAP2 | 5330 | 0.092 | 0.44 | YES |
| 60 | EGFR | EGFR | EGFR | 5445 | 0.088 | 0.44 | NO |
| 61 | VPS4A | VPS4A | VPS4A | 5598 | 0.082 | 0.43 | NO |
| 62 | SH3GLB1 | SH3GLB1 | SH3GLB1 | 5636 | 0.081 | 0.43 | NO |
| 63 | EHD4 | EHD4 | EHD4 | 5822 | 0.075 | 0.43 | NO |
| 64 | ARRB2 | ARRB2 | ARRB2 | 5899 | 0.073 | 0.43 | NO |
| 65 | VPS4B | VPS4B | VPS4B | 6049 | 0.069 | 0.42 | NO |
| 66 | GIT1 | GIT1 | GIT1 | 6114 | 0.067 | 0.42 | NO |
| 67 | HLA-C | HLA-C | HLA-C | 6197 | 0.065 | 0.42 | NO |
| 68 | GIT2 | GIT2 | GIT2 | 6205 | 0.065 | 0.42 | NO |
| 69 | HLA-A | HLA-A | HLA-A | 6259 | 0.064 | 0.42 | NO |
| 70 | SMURF1 | SMURF1 | SMURF1 | 6348 | 0.061 | 0.42 | NO |
| 71 | HLA-E | HLA-E | HLA-E | 6362 | 0.061 | 0.42 | NO |
| 72 | RAB11A | RAB11A | RAB11A | 6378 | 0.061 | 0.43 | NO |
| 73 | IQSEC3 | IQSEC3 | IQSEC3 | 6423 | 0.06 | 0.43 | NO |
| 74 | FAM125B | FAM125B | FAM125B | 6585 | 0.056 | 0.42 | NO |
| 75 | CHMP4B | CHMP4B | CHMP4B | 6677 | 0.054 | 0.42 | NO |
| 76 | HSPA8 | HSPA8 | HSPA8 | 6814 | 0.051 | 0.41 | NO |
| 77 | PSD2 | PSD2 | PSD2 | 6842 | 0.05 | 0.42 | NO |
| 78 | VPS37A | VPS37A | VPS37A | 6849 | 0.05 | 0.42 | NO |
| 79 | RABEP1 | RABEP1 | RABEP1 | 6899 | 0.049 | 0.42 | NO |
| 80 | PRKCZ | PRKCZ | PRKCZ | 6904 | 0.049 | 0.42 | NO |
| 81 | CHMP4A | CHMP4A | CHMP4A | 7035 | 0.046 | 0.41 | NO |
| 82 | ARFGAP3 | ARFGAP3 | ARFGAP3 | 7067 | 0.046 | 0.42 | NO |
| 83 | TRAF6 | TRAF6 | TRAF6 | 7115 | 0.045 | 0.41 | NO |
| 84 | VPS37C | VPS37C | VPS37C | 7138 | 0.044 | 0.42 | NO |
| 85 | PARD6B | PARD6B | PARD6B | 7158 | 0.044 | 0.42 | NO |
| 86 | ACAP2 | ACAP2 | ACAP2 | 7292 | 0.041 | 0.41 | NO |
| 87 | EPN2 | EPN2 | EPN2 | 7309 | 0.041 | 0.41 | NO |
| 88 | DNM2 | DNM2 | DNM2 | 7310 | 0.041 | 0.42 | NO |
| 89 | DNM1L | DNM1L | DNM1L | 7353 | 0.04 | 0.41 | NO |
| 90 | PARD6G | PARD6G | PARD6G | 7375 | 0.04 | 0.42 | NO |
| 91 | VPS28 | VPS28 | VPS28 | 7403 | 0.039 | 0.42 | NO |
| 92 | CHMP1B | CHMP1B | CHMP1B | 7427 | 0.038 | 0.42 | NO |
| 93 | RAB11FIP3 | RAB11FIP3 | RAB11FIP3 | 7671 | 0.034 | 0.4 | NO |
| 94 | ARAP1 | ARAP1 | ARAP1 | 7678 | 0.034 | 0.41 | NO |
| 95 | RAB5C | RAB5C | RAB5C | 7921 | 0.03 | 0.39 | NO |
| 96 | CDC42 | CDC42 | CDC42 | 8025 | 0.028 | 0.39 | NO |
| 97 | EPS15 | EPS15 | EPS15 | 8036 | 0.028 | 0.39 | NO |
| 98 | SH3GLB2 | SH3GLB2 | SH3GLB2 | 8048 | 0.028 | 0.39 | NO |
| 99 | ARF6 | ARF6 | ARF6 | 8053 | 0.028 | 0.39 | NO |
| 100 | CHMP5 | CHMP5 | CHMP5 | 8166 | 0.026 | 0.39 | NO |
| 101 | ADRBK1 | ADRBK1 | ADRBK1 | 8206 | 0.026 | 0.39 | NO |
| 102 | RUFY1 | RUFY1 | RUFY1 | 8226 | 0.025 | 0.39 | NO |
| 103 | AP2A2 | AP2A2 | AP2A2 | 8244 | 0.025 | 0.39 | NO |
| 104 | RAB22A | RAB22A | RAB22A | 8334 | 0.024 | 0.38 | NO |
| 105 | SMURF2 | SMURF2 | SMURF2 | 8362 | 0.023 | 0.38 | NO |
| 106 | EHD1 | EHD1 | EHD1 | 8407 | 0.023 | 0.38 | NO |
| 107 | FGFR3 | FGFR3 | FGFR3 | 8591 | 0.02 | 0.37 | NO |
| 108 | CHMP2B | CHMP2B | CHMP2B | 8674 | 0.019 | 0.37 | NO |
| 109 | TFRC | TFRC | TFRC | 8682 | 0.019 | 0.37 | NO |
| 110 | CBLC | CBLC | CBLC | 8701 | 0.018 | 0.37 | NO |
| 111 | FAM125A | FAM125A | FAM125A | 8746 | 0.018 | 0.37 | NO |
| 112 | AP2B1 | AP2B1 | AP2B1 | 8749 | 0.018 | 0.37 | NO |
| 113 | STAM | STAM | STAM | 8815 | 0.017 | 0.36 | NO |
| 114 | PIP5K1A | PIP5K1A | PIP5K1A | 8836 | 0.016 | 0.36 | NO |
| 115 | AP2M1 | AP2M1 | AP2M1 | 8849 | 0.016 | 0.36 | NO |
| 116 | LDLR | LDLR | LDLR | 8908 | 0.015 | 0.36 | NO |
| 117 | PSD4 | PSD4 | PSD4 | 8915 | 0.015 | 0.36 | NO |
| 118 | RNF41 | RNF41 | RNF41 | 9023 | 0.014 | 0.36 | NO |
| 119 | STAM2 | STAM2 | STAM2 | 9379 | 0.0092 | 0.34 | NO |
| 120 | ADRBK2 | ADRBK2 | ADRBK2 | 9428 | 0.0086 | 0.34 | NO |
| 121 | SH3GL1 | SH3GL1 | SH3GL1 | 9463 | 0.0081 | 0.33 | NO |
| 122 | VPS36 | VPS36 | VPS36 | 9629 | 0.0061 | 0.32 | NO |
| 123 | VPS45 | VPS45 | VPS45 | 9771 | 0.0042 | 0.32 | NO |
| 124 | SMAP1 | SMAP1 | SMAP1 | 9818 | 0.0036 | 0.32 | NO |
| 125 | PRKCI | PRKCI | PRKCI | 9941 | 0.002 | 0.31 | NO |
| 126 | ADRB1 | ADRB1 | ADRB1 | 10090 | 0.00055 | 0.3 | NO |
| 127 | RAB11B | RAB11B | RAB11B | 10354 | -0.0026 | 0.28 | NO |
| 128 | PDCD6IP | PDCD6IP | PDCD6IP | 10416 | -0.0033 | 0.28 | NO |
| 129 | RAB5A | RAB5A | RAB5A | 10475 | -0.0042 | 0.28 | NO |
| 130 | USP8 | USP8 | USP8 | 10537 | -0.005 | 0.28 | NO |
| 131 | CHMP2A | CHMP2A | CHMP2A | 10764 | -0.0077 | 0.26 | NO |
| 132 | PIKFYVE | PIKFYVE | PIKFYVE | 10778 | -0.0078 | 0.26 | NO |
| 133 | CLTC | CLTC | CLTC | 10783 | -0.0079 | 0.26 | NO |
| 134 | WWP1 | WWP1 | WWP1 | 10788 | -0.008 | 0.26 | NO |
| 135 | CLTA | CLTA | CLTA | 11057 | -0.011 | 0.25 | NO |
| 136 | EPN1 | EPN1 | EPN1 | 11124 | -0.012 | 0.24 | NO |
| 137 | STAMBP | STAMBP | STAMBP | 11141 | -0.012 | 0.24 | NO |
| 138 | LDLRAP1 | LDLRAP1 | LDLRAP1 | 11306 | -0.014 | 0.24 | NO |
| 139 | AP2A1 | AP2A1 | AP2A1 | 11308 | -0.014 | 0.24 | NO |
| 140 | AP2S1 | AP2S1 | AP2S1 | 11330 | -0.015 | 0.24 | NO |
| 141 | MDM2 | MDM2 | MDM2 | 11363 | -0.015 | 0.24 | NO |
| 142 | RAB5B | RAB5B | RAB5B | 11486 | -0.016 | 0.23 | NO |
| 143 | TSG101 | TSG101 | TSG101 | 11868 | -0.021 | 0.21 | NO |
| 144 | ACAP3 | ACAP3 | ACAP3 | 12027 | -0.024 | 0.2 | NO |
| 145 | EEA1 | EEA1 | EEA1 | 12181 | -0.025 | 0.19 | NO |
| 146 | PIP4K2B | PIP4K2B | PIP4K2B | 12331 | -0.027 | 0.19 | NO |
| 147 | SMAP2 | SMAP2 | SMAP2 | 12511 | -0.03 | 0.18 | NO |
| 148 | GRK4 | GRK4 | GRK4 | 12515 | -0.03 | 0.18 | NO |
| 149 | VTA1 | VTA1 | VTA1 | 12878 | -0.035 | 0.16 | NO |
| 150 | PARD3 | PARD3 | PARD3 | 12910 | -0.035 | 0.16 | NO |
| 151 | GRK6 | GRK6 | GRK6 | 13006 | -0.036 | 0.16 | NO |
| 152 | ARFGAP1 | ARFGAP1 | ARFGAP1 | 13117 | -0.038 | 0.15 | NO |
| 153 | SNF8 | SNF8 | SNF8 | 13182 | -0.039 | 0.15 | NO |
| 154 | RAB11FIP4 | RAB11FIP4 | RAB11FIP4 | 13294 | -0.041 | 0.15 | NO |
| 155 | PSD3 | PSD3 | PSD3 | 13425 | -0.043 | 0.14 | NO |
| 156 | RAB11FIP2 | RAB11FIP2 | RAB11FIP2 | 13527 | -0.044 | 0.14 | NO |
| 157 | VPS25 | VPS25 | VPS25 | 13538 | -0.045 | 0.14 | NO |
| 158 | ARFGAP2 | ARFGAP2 | ARFGAP2 | 13607 | -0.046 | 0.14 | NO |
| 159 | IQSEC1 | IQSEC1 | IQSEC1 | 13685 | -0.047 | 0.14 | NO |
| 160 | ASAP3 | ASAP3 | ASAP3 | 13737 | -0.048 | 0.14 | NO |
| 161 | CHMP6 | CHMP6 | CHMP6 | 13944 | -0.052 | 0.13 | NO |
| 162 | ZFYVE20 | ZFYVE20 | ZFYVE20 | 14102 | -0.055 | 0.12 | NO |
| 163 | ITCH | ITCH | ITCH | 14124 | -0.056 | 0.12 | NO |
| 164 | RAB4A | RAB4A | RAB4A | 14158 | -0.056 | 0.12 | NO |
| 165 | FGFR4 | FGFR4 | FGFR4 | 14374 | -0.06 | 0.12 | NO |
| 166 | PARD6A | PARD6A | PARD6A | 14543 | -0.064 | 0.11 | NO |
| 167 | HSPA1B | HSPA1B | HSPA1B | 14685 | -0.068 | 0.1 | NO |
| 168 | HGS | HGS | HGS | 14951 | -0.074 | 0.094 | NO |
| 169 | CLTCL1 | CLTCL1 | CLTCL1 | 14976 | -0.075 | 0.096 | NO |
| 170 | HSPA1A | HSPA1A | HSPA1A | 15039 | -0.077 | 0.097 | NO |
| 171 | NEDD4L | NEDD4L | NEDD4L | 15368 | -0.088 | 0.083 | NO |
| 172 | MET | MET | MET | 15509 | -0.093 | 0.08 | NO |
| 173 | NEDD4 | NEDD4 | NEDD4 | 15543 | -0.094 | 0.083 | NO |
| 174 | ERBB3 | ERBB3 | ERBB3 | 16026 | -0.12 | 0.061 | NO |
| 175 | HSPA1L | HSPA1L | HSPA1L | 16628 | -0.16 | 0.035 | NO |
| 176 | ADRB2 | ADRB2 | ADRB2 | 16642 | -0.16 | 0.043 | NO |
| 177 | VPS37D | VPS37D | VPS37D | 16688 | -0.16 | 0.049 | NO |
| 178 | SH3GL3 | SH3GL3 | SH3GL3 | 17083 | -0.2 | 0.037 | NO |
Figure S71. Get High-res Image This plot shows mRNAseq_cNMF expression data heatmap (on the left) a RunningEnrichmentScore(RES) plot (on the top right) and a Signal2Noise(S2N) plot (on the bottom right) of genes in the pathway: BIOCARTA HDAC PATHWAY.
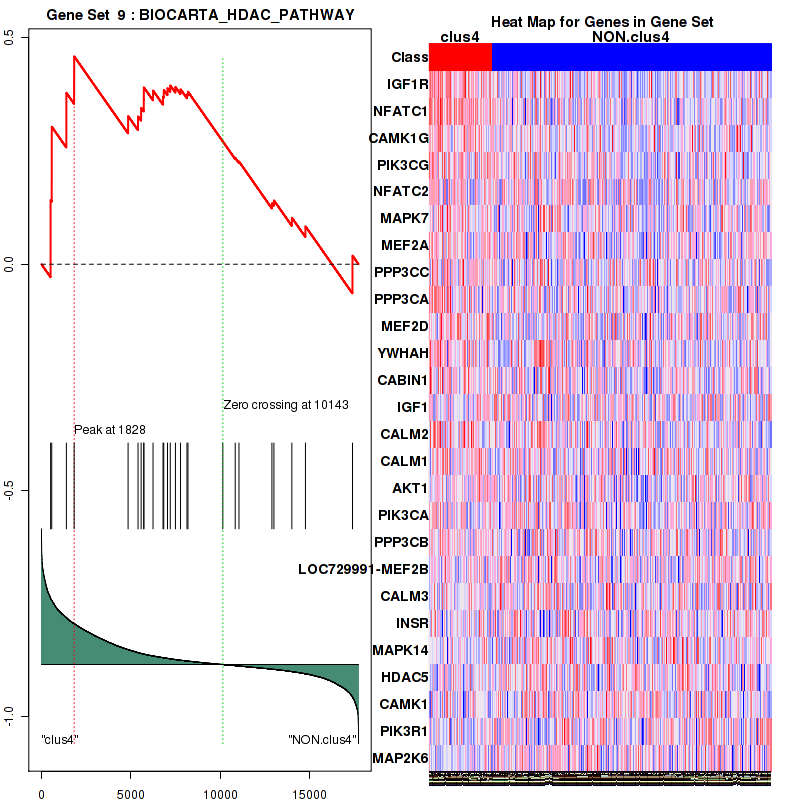
Figure S72. Get High-res Image For the top 5 core enriched genes in the pathway: BIOCARTA HDAC PATHWAY, this volcano plot shows how much they are up/down-regulated and significant. The significance was calculated by empirical bayesian fit

Table S37. Get Full Table This table shows a Running Enrichment Score (RES) of each gene in this pathway, that is, the enrichment score at this point in the ranked list of genes. All genes are ranked by Signal-to-Noise (S2N), a measure of similarity as default and are used to obtain ES matrix of all genes. In this way, GSEA tool uses expression pattern of not only overlapped genes but also not-overlapped genes to produce ES matrix.
| Rank | GENE | SYMBOL | DESC | LIST.LOC | S2N | RES | CORE_ENRICHMENT |
|---|---|---|---|---|---|---|---|
| 1 | NTRK2 | NTRK2 | NTRK2 | 35 | 0.79 | 0.021 | YES |
| 2 | MAPK10 | MAPK10 | MAPK10 | 102 | 0.7 | 0.038 | YES |
| 3 | FGF1 | FGF1 | FGF1 | 130 | 0.67 | 0.056 | YES |
| 4 | PDGFRA | PDGFRA | PDGFRA | 146 | 0.66 | 0.074 | YES |
| 5 | CACNA1C | CACNA1C | CACNA1C | 189 | 0.64 | 0.09 | YES |
| 6 | PLA2G4A | PLA2G4A | PLA2G4A | 267 | 0.59 | 0.1 | YES |
| 7 | PLA2G5 | PLA2G5 | PLA2G5 | 359 | 0.55 | 0.11 | YES |
| 8 | FGF7 | FGF7 | FGF7 | 405 | 0.53 | 0.13 | YES |
| 9 | CACNB3 | CACNB3 | CACNB3 | 441 | 0.52 | 0.14 | YES |
| 10 | FGFR1 | FGFR1 | FGFR1 | 452 | 0.52 | 0.15 | YES |
| 11 | FGF18 | FGF18 | FGF18 | 500 | 0.5 | 0.17 | YES |
| 12 | NTF3 | NTF3 | NTF3 | 529 | 0.49 | 0.18 | YES |
| 13 | TGFB3 | TGFB3 | TGFB3 | 550 | 0.49 | 0.19 | YES |
| 14 | CACNA1H | CACNA1H | CACNA1H | 622 | 0.47 | 0.2 | YES |
| 15 | TGFB2 | TGFB2 | TGFB2 | 644 | 0.47 | 0.21 | YES |
| 16 | AKT3 | AKT3 | AKT3 | 748 | 0.44 | 0.22 | YES |
| 17 | RASGRP1 | RASGRP1 | RASGRP1 | 761 | 0.44 | 0.23 | YES |
| 18 | PRKX | PRKX | PRKX | 766 | 0.44 | 0.24 | YES |
| 19 | MAP3K12 | MAP3K12 | MAP3K12 | 784 | 0.44 | 0.26 | YES |
| 20 | DUSP4 | DUSP4 | DUSP4 | 925 | 0.41 | 0.26 | YES |
| 21 | CACNA2D1 | CACNA2D1 | CACNA2D1 | 933 | 0.41 | 0.27 | YES |
| 22 | PLA2G2A | PLA2G2A | PLA2G2A | 1099 | 0.39 | 0.27 | YES |
| 23 | CACNB1 | CACNB1 | CACNB1 | 1120 | 0.38 | 0.28 | YES |
| 24 | FLNC | FLNC | FLNC | 1205 | 0.37 | 0.29 | YES |
| 25 | IL1B | IL1B | IL1B | 1250 | 0.37 | 0.3 | YES |
| 26 | NFATC4 | NFATC4 | NFATC4 | 1297 | 0.36 | 0.31 | YES |
| 27 | NGF | NGF | NGF | 1508 | 0.34 | 0.3 | YES |
| 28 | PRKCB | PRKCB | PRKCB | 1538 | 0.33 | 0.31 | YES |
| 29 | MAP3K6 | MAP3K6 | MAP3K6 | 1560 | 0.33 | 0.32 | YES |
| 30 | TGFB1 | TGFB1 | TGFB1 | 1575 | 0.33 | 0.33 | YES |
| 31 | MAP4K1 | MAP4K1 | MAP4K1 | 1579 | 0.33 | 0.34 | YES |
| 32 | DUSP5 | DUSP5 | DUSP5 | 1674 | 0.32 | 0.34 | YES |
| 33 | MECOM | MECOM | MECOM | 1699 | 0.32 | 0.35 | YES |
| 34 | FGFR2 | FGFR2 | FGFR2 | 1727 | 0.32 | 0.36 | YES |
| 35 | PDGFA | PDGFA | PDGFA | 1768 | 0.31 | 0.36 | YES |
| 36 | TNF | TNF | TNF | 1799 | 0.31 | 0.37 | YES |
| 37 | FLNA | FLNA | FLNA | 1801 | 0.31 | 0.38 | YES |
| 38 | MAP3K5 | MAP3K5 | MAP3K5 | 1836 | 0.31 | 0.39 | YES |
| 39 | PTPN5 | PTPN5 | PTPN5 | 1848 | 0.3 | 0.4 | YES |
| 40 | RASGRP4 | RASGRP4 | RASGRP4 | 1863 | 0.3 | 0.4 | YES |
| 41 | RAC2 | RAC2 | RAC2 | 1875 | 0.3 | 0.41 | YES |
| 42 | MAPK12 | MAPK12 | MAPK12 | 1899 | 0.3 | 0.42 | YES |
| 43 | PTPRR | PTPRR | PTPRR | 1918 | 0.3 | 0.43 | YES |
| 44 | FGF14 | FGF14 | FGF14 | 1936 | 0.3 | 0.44 | YES |
| 45 | FGF11 | FGF11 | FGF11 | 1941 | 0.3 | 0.44 | YES |
| 46 | MAPK11 | MAPK11 | MAPK11 | 2005 | 0.29 | 0.45 | YES |
| 47 | CACNA2D3 | CACNA2D3 | CACNA2D3 | 2015 | 0.29 | 0.46 | YES |
| 48 | FOS | FOS | FOS | 2116 | 0.28 | 0.46 | YES |
| 49 | BDNF | BDNF | BDNF | 2120 | 0.28 | 0.47 | YES |
| 50 | RPS6KA2 | RPS6KA2 | RPS6KA2 | 2165 | 0.28 | 0.47 | YES |
| 51 | PTPN7 | PTPN7 | PTPN7 | 2378 | 0.26 | 0.47 | YES |
| 52 | PDGFRB | PDGFRB | PDGFRB | 2413 | 0.26 | 0.47 | YES |
| 53 | NTRK1 | NTRK1 | NTRK1 | 2427 | 0.26 | 0.48 | YES |
| 54 | RASGRP2 | RASGRP2 | RASGRP2 | 2613 | 0.24 | 0.48 | YES |
| 55 | RASGRP3 | RASGRP3 | RASGRP3 | 2718 | 0.24 | 0.48 | YES |
| 56 | CACNA1A | CACNA1A | CACNA1A | 2760 | 0.23 | 0.48 | YES |
| 57 | DUSP2 | DUSP2 | DUSP2 | 2822 | 0.23 | 0.48 | YES |
| 58 | MRAS | MRAS | MRAS | 2891 | 0.22 | 0.49 | YES |
| 59 | MAPK13 | MAPK13 | MAPK13 | 3056 | 0.21 | 0.48 | YES |
| 60 | CACNA1F | CACNA1F | CACNA1F | 3106 | 0.21 | 0.49 | YES |
| 61 | CACNA1D | CACNA1D | CACNA1D | 3219 | 0.2 | 0.49 | YES |
| 62 | NR4A1 | NR4A1 | NR4A1 | 3228 | 0.2 | 0.49 | YES |
| 63 | HSPA2 | HSPA2 | HSPA2 | 3245 | 0.2 | 0.5 | YES |
| 64 | PLA2G2D | PLA2G2D | PLA2G2D | 3456 | 0.19 | 0.49 | YES |
| 65 | PDGFB | PDGFB | PDGFB | 3570 | 0.18 | 0.49 | YES |
| 66 | RPS6KA6 | RPS6KA6 | RPS6KA6 | 3594 | 0.18 | 0.49 | YES |
| 67 | RRAS | RRAS | RRAS | 3630 | 0.17 | 0.5 | YES |
| 68 | RASGRF2 | RASGRF2 | RASGRF2 | 3681 | 0.17 | 0.5 | YES |
| 69 | CACNA1G | CACNA1G | CACNA1G | 3696 | 0.17 | 0.5 | YES |
| 70 | EGF | EGF | EGF | 3750 | 0.17 | 0.5 | YES |
| 71 | FGF13 | FGF13 | FGF13 | 3793 | 0.16 | 0.51 | YES |
| 72 | ARRB1 | ARRB1 | ARRB1 | 3796 | 0.16 | 0.51 | YES |
| 73 | HSPA6 | HSPA6 | HSPA6 | 3855 | 0.16 | 0.51 | YES |
| 74 | FGF12 | FGF12 | FGF12 | 3893 | 0.16 | 0.52 | YES |
| 75 | MYC | MYC | MYC | 3924 | 0.16 | 0.52 | YES |
| 76 | CACNA2D2 | CACNA2D2 | CACNA2D2 | 4057 | 0.15 | 0.52 | YES |
| 77 | CACNA2D4 | CACNA2D4 | CACNA2D4 | 4058 | 0.15 | 0.52 | YES |
| 78 | RELB | RELB | RELB | 4148 | 0.14 | 0.52 | YES |
| 79 | FASLG | FASLG | FASLG | 4193 | 0.14 | 0.52 | YES |
| 80 | CACNA1E | CACNA1E | CACNA1E | 4370 | 0.13 | 0.51 | YES |
| 81 | FGF9 | FGF9 | FGF9 | 4394 | 0.13 | 0.52 | YES |
| 82 | TP53 | TP53 | TP53 | 4408 | 0.13 | 0.52 | YES |
| 83 | FGF19 | FGF19 | FGF19 | 4465 | 0.13 | 0.52 | YES |
| 84 | CACNA1S | CACNA1S | CACNA1S | 4486 | 0.13 | 0.52 | YES |
| 85 | GADD45B | GADD45B | GADD45B | 4591 | 0.12 | 0.52 | NO |
| 86 | NFKB1 | NFKB1 | NFKB1 | 4811 | 0.11 | 0.51 | NO |
| 87 | NFATC2 | NFATC2 | NFATC2 | 4845 | 0.11 | 0.51 | NO |
| 88 | MAPT | MAPT | MAPT | 5012 | 0.1 | 0.51 | NO |
| 89 | DUSP1 | DUSP1 | DUSP1 | 5037 | 0.1 | 0.51 | NO |
| 90 | GNG12 | GNG12 | GNG12 | 5086 | 0.1 | 0.51 | NO |
| 91 | MAP4K3 | MAP4K3 | MAP4K3 | 5161 | 0.099 | 0.51 | NO |
| 92 | ZAK | ZAK | ZAK | 5190 | 0.098 | 0.51 | NO |
| 93 | MAP3K8 | MAP3K8 | MAP3K8 | 5238 | 0.096 | 0.51 | NO |
| 94 | RPS6KA5 | RPS6KA5 | RPS6KA5 | 5255 | 0.095 | 0.51 | NO |
| 95 | MAP3K1 | MAP3K1 | MAP3K1 | 5333 | 0.092 | 0.51 | NO |
| 96 | TGFBR1 | TGFBR1 | TGFBR1 | 5365 | 0.09 | 0.51 | NO |
| 97 | MAPK7 | MAPK7 | MAPK7 | 5399 | 0.089 | 0.51 | NO |
| 98 | EGFR | EGFR | EGFR | 5445 | 0.088 | 0.51 | NO |
| 99 | NFKB2 | NFKB2 | NFKB2 | 5556 | 0.084 | 0.51 | NO |
| 100 | MAPKAPK2 | MAPKAPK2 | MAPKAPK2 | 5585 | 0.083 | 0.51 | NO |
| 101 | PPP3CC | PPP3CC | PPP3CC | 5721 | 0.078 | 0.5 | NO |
| 102 | PPP3CA | PPP3CA | PPP3CA | 5725 | 0.078 | 0.5 | NO |
| 103 | TGFBR2 | TGFBR2 | TGFBR2 | 5799 | 0.076 | 0.5 | NO |
| 104 | DUSP7 | DUSP7 | DUSP7 | 5854 | 0.074 | 0.5 | NO |
| 105 | MAX | MAX | MAX | 5872 | 0.074 | 0.5 | NO |
| 106 | ARRB2 | ARRB2 | ARRB2 | 5899 | 0.073 | 0.5 | NO |
| 107 | CRK | CRK | CRK | 5901 | 0.073 | 0.5 | NO |
| 108 | IL1R1 | IL1R1 | IL1R1 | 5938 | 0.072 | 0.5 | NO |
| 109 | IKBKB | IKBKB | IKBKB | 5986 | 0.07 | 0.5 | NO |
| 110 | FAS | FAS | FAS | 6001 | 0.07 | 0.5 | NO |
| 111 | MAP3K2 | MAP3K2 | MAP3K2 | 6005 | 0.07 | 0.51 | NO |
| 112 | MAPKSP1 | MAPKSP1 | MAPKSP1 | 6014 | 0.07 | 0.51 | NO |
| 113 | RPS6KA4 | RPS6KA4 | RPS6KA4 | 6026 | 0.07 | 0.51 | NO |
| 114 | GNA12 | GNA12 | GNA12 | 6147 | 0.066 | 0.5 | NO |
| 115 | DUSP8 | DUSP8 | DUSP8 | 6163 | 0.066 | 0.51 | NO |
| 116 | RPS6KA1 | RPS6KA1 | RPS6KA1 | 6164 | 0.066 | 0.51 | NO |
| 117 | PLA2G12A | PLA2G12A | PLA2G12A | 6237 | 0.064 | 0.5 | NO |
| 118 | MAPK3 | MAPK3 | MAPK3 | 6456 | 0.059 | 0.5 | NO |
| 119 | MAP2K3 | MAP2K3 | MAP2K3 | 6478 | 0.059 | 0.5 | NO |
| 120 | CACNA1I | CACNA1I | CACNA1I | 6487 | 0.059 | 0.5 | NO |
| 121 | FGF2 | FGF2 | FGF2 | 6703 | 0.054 | 0.49 | NO |
| 122 | DUSP6 | DUSP6 | DUSP6 | 6741 | 0.053 | 0.48 | NO |
| 123 | TNFRSF1A | TNFRSF1A | TNFRSF1A | 6754 | 0.052 | 0.49 | NO |
| 124 | MAP2K1 | MAP2K1 | MAP2K1 | 6763 | 0.052 | 0.49 | NO |
| 125 | HSPA8 | HSPA8 | HSPA8 | 6814 | 0.051 | 0.48 | NO |
| 126 | IL1A | IL1A | IL1A | 6924 | 0.049 | 0.48 | NO |
| 127 | PLA2G10 | PLA2G10 | PLA2G10 | 7033 | 0.047 | 0.48 | NO |
| 128 | KRAS | KRAS | KRAS | 7083 | 0.045 | 0.47 | NO |
| 129 | TRAF6 | TRAF6 | TRAF6 | 7115 | 0.045 | 0.47 | NO |
| 130 | PPM1B | PPM1B | PPM1B | 7133 | 0.044 | 0.47 | NO |
| 131 | PRKACA | PRKACA | PRKACA | 7142 | 0.044 | 0.48 | NO |
| 132 | RAP1B | RAP1B | RAP1B | 7143 | 0.044 | 0.48 | NO |
| 133 | RAC1 | RAC1 | RAC1 | 7148 | 0.044 | 0.48 | NO |
| 134 | MAP2K4 | MAP2K4 | MAP2K4 | 7250 | 0.042 | 0.47 | NO |
| 135 | STK3 | STK3 | STK3 | 7269 | 0.041 | 0.47 | NO |
| 136 | PAK1 | PAK1 | PAK1 | 7355 | 0.04 | 0.47 | NO |
| 137 | CACNA1B | CACNA1B | CACNA1B | 7518 | 0.037 | 0.46 | NO |
| 138 | MAPK8IP3 | MAPK8IP3 | MAPK8IP3 | 7533 | 0.036 | 0.46 | NO |
| 139 | RASA1 | RASA1 | RASA1 | 7550 | 0.036 | 0.46 | NO |
| 140 | MAP3K3 | MAP3K3 | MAP3K3 | 7637 | 0.035 | 0.46 | NO |
| 141 | DUSP10 | DUSP10 | DUSP10 | 7724 | 0.033 | 0.45 | NO |
| 142 | AKT1 | AKT1 | AKT1 | 7775 | 0.032 | 0.45 | NO |
| 143 | PPP5C | PPP5C | PPP5C | 7839 | 0.031 | 0.45 | NO |
| 144 | SOS2 | SOS2 | SOS2 | 7870 | 0.031 | 0.45 | NO |
| 145 | PAK2 | PAK2 | PAK2 | 7916 | 0.03 | 0.45 | NO |
| 146 | RASA2 | RASA2 | RASA2 | 7937 | 0.03 | 0.45 | NO |
| 147 | CDC42 | CDC42 | CDC42 | 8025 | 0.028 | 0.44 | NO |
| 148 | CHP | CHP | CHP | 8154 | 0.026 | 0.44 | NO |
| 149 | PPP3CB | PPP3CB | PPP3CB | 8192 | 0.026 | 0.43 | NO |
| 150 | HSPB1 | HSPB1 | HSPB1 | 8254 | 0.025 | 0.43 | NO |
| 151 | MAPK8IP1 | MAPK8IP1 | MAPK8IP1 | 8405 | 0.023 | 0.42 | NO |
| 152 | RAPGEF2 | RAPGEF2 | RAPGEF2 | 8406 | 0.023 | 0.42 | NO |
| 153 | DUSP16 | DUSP16 | DUSP16 | 8453 | 0.022 | 0.42 | NO |
| 154 | RAP1A | RAP1A | RAP1A | 8484 | 0.022 | 0.42 | NO |
| 155 | JUN | JUN | JUN | 8506 | 0.021 | 0.42 | NO |
| 156 | ATF4 | ATF4 | ATF4 | 8565 | 0.02 | 0.42 | NO |
| 157 | TAOK1 | TAOK1 | TAOK1 | 8575 | 0.02 | 0.42 | NO |
| 158 | FGFR3 | FGFR3 | FGFR3 | 8591 | 0.02 | 0.42 | NO |
| 159 | CD14 | CD14 | CD14 | 8608 | 0.02 | 0.42 | NO |
| 160 | MAP4K4 | MAP4K4 | MAP4K4 | 8645 | 0.019 | 0.42 | NO |
| 161 | RASGRF1 | RASGRF1 | RASGRF1 | 8652 | 0.019 | 0.42 | NO |
| 162 | TAOK2 | TAOK2 | TAOK2 | 8660 | 0.019 | 0.42 | NO |
| 163 | MAPK9 | MAPK9 | MAPK9 | 8780 | 0.017 | 0.41 | NO |
| 164 | JMJD7-PLA2G4B | JMJD7-PLA2G4B | JMJD7-PLA2G4B | 8820 | 0.017 | 0.41 | NO |
| 165 | MKNK1 | MKNK1 | MKNK1 | 9170 | 0.012 | 0.39 | NO |
| 166 | MAPK8 | MAPK8 | MAPK8 | 9184 | 0.012 | 0.39 | NO |
| 167 | MAPKAPK3 | MAPKAPK3 | MAPKAPK3 | 9251 | 0.011 | 0.38 | NO |
| 168 | RRAS2 | RRAS2 | RRAS2 | 9444 | 0.0084 | 0.37 | NO |
| 169 | MAP2K5 | MAP2K5 | MAP2K5 | 9604 | 0.0065 | 0.36 | NO |
| 170 | MAP3K14 | MAP3K14 | MAP3K14 | 9628 | 0.0061 | 0.36 | NO |
| 171 | IKBKG | IKBKG | IKBKG | 9663 | 0.0055 | 0.36 | NO |
| 172 | SRF | SRF | SRF | 9699 | 0.005 | 0.36 | NO |
| 173 | MAP2K2 | MAP2K2 | MAP2K2 | 9712 | 0.0049 | 0.36 | NO |
| 174 | CHP2 | CHP2 | CHP2 | 9981 | 0.0016 | 0.34 | NO |
| 175 | DDIT3 | DDIT3 | DDIT3 | 10215 | -0.001 | 0.33 | NO |
| 176 | CACNG4 | CACNG4 | CACNG4 | 10295 | -0.002 | 0.33 | NO |
| 177 | JUND | JUND | JUND | 10312 | -0.0022 | 0.33 | NO |
| 178 | CHUK | CHUK | CHUK | 10385 | -0.003 | 0.32 | NO |
| 179 | CASP3 | CASP3 | CASP3 | 10465 | -0.0041 | 0.32 | NO |
| 180 | DUSP14 | DUSP14 | DUSP14 | 10491 | -0.0044 | 0.32 | NO |
| 181 | ELK4 | ELK4 | ELK4 | 10544 | -0.0051 | 0.31 | NO |
| 182 | NF1 | NF1 | NF1 | 10574 | -0.0055 | 0.31 | NO |
| 183 | TRAF2 | TRAF2 | TRAF2 | 10663 | -0.0065 | 0.31 | NO |
| 184 | CDC25B | CDC25B | CDC25B | 10750 | -0.0075 | 0.3 | NO |
| 185 | PLA2G6 | PLA2G6 | PLA2G6 | 10771 | -0.0078 | 0.3 | NO |
| 186 | MKNK2 | MKNK2 | MKNK2 | 10781 | -0.0079 | 0.3 | NO |
| 187 | PRKACB | PRKACB | PRKACB | 10812 | -0.0082 | 0.3 | NO |
| 188 | DUSP3 | DUSP3 | DUSP3 | 10817 | -0.0083 | 0.3 | NO |
| 189 | HRAS | HRAS | HRAS | 10983 | -0.01 | 0.29 | NO |
| 190 | STK4 | STK4 | STK4 | 11019 | -0.011 | 0.29 | NO |
| 191 | MAPK1 | MAPK1 | MAPK1 | 11085 | -0.012 | 0.28 | NO |
| 192 | RELA | RELA | RELA | 11131 | -0.012 | 0.28 | NO |
| 193 | TAOK3 | TAOK3 | TAOK3 | 11362 | -0.015 | 0.27 | NO |
| 194 | SOS1 | SOS1 | SOS1 | 11408 | -0.016 | 0.27 | NO |
| 195 | FGF21 | FGF21 | FGF21 | 11605 | -0.018 | 0.26 | NO |
| 196 | ELK1 | ELK1 | ELK1 | 11676 | -0.019 | 0.25 | NO |
| 197 | MAP4K2 | MAP4K2 | MAP4K2 | 11830 | -0.021 | 0.25 | NO |
| 198 | PPM1A | PPM1A | PPM1A | 12133 | -0.025 | 0.23 | NO |
| 199 | GADD45G | GADD45G | GADD45G | 12174 | -0.025 | 0.23 | NO |
| 200 | ATF2 | ATF2 | ATF2 | 12223 | -0.026 | 0.23 | NO |
| 201 | GADD45A | GADD45A | GADD45A | 12305 | -0.027 | 0.22 | NO |
| 202 | AKT2 | AKT2 | AKT2 | 12348 | -0.028 | 0.22 | NO |
| 203 | PPP3R1 | PPP3R1 | PPP3R1 | 12388 | -0.028 | 0.22 | NO |
| 204 | FGF22 | FGF22 | FGF22 | 12411 | -0.028 | 0.22 | NO |
| 205 | CACNB4 | CACNB4 | CACNB4 | 12417 | -0.028 | 0.22 | NO |
| 206 | FLNB | FLNB | FLNB | 12471 | -0.029 | 0.22 | NO |
| 207 | TAB1 | TAB1 | TAB1 | 12490 | -0.029 | 0.22 | NO |
| 208 | IL1R2 | IL1R2 | IL1R2 | 12499 | -0.029 | 0.22 | NO |
| 209 | MAPK8IP2 | MAPK8IP2 | MAPK8IP2 | 12646 | -0.031 | 0.21 | NO |
| 210 | MAP3K7 | MAP3K7 | MAP3K7 | 12693 | -0.032 | 0.21 | NO |
| 211 | GRB2 | GRB2 | GRB2 | 12701 | -0.032 | 0.21 | NO |
| 212 | PRKCG | PRKCG | PRKCG | 12717 | -0.032 | 0.21 | NO |
| 213 | MAP2K7 | MAP2K7 | MAP2K7 | 12844 | -0.034 | 0.2 | NO |
| 214 | MAPK14 | MAPK14 | MAPK14 | 12885 | -0.035 | 0.2 | NO |
| 215 | TAB2 | TAB2 | TAB2 | 12988 | -0.036 | 0.2 | NO |
| 216 | NRAS | NRAS | NRAS | 13162 | -0.039 | 0.19 | NO |
| 217 | MAP3K11 | MAP3K11 | MAP3K11 | 13208 | -0.04 | 0.19 | NO |
| 218 | RPS6KA3 | RPS6KA3 | RPS6KA3 | 13269 | -0.04 | 0.18 | NO |
| 219 | DAXX | DAXX | DAXX | 13356 | -0.041 | 0.18 | NO |
| 220 | MAPKAPK5 | MAPKAPK5 | MAPKAPK5 | 13371 | -0.042 | 0.18 | NO |
| 221 | MAP3K4 | MAP3K4 | MAP3K4 | 13419 | -0.042 | 0.18 | NO |
| 222 | CACNB2 | CACNB2 | CACNB2 | 13629 | -0.046 | 0.17 | NO |
| 223 | NLK | NLK | NLK | 13680 | -0.047 | 0.17 | NO |
| 224 | ECSIT | ECSIT | ECSIT | 13683 | -0.047 | 0.17 | NO |
| 225 | MAP3K13 | MAP3K13 | MAP3K13 | 13763 | -0.049 | 0.16 | NO |
| 226 | CRKL | CRKL | CRKL | 14312 | -0.059 | 0.14 | NO |
| 227 | FGFR4 | FGFR4 | FGFR4 | 14374 | -0.06 | 0.13 | NO |
| 228 | HSPA1B | HSPA1B | HSPA1B | 14685 | -0.068 | 0.12 | NO |
| 229 | RAF1 | RAF1 | RAF1 | 14790 | -0.07 | 0.11 | NO |
| 230 | BRAF | BRAF | BRAF | 14793 | -0.07 | 0.12 | NO |
| 231 | HSPA1A | HSPA1A | HSPA1A | 15039 | -0.077 | 0.1 | NO |
| 232 | STMN1 | STMN1 | STMN1 | 15094 | -0.079 | 0.1 | NO |
| 233 | PLA2G1B | PLA2G1B | PLA2G1B | 15146 | -0.08 | 0.1 | NO |
| 234 | PRKCA | PRKCA | PRKCA | 15772 | -0.1 | 0.07 | NO |
| 235 | CACNG1 | CACNG1 | CACNG1 | 15830 | -0.11 | 0.07 | NO |
| 236 | HSPA1L | HSPA1L | HSPA1L | 16628 | -0.16 | 0.029 | NO |
| 237 | FGF17 | FGF17 | FGF17 | 16631 | -0.16 | 0.033 | NO |
| 238 | DUSP9 | DUSP9 | DUSP9 | 17193 | -0.21 | 0.0073 | NO |
| 239 | PLA2G12B | PLA2G12B | PLA2G12B | 17315 | -0.23 | 0.0071 | NO |
| 240 | MAP2K6 | MAP2K6 | MAP2K6 | 17390 | -0.24 | 0.0099 | NO |
| 241 | RAC3 | RAC3 | RAC3 | 17620 | -0.32 | 0.0062 | NO |
Figure S73. Get High-res Image This plot shows mRNAseq_cNMF expression data heatmap (on the left) a RunningEnrichmentScore(RES) plot (on the top right) and a Signal2Noise(S2N) plot (on the bottom right) of genes in the pathway: BIOCARTA EGF PATHWAY.
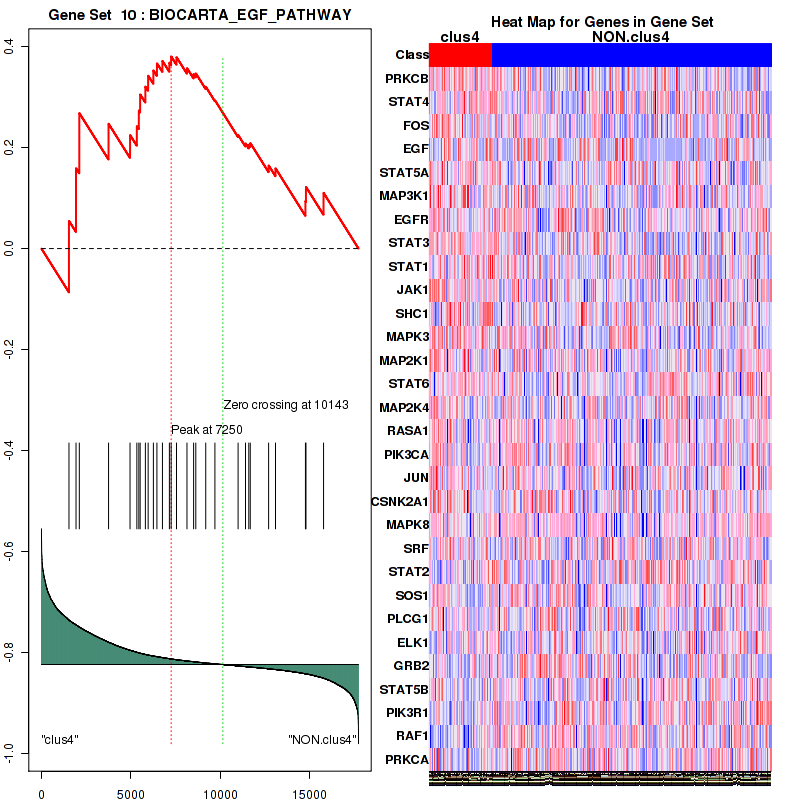
Figure S74. Get High-res Image For the top 5 core enriched genes in the pathway: BIOCARTA EGF PATHWAY, this volcano plot shows how much they are up/down-regulated and significant. The significance was calculated by empirical bayesian fit
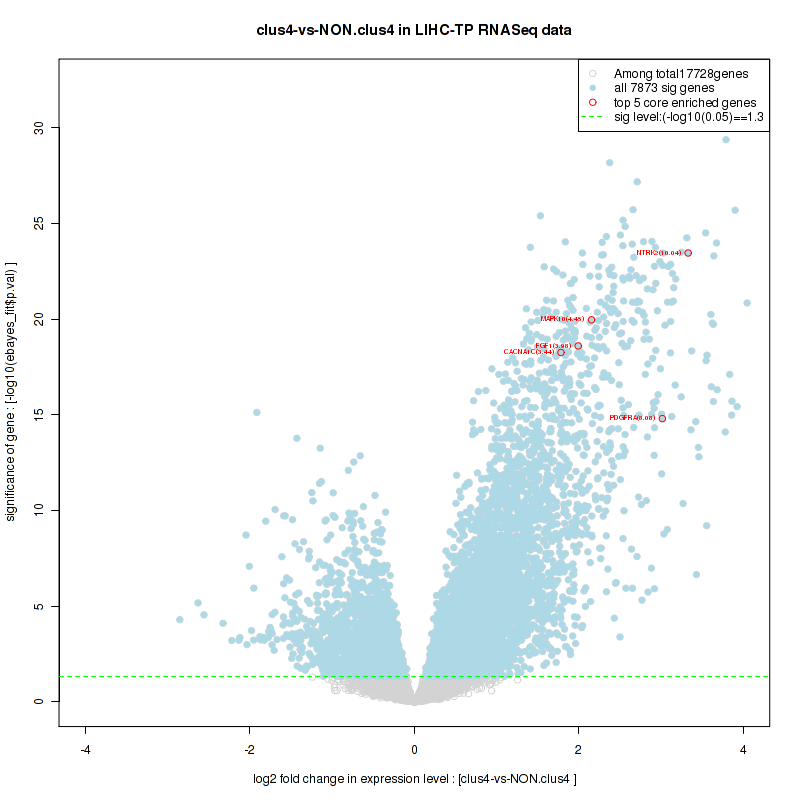
Table S38. Get Full Table This table shows a Running Enrichment Score (RES) of each gene in this pathway, that is, the enrichment score at this point in the ranked list of genes. All genes are ranked by Signal-to-Noise (S2N), a measure of similarity as default and are used to obtain ES matrix of all genes. In this way, GSEA tool uses expression pattern of not only overlapped genes but also not-overlapped genes to produce ES matrix.
| Rank | GENE | SYMBOL | DESC | LIST.LOC | S2N | RES | CORE_ENRICHMENT |
|---|---|---|---|---|---|---|---|
| 1 | HAND2 | HAND2 | HAND2 | 1 | 1 | 0.14 | YES |
| 2 | LIF | LIF | LIF | 402 | 0.53 | 0.19 | YES |
| 3 | PRKAR2B | PRKAR2B | PRKAR2B | 475 | 0.51 | 0.26 | YES |
| 4 | NFATC1 | NFATC1 | NFATC1 | 575 | 0.48 | 0.32 | YES |
| 5 | EDN1 | EDN1 | EDN1 | 780 | 0.44 | 0.37 | YES |
| 6 | CAMK4 | CAMK4 | CAMK4 | 1016 | 0.4 | 0.41 | YES |
| 7 | NFATC4 | NFATC4 | NFATC4 | 1297 | 0.36 | 0.44 | YES |
| 8 | CTF1 | CTF1 | CTF1 | 1333 | 0.36 | 0.49 | YES |
| 9 | CAMK1G | CAMK1G | CAMK1G | 1392 | 0.35 | 0.53 | YES |
| 10 | PIK3CG | PIK3CG | PIK3CG | 1828 | 0.31 | 0.55 | YES |
| 11 | MYH2 | MYH2 | MYH2 | 2308 | 0.27 | 0.56 | YES |
| 12 | PRKAR1B | PRKAR1B | PRKAR1B | 2672 | 0.24 | 0.57 | YES |
| 13 | HBEGF | HBEGF | HBEGF | 2975 | 0.22 | 0.59 | YES |
| 14 | NFATC2 | NFATC2 | NFATC2 | 4845 | 0.11 | 0.5 | NO |
| 15 | PPP3CC | PPP3CC | PPP3CC | 5721 | 0.078 | 0.46 | NO |
| 16 | PPP3CA | PPP3CA | PPP3CA | 5725 | 0.078 | 0.47 | NO |
| 17 | MAPK3 | MAPK3 | MAPK3 | 6456 | 0.059 | 0.44 | NO |
| 18 | FGF2 | FGF2 | FGF2 | 6703 | 0.054 | 0.43 | NO |
| 19 | FKBP1A | FKBP1A | FKBP1A | 6739 | 0.053 | 0.43 | NO |
| 20 | MAP2K1 | MAP2K1 | MAP2K1 | 6763 | 0.052 | 0.44 | NO |
| 21 | IGF1 | IGF1 | IGF1 | 7046 | 0.046 | 0.43 | NO |
| 22 | CALM2 | CALM2 | CALM2 | 7201 | 0.043 | 0.43 | NO |
| 23 | CALM1 | CALM1 | CALM1 | 7491 | 0.037 | 0.42 | NO |
| 24 | AKT1 | AKT1 | AKT1 | 7775 | 0.032 | 0.4 | NO |
| 25 | CSNK1A1 | CSNK1A1 | CSNK1A1 | 7949 | 0.03 | 0.4 | NO |
| 26 | PIK3CA | PIK3CA | PIK3CA | 8136 | 0.026 | 0.39 | NO |
| 27 | PPP3CB | PPP3CB | PPP3CB | 8192 | 0.026 | 0.39 | NO |
| 28 | MAPK8 | MAPK8 | MAPK8 | 9184 | 0.012 | 0.34 | NO |
| 29 | CREBBP | CREBBP | CREBBP | 9648 | 0.0058 | 0.31 | NO |
| 30 | CALR | CALR | CALR | 10507 | -0.0046 | 0.26 | NO |
| 31 | PRKACB | PRKACB | PRKACB | 10812 | -0.0082 | 0.25 | NO |
| 32 | CALM3 | CALM3 | CALM3 | 10832 | -0.0086 | 0.25 | NO |
| 33 | PRKAR1A | PRKAR1A | PRKAR1A | 10918 | -0.0096 | 0.24 | NO |
| 34 | HRAS | HRAS | HRAS | 10983 | -0.01 | 0.24 | NO |
| 35 | MAPK1 | MAPK1 | MAPK1 | 11085 | -0.012 | 0.24 | NO |
| 36 | GATA4 | GATA4 | GATA4 | 11511 | -0.017 | 0.22 | NO |
| 37 | GSK3B | GSK3B | GSK3B | 11610 | -0.018 | 0.21 | NO |
| 38 | MAPK14 | MAPK14 | MAPK14 | 12885 | -0.035 | 0.15 | NO |
| 39 | NFATC3 | NFATC3 | NFATC3 | 13325 | -0.041 | 0.13 | NO |
| 40 | CAMK1 | CAMK1 | CAMK1 | 14001 | -0.053 | 0.096 | NO |
| 41 | PIK3R1 | PIK3R1 | PIK3R1 | 14760 | -0.07 | 0.063 | NO |
| 42 | RAF1 | RAF1 | RAF1 | 14790 | -0.07 | 0.071 | NO |
| 43 | PRKAR2A | PRKAR2A | PRKAR2A | 14856 | -0.072 | 0.077 | NO |
| 44 | RPS6KB1 | RPS6KB1 | RPS6KB1 | 14869 | -0.072 | 0.087 | NO |
| 45 | AGT | AGT | AGT | 14875 | -0.072 | 0.096 | NO |
| 46 | ACTA1 | ACTA1 | ACTA1 | 15319 | -0.086 | 0.083 | NO |
| 47 | F2 | F2 | F2 | 16930 | -0.18 | 0.017 | NO |
| 48 | NPPA | NPPA | NPPA | 17149 | -0.2 | 0.033 | NO |
Figure S75. Get High-res Image This plot shows mRNAseq_cNMF expression data heatmap (on the left) a RunningEnrichmentScore(RES) plot (on the top right) and a Signal2Noise(S2N) plot (on the bottom right) of genes in the pathway: BIOCARTA ERK PATHWAY.
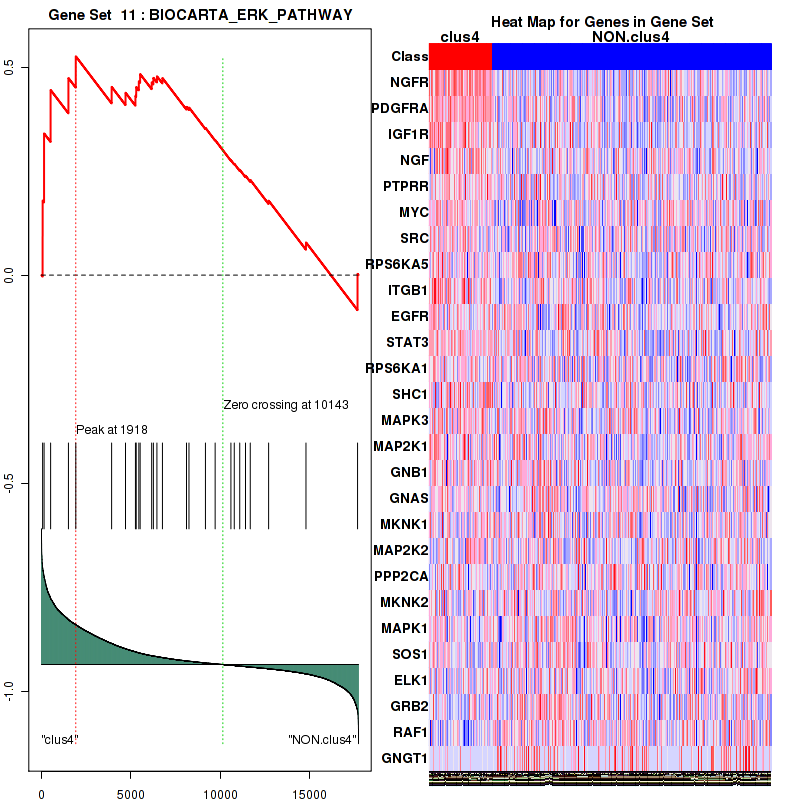
Figure S76. Get High-res Image For the top 5 core enriched genes in the pathway: BIOCARTA ERK PATHWAY, this volcano plot shows how much they are up/down-regulated and significant. The significance was calculated by empirical bayesian fit

Table S39. Get Full Table This table shows a Running Enrichment Score (RES) of each gene in this pathway, that is, the enrichment score at this point in the ranked list of genes. All genes are ranked by Signal-to-Noise (S2N), a measure of similarity as default and are used to obtain ES matrix of all genes. In this way, GSEA tool uses expression pattern of not only overlapped genes but also not-overlapped genes to produce ES matrix.
| Rank | GENE | SYMBOL | DESC | LIST.LOC | S2N | RES | CORE_ENRICHMENT |
|---|---|---|---|---|---|---|---|
| 1 | GLI2 | GLI2 | GLI2 | 5 | 0.92 | 0.018 | YES |
| 2 | LAMA2 | LAMA2 | LAMA2 | 67 | 0.73 | 0.028 | YES |
| 3 | MAPK10 | MAPK10 | MAPK10 | 102 | 0.7 | 0.039 | YES |
| 4 | FGF1 | FGF1 | FGF1 | 130 | 0.67 | 0.051 | YES |
| 5 | PDGFRA | PDGFRA | PDGFRA | 146 | 0.66 | 0.063 | YES |
| 6 | GLI3 | GLI3 | GLI3 | 161 | 0.65 | 0.074 | YES |
| 7 | WNT4 | WNT4 | WNT4 | 162 | 0.65 | 0.087 | YES |
| 8 | WNT2 | WNT2 | WNT2 | 171 | 0.64 | 0.099 | YES |
| 9 | MMP2 | MMP2 | MMP2 | 193 | 0.63 | 0.11 | YES |
| 10 | FZD2 | FZD2 | FZD2 | 198 | 0.63 | 0.12 | YES |
| 11 | WNT2B | WNT2B | WNT2B | 315 | 0.56 | 0.13 | YES |
| 12 | LAMC2 | LAMC2 | LAMC2 | 332 | 0.56 | 0.14 | YES |
| 13 | ITGA3 | ITGA3 | ITGA3 | 346 | 0.55 | 0.15 | YES |
| 14 | PTGS2 | PTGS2 | PTGS2 | 372 | 0.54 | 0.16 | YES |
| 15 | HHIP | HHIP | HHIP | 374 | 0.54 | 0.16 | YES |
| 16 | FZD10 | FZD10 | FZD10 | 377 | 0.54 | 0.18 | YES |
| 17 | FGF7 | FGF7 | FGF7 | 405 | 0.53 | 0.18 | YES |
| 18 | COL4A4 | COL4A4 | COL4A4 | 420 | 0.53 | 0.19 | YES |
| 19 | FGFR1 | FGFR1 | FGFR1 | 452 | 0.52 | 0.2 | YES |
| 20 | LAMC3 | LAMC3 | LAMC3 | 457 | 0.52 | 0.21 | YES |
| 21 | FGF18 | FGF18 | FGF18 | 500 | 0.5 | 0.22 | YES |
| 22 | IGF1R | IGF1R | IGF1R | 511 | 0.5 | 0.23 | YES |
| 23 | TGFB3 | TGFB3 | TGFB3 | 550 | 0.49 | 0.23 | YES |
| 24 | WNT10A | WNT10A | WNT10A | 605 | 0.48 | 0.24 | YES |
| 25 | LAMA1 | LAMA1 | LAMA1 | 621 | 0.47 | 0.25 | YES |
| 26 | IL8 | IL8 | IL8 | 631 | 0.47 | 0.26 | YES |
| 27 | TGFB2 | TGFB2 | TGFB2 | 644 | 0.47 | 0.26 | YES |
| 28 | FZD1 | FZD1 | FZD1 | 695 | 0.46 | 0.27 | YES |
| 29 | TGFA | TGFA | TGFA | 698 | 0.45 | 0.28 | YES |
| 30 | GLI1 | GLI1 | GLI1 | 700 | 0.45 | 0.29 | YES |
| 31 | WNT9A | WNT9A | WNT9A | 702 | 0.45 | 0.3 | YES |
| 32 | FZD7 | FZD7 | FZD7 | 713 | 0.45 | 0.3 | YES |
| 33 | FZD8 | FZD8 | FZD8 | 729 | 0.45 | 0.31 | YES |
| 34 | AKT3 | AKT3 | AKT3 | 748 | 0.44 | 0.32 | YES |
| 35 | MITF | MITF | MITF | 768 | 0.44 | 0.33 | YES |
| 36 | RUNX1T1 | RUNX1T1 | RUNX1T1 | 793 | 0.43 | 0.34 | YES |
| 37 | HGF | HGF | HGF | 820 | 0.43 | 0.34 | YES |
| 38 | ARNT2 | ARNT2 | ARNT2 | 838 | 0.42 | 0.35 | YES |
| 39 | CTBP2 | CTBP2 | CTBP2 | 868 | 0.42 | 0.36 | YES |
| 40 | WNT10B | WNT10B | WNT10B | 901 | 0.41 | 0.36 | YES |
| 41 | BCL2 | BCL2 | BCL2 | 912 | 0.41 | 0.37 | YES |
| 42 | VEGFC | VEGFC | VEGFC | 928 | 0.41 | 0.38 | YES |
| 43 | IL6 | IL6 | IL6 | 959 | 0.41 | 0.38 | YES |
| 44 | WNT7B | WNT7B | WNT7B | 1003 | 0.4 | 0.39 | YES |
| 45 | CSF2RA | CSF2RA | CSF2RA | 1010 | 0.4 | 0.4 | YES |
| 46 | GSTP1 | GSTP1 | GSTP1 | 1056 | 0.39 | 0.4 | YES |
| 47 | RARB | RARB | RARB | 1117 | 0.38 | 0.4 | YES |
| 48 | RET | RET | RET | 1208 | 0.37 | 0.41 | YES |
| 49 | PGF | PGF | PGF | 1244 | 0.37 | 0.41 | YES |
| 50 | PIK3R5 | PIK3R5 | PIK3R5 | 1370 | 0.36 | 0.41 | YES |
| 51 | PRKCB | PRKCB | PRKCB | 1538 | 0.33 | 0.41 | YES |
| 52 | TGFB1 | TGFB1 | TGFB1 | 1575 | 0.33 | 0.41 | YES |
| 53 | CSF3R | CSF3R | CSF3R | 1593 | 0.33 | 0.42 | YES |
| 54 | FLT3 | FLT3 | FLT3 | 1603 | 0.33 | 0.42 | YES |
| 55 | MECOM | MECOM | MECOM | 1699 | 0.32 | 0.42 | YES |
| 56 | FGFR2 | FGFR2 | FGFR2 | 1727 | 0.32 | 0.43 | YES |
| 57 | PDGFA | PDGFA | PDGFA | 1768 | 0.31 | 0.43 | YES |
| 58 | BIRC3 | BIRC3 | BIRC3 | 1774 | 0.31 | 0.44 | YES |
| 59 | PIK3CG | PIK3CG | PIK3CG | 1828 | 0.31 | 0.44 | YES |
| 60 | RAC2 | RAC2 | RAC2 | 1875 | 0.3 | 0.44 | YES |
| 61 | WNT7A | WNT7A | WNT7A | 1877 | 0.3 | 0.45 | YES |
| 62 | MMP9 | MMP9 | MMP9 | 1879 | 0.3 | 0.46 | YES |
| 63 | PIK3CD | PIK3CD | PIK3CD | 1884 | 0.3 | 0.46 | YES |
| 64 | FGF14 | FGF14 | FGF14 | 1936 | 0.3 | 0.46 | YES |
| 65 | FGF11 | FGF11 | FGF11 | 1941 | 0.3 | 0.47 | YES |
| 66 | KIT | KIT | KIT | 1957 | 0.3 | 0.47 | YES |
| 67 | WNT11 | WNT11 | WNT11 | 2070 | 0.28 | 0.47 | YES |
| 68 | FOS | FOS | FOS | 2116 | 0.28 | 0.48 | YES |
| 69 | WNT1 | WNT1 | WNT1 | 2139 | 0.28 | 0.48 | YES |
| 70 | CSF1R | CSF1R | CSF1R | 2182 | 0.28 | 0.48 | YES |
| 71 | LEF1 | LEF1 | LEF1 | 2213 | 0.27 | 0.49 | YES |
| 72 | COL4A2 | COL4A2 | COL4A2 | 2289 | 0.27 | 0.49 | YES |
| 73 | SPI1 | SPI1 | SPI1 | 2343 | 0.26 | 0.49 | YES |
| 74 | LAMB1 | LAMB1 | LAMB1 | 2397 | 0.26 | 0.49 | YES |
| 75 | PDGFRB | PDGFRB | PDGFRB | 2413 | 0.26 | 0.5 | YES |
| 76 | ITGA2 | ITGA2 | ITGA2 | 2421 | 0.26 | 0.5 | YES |
| 77 | PTCH2 | PTCH2 | PTCH2 | 2426 | 0.26 | 0.5 | YES |
| 78 | NTRK1 | NTRK1 | NTRK1 | 2427 | 0.26 | 0.51 | YES |
| 79 | PTCH1 | PTCH1 | PTCH1 | 2471 | 0.25 | 0.51 | YES |
| 80 | ETS1 | ETS1 | ETS1 | 2607 | 0.24 | 0.51 | YES |
| 81 | ITGAV | ITGAV | ITGAV | 2640 | 0.24 | 0.51 | YES |
| 82 | COL4A1 | COL4A1 | COL4A1 | 2792 | 0.23 | 0.51 | YES |
| 83 | WNT3A | WNT3A | WNT3A | 2845 | 0.23 | 0.51 | YES |
| 84 | EGLN3 | EGLN3 | EGLN3 | 2910 | 0.22 | 0.51 | YES |
| 85 | PLD1 | PLD1 | PLD1 | 2930 | 0.22 | 0.51 | YES |
| 86 | RUNX1 | RUNX1 | RUNX1 | 2950 | 0.22 | 0.52 | YES |
| 87 | LAMA5 | LAMA5 | LAMA5 | 3030 | 0.21 | 0.52 | YES |
| 88 | TRAF5 | TRAF5 | TRAF5 | 3036 | 0.21 | 0.52 | YES |
| 89 | CCNA1 | CCNA1 | CCNA1 | 3178 | 0.2 | 0.51 | YES |
| 90 | CDH1 | CDH1 | CDH1 | 3179 | 0.2 | 0.52 | YES |
| 91 | FZD6 | FZD6 | FZD6 | 3357 | 0.19 | 0.51 | YES |
| 92 | FLT3LG | FLT3LG | FLT3LG | 3368 | 0.19 | 0.52 | YES |
| 93 | HIF1A | HIF1A | HIF1A | 3473 | 0.18 | 0.51 | YES |
| 94 | BMP2 | BMP2 | BMP2 | 3522 | 0.18 | 0.51 | YES |
| 95 | NOS2 | NOS2 | NOS2 | 3547 | 0.18 | 0.52 | YES |
| 96 | PDGFB | PDGFB | PDGFB | 3570 | 0.18 | 0.52 | YES |
| 97 | WNT9B | WNT9B | WNT9B | 3585 | 0.18 | 0.52 | YES |
| 98 | EGF | EGF | EGF | 3750 | 0.17 | 0.51 | YES |
| 99 | FGF13 | FGF13 | FGF13 | 3793 | 0.16 | 0.52 | YES |
| 100 | WNT6 | WNT6 | WNT6 | 3803 | 0.16 | 0.52 | YES |
| 101 | FZD3 | FZD3 | FZD3 | 3841 | 0.16 | 0.52 | YES |
| 102 | FGF12 | FGF12 | FGF12 | 3893 | 0.16 | 0.52 | YES |
| 103 | CBL | CBL | CBL | 3919 | 0.16 | 0.52 | YES |
| 104 | MYC | MYC | MYC | 3924 | 0.16 | 0.52 | YES |
| 105 | RALGDS | RALGDS | RALGDS | 3987 | 0.16 | 0.52 | YES |
| 106 | LAMA4 | LAMA4 | LAMA4 | 4025 | 0.15 | 0.52 | YES |
| 107 | ITGA2B | ITGA2B | ITGA2B | 4081 | 0.15 | 0.52 | YES |
| 108 | APC2 | APC2 | APC2 | 4125 | 0.15 | 0.52 | YES |
| 109 | FASLG | FASLG | FASLG | 4193 | 0.14 | 0.52 | YES |
| 110 | RB1 | RB1 | RB1 | 4262 | 0.14 | 0.52 | YES |
| 111 | FGF9 | FGF9 | FGF9 | 4394 | 0.13 | 0.52 | YES |
| 112 | VEGFB | VEGFB | VEGFB | 4400 | 0.13 | 0.52 | YES |
| 113 | TP53 | TP53 | TP53 | 4408 | 0.13 | 0.52 | YES |
| 114 | PML | PML | PML | 4459 | 0.13 | 0.52 | YES |
| 115 | FGF19 | FGF19 | FGF19 | 4465 | 0.13 | 0.52 | YES |
| 116 | TRAF1 | TRAF1 | TRAF1 | 4528 | 0.13 | 0.52 | YES |
| 117 | LAMB4 | LAMB4 | LAMB4 | 4544 | 0.12 | 0.52 | YES |
| 118 | PIK3R3 | PIK3R3 | PIK3R3 | 4569 | 0.12 | 0.52 | YES |
| 119 | PLCG2 | PLCG2 | PLCG2 | 4644 | 0.12 | 0.52 | YES |
| 120 | SLC2A1 | SLC2A1 | SLC2A1 | 4664 | 0.12 | 0.52 | YES |
| 121 | RASSF5 | RASSF5 | RASSF5 | 4728 | 0.12 | 0.52 | YES |
| 122 | CBLB | CBLB | CBLB | 4807 | 0.11 | 0.52 | YES |
| 123 | RALB | RALB | RALB | 4810 | 0.11 | 0.52 | YES |
| 124 | NFKB1 | NFKB1 | NFKB1 | 4811 | 0.11 | 0.52 | YES |
| 125 | CCND1 | CCND1 | CCND1 | 4814 | 0.11 | 0.53 | YES |
| 126 | WNT16 | WNT16 | WNT16 | 4844 | 0.11 | 0.53 | YES |
| 127 | DAPK1 | DAPK1 | DAPK1 | 4942 | 0.11 | 0.52 | NO |
| 128 | STAT5A | STAT5A | STAT5A | 4953 | 0.11 | 0.52 | NO |
| 129 | CDKN1A | CDKN1A | CDKN1A | 4955 | 0.11 | 0.53 | NO |
| 130 | NKX3-1 | NKX3-1 | NKX3-1 | 5027 | 0.1 | 0.52 | NO |
| 131 | E2F3 | E2F3 | E2F3 | 5144 | 0.1 | 0.52 | NO |
| 132 | CDK6 | CDK6 | CDK6 | 5178 | 0.098 | 0.52 | NO |
| 133 | AXIN1 | AXIN1 | AXIN1 | 5274 | 0.094 | 0.52 | NO |
| 134 | ITGB1 | ITGB1 | ITGB1 | 5298 | 0.093 | 0.52 | NO |
| 135 | TGFBR1 | TGFBR1 | TGFBR1 | 5365 | 0.09 | 0.51 | NO |
| 136 | EGFR | EGFR | EGFR | 5445 | 0.088 | 0.51 | NO |
| 137 | PPARD | PPARD | PPARD | 5458 | 0.087 | 0.51 | NO |
| 138 | EPAS1 | EPAS1 | EPAS1 | 5477 | 0.086 | 0.51 | NO |
| 139 | STAT3 | STAT3 | STAT3 | 5518 | 0.085 | 0.51 | NO |
| 140 | NFKB2 | NFKB2 | NFKB2 | 5556 | 0.084 | 0.51 | NO |
| 141 | LAMC1 | LAMC1 | LAMC1 | 5770 | 0.077 | 0.5 | NO |
| 142 | TGFBR2 | TGFBR2 | TGFBR2 | 5799 | 0.076 | 0.5 | NO |
| 143 | STAT1 | STAT1 | STAT1 | 5810 | 0.075 | 0.5 | NO |
| 144 | ERBB2 | ERBB2 | ERBB2 | 5826 | 0.075 | 0.5 | NO |
| 145 | MAX | MAX | MAX | 5872 | 0.074 | 0.5 | NO |
| 146 | CRK | CRK | CRK | 5901 | 0.073 | 0.5 | NO |
| 147 | CDKN2B | CDKN2B | CDKN2B | 5927 | 0.072 | 0.5 | NO |
| 148 | ABL1 | ABL1 | ABL1 | 5944 | 0.072 | 0.5 | NO |
| 149 | JAK1 | JAK1 | JAK1 | 5965 | 0.071 | 0.5 | NO |
| 150 | COL4A6 | COL4A6 | COL4A6 | 5968 | 0.071 | 0.5 | NO |
| 151 | IKBKB | IKBKB | IKBKB | 5986 | 0.07 | 0.5 | NO |
| 152 | FAS | FAS | FAS | 6001 | 0.07 | 0.5 | NO |
| 153 | PAX8 | PAX8 | PAX8 | 6245 | 0.064 | 0.49 | NO |
| 154 | KITLG | KITLG | KITLG | 6417 | 0.06 | 0.48 | NO |
| 155 | MAPK3 | MAPK3 | MAPK3 | 6456 | 0.059 | 0.48 | NO |
| 156 | EGLN1 | EGLN1 | EGLN1 | 6650 | 0.055 | 0.47 | NO |
| 157 | SUFU | SUFU | SUFU | 6684 | 0.054 | 0.47 | NO |
| 158 | FGF2 | FGF2 | FGF2 | 6703 | 0.054 | 0.47 | NO |
| 159 | LAMB3 | LAMB3 | LAMB3 | 6740 | 0.053 | 0.47 | NO |
| 160 | CCDC6 | CCDC6 | CCDC6 | 6752 | 0.052 | 0.47 | NO |
| 161 | MAP2K1 | MAP2K1 | MAP2K1 | 6763 | 0.052 | 0.47 | NO |
| 162 | BCR | BCR | BCR | 6766 | 0.052 | 0.47 | NO |
| 163 | PIAS3 | PIAS3 | PIAS3 | 6851 | 0.05 | 0.47 | NO |
| 164 | SMAD2 | SMAD2 | SMAD2 | 6912 | 0.049 | 0.46 | NO |
| 165 | DAPK3 | DAPK3 | DAPK3 | 6931 | 0.049 | 0.46 | NO |
| 166 | TRAF3 | TRAF3 | TRAF3 | 6994 | 0.047 | 0.46 | NO |
| 167 | IGF1 | IGF1 | IGF1 | 7046 | 0.046 | 0.46 | NO |
| 168 | BID | BID | BID | 7073 | 0.046 | 0.46 | NO |
| 169 | KRAS | KRAS | KRAS | 7083 | 0.045 | 0.46 | NO |
| 170 | BCL2L1 | BCL2L1 | BCL2L1 | 7085 | 0.045 | 0.46 | NO |
| 171 | TRAF6 | TRAF6 | TRAF6 | 7115 | 0.045 | 0.46 | NO |
| 172 | RAC1 | RAC1 | RAC1 | 7148 | 0.044 | 0.46 | NO |
| 173 | ZBTB16 | ZBTB16 | ZBTB16 | 7178 | 0.043 | 0.46 | NO |
| 174 | FZD4 | FZD4 | FZD4 | 7183 | 0.043 | 0.46 | NO |
| 175 | NFKBIA | NFKBIA | NFKBIA | 7273 | 0.041 | 0.45 | NO |
| 176 | WNT5A | WNT5A | WNT5A | 7279 | 0.041 | 0.45 | NO |
| 177 | WNT5B | WNT5B | WNT5B | 7290 | 0.041 | 0.46 | NO |
| 178 | LAMA3 | LAMA3 | LAMA3 | 7365 | 0.04 | 0.45 | NO |
| 179 | FOXO1 | FOXO1 | FOXO1 | 7410 | 0.039 | 0.45 | NO |
| 180 | CYCS | CYCS | CYCS | 7422 | 0.038 | 0.45 | NO |
| 181 | JUP | JUP | JUP | 7587 | 0.036 | 0.44 | NO |
| 182 | AKT1 | AKT1 | AKT1 | 7775 | 0.032 | 0.43 | NO |
| 183 | LAMB2 | LAMB2 | LAMB2 | 7799 | 0.032 | 0.43 | NO |
| 184 | PTK2 | PTK2 | PTK2 | 7848 | 0.031 | 0.43 | NO |
| 185 | SOS2 | SOS2 | SOS2 | 7870 | 0.031 | 0.43 | NO |
| 186 | CTNNA1 | CTNNA1 | CTNNA1 | 7942 | 0.03 | 0.42 | NO |
| 187 | BAX | BAX | BAX | 7969 | 0.029 | 0.42 | NO |
| 188 | BAD | BAD | BAD | 8004 | 0.029 | 0.42 | NO |
| 189 | DAPK2 | DAPK2 | DAPK2 | 8009 | 0.028 | 0.42 | NO |
| 190 | APC | APC | APC | 8023 | 0.028 | 0.42 | NO |
| 191 | CDC42 | CDC42 | CDC42 | 8025 | 0.028 | 0.42 | NO |
| 192 | PIK3CA | PIK3CA | PIK3CA | 8136 | 0.026 | 0.42 | NO |
| 193 | FADD | FADD | FADD | 8409 | 0.023 | 0.4 | NO |
| 194 | XIAP | XIAP | XIAP | 8458 | 0.022 | 0.4 | NO |
| 195 | JUN | JUN | JUN | 8506 | 0.021 | 0.4 | NO |
| 196 | TPM3 | TPM3 | TPM3 | 8519 | 0.021 | 0.4 | NO |
| 197 | FGFR3 | FGFR3 | FGFR3 | 8591 | 0.02 | 0.39 | NO |
| 198 | CBLC | CBLC | CBLC | 8701 | 0.018 | 0.39 | NO |
| 199 | MAPK9 | MAPK9 | MAPK9 | 8780 | 0.017 | 0.38 | NO |
| 200 | TCEB1 | TCEB1 | TCEB1 | 8818 | 0.017 | 0.38 | NO |
| 201 | RALA | RALA | RALA | 8891 | 0.015 | 0.38 | NO |
| 202 | ARAF | ARAF | ARAF | 8957 | 0.014 | 0.37 | NO |
| 203 | CASP8 | CASP8 | CASP8 | 8991 | 0.014 | 0.37 | NO |
| 204 | TCF7L2 | TCF7L2 | TCF7L2 | 9172 | 0.012 | 0.36 | NO |
| 205 | MAPK8 | MAPK8 | MAPK8 | 9184 | 0.012 | 0.36 | NO |
| 206 | RHOA | RHOA | RHOA | 9253 | 0.011 | 0.36 | NO |
| 207 | PTEN | PTEN | PTEN | 9257 | 0.011 | 0.36 | NO |
| 208 | MMP1 | MMP1 | MMP1 | 9298 | 0.01 | 0.36 | NO |
| 209 | RBX1 | RBX1 | RBX1 | 9482 | 0.0079 | 0.34 | NO |
| 210 | CREBBP | CREBBP | CREBBP | 9648 | 0.0058 | 0.34 | NO |
| 211 | IKBKG | IKBKG | IKBKG | 9663 | 0.0055 | 0.34 | NO |
| 212 | MAP2K2 | MAP2K2 | MAP2K2 | 9712 | 0.0049 | 0.33 | NO |
| 213 | PIK3CB | PIK3CB | PIK3CB | 9781 | 0.0041 | 0.33 | NO |
| 214 | RASSF1 | RASSF1 | RASSF1 | 9809 | 0.0037 | 0.33 | NO |
| 215 | FN1 | FN1 | FN1 | 9821 | 0.0036 | 0.33 | NO |
| 216 | TCEB2 | TCEB2 | TCEB2 | 9877 | 0.0028 | 0.32 | NO |
| 217 | HSP90AA1 | HSP90AA1 | HSP90AA1 | 10025 | 0.0012 | 0.32 | NO |
| 218 | HDAC1 | HDAC1 | HDAC1 | 10089 | 0.00055 | 0.31 | NO |
| 219 | SMAD3 | SMAD3 | SMAD3 | 10237 | -0.0012 | 0.3 | NO |
| 220 | APPL1 | APPL1 | APPL1 | 10346 | -0.0026 | 0.3 | NO |
| 221 | RALBP1 | RALBP1 | RALBP1 | 10383 | -0.0029 | 0.3 | NO |
| 222 | CHUK | CHUK | CHUK | 10385 | -0.003 | 0.3 | NO |
| 223 | CTBP1 | CTBP1 | CTBP1 | 10395 | -0.0031 | 0.29 | NO |
| 224 | CASP3 | CASP3 | CASP3 | 10465 | -0.0041 | 0.29 | NO |
| 225 | PIAS2 | PIAS2 | PIAS2 | 10575 | -0.0055 | 0.28 | NO |
| 226 | TCF7L1 | TCF7L1 | TCF7L1 | 10620 | -0.006 | 0.28 | NO |
| 227 | TRAF2 | TRAF2 | TRAF2 | 10663 | -0.0065 | 0.28 | NO |
| 228 | FZD9 | FZD9 | FZD9 | 10675 | -0.0067 | 0.28 | NO |
| 229 | WNT3 | WNT3 | WNT3 | 10734 | -0.0072 | 0.28 | NO |
| 230 | HSP90B1 | HSP90B1 | HSP90B1 | 10851 | -0.0088 | 0.27 | NO |
| 231 | STK4 | STK4 | STK4 | 11019 | -0.011 | 0.26 | NO |
| 232 | HSP90AB1 | HSP90AB1 | HSP90AB1 | 11079 | -0.012 | 0.26 | NO |
| 233 | MAPK1 | MAPK1 | MAPK1 | 11085 | -0.012 | 0.26 | NO |
| 234 | RELA | RELA | RELA | 11131 | -0.012 | 0.25 | NO |
| 235 | PIAS4 | PIAS4 | PIAS4 | 11137 | -0.012 | 0.25 | NO |
| 236 | HDAC2 | HDAC2 | HDAC2 | 11195 | -0.013 | 0.25 | NO |
| 237 | RARA | RARA | RARA | 11221 | -0.013 | 0.25 | NO |
| 238 | SMAD4 | SMAD4 | SMAD4 | 11225 | -0.013 | 0.25 | NO |
| 239 | MLH1 | MLH1 | MLH1 | 11232 | -0.014 | 0.25 | NO |
| 240 | EGLN2 | EGLN2 | EGLN2 | 11291 | -0.014 | 0.25 | NO |
| 241 | MDM2 | MDM2 | MDM2 | 11363 | -0.015 | 0.24 | NO |
| 242 | SOS1 | SOS1 | SOS1 | 11408 | -0.016 | 0.24 | NO |
| 243 | DVL3 | DVL3 | DVL3 | 11435 | -0.016 | 0.24 | NO |
| 244 | AXIN2 | AXIN2 | AXIN2 | 11458 | -0.016 | 0.24 | NO |
| 245 | EP300 | EP300 | EP300 | 11540 | -0.017 | 0.24 | NO |
| 246 | PLCG1 | PLCG1 | PLCG1 | 11593 | -0.018 | 0.23 | NO |
| 247 | FGF21 | FGF21 | FGF21 | 11605 | -0.018 | 0.23 | NO |
| 248 | GSK3B | GSK3B | GSK3B | 11610 | -0.018 | 0.23 | NO |
| 249 | FH | FH | FH | 11669 | -0.019 | 0.23 | NO |
| 250 | PIK3R2 | PIK3R2 | PIK3R2 | 11746 | -0.02 | 0.22 | NO |
| 251 | RXRG | RXRG | RXRG | 11870 | -0.021 | 0.22 | NO |
| 252 | MSH3 | MSH3 | MSH3 | 12083 | -0.024 | 0.21 | NO |
| 253 | BIRC2 | BIRC2 | BIRC2 | 12209 | -0.026 | 0.2 | NO |
| 254 | AKT2 | AKT2 | AKT2 | 12348 | -0.028 | 0.19 | NO |
| 255 | TFG | TFG | TFG | 12362 | -0.028 | 0.19 | NO |
| 256 | FGF22 | FGF22 | FGF22 | 12411 | -0.028 | 0.19 | NO |
| 257 | TPR | TPR | TPR | 12508 | -0.03 | 0.18 | NO |
| 258 | DVL1 | DVL1 | DVL1 | 12659 | -0.032 | 0.18 | NO |
| 259 | GRB2 | GRB2 | GRB2 | 12701 | -0.032 | 0.18 | NO |
| 260 | PRKCG | PRKCG | PRKCG | 12717 | -0.032 | 0.18 | NO |
| 261 | DVL2 | DVL2 | DVL2 | 12767 | -0.033 | 0.17 | NO |
| 262 | CDKN1B | CDKN1B | CDKN1B | 12895 | -0.035 | 0.17 | NO |
| 263 | CTNNB1 | CTNNB1 | CTNNB1 | 12896 | -0.035 | 0.17 | NO |
| 264 | MTOR | MTOR | MTOR | 12905 | -0.035 | 0.17 | NO |
| 265 | CCNE1 | CCNE1 | CCNE1 | 12938 | -0.036 | 0.17 | NO |
| 266 | ITGA6 | ITGA6 | ITGA6 | 12983 | -0.036 | 0.16 | NO |
| 267 | CASP9 | CASP9 | CASP9 | 13049 | -0.037 | 0.16 | NO |
| 268 | STAT5B | STAT5B | STAT5B | 13085 | -0.038 | 0.16 | NO |
| 269 | CDK4 | CDK4 | CDK4 | 13105 | -0.038 | 0.16 | NO |
| 270 | CUL2 | CUL2 | CUL2 | 13120 | -0.038 | 0.16 | NO |
| 271 | NRAS | NRAS | NRAS | 13162 | -0.039 | 0.16 | NO |
| 272 | ARNT | ARNT | ARNT | 13197 | -0.039 | 0.16 | NO |
| 273 | MSH6 | MSH6 | MSH6 | 13270 | -0.04 | 0.15 | NO |
| 274 | VHL | VHL | VHL | 13398 | -0.042 | 0.15 | NO |
| 275 | RXRA | RXRA | RXRA | 13551 | -0.045 | 0.14 | NO |
| 276 | VEGFA | VEGFA | VEGFA | 13730 | -0.048 | 0.13 | NO |
| 277 | NCOA4 | NCOA4 | NCOA4 | 14022 | -0.054 | 0.11 | NO |
| 278 | TRAF4 | TRAF4 | TRAF4 | 14052 | -0.054 | 0.11 | NO |
| 279 | CRKL | CRKL | CRKL | 14312 | -0.059 | 0.1 | NO |
| 280 | CKS1B | CKS1B | CKS1B | 14373 | -0.06 | 0.097 | NO |
| 281 | STK36 | STK36 | STK36 | 14462 | -0.063 | 0.093 | NO |
| 282 | SHH | SHH | SHH | 14717 | -0.069 | 0.08 | NO |
| 283 | PIK3R1 | PIK3R1 | PIK3R1 | 14760 | -0.07 | 0.079 | NO |
| 284 | PIAS1 | PIAS1 | PIAS1 | 14761 | -0.07 | 0.08 | NO |
| 285 | RAF1 | RAF1 | RAF1 | 14790 | -0.07 | 0.08 | NO |
| 286 | BRAF | BRAF | BRAF | 14793 | -0.07 | 0.081 | NO |
| 287 | RXRB | RXRB | RXRB | 14964 | -0.075 | 0.073 | NO |
| 288 | BMP4 | BMP4 | BMP4 | 15122 | -0.08 | 0.066 | NO |
| 289 | FZD5 | FZD5 | FZD5 | 15131 | -0.08 | 0.067 | NO |
| 290 | MSH2 | MSH2 | MSH2 | 15214 | -0.082 | 0.064 | NO |
| 291 | MET | MET | MET | 15509 | -0.093 | 0.048 | NO |
| 292 | CDK2 | CDK2 | CDK2 | 15701 | -0.1 | 0.039 | NO |
| 293 | AR | AR | AR | 15756 | -0.1 | 0.038 | NO |
| 294 | PRKCA | PRKCA | PRKCA | 15772 | -0.1 | 0.039 | NO |
| 295 | E2F2 | E2F2 | E2F2 | 16011 | -0.12 | 0.028 | NO |
| 296 | CEBPA | CEBPA | CEBPA | 16184 | -0.12 | 0.02 | NO |
| 297 | PPARG | PPARG | PPARG | 16361 | -0.14 | 0.013 | NO |
| 298 | RAD51 | RAD51 | RAD51 | 16385 | -0.14 | 0.014 | NO |
| 299 | CCNE2 | CCNE2 | CCNE2 | 16531 | -0.15 | 0.0088 | NO |
| 300 | FGF17 | FGF17 | FGF17 | 16631 | -0.16 | 0.0062 | NO |
| 301 | CTNNA3 | CTNNA3 | CTNNA3 | 16715 | -0.16 | 0.0045 | NO |
| 302 | SMO | SMO | SMO | 16853 | -0.17 | 0.000022 | NO |
| 303 | BRCA2 | BRCA2 | BRCA2 | 16871 | -0.18 | 0.0024 | NO |
| 304 | WNT8B | WNT8B | WNT8B | 17064 | -0.19 | -0.0049 | NO |
| 305 | FIGF | FIGF | FIGF | 17088 | -0.2 | -0.0024 | NO |
| 306 | CDKN2A | CDKN2A | CDKN2A | 17201 | -0.21 | -0.0047 | NO |
| 307 | TCF7 | TCF7 | TCF7 | 17245 | -0.22 | -0.003 | NO |
| 308 | E2F1 | E2F1 | E2F1 | 17261 | -0.22 | 0.00036 | NO |
| 309 | BIRC5 | BIRC5 | BIRC5 | 17368 | -0.24 | -0.0011 | NO |
| 310 | DCC | DCC | DCC | 17432 | -0.25 | 0.00014 | NO |
| 311 | CTNNA2 | CTNNA2 | CTNNA2 | 17452 | -0.26 | 0.004 | NO |
| 312 | SKP2 | SKP2 | SKP2 | 17533 | -0.29 | 0.0049 | NO |
| 313 | RAC3 | RAC3 | RAC3 | 17620 | -0.32 | 0.0062 | NO |
Figure S77. Get High-res Image This plot shows mRNAseq_cNMF expression data heatmap (on the left) a RunningEnrichmentScore(RES) plot (on the top right) and a Signal2Noise(S2N) plot (on the bottom right) of genes in the pathway: BIOCARTA FAS PATHWAY.
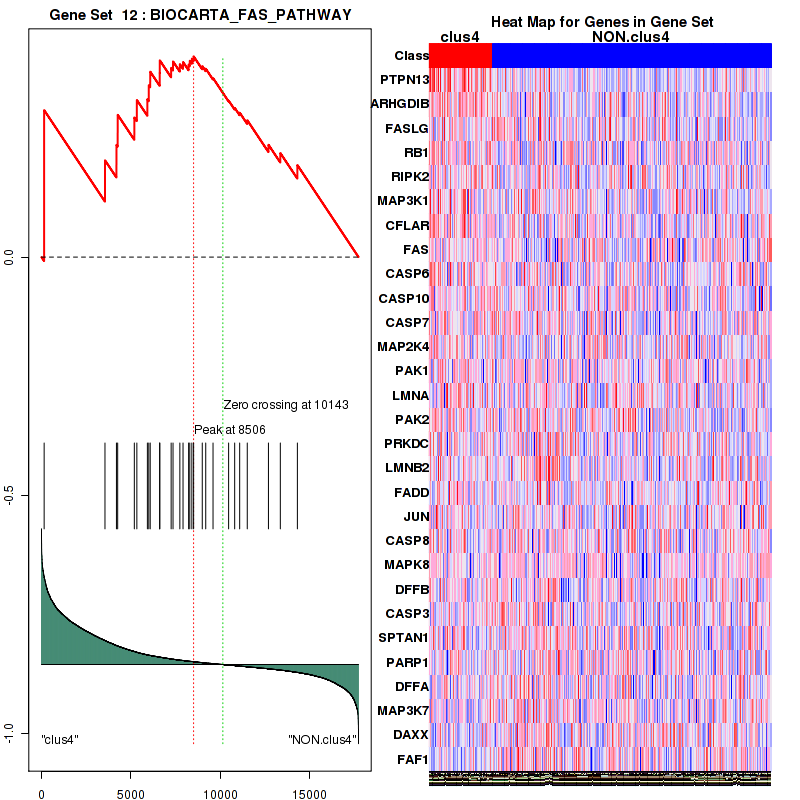
Figure S78. Get High-res Image For the top 5 core enriched genes in the pathway: BIOCARTA FAS PATHWAY, this volcano plot shows how much they are up/down-regulated and significant. The significance was calculated by empirical bayesian fit
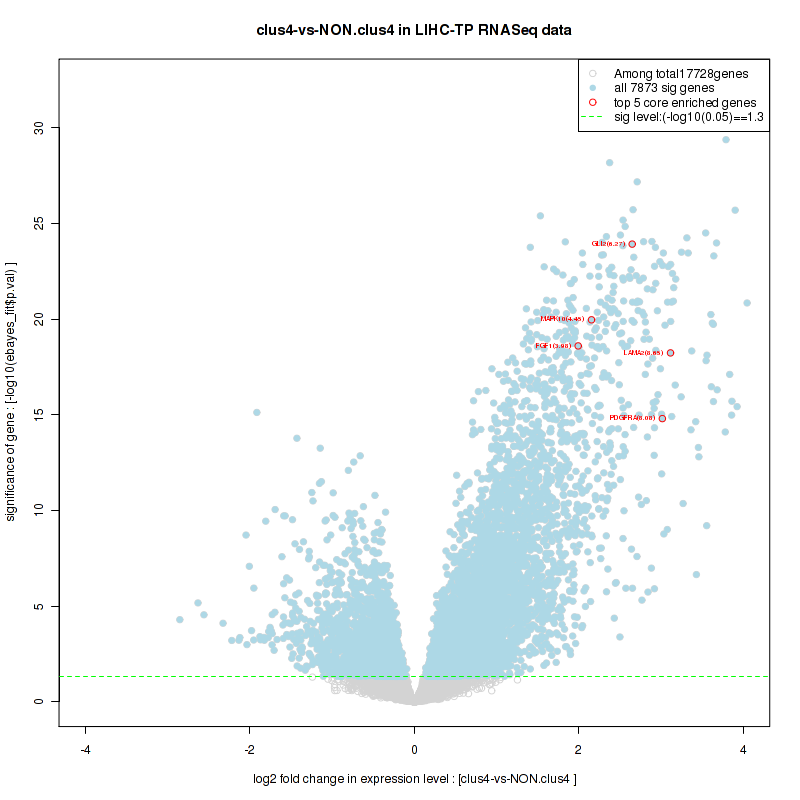
Table S40. Get Full Table This table shows a Running Enrichment Score (RES) of each gene in this pathway, that is, the enrichment score at this point in the ranked list of genes. All genes are ranked by Signal-to-Noise (S2N), a measure of similarity as default and are used to obtain ES matrix of all genes. In this way, GSEA tool uses expression pattern of not only overlapped genes but also not-overlapped genes to produce ES matrix.
| Rank | GENE | SYMBOL | DESC | LIST.LOC | S2N | RES | CORE_ENRICHMENT |
|---|---|---|---|---|---|---|---|
| 1 | TGFB3 | TGFB3 | TGFB3 | 550 | 0.49 | 0.027 | YES |
| 2 | TGFB2 | TGFB2 | TGFB2 | 644 | 0.47 | 0.078 | YES |
| 3 | TGFA | TGFA | TGFA | 698 | 0.45 | 0.13 | YES |
| 4 | AKT3 | AKT3 | AKT3 | 748 | 0.44 | 0.18 | YES |
| 5 | HGF | HGF | HGF | 820 | 0.43 | 0.23 | YES |
| 6 | ARNT2 | ARNT2 | ARNT2 | 838 | 0.42 | 0.28 | YES |
| 7 | VEGFC | VEGFC | VEGFC | 928 | 0.41 | 0.32 | YES |
| 8 | PGF | PGF | PGF | 1244 | 0.37 | 0.35 | YES |
| 9 | PIK3R5 | PIK3R5 | PIK3R5 | 1370 | 0.36 | 0.38 | YES |
| 10 | TGFB1 | TGFB1 | TGFB1 | 1575 | 0.33 | 0.41 | YES |
| 11 | PIK3CG | PIK3CG | PIK3CG | 1828 | 0.31 | 0.43 | YES |
| 12 | PIK3CD | PIK3CD | PIK3CD | 1884 | 0.3 | 0.47 | YES |
| 13 | PAK7 | PAK7 | PAK7 | 2424 | 0.26 | 0.47 | YES |
| 14 | ETS1 | ETS1 | ETS1 | 2607 | 0.24 | 0.48 | YES |
| 15 | EGLN3 | EGLN3 | EGLN3 | 2910 | 0.22 | 0.5 | YES |
| 16 | PAK3 | PAK3 | PAK3 | 3461 | 0.19 | 0.49 | YES |
| 17 | HIF1A | HIF1A | HIF1A | 3473 | 0.18 | 0.51 | YES |
| 18 | PDGFB | PDGFB | PDGFB | 3570 | 0.18 | 0.52 | YES |
| 19 | PAK6 | PAK6 | PAK6 | 4254 | 0.14 | 0.5 | NO |
| 20 | VEGFB | VEGFB | VEGFB | 4400 | 0.13 | 0.51 | NO |
| 21 | PIK3R3 | PIK3R3 | PIK3R3 | 4569 | 0.12 | 0.51 | NO |
| 22 | SLC2A1 | SLC2A1 | SLC2A1 | 4664 | 0.12 | 0.52 | NO |
| 23 | EPAS1 | EPAS1 | EPAS1 | 5477 | 0.086 | 0.49 | NO |
| 24 | CRK | CRK | CRK | 5901 | 0.073 | 0.47 | NO |
| 25 | MAPK3 | MAPK3 | MAPK3 | 6456 | 0.059 | 0.45 | NO |
| 26 | EGLN1 | EGLN1 | EGLN1 | 6650 | 0.055 | 0.44 | NO |
| 27 | MAP2K1 | MAP2K1 | MAP2K1 | 6763 | 0.052 | 0.44 | NO |
| 28 | KRAS | KRAS | KRAS | 7083 | 0.045 | 0.43 | NO |
| 29 | RAP1B | RAP1B | RAP1B | 7143 | 0.044 | 0.43 | NO |
| 30 | GAB1 | GAB1 | GAB1 | 7147 | 0.044 | 0.44 | NO |
| 31 | RAC1 | RAC1 | RAC1 | 7148 | 0.044 | 0.44 | NO |
| 32 | RAPGEF1 | RAPGEF1 | RAPGEF1 | 7289 | 0.041 | 0.44 | NO |
| 33 | PAK1 | PAK1 | PAK1 | 7355 | 0.04 | 0.44 | NO |
| 34 | AKT1 | AKT1 | AKT1 | 7775 | 0.032 | 0.42 | NO |
| 35 | SOS2 | SOS2 | SOS2 | 7870 | 0.031 | 0.42 | NO |
| 36 | PAK2 | PAK2 | PAK2 | 7916 | 0.03 | 0.42 | NO |
| 37 | CDC42 | CDC42 | CDC42 | 8025 | 0.028 | 0.42 | NO |
| 38 | PIK3CA | PIK3CA | PIK3CA | 8136 | 0.026 | 0.42 | NO |
| 39 | RAP1A | RAP1A | RAP1A | 8484 | 0.022 | 0.4 | NO |
| 40 | JUN | JUN | JUN | 8506 | 0.021 | 0.4 | NO |
| 41 | TCEB1 | TCEB1 | TCEB1 | 8818 | 0.017 | 0.38 | NO |
| 42 | ARAF | ARAF | ARAF | 8957 | 0.014 | 0.38 | NO |
| 43 | RBX1 | RBX1 | RBX1 | 9482 | 0.0079 | 0.35 | NO |
| 44 | CREBBP | CREBBP | CREBBP | 9648 | 0.0058 | 0.34 | NO |
| 45 | MAP2K2 | MAP2K2 | MAP2K2 | 9712 | 0.0049 | 0.34 | NO |
| 46 | FLCN | FLCN | FLCN | 9721 | 0.0048 | 0.34 | NO |
| 47 | PIK3CB | PIK3CB | PIK3CB | 9781 | 0.0041 | 0.34 | NO |
| 48 | TCEB2 | TCEB2 | TCEB2 | 9877 | 0.0028 | 0.33 | NO |
| 49 | PTPN11 | PTPN11 | PTPN11 | 10976 | -0.01 | 0.27 | NO |
| 50 | MAPK1 | MAPK1 | MAPK1 | 11085 | -0.012 | 0.26 | NO |
| 51 | EGLN2 | EGLN2 | EGLN2 | 11291 | -0.014 | 0.25 | NO |
| 52 | SOS1 | SOS1 | SOS1 | 11408 | -0.016 | 0.25 | NO |
| 53 | PAK4 | PAK4 | PAK4 | 11444 | -0.016 | 0.25 | NO |
| 54 | EP300 | EP300 | EP300 | 11540 | -0.017 | 0.25 | NO |
| 55 | FH | FH | FH | 11669 | -0.019 | 0.24 | NO |
| 56 | PIK3R2 | PIK3R2 | PIK3R2 | 11746 | -0.02 | 0.24 | NO |
| 57 | AKT2 | AKT2 | AKT2 | 12348 | -0.028 | 0.21 | NO |
| 58 | GRB2 | GRB2 | GRB2 | 12701 | -0.032 | 0.19 | NO |
| 59 | CUL2 | CUL2 | CUL2 | 13120 | -0.038 | 0.17 | NO |
| 60 | NRAS | NRAS | NRAS | 13162 | -0.039 | 0.18 | NO |
| 61 | ARNT | ARNT | ARNT | 13197 | -0.039 | 0.18 | NO |
| 62 | VHL | VHL | VHL | 13398 | -0.042 | 0.17 | NO |
| 63 | VEGFA | VEGFA | VEGFA | 13730 | -0.048 | 0.16 | NO |
| 64 | CRKL | CRKL | CRKL | 14312 | -0.059 | 0.13 | NO |
| 65 | PIK3R1 | PIK3R1 | PIK3R1 | 14760 | -0.07 | 0.12 | NO |
| 66 | RAF1 | RAF1 | RAF1 | 14790 | -0.07 | 0.12 | NO |
| 67 | BRAF | BRAF | BRAF | 14793 | -0.07 | 0.13 | NO |
| 68 | MET | MET | MET | 15509 | -0.093 | 0.1 | NO |
| 69 | FIGF | FIGF | FIGF | 17088 | -0.2 | 0.036 | NO |
Figure S79. Get High-res Image This plot shows mRNAseq_cNMF expression data heatmap (on the left) a RunningEnrichmentScore(RES) plot (on the top right) and a Signal2Noise(S2N) plot (on the bottom right) of genes in the pathway: BIOCARTA FCER1 PATHWAY.
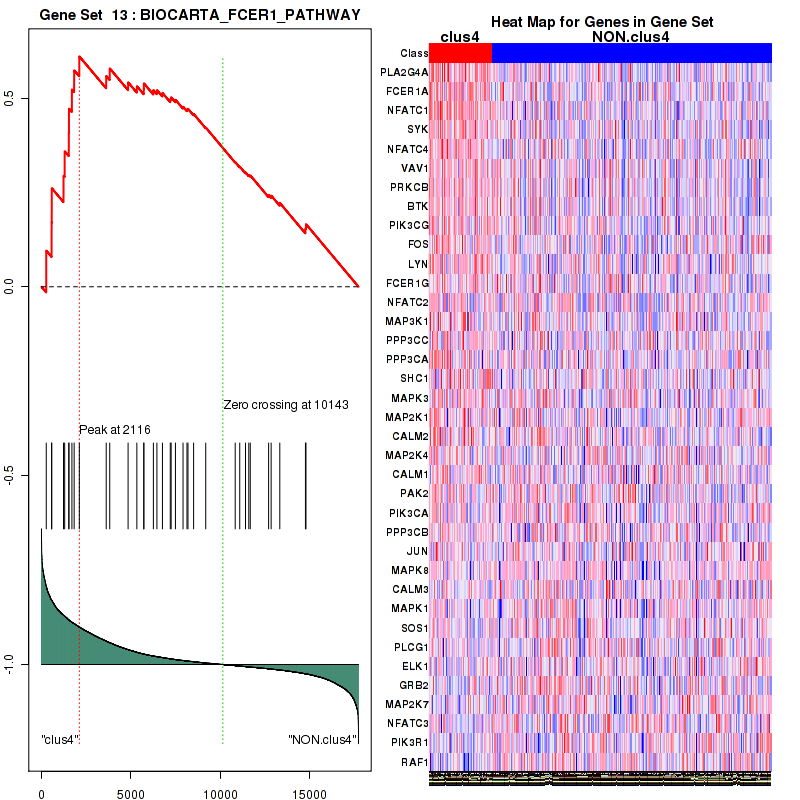
Figure S80. Get High-res Image For the top 5 core enriched genes in the pathway: BIOCARTA FCER1 PATHWAY, this volcano plot shows how much they are up/down-regulated and significant. The significance was calculated by empirical bayesian fit

For the top enriched genes, if you want to check whether they are
-
up-regulated, please check the list of up-regulated genes
-
down-regulated, please check the list of down-regulated genes
For the top enriched genes, if you want to check whether they are
-
highly expressed genes, please check the list of high (top 30%) expressed genes
-
low expressed genes, please check the list of low (bottom 30%) expressed genes
An expression pattern of top(30%)/middle(30%)/low(30%) in this subtype against other subtypes is available in a heatmap
For the top enriched genes, if you want to check whether they are
-
significantly differently expressed genes by eBayes lm fit, please check the list of significant genes
Table 7. Get Full Table This table shows top 10 pathways which are significantly enriched in cluster clus5. It displays only significant gene sets satisfying nom.p.val.threshold (-1), fwer.p.val.threshold (-1) , fdr.q.val.threshold (0.25) and the default table is sorted by Normalized Enrichment Score (NES). Further details on NES statistics, please visit The Broad GSEA website.
| GeneSet(GS) | Size(#genes) | genes.ES.table | ES | NES | NOM.p.val | FDR.q.val | FWER.p.val | Tag.. | Gene.. | Signal | FDR..median. | glob.p.val |
|---|---|---|---|---|---|---|---|---|---|---|---|---|
| BIOCARTA WNT PATHWAY | 25 | genes.ES.table | 0.35 | 1.2 | 0.29 | 0.6 | 1 | 0.28 | 0.14 | 0.24 | 0.54 | 0.13 |
| KEGG PENTOSE AND GLUCURONATE INTERCONVERSIONS | 26 | genes.ES.table | 0.7 | 1.4 | 0.13 | 0.67 | 0.96 | 0.54 | 0.086 | 0.49 | 0.53 | 0.21 |
| KEGG FATTY ACID METABOLISM | 41 | genes.ES.table | 0.68 | 1.6 | 0.028 | 1 | 0.72 | 0.56 | 0.14 | 0.48 | 0.84 | 0.45 |
| KEGG STEROID HORMONE BIOSYNTHESIS | 51 | genes.ES.table | 0.65 | 1.4 | 0.086 | 0.67 | 0.95 | 0.53 | 0.093 | 0.48 | 0.52 | 0.22 |
| KEGG VALINE LEUCINE AND ISOLEUCINE DEGRADATION | 43 | genes.ES.table | 0.53 | 1.4 | 0.19 | 0.62 | 0.97 | 0.63 | 0.21 | 0.5 | 0.49 | 0.18 |
| KEGG LYSINE DEGRADATION | 43 | genes.ES.table | 0.38 | 1.3 | 0.25 | 0.62 | 0.99 | 0.35 | 0.19 | 0.28 | 0.54 | 0.16 |
| KEGG TYROSINE METABOLISM | 39 | genes.ES.table | 0.57 | 1.5 | 0.047 | 0.73 | 0.86 | 0.41 | 0.11 | 0.37 | 0.5 | 0.25 |
| KEGG TRYPTOPHAN METABOLISM | 38 | genes.ES.table | 0.48 | 1.2 | 0.22 | 0.61 | 1 | 0.34 | 0.087 | 0.31 | 0.53 | 0.14 |
| KEGG PROPANOATE METABOLISM | 31 | genes.ES.table | 0.43 | 1.1 | 0.36 | 0.69 | 1 | 0.48 | 0.17 | 0.4 | 0.64 | 0.17 |
| KEGG BUTANOATE METABOLISM | 30 | genes.ES.table | 0.55 | 1.4 | 0.15 | 0.58 | 0.97 | 0.57 | 0.17 | 0.47 | 0.46 | 0.15 |
Table S41. Get Full Table This table shows a Running Enrichment Score (RES) of each gene in this pathway, that is, the enrichment score at this point in the ranked list of genes. All genes are ranked by Signal-to-Noise (S2N), a measure of similarity as default and are used to obtain ES matrix of all genes. In this way, GSEA tool uses expression pattern of not only overlapped genes but also not-overlapped genes to produce ES matrix.
| Rank | GENE | SYMBOL | DESC | LIST.LOC | S2N | RES | CORE_ENRICHMENT |
|---|---|---|---|---|---|---|---|
| 1 | ACSL6 | ACSL6 | ACSL6 | 55 | 0.77 | 0.11 | YES |
| 2 | ACSL5 | ACSL5 | ACSL5 | 174 | 0.48 | 0.18 | YES |
| 3 | ADH1B | ADH1B | ADH1B | 194 | 0.47 | 0.25 | YES |
| 4 | ADH4 | ADH4 | ADH4 | 230 | 0.43 | 0.32 | YES |
| 5 | ADH6 | ADH6 | ADH6 | 237 | 0.43 | 0.38 | YES |
| 6 | EHHADH | EHHADH | EHHADH | 627 | 0.26 | 0.4 | YES |
| 7 | ADH1C | ADH1C | ADH1C | 691 | 0.25 | 0.43 | YES |
| 8 | ALDH3A2 | ALDH3A2 | ALDH3A2 | 878 | 0.22 | 0.46 | YES |
| 9 | ACADL | ACADL | ACADL | 1071 | 0.19 | 0.47 | YES |
| 10 | ADH7 | ADH7 | ADH7 | 1082 | 0.19 | 0.5 | YES |
| 11 | HADH | HADH | HADH | 1253 | 0.17 | 0.52 | YES |
| 12 | ALDH2 | ALDH2 | ALDH2 | 1357 | 0.16 | 0.54 | YES |
| 13 | ALDH1B1 | ALDH1B1 | ALDH1B1 | 1361 | 0.16 | 0.56 | YES |
| 14 | GCDH | GCDH | GCDH | 1464 | 0.15 | 0.57 | YES |
| 15 | ACADSB | ACADSB | ACADSB | 1529 | 0.14 | 0.59 | YES |
| 16 | ACAA1 | ACAA1 | ACAA1 | 1658 | 0.13 | 0.61 | YES |
| 17 | PECI | PECI | PECI | 1793 | 0.12 | 0.62 | YES |
| 18 | ADH5 | ADH5 | ADH5 | 1876 | 0.12 | 0.63 | YES |
| 19 | ADH1A | ADH1A | ADH1A | 1914 | 0.12 | 0.64 | YES |
| 20 | DCI | DCI | DCI | 1958 | 0.11 | 0.66 | YES |
| 21 | CPT2 | CPT2 | CPT2 | 2064 | 0.11 | 0.67 | YES |
| 22 | ACADM | ACADM | ACADM | 2401 | 0.09 | 0.66 | YES |
| 23 | ECHS1 | ECHS1 | ECHS1 | 2429 | 0.088 | 0.68 | YES |
| 24 | CYP4A11 | CYP4A11 | CYP4A11 | 2821 | 0.073 | 0.67 | NO |
| 25 | ALDH7A1 | ALDH7A1 | ALDH7A1 | 2851 | 0.072 | 0.68 | NO |
| 26 | ALDH9A1 | ALDH9A1 | ALDH9A1 | 3054 | 0.065 | 0.67 | NO |
| 27 | CPT1C | CPT1C | CPT1C | 3308 | 0.058 | 0.67 | NO |
| 28 | CYP4A22 | CYP4A22 | CYP4A22 | 3394 | 0.056 | 0.67 | NO |
| 29 | ACAA2 | ACAA2 | ACAA2 | 3577 | 0.051 | 0.67 | NO |
| 30 | ACSL1 | ACSL1 | ACSL1 | 4345 | 0.034 | 0.63 | NO |
| 31 | ACADVL | ACADVL | ACADVL | 4486 | 0.032 | 0.63 | NO |
| 32 | ACAT1 | ACAT1 | ACAT1 | 4859 | 0.024 | 0.61 | NO |
| 33 | ACSL3 | ACSL3 | ACSL3 | 4948 | 0.022 | 0.61 | NO |
| 34 | HADHB | HADHB | HADHB | 5851 | 0.0068 | 0.56 | NO |
| 35 | HADHA | HADHA | HADHA | 5855 | 0.0068 | 0.56 | NO |
| 36 | ACAT2 | ACAT2 | ACAT2 | 7881 | -0.024 | 0.45 | NO |
| 37 | ACADS | ACADS | ACADS | 8671 | -0.037 | 0.41 | NO |
| 38 | ACOX3 | ACOX3 | ACOX3 | 8819 | -0.04 | 0.41 | NO |
| 39 | CPT1A | CPT1A | CPT1A | 9156 | -0.046 | 0.4 | NO |
| 40 | CPT1B | CPT1B | CPT1B | 12074 | -0.13 | 0.25 | NO |
| 41 | ACSL4 | ACSL4 | ACSL4 | 16983 | -0.46 | 0.042 | NO |
Figure S81. Get High-res Image This plot shows mRNAseq_cNMF expression data heatmap (on the left) a RunningEnrichmentScore(RES) plot (on the top right) and a Signal2Noise(S2N) plot (on the bottom right) of genes in the pathway: BIOCARTA WNT PATHWAY.
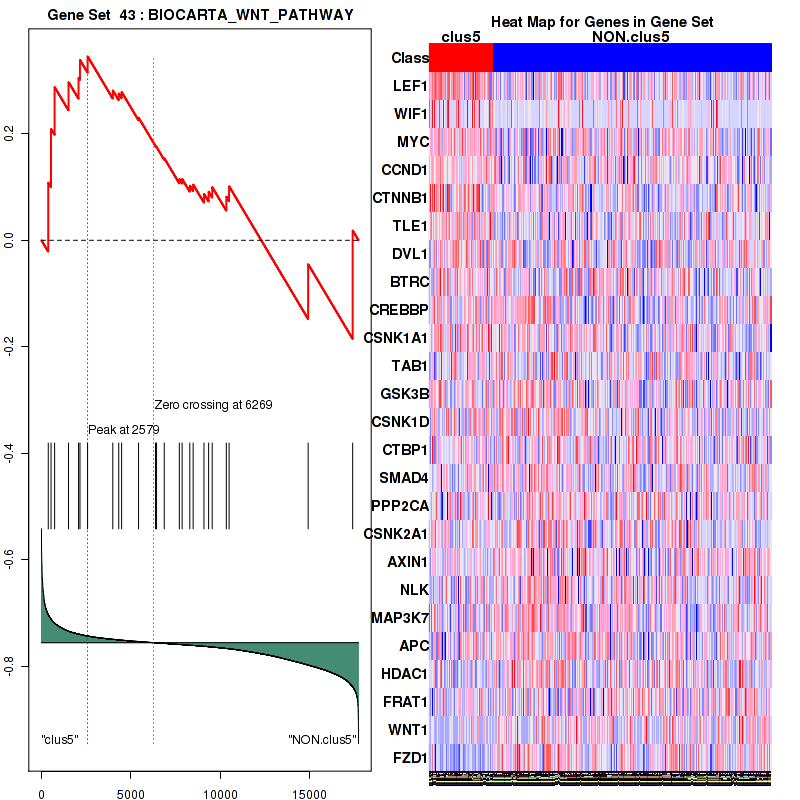
Figure S82. Get High-res Image For the top 5 core enriched genes in the pathway: BIOCARTA WNT PATHWAY, this volcano plot shows how much they are up/down-regulated and significant. The significance was calculated by empirical bayesian fit
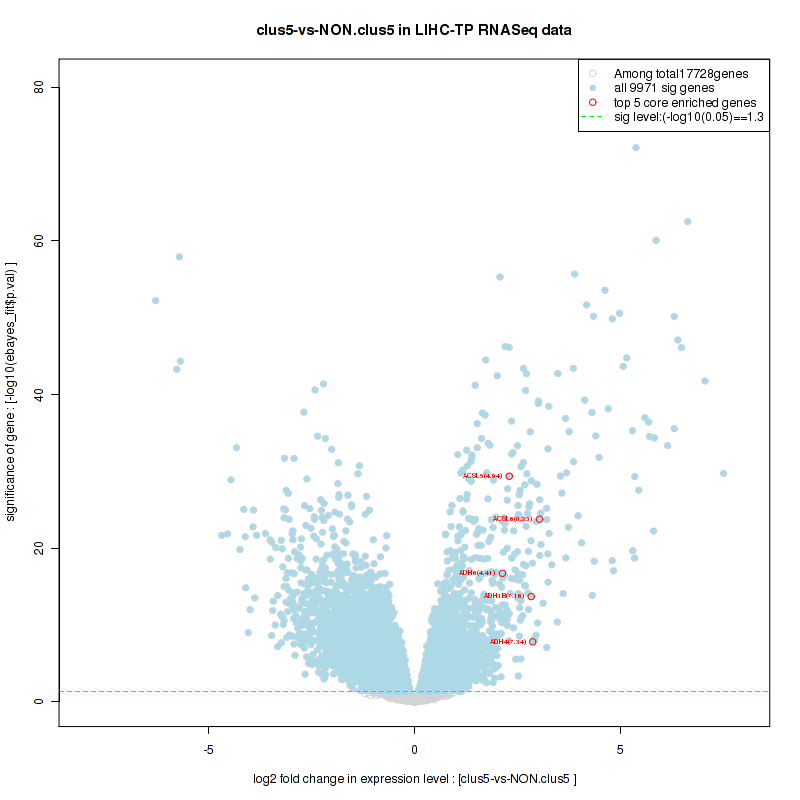
Table S42. Get Full Table This table shows a Running Enrichment Score (RES) of each gene in this pathway, that is, the enrichment score at this point in the ranked list of genes. All genes are ranked by Signal-to-Noise (S2N), a measure of similarity as default and are used to obtain ES matrix of all genes. In this way, GSEA tool uses expression pattern of not only overlapped genes but also not-overlapped genes to produce ES matrix.
| Rank | GENE | SYMBOL | DESC | LIST.LOC | S2N | RES | CORE_ENRICHMENT |
|---|---|---|---|---|---|---|---|
| 1 | UGT1A3 | UGT1A3 | UGT1A3 | 49 | 0.78 | 0.1 | YES |
| 2 | UGT1A5 | UGT1A5 | UGT1A5 | 56 | 0.76 | 0.21 | YES |
| 3 | UGT1A4 | UGT1A4 | UGT1A4 | 74 | 0.69 | 0.3 | YES |
| 4 | UGT1A1 | UGT1A1 | UGT1A1 | 181 | 0.48 | 0.36 | YES |
| 5 | UGT1A9 | UGT1A9 | UGT1A9 | 302 | 0.38 | 0.41 | YES |
| 6 | UGT1A6 | UGT1A6 | UGT1A6 | 469 | 0.31 | 0.44 | YES |
| 7 | UGT2B28 | UGT2B28 | UGT2B28 | 496 | 0.31 | 0.48 | YES |
| 8 | ALAS1 | ALAS1 | ALAS1 | 514 | 0.3 | 0.52 | YES |
| 9 | UGT2B10 | UGT2B10 | UGT2B10 | 607 | 0.27 | 0.56 | YES |
| 10 | UGT2B7 | UGT2B7 | UGT2B7 | 937 | 0.21 | 0.56 | YES |
| 11 | ALAD | ALAD | ALAD | 1068 | 0.19 | 0.58 | YES |
| 12 | UGT1A8 | UGT1A8 | UGT1A8 | 1170 | 0.18 | 0.6 | YES |
| 13 | UGT2B11 | UGT2B11 | UGT2B11 | 1269 | 0.16 | 0.62 | YES |
| 14 | MMAB | MMAB | MMAB | 1378 | 0.15 | 0.64 | YES |
| 15 | UGT2B4 | UGT2B4 | UGT2B4 | 1532 | 0.14 | 0.65 | YES |
| 16 | BLVRB | BLVRB | BLVRB | 1820 | 0.12 | 0.65 | YES |
| 17 | UGT2B15 | UGT2B15 | UGT2B15 | 2095 | 0.1 | 0.64 | YES |
| 18 | HMOX2 | HMOX2 | HMOX2 | 2237 | 0.098 | 0.65 | YES |
| 19 | EARS2 | EARS2 | EARS2 | 2398 | 0.09 | 0.65 | YES |
| 20 | PPOX | PPOX | PPOX | 2490 | 0.086 | 0.66 | YES |
| 21 | FECH | FECH | FECH | 2896 | 0.07 | 0.65 | NO |
| 22 | UROS | UROS | UROS | 3307 | 0.058 | 0.63 | NO |
| 23 | COX15 | COX15 | COX15 | 3502 | 0.053 | 0.63 | NO |
| 24 | UROD | UROD | UROD | 5578 | 0.012 | 0.51 | NO |
| 25 | EPRS | EPRS | EPRS | 5931 | 0.0054 | 0.49 | NO |
| 26 | CPOX | CPOX | CPOX | 5987 | 0.0045 | 0.49 | NO |
| 27 | COX10 | COX10 | COX10 | 6947 | -0.01 | 0.44 | NO |
| 28 | HMBS | HMBS | HMBS | 7220 | -0.014 | 0.42 | NO |
| 29 | ALAS2 | ALAS2 | ALAS2 | 7664 | -0.021 | 0.4 | NO |
| 30 | UGT1A7 | UGT1A7 | UGT1A7 | 7830 | -0.024 | 0.4 | NO |
| 31 | FTH1 | FTH1 | FTH1 | 8529 | -0.034 | 0.36 | NO |
| 32 | GUSB | GUSB | GUSB | 9575 | -0.054 | 0.31 | NO |
| 33 | HMOX1 | HMOX1 | HMOX1 | 11236 | -0.097 | 0.23 | NO |
| 34 | CP | CP | CP | 11957 | -0.12 | 0.21 | NO |
| 35 | UGT2A1 | UGT2A1 | UGT2A1 | 12806 | -0.16 | 0.18 | NO |
| 36 | UGT1A10 | UGT1A10 | UGT1A10 | 13047 | -0.17 | 0.19 | NO |
| 37 | UGT2A3 | UGT2A3 | UGT2A3 | 13587 | -0.2 | 0.19 | NO |
| 38 | BLVRA | BLVRA | BLVRA | 15959 | -0.35 | 0.1 | NO |
Figure S83. Get High-res Image This plot shows mRNAseq_cNMF expression data heatmap (on the left) a RunningEnrichmentScore(RES) plot (on the top right) and a Signal2Noise(S2N) plot (on the bottom right) of genes in the pathway: KEGG PENTOSE AND GLUCURONATE INTERCONVERSIONS.
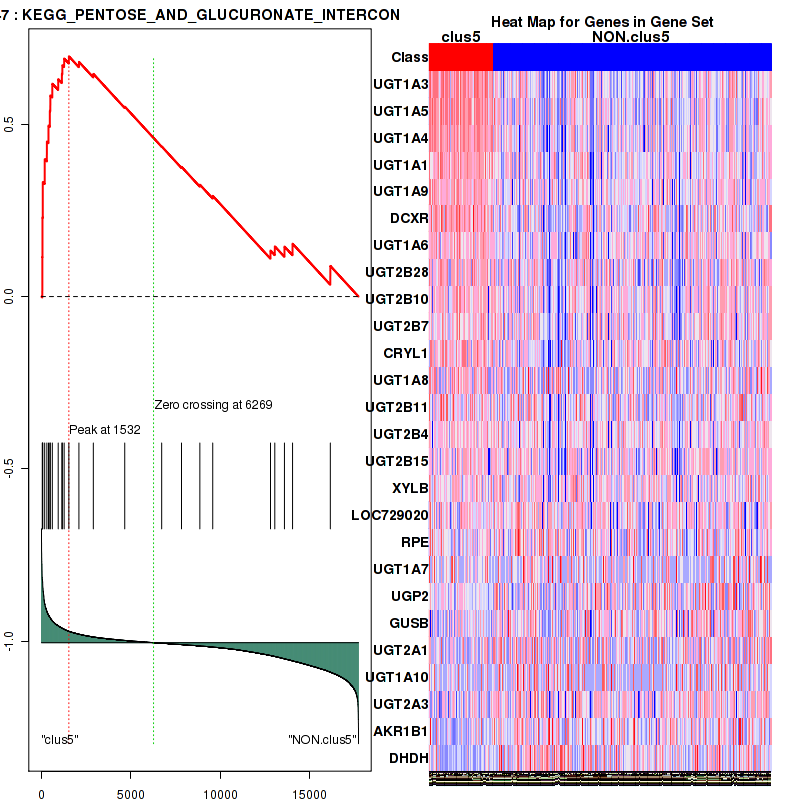
Figure S84. Get High-res Image For the top 5 core enriched genes in the pathway: KEGG PENTOSE AND GLUCURONATE INTERCONVERSIONS, this volcano plot shows how much they are up/down-regulated and significant. The significance was calculated by empirical bayesian fit
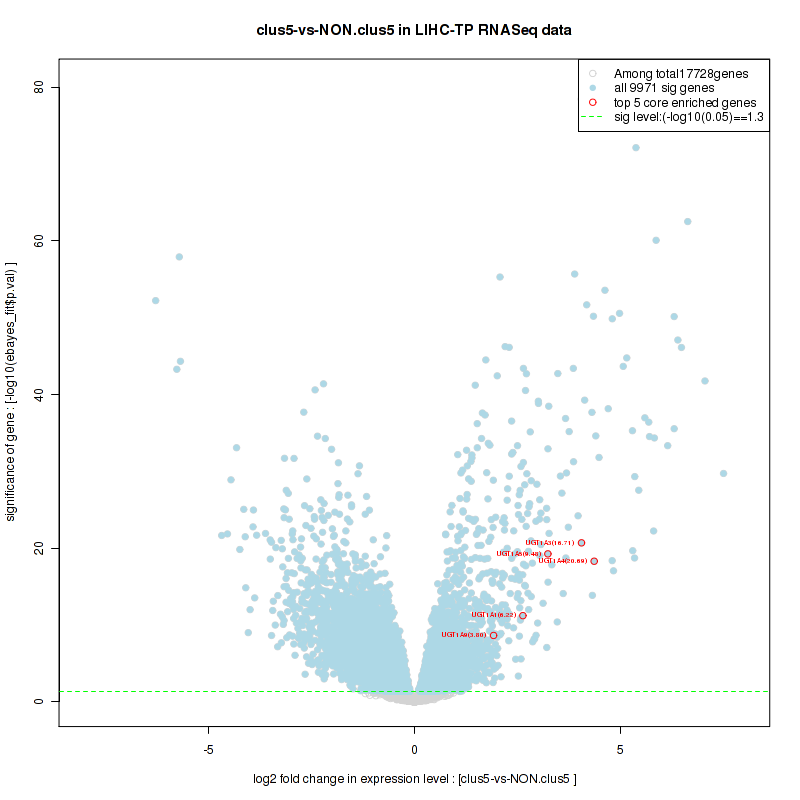
Table S43. Get Full Table This table shows a Running Enrichment Score (RES) of each gene in this pathway, that is, the enrichment score at this point in the ranked list of genes. All genes are ranked by Signal-to-Noise (S2N), a measure of similarity as default and are used to obtain ES matrix of all genes. In this way, GSEA tool uses expression pattern of not only overlapped genes but also not-overlapped genes to produce ES matrix.
| Rank | GENE | SYMBOL | DESC | LIST.LOC | S2N | RES | CORE_ENRICHMENT |
|---|---|---|---|---|---|---|---|
| 1 | NARS2 | NARS2 | NARS2 | 1174 | 0.18 | 0.022 | YES |
| 2 | FARS2 | FARS2 | FARS2 | 1363 | 0.16 | 0.09 | YES |
| 3 | EARS2 | EARS2 | EARS2 | 2398 | 0.09 | 0.076 | YES |
| 4 | PSTK | PSTK | PSTK | 2409 | 0.089 | 0.12 | YES |
| 5 | SEPSECS | SEPSECS | SEPSECS | 2648 | 0.08 | 0.15 | YES |
| 6 | PARS2 | PARS2 | PARS2 | 2995 | 0.067 | 0.16 | YES |
| 7 | IARS2 | IARS2 | IARS2 | 3114 | 0.063 | 0.19 | YES |
| 8 | VARS | VARS | VARS | 3510 | 0.053 | 0.19 | YES |
| 9 | KARS | KARS | KARS | 3520 | 0.052 | 0.22 | YES |
| 10 | HARS2 | HARS2 | HARS2 | 3549 | 0.052 | 0.24 | YES |
| 11 | AARS | AARS | AARS | 3580 | 0.051 | 0.26 | YES |
| 12 | HARS | HARS | HARS | 3973 | 0.042 | 0.26 | YES |
| 13 | DARS | DARS | DARS | 4200 | 0.037 | 0.27 | YES |
| 14 | RARS | RARS | RARS | 4283 | 0.035 | 0.28 | YES |
| 15 | MTFMT | MTFMT | MTFMT | 4555 | 0.03 | 0.28 | YES |
| 16 | LARS2 | LARS2 | LARS2 | 4919 | 0.023 | 0.27 | YES |
| 17 | QARS | QARS | QARS | 5376 | 0.015 | 0.26 | YES |
| 18 | AARS2 | AARS2 | AARS2 | 5826 | 0.0073 | 0.23 | YES |
| 19 | FARSB | FARSB | FARSB | 5870 | 0.0065 | 0.24 | YES |
| 20 | EPRS | EPRS | EPRS | 5931 | 0.0054 | 0.23 | YES |
| 21 | VARS2 | VARS2 | VARS2 | 6163 | 0.0016 | 0.22 | YES |
| 22 | NARS | NARS | NARS | 6268 | 9.8e-06 | 0.22 | YES |
| 23 | FARSA | FARSA | FARSA | 6468 | -0.003 | 0.21 | YES |
| 24 | YARS2 | YARS2 | YARS2 | 7227 | -0.015 | 0.17 | YES |
| 25 | IARS | IARS | IARS | 7233 | -0.015 | 0.18 | YES |
| 26 | DARS2 | DARS2 | DARS2 | 7364 | -0.017 | 0.18 | YES |
| 27 | WARS2 | WARS2 | WARS2 | 7956 | -0.025 | 0.16 | YES |
| 28 | TARSL2 | TARSL2 | TARSL2 | 8276 | -0.031 | 0.16 | YES |
| 29 | LARS | LARS | LARS | 8524 | -0.034 | 0.16 | YES |
| 30 | WARS | WARS | WARS | 9386 | -0.05 | 0.14 | YES |
| 31 | RARS2 | RARS2 | RARS2 | 9424 | -0.051 | 0.16 | YES |
| 32 | CARS2 | CARS2 | CARS2 | 9506 | -0.052 | 0.18 | YES |
| 33 | SARS | SARS | SARS | 9863 | -0.06 | 0.19 | YES |
| 34 | YARS | YARS | YARS | 9883 | -0.061 | 0.22 | YES |
| 35 | MARS | MARS | MARS | 10114 | -0.066 | 0.24 | YES |
| 36 | GARS | GARS | GARS | 10156 | -0.067 | 0.27 | YES |
| 37 | MARS2 | MARS2 | MARS2 | 10376 | -0.072 | 0.3 | YES |
| 38 | SARS2 | SARS2 | SARS2 | 10427 | -0.073 | 0.33 | YES |
| 39 | CARS | CARS | CARS | 10774 | -0.082 | 0.35 | YES |
| 40 | TARS | TARS | TARS | 10784 | -0.082 | 0.39 | YES |
Figure S85. Get High-res Image This plot shows mRNAseq_cNMF expression data heatmap (on the left) a RunningEnrichmentScore(RES) plot (on the top right) and a Signal2Noise(S2N) plot (on the bottom right) of genes in the pathway: KEGG FATTY ACID METABOLISM.
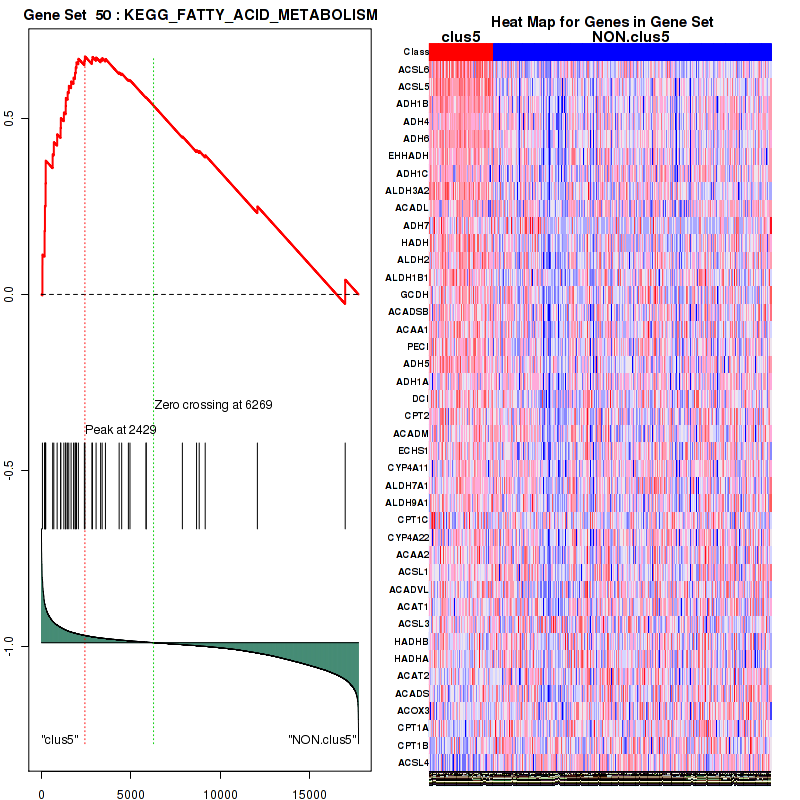
Figure S86. Get High-res Image For the top 5 core enriched genes in the pathway: KEGG FATTY ACID METABOLISM, this volcano plot shows how much they are up/down-regulated and significant. The significance was calculated by empirical bayesian fit
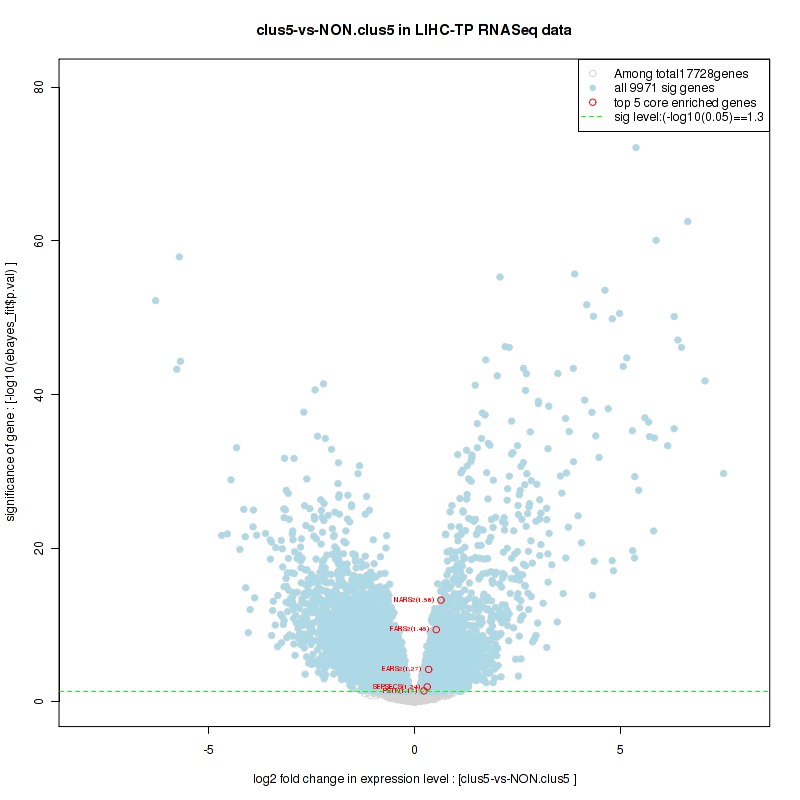
Table S44. Get Full Table This table shows a Running Enrichment Score (RES) of each gene in this pathway, that is, the enrichment score at this point in the ranked list of genes. All genes are ranked by Signal-to-Noise (S2N), a measure of similarity as default and are used to obtain ES matrix of all genes. In this way, GSEA tool uses expression pattern of not only overlapped genes but also not-overlapped genes to produce ES matrix.
| Rank | GENE | SYMBOL | DESC | LIST.LOC | S2N | RES | CORE_ENRICHMENT |
|---|---|---|---|---|---|---|---|
| 1 | ALDH3A1 | ALDH3A1 | ALDH3A1 | 6 | 1.2 | 0.15 | YES |
| 2 | AOX1 | AOX1 | AOX1 | 177 | 0.48 | 0.21 | YES |
| 3 | ADH1B | ADH1B | ADH1B | 194 | 0.47 | 0.27 | YES |
| 4 | HPD | HPD | HPD | 216 | 0.44 | 0.32 | YES |
| 5 | ADH4 | ADH4 | ADH4 | 230 | 0.43 | 0.38 | YES |
| 6 | ADH6 | ADH6 | ADH6 | 237 | 0.43 | 0.44 | YES |
| 7 | ADH1C | ADH1C | ADH1C | 691 | 0.25 | 0.44 | YES |
| 8 | HGD | HGD | HGD | 784 | 0.23 | 0.47 | YES |
| 9 | NAT6 | NAT6 | NAT6 | 851 | 0.22 | 0.5 | YES |
| 10 | ADH7 | ADH7 | ADH7 | 1082 | 0.19 | 0.51 | YES |
| 11 | DDC | DDC | DDC | 1147 | 0.18 | 0.53 | YES |
| 12 | MAOA | MAOA | MAOA | 1509 | 0.14 | 0.53 | YES |
| 13 | MAOB | MAOB | MAOB | 1541 | 0.14 | 0.54 | YES |
| 14 | AOC2 | AOC2 | AOC2 | 1767 | 0.12 | 0.55 | YES |
| 15 | ADH5 | ADH5 | ADH5 | 1876 | 0.12 | 0.56 | YES |
| 16 | ADH1A | ADH1A | ADH1A | 1914 | 0.12 | 0.57 | YES |
| 17 | GSTZ1 | GSTZ1 | GSTZ1 | 2261 | 0.096 | 0.56 | NO |
| 18 | TAT | TAT | TAT | 2485 | 0.086 | 0.56 | NO |
| 19 | LCMT2 | LCMT2 | LCMT2 | 2658 | 0.079 | 0.56 | NO |
| 20 | HEMK1 | HEMK1 | HEMK1 | 3383 | 0.056 | 0.53 | NO |
| 21 | DCT | DCT | DCT | 3695 | 0.048 | 0.52 | NO |
| 22 | PNMT | PNMT | PNMT | 3746 | 0.047 | 0.52 | NO |
| 23 | WBSCR22 | WBSCR22 | WBSCR22 | 4235 | 0.036 | 0.5 | NO |
| 24 | COMT | COMT | COMT | 4258 | 0.036 | 0.5 | NO |
| 25 | GOT2 | GOT2 | GOT2 | 4496 | 0.031 | 0.49 | NO |
| 26 | FAH | FAH | FAH | 5555 | 0.012 | 0.43 | NO |
| 27 | MIF | MIF | MIF | 5583 | 0.012 | 0.43 | NO |
| 28 | METTL2B | METTL2B | METTL2B | 6408 | -0.0021 | 0.39 | NO |
| 29 | METTL6 | METTL6 | METTL6 | 6516 | -0.0038 | 0.38 | NO |
| 30 | TRMT11 | TRMT11 | TRMT11 | 6987 | -0.011 | 0.36 | NO |
| 31 | LCMT1 | LCMT1 | LCMT1 | 10010 | -0.064 | 0.19 | NO |
| 32 | AOC3 | AOC3 | AOC3 | 10692 | -0.08 | 0.17 | NO |
| 33 | DBH | DBH | DBH | 12789 | -0.16 | 0.069 | NO |
| 34 | GOT1 | GOT1 | GOT1 | 13119 | -0.17 | 0.073 | NO |
| 35 | TH | TH | TH | 13354 | -0.19 | 0.084 | NO |
| 36 | ALDH1A3 | ALDH1A3 | ALDH1A3 | 14455 | -0.25 | 0.055 | NO |
| 37 | ALDH3B1 | ALDH3B1 | ALDH3B1 | 14713 | -0.26 | 0.075 | NO |
| 38 | ALDH3B2 | ALDH3B2 | ALDH3B2 | 16070 | -0.36 | 0.046 | NO |
| 39 | IL4I1 | IL4I1 | IL4I1 | 16146 | -0.36 | 0.089 | NO |
Figure S87. Get High-res Image This plot shows mRNAseq_cNMF expression data heatmap (on the left) a RunningEnrichmentScore(RES) plot (on the top right) and a Signal2Noise(S2N) plot (on the bottom right) of genes in the pathway: KEGG STEROID HORMONE BIOSYNTHESIS.
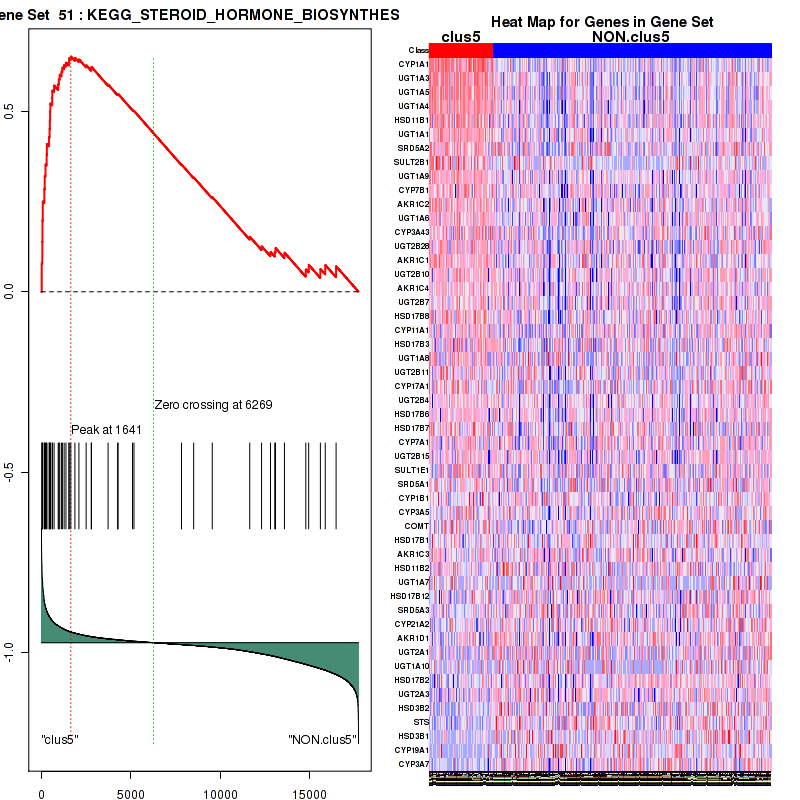
Figure S88. Get High-res Image For the top 5 core enriched genes in the pathway: KEGG STEROID HORMONE BIOSYNTHESIS, this volcano plot shows how much they are up/down-regulated and significant. The significance was calculated by empirical bayesian fit
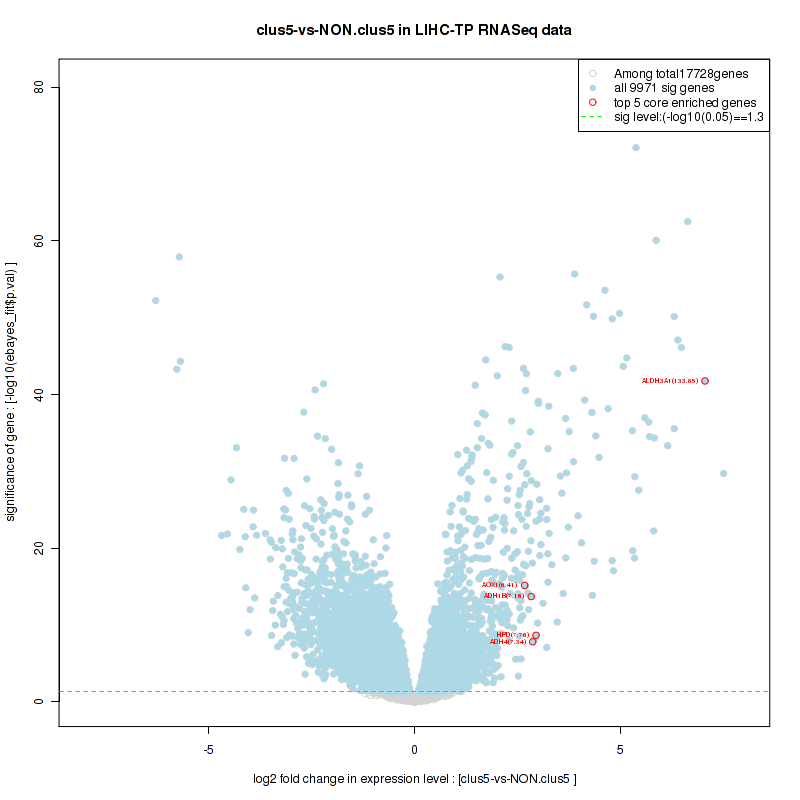
Table S45. Get Full Table This table shows a Running Enrichment Score (RES) of each gene in this pathway, that is, the enrichment score at this point in the ranked list of genes. All genes are ranked by Signal-to-Noise (S2N), a measure of similarity as default and are used to obtain ES matrix of all genes. In this way, GSEA tool uses expression pattern of not only overlapped genes but also not-overlapped genes to produce ES matrix.
| Rank | GENE | SYMBOL | DESC | LIST.LOC | S2N | RES | CORE_ENRICHMENT |
|---|---|---|---|---|---|---|---|
| 1 | ACSL6 | ACSL6 | ACSL6 | 55 | 0.77 | 0.077 | YES |
| 2 | AMACR | AMACR | AMACR | 130 | 0.57 | 0.13 | YES |
| 3 | ACSL5 | ACSL5 | ACSL5 | 174 | 0.48 | 0.18 | YES |
| 4 | HAO1 | HAO1 | HAO1 | 589 | 0.27 | 0.18 | YES |
| 5 | EHHADH | EHHADH | EHHADH | 627 | 0.26 | 0.21 | YES |
| 6 | PEX11G | PEX11G | PEX11G | 703 | 0.25 | 0.23 | YES |
| 7 | PEX12 | PEX12 | PEX12 | 773 | 0.23 | 0.25 | YES |
| 8 | BAAT | BAAT | BAAT | 877 | 0.22 | 0.27 | YES |
| 9 | HSD17B4 | HSD17B4 | HSD17B4 | 897 | 0.21 | 0.29 | YES |
| 10 | PEX11A | PEX11A | PEX11A | 967 | 0.2 | 0.31 | YES |
| 11 | PECR | PECR | PECR | 1167 | 0.18 | 0.31 | YES |
| 12 | DAO | DAO | DAO | 1171 | 0.18 | 0.33 | YES |
| 13 | MLYCD | MLYCD | MLYCD | 1379 | 0.15 | 0.34 | YES |
| 14 | GNPAT | GNPAT | GNPAT | 1487 | 0.14 | 0.34 | YES |
| 15 | DECR2 | DECR2 | DECR2 | 1510 | 0.14 | 0.36 | YES |
| 16 | SOD1 | SOD1 | SOD1 | 1548 | 0.14 | 0.37 | YES |
| 17 | PIPOX | PIPOX | PIPOX | 1568 | 0.14 | 0.38 | YES |
| 18 | ACAA1 | ACAA1 | ACAA1 | 1658 | 0.13 | 0.39 | YES |
| 19 | MVK | MVK | MVK | 1690 | 0.13 | 0.4 | YES |
| 20 | PEX5 | PEX5 | PEX5 | 1743 | 0.12 | 0.41 | YES |
| 21 | PECI | PECI | PECI | 1793 | 0.12 | 0.42 | YES |
| 22 | PAOX | PAOX | PAOX | 1881 | 0.12 | 0.43 | YES |
| 23 | PEX6 | PEX6 | PEX6 | 2010 | 0.11 | 0.44 | YES |
| 24 | CAT | CAT | CAT | 2011 | 0.11 | 0.45 | YES |
| 25 | HMGCL | HMGCL | HMGCL | 2058 | 0.11 | 0.46 | YES |
| 26 | SCP2 | SCP2 | SCP2 | 2167 | 0.1 | 0.46 | YES |
| 27 | EPHX2 | EPHX2 | EPHX2 | 2236 | 0.098 | 0.46 | YES |
| 28 | PEX14 | PEX14 | PEX14 | 2287 | 0.095 | 0.47 | YES |
| 29 | IDH1 | IDH1 | IDH1 | 2327 | 0.093 | 0.48 | YES |
| 30 | CRAT | CRAT | CRAT | 2351 | 0.092 | 0.49 | YES |
| 31 | PMVK | PMVK | PMVK | 2692 | 0.078 | 0.48 | YES |
| 32 | ABCD3 | ABCD3 | ABCD3 | 2709 | 0.077 | 0.48 | YES |
| 33 | PEX19 | PEX19 | PEX19 | 2718 | 0.077 | 0.49 | YES |
| 34 | PEX2 | PEX2 | PEX2 | 2824 | 0.073 | 0.49 | YES |
| 35 | ACOX1 | ACOX1 | ACOX1 | 2833 | 0.073 | 0.5 | YES |
| 36 | DHRS4 | DHRS4 | DHRS4 | 2890 | 0.071 | 0.5 | YES |
| 37 | PEX10 | PEX10 | PEX10 | 3002 | 0.067 | 0.5 | YES |
| 38 | GSTK1 | GSTK1 | GSTK1 | 3034 | 0.066 | 0.51 | YES |
| 39 | HACL1 | HACL1 | HACL1 | 3275 | 0.059 | 0.5 | NO |
| 40 | PEX1 | PEX1 | PEX1 | 3538 | 0.052 | 0.49 | NO |
| 41 | PXMP2 | PXMP2 | PXMP2 | 3786 | 0.046 | 0.48 | NO |
| 42 | PEX11B | PEX11B | PEX11B | 3882 | 0.044 | 0.48 | NO |
| 43 | ECH1 | ECH1 | ECH1 | 4190 | 0.037 | 0.47 | NO |
| 44 | ACSL1 | ACSL1 | ACSL1 | 4345 | 0.034 | 0.46 | NO |
| 45 | SLC27A2 | SLC27A2 | SLC27A2 | 4510 | 0.031 | 0.46 | NO |
| 46 | ABCD2 | ABCD2 | ABCD2 | 4591 | 0.029 | 0.46 | NO |
| 47 | PEX13 | PEX13 | PEX13 | 4835 | 0.024 | 0.45 | NO |
| 48 | ACSL3 | ACSL3 | ACSL3 | 4948 | 0.022 | 0.44 | NO |
| 49 | PRDX1 | PRDX1 | PRDX1 | 5005 | 0.021 | 0.44 | NO |
| 50 | AGPS | AGPS | AGPS | 5500 | 0.013 | 0.41 | NO |
| 51 | NUDT12 | NUDT12 | NUDT12 | 5756 | 0.0086 | 0.4 | NO |
| 52 | DDO | DDO | DDO | 5831 | 0.0072 | 0.4 | NO |
| 53 | PEX26 | PEX26 | PEX26 | 5899 | 0.0059 | 0.39 | NO |
| 54 | ABCD1 | ABCD1 | ABCD1 | 6648 | -0.0059 | 0.35 | NO |
| 55 | NUDT19 | NUDT19 | NUDT19 | 6753 | -0.0074 | 0.35 | NO |
| 56 | PEX16 | PEX16 | PEX16 | 6822 | -0.0084 | 0.34 | NO |
| 57 | PEX3 | PEX3 | PEX3 | 7040 | -0.011 | 0.33 | NO |
| 58 | PEX7 | PEX7 | PEX7 | 7237 | -0.015 | 0.32 | NO |
| 59 | ABCD4 | ABCD4 | ABCD4 | 7389 | -0.017 | 0.32 | NO |
| 60 | IDH2 | IDH2 | IDH2 | 7601 | -0.02 | 0.31 | NO |
| 61 | ACOT8 | ACOT8 | ACOT8 | 7776 | -0.023 | 0.3 | NO |
| 62 | PXMP4 | PXMP4 | PXMP4 | 8488 | -0.034 | 0.26 | NO |
| 63 | SLC25A17 | SLC25A17 | SLC25A17 | 8704 | -0.038 | 0.25 | NO |
| 64 | ACOX3 | ACOX3 | ACOX3 | 8819 | -0.04 | 0.25 | NO |
| 65 | NOS2 | NOS2 | NOS2 | 8954 | -0.042 | 0.25 | NO |
| 66 | PRDX5 | PRDX5 | PRDX5 | 9621 | -0.055 | 0.22 | NO |
| 67 | AGXT | AGXT | AGXT | 9655 | -0.056 | 0.22 | NO |
| 68 | PHYH | PHYH | PHYH | 9780 | -0.058 | 0.22 | NO |
| 69 | SOD2 | SOD2 | SOD2 | 9787 | -0.058 | 0.22 | NO |
| 70 | MPV17 | MPV17 | MPV17 | 10449 | -0.074 | 0.2 | NO |
| 71 | MPV17L | MPV17L | MPV17L | 11824 | -0.12 | 0.13 | NO |
| 72 | CROT | CROT | CROT | 14066 | -0.23 | 0.026 | NO |
| 73 | XDH | XDH | XDH | 14964 | -0.28 | 0.0048 | NO |
| 74 | HAO2 | HAO2 | HAO2 | 15025 | -0.28 | 0.031 | NO |
| 75 | FAR1 | FAR1 | FAR1 | 15562 | -0.32 | 0.034 | NO |
| 76 | FAR2 | FAR2 | FAR2 | 16571 | -0.4 | 0.018 | NO |
| 77 | ACSL4 | ACSL4 | ACSL4 | 16983 | -0.46 | 0.042 | NO |
Figure S89. Get High-res Image This plot shows mRNAseq_cNMF expression data heatmap (on the left) a RunningEnrichmentScore(RES) plot (on the top right) and a Signal2Noise(S2N) plot (on the bottom right) of genes in the pathway: KEGG VALINE LEUCINE AND ISOLEUCINE DEGRADATION.
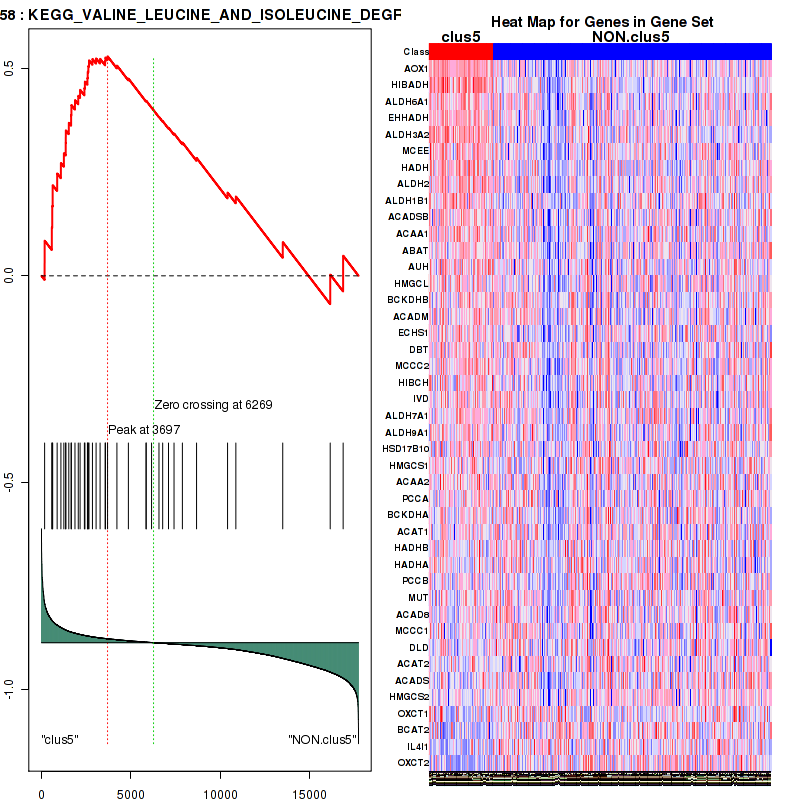
Figure S90. Get High-res Image For the top 5 core enriched genes in the pathway: KEGG VALINE LEUCINE AND ISOLEUCINE DEGRADATION, this volcano plot shows how much they are up/down-regulated and significant. The significance was calculated by empirical bayesian fit
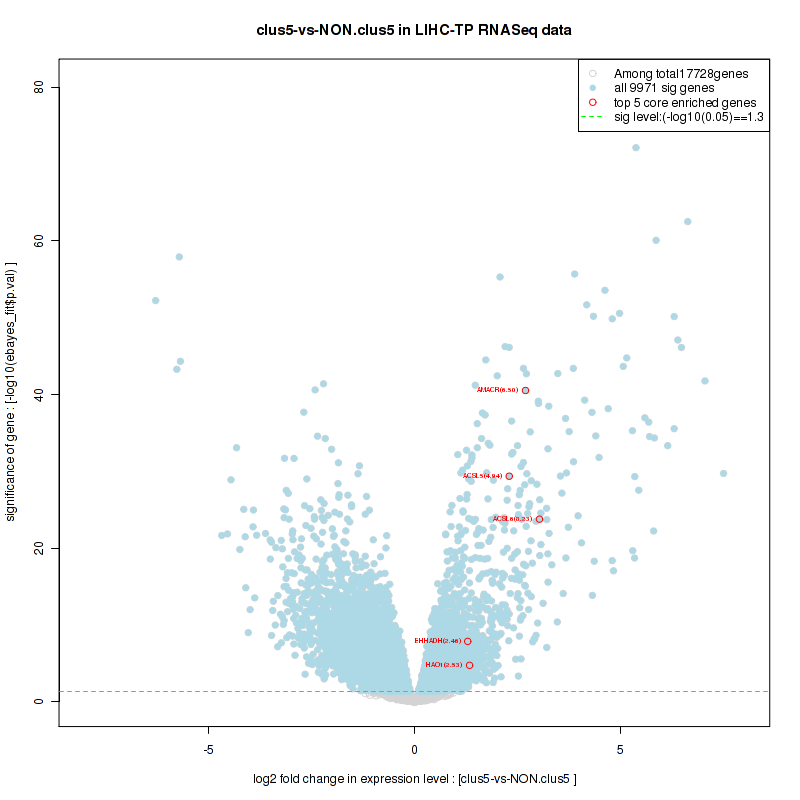
Table S46. Get Full Table This table shows a Running Enrichment Score (RES) of each gene in this pathway, that is, the enrichment score at this point in the ranked list of genes. All genes are ranked by Signal-to-Noise (S2N), a measure of similarity as default and are used to obtain ES matrix of all genes. In this way, GSEA tool uses expression pattern of not only overlapped genes but also not-overlapped genes to produce ES matrix.
| Rank | GENE | SYMBOL | DESC | LIST.LOC | S2N | RES | CORE_ENRICHMENT |
|---|---|---|---|---|---|---|---|
| 1 | ALDH3A1 | ALDH3A1 | ALDH3A1 | 6 | 1.2 | 0.066 | YES |
| 2 | CYP1A1 | CYP1A1 | CYP1A1 | 15 | 1 | 0.12 | YES |
| 3 | UGT1A3 | UGT1A3 | UGT1A3 | 49 | 0.78 | 0.17 | YES |
| 4 | UGT1A5 | UGT1A5 | UGT1A5 | 56 | 0.76 | 0.21 | YES |
| 5 | CYP1A2 | CYP1A2 | CYP1A2 | 64 | 0.74 | 0.25 | YES |
| 6 | UGT1A4 | UGT1A4 | UGT1A4 | 74 | 0.69 | 0.29 | YES |
| 7 | CYP2E1 | CYP2E1 | CYP2E1 | 92 | 0.64 | 0.33 | YES |
| 8 | UGT1A1 | UGT1A1 | UGT1A1 | 181 | 0.48 | 0.35 | YES |
| 9 | ADH1B | ADH1B | ADH1B | 194 | 0.47 | 0.38 | YES |
| 10 | ADH4 | ADH4 | ADH4 | 230 | 0.43 | 0.4 | YES |
| 11 | ADH6 | ADH6 | ADH6 | 237 | 0.43 | 0.42 | YES |
| 12 | UGT1A9 | UGT1A9 | UGT1A9 | 302 | 0.38 | 0.44 | YES |
| 13 | CYP2C9 | CYP2C9 | CYP2C9 | 386 | 0.34 | 0.46 | YES |
| 14 | AKR1C2 | AKR1C2 | AKR1C2 | 455 | 0.32 | 0.47 | YES |
| 15 | UGT1A6 | UGT1A6 | UGT1A6 | 469 | 0.31 | 0.49 | YES |
| 16 | CYP3A43 | CYP3A43 | CYP3A43 | 485 | 0.31 | 0.5 | YES |
| 17 | UGT2B28 | UGT2B28 | UGT2B28 | 496 | 0.31 | 0.52 | YES |
| 18 | AKR1C1 | AKR1C1 | AKR1C1 | 602 | 0.27 | 0.53 | YES |
| 19 | UGT2B10 | UGT2B10 | UGT2B10 | 607 | 0.27 | 0.55 | YES |
| 20 | ADH1C | ADH1C | ADH1C | 691 | 0.25 | 0.56 | YES |
| 21 | AKR1C4 | AKR1C4 | AKR1C4 | 707 | 0.25 | 0.57 | YES |
| 22 | CYP2C19 | CYP2C19 | CYP2C19 | 723 | 0.24 | 0.58 | YES |
| 23 | UGT2B7 | UGT2B7 | UGT2B7 | 937 | 0.21 | 0.58 | YES |
| 24 | ADH7 | ADH7 | ADH7 | 1082 | 0.19 | 0.58 | YES |
| 25 | EPHX1 | EPHX1 | EPHX1 | 1139 | 0.18 | 0.59 | YES |
| 26 | UGT1A8 | UGT1A8 | UGT1A8 | 1170 | 0.18 | 0.6 | YES |
| 27 | MGST1 | MGST1 | MGST1 | 1187 | 0.18 | 0.61 | YES |
| 28 | GSTM4 | GSTM4 | GSTM4 | 1201 | 0.17 | 0.62 | YES |
| 29 | UGT2B11 | UGT2B11 | UGT2B11 | 1269 | 0.16 | 0.62 | YES |
| 30 | UGT2B4 | UGT2B4 | UGT2B4 | 1532 | 0.14 | 0.62 | YES |
| 31 | MGST2 | MGST2 | MGST2 | 1551 | 0.14 | 0.62 | YES |
| 32 | GSTM3 | GSTM3 | GSTM3 | 1586 | 0.14 | 0.63 | YES |
| 33 | CYP2C8 | CYP2C8 | CYP2C8 | 1869 | 0.12 | 0.62 | YES |
| 34 | ADH5 | ADH5 | ADH5 | 1876 | 0.12 | 0.63 | YES |
| 35 | ADH1A | ADH1A | ADH1A | 1914 | 0.12 | 0.63 | YES |
| 36 | UGT2B15 | UGT2B15 | UGT2B15 | 2095 | 0.1 | 0.63 | NO |
| 37 | GSTA4 | GSTA4 | GSTA4 | 2170 | 0.1 | 0.63 | NO |
| 38 | GSTZ1 | GSTZ1 | GSTZ1 | 2261 | 0.096 | 0.63 | NO |
| 39 | GSTM2 | GSTM2 | GSTM2 | 2385 | 0.09 | 0.63 | NO |
| 40 | GSTO1 | GSTO1 | GSTO1 | 2462 | 0.087 | 0.63 | NO |
| 41 | CYP1B1 | CYP1B1 | CYP1B1 | 2793 | 0.074 | 0.61 | NO |
| 42 | GSTK1 | GSTK1 | GSTK1 | 3034 | 0.066 | 0.6 | NO |
| 43 | GSTA1 | GSTA1 | GSTA1 | 3440 | 0.055 | 0.58 | NO |
| 44 | GSTM1 | GSTM1 | GSTM1 | 3617 | 0.05 | 0.58 | NO |
| 45 | CYP3A5 | CYP3A5 | CYP3A5 | 3725 | 0.047 | 0.57 | NO |
| 46 | MGST3 | MGST3 | MGST3 | 3986 | 0.042 | 0.56 | NO |
| 47 | GSTA2 | GSTA2 | GSTA2 | 4017 | 0.041 | 0.56 | NO |
| 48 | GSTT1 | GSTT1 | GSTT1 | 4708 | 0.027 | 0.52 | NO |
| 49 | AKR1C3 | AKR1C3 | AKR1C3 | 5091 | 0.02 | 0.5 | NO |
| 50 | CYP2B6 | CYP2B6 | CYP2B6 | 5237 | 0.017 | 0.5 | NO |
| 51 | GSTO2 | GSTO2 | GSTO2 | 6819 | -0.0083 | 0.41 | NO |
| 52 | UGT1A7 | UGT1A7 | UGT1A7 | 7830 | -0.024 | 0.35 | NO |
| 53 | UGT2A1 | UGT2A1 | UGT2A1 | 12806 | -0.16 | 0.08 | NO |
| 54 | UGT1A10 | UGT1A10 | UGT1A10 | 13047 | -0.17 | 0.076 | NO |
| 55 | UGT2A3 | UGT2A3 | UGT2A3 | 13587 | -0.2 | 0.057 | NO |
| 56 | ALDH1A3 | ALDH1A3 | ALDH1A3 | 14455 | -0.25 | 0.022 | NO |
| 57 | GSTT2 | GSTT2 | GSTT2 | 14598 | -0.26 | 0.029 | NO |
| 58 | CYP2C18 | CYP2C18 | CYP2C18 | 14698 | -0.26 | 0.038 | NO |
| 59 | ALDH3B1 | ALDH3B1 | ALDH3B1 | 14713 | -0.26 | 0.053 | NO |
| 60 | GSTM5 | GSTM5 | GSTM5 | 14930 | -0.28 | 0.056 | NO |
| 61 | CYP2S1 | CYP2S1 | CYP2S1 | 15444 | -0.31 | 0.045 | NO |
| 62 | GSTP1 | GSTP1 | GSTP1 | 16041 | -0.35 | 0.032 | NO |
| 63 | ALDH3B2 | ALDH3B2 | ALDH3B2 | 16070 | -0.36 | 0.05 | NO |
| 64 | DHDH | DHDH | DHDH | 16152 | -0.36 | 0.067 | NO |
| 65 | CYP3A7 | CYP3A7 | CYP3A7 | 16474 | -0.39 | 0.071 | NO |
Figure S91. Get High-res Image This plot shows mRNAseq_cNMF expression data heatmap (on the left) a RunningEnrichmentScore(RES) plot (on the top right) and a Signal2Noise(S2N) plot (on the bottom right) of genes in the pathway: KEGG LYSINE DEGRADATION.
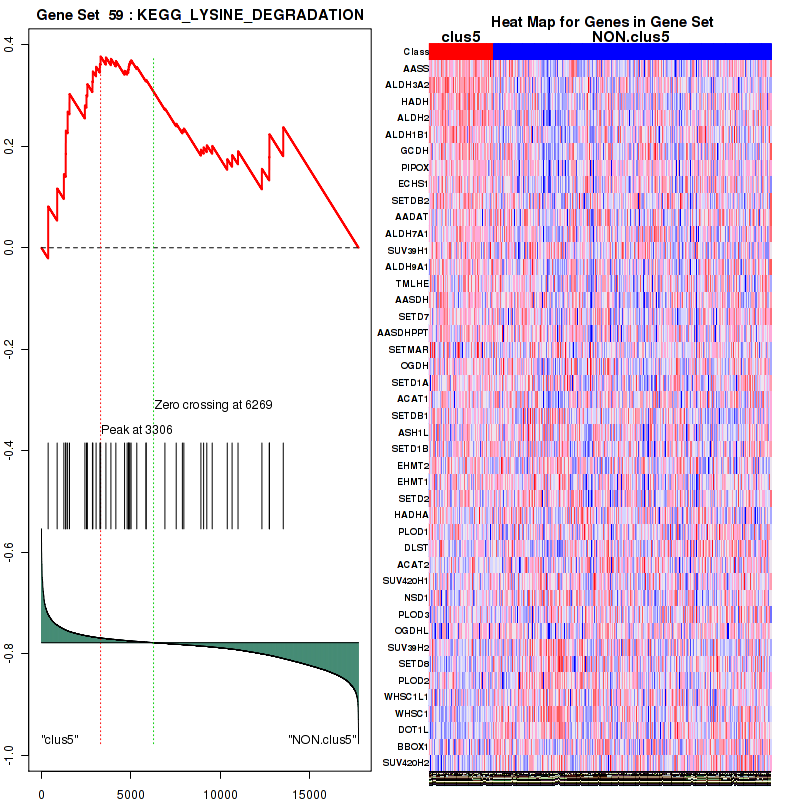
Figure S92. Get High-res Image For the top 5 core enriched genes in the pathway: KEGG LYSINE DEGRADATION, this volcano plot shows how much they are up/down-regulated and significant. The significance was calculated by empirical bayesian fit
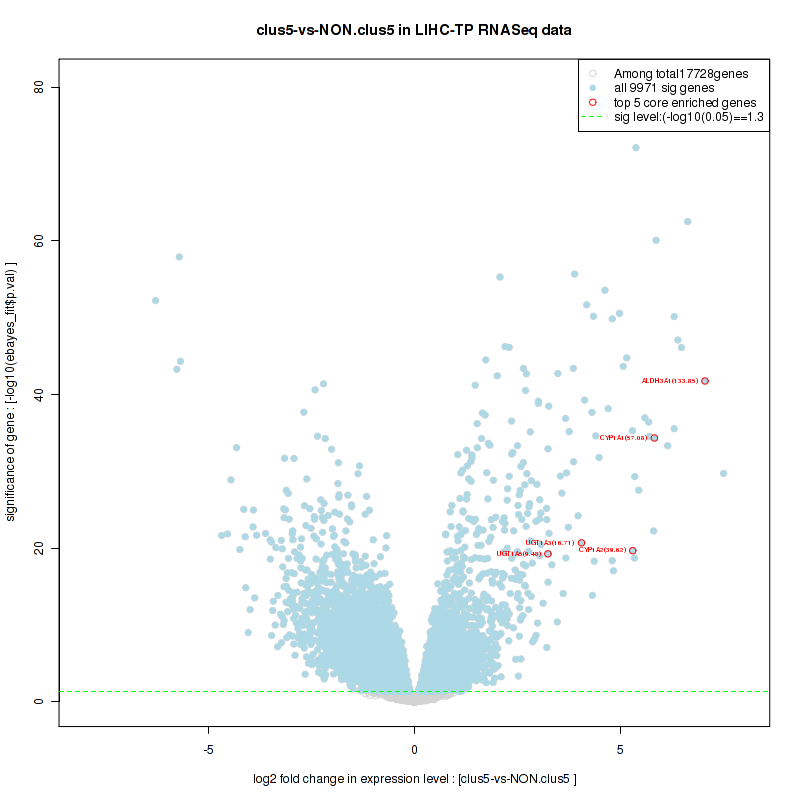
Table S47. Get Full Table This table shows a Running Enrichment Score (RES) of each gene in this pathway, that is, the enrichment score at this point in the ranked list of genes. All genes are ranked by Signal-to-Noise (S2N), a measure of similarity as default and are used to obtain ES matrix of all genes. In this way, GSEA tool uses expression pattern of not only overlapped genes but also not-overlapped genes to produce ES matrix.
| Rank | GENE | SYMBOL | DESC | LIST.LOC | S2N | RES | CORE_ENRICHMENT |
|---|---|---|---|---|---|---|---|
| 1 | CYP1A1 | CYP1A1 | CYP1A1 | 15 | 1 | 0.079 | YES |
| 2 | UGT1A3 | UGT1A3 | UGT1A3 | 49 | 0.78 | 0.14 | YES |
| 3 | UGT1A5 | UGT1A5 | UGT1A5 | 56 | 0.76 | 0.2 | YES |
| 4 | UGT1A4 | UGT1A4 | UGT1A4 | 74 | 0.69 | 0.25 | YES |
| 5 | HSD11B1 | HSD11B1 | HSD11B1 | 163 | 0.5 | 0.28 | YES |
| 6 | UGT1A1 | UGT1A1 | UGT1A1 | 181 | 0.48 | 0.32 | YES |
| 7 | SRD5A2 | SRD5A2 | SRD5A2 | 227 | 0.44 | 0.35 | YES |
| 8 | SULT2B1 | SULT2B1 | SULT2B1 | 290 | 0.39 | 0.38 | YES |
| 9 | UGT1A9 | UGT1A9 | UGT1A9 | 302 | 0.38 | 0.41 | YES |
| 10 | CYP7B1 | CYP7B1 | CYP7B1 | 426 | 0.33 | 0.43 | YES |
| 11 | AKR1C2 | AKR1C2 | AKR1C2 | 455 | 0.32 | 0.45 | YES |
| 12 | UGT1A6 | UGT1A6 | UGT1A6 | 469 | 0.31 | 0.48 | YES |
| 13 | CYP3A43 | CYP3A43 | CYP3A43 | 485 | 0.31 | 0.5 | YES |
| 14 | UGT2B28 | UGT2B28 | UGT2B28 | 496 | 0.31 | 0.52 | YES |
| 15 | AKR1C1 | AKR1C1 | AKR1C1 | 602 | 0.27 | 0.54 | YES |
| 16 | UGT2B10 | UGT2B10 | UGT2B10 | 607 | 0.27 | 0.56 | YES |
| 17 | AKR1C4 | AKR1C4 | AKR1C4 | 707 | 0.25 | 0.57 | YES |
| 18 | UGT2B7 | UGT2B7 | UGT2B7 | 937 | 0.21 | 0.57 | YES |
| 19 | HSD17B8 | HSD17B8 | HSD17B8 | 968 | 0.2 | 0.59 | YES |
| 20 | CYP11A1 | CYP11A1 | CYP11A1 | 1017 | 0.2 | 0.6 | YES |
| 21 | HSD17B3 | HSD17B3 | HSD17B3 | 1118 | 0.18 | 0.61 | YES |
| 22 | UGT1A8 | UGT1A8 | UGT1A8 | 1170 | 0.18 | 0.62 | YES |
| 23 | UGT2B11 | UGT2B11 | UGT2B11 | 1269 | 0.16 | 0.63 | YES |
| 24 | CYP17A1 | CYP17A1 | CYP17A1 | 1370 | 0.15 | 0.64 | YES |
| 25 | UGT2B4 | UGT2B4 | UGT2B4 | 1532 | 0.14 | 0.64 | YES |
| 26 | HSD17B6 | HSD17B6 | HSD17B6 | 1550 | 0.14 | 0.65 | YES |
| 27 | HSD17B7 | HSD17B7 | HSD17B7 | 1641 | 0.13 | 0.65 | YES |
| 28 | CYP7A1 | CYP7A1 | CYP7A1 | 1871 | 0.12 | 0.65 | NO |
| 29 | UGT2B15 | UGT2B15 | UGT2B15 | 2095 | 0.1 | 0.64 | NO |
| 30 | SULT1E1 | SULT1E1 | SULT1E1 | 2500 | 0.086 | 0.63 | NO |
| 31 | SRD5A1 | SRD5A1 | SRD5A1 | 2785 | 0.074 | 0.62 | NO |
| 32 | CYP1B1 | CYP1B1 | CYP1B1 | 2793 | 0.074 | 0.62 | NO |
| 33 | CYP3A5 | CYP3A5 | CYP3A5 | 3725 | 0.047 | 0.57 | NO |
| 34 | COMT | COMT | COMT | 4258 | 0.036 | 0.55 | NO |
| 35 | HSD17B1 | HSD17B1 | HSD17B1 | 4284 | 0.035 | 0.55 | NO |
| 36 | AKR1C3 | AKR1C3 | AKR1C3 | 5091 | 0.02 | 0.5 | NO |
| 37 | HSD11B2 | HSD11B2 | HSD11B2 | 5171 | 0.018 | 0.5 | NO |
| 38 | UGT1A7 | UGT1A7 | UGT1A7 | 7830 | -0.024 | 0.35 | NO |
| 39 | HSD17B12 | HSD17B12 | HSD17B12 | 8512 | -0.034 | 0.32 | NO |
| 40 | SRD5A3 | SRD5A3 | SRD5A3 | 9550 | -0.054 | 0.26 | NO |
| 41 | CYP21A2 | CYP21A2 | CYP21A2 | 11646 | -0.11 | 0.15 | NO |
| 42 | AKR1D1 | AKR1D1 | AKR1D1 | 12305 | -0.14 | 0.13 | NO |
| 43 | UGT2A1 | UGT2A1 | UGT2A1 | 12806 | -0.16 | 0.11 | NO |
| 44 | UGT1A10 | UGT1A10 | UGT1A10 | 13047 | -0.17 | 0.11 | NO |
| 45 | HSD17B2 | HSD17B2 | HSD17B2 | 13087 | -0.17 | 0.12 | NO |
| 46 | UGT2A3 | UGT2A3 | UGT2A3 | 13587 | -0.2 | 0.11 | NO |
| 47 | HSD3B2 | HSD3B2 | HSD3B2 | 14779 | -0.27 | 0.062 | NO |
| 48 | STS | STS | STS | 14942 | -0.28 | 0.075 | NO |
| 49 | HSD3B1 | HSD3B1 | HSD3B1 | 15595 | -0.32 | 0.063 | NO |
| 50 | CYP19A1 | CYP19A1 | CYP19A1 | 15869 | -0.34 | 0.074 | NO |
| 51 | CYP3A7 | CYP3A7 | CYP3A7 | 16474 | -0.39 | 0.071 | NO |
Figure S93. Get High-res Image This plot shows mRNAseq_cNMF expression data heatmap (on the left) a RunningEnrichmentScore(RES) plot (on the top right) and a Signal2Noise(S2N) plot (on the bottom right) of genes in the pathway: KEGG TYROSINE METABOLISM.
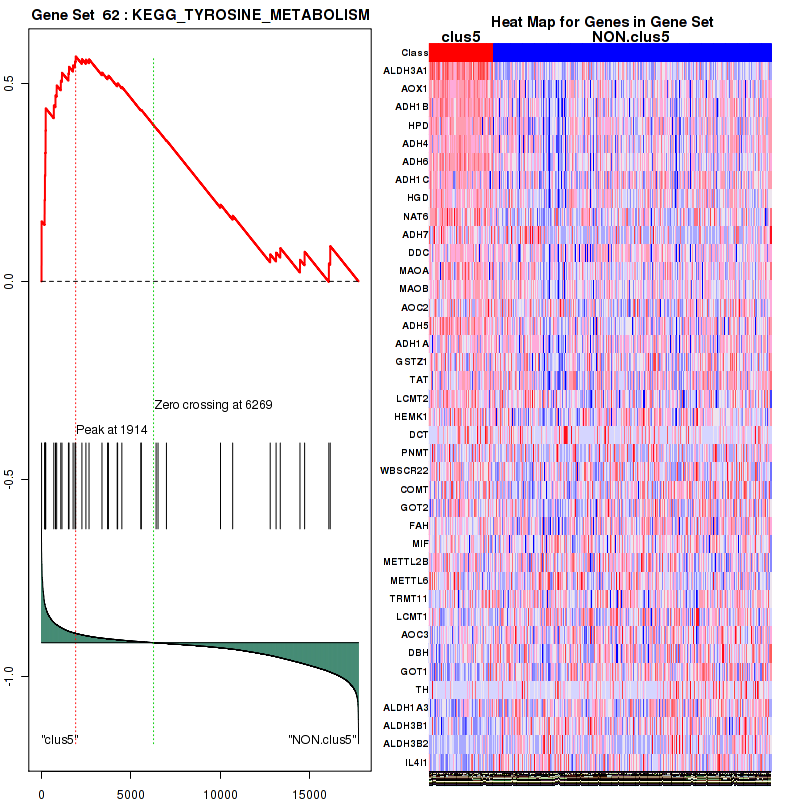
Figure S94. Get High-res Image For the top 5 core enriched genes in the pathway: KEGG TYROSINE METABOLISM, this volcano plot shows how much they are up/down-regulated and significant. The significance was calculated by empirical bayesian fit
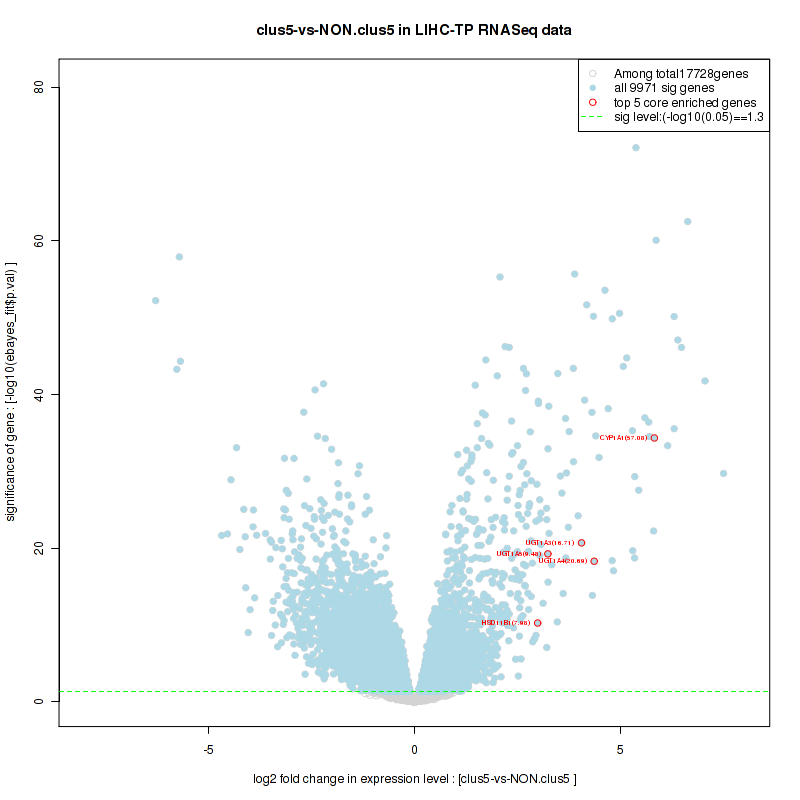
Table S48. Get Full Table This table shows a Running Enrichment Score (RES) of each gene in this pathway, that is, the enrichment score at this point in the ranked list of genes. All genes are ranked by Signal-to-Noise (S2N), a measure of similarity as default and are used to obtain ES matrix of all genes. In this way, GSEA tool uses expression pattern of not only overlapped genes but also not-overlapped genes to produce ES matrix.
| Rank | GENE | SYMBOL | DESC | LIST.LOC | S2N | RES | CORE_ENRICHMENT |
|---|---|---|---|---|---|---|---|
| 1 | UGT1A3 | UGT1A3 | UGT1A3 | 49 | 0.78 | 0.12 | YES |
| 2 | UGT1A5 | UGT1A5 | UGT1A5 | 56 | 0.76 | 0.23 | YES |
| 3 | UGT1A4 | UGT1A4 | UGT1A4 | 74 | 0.69 | 0.33 | YES |
| 4 | UGT1A1 | UGT1A1 | UGT1A1 | 181 | 0.48 | 0.4 | YES |
| 5 | UGT1A9 | UGT1A9 | UGT1A9 | 302 | 0.38 | 0.45 | YES |
| 6 | DCXR | DCXR | DCXR | 392 | 0.34 | 0.5 | YES |
| 7 | UGT1A6 | UGT1A6 | UGT1A6 | 469 | 0.31 | 0.54 | YES |
| 8 | UGT2B28 | UGT2B28 | UGT2B28 | 496 | 0.31 | 0.58 | YES |
| 9 | UGT2B10 | UGT2B10 | UGT2B10 | 607 | 0.27 | 0.62 | YES |
| 10 | UGT2B7 | UGT2B7 | UGT2B7 | 937 | 0.21 | 0.63 | YES |
| 11 | CRYL1 | CRYL1 | CRYL1 | 1141 | 0.18 | 0.65 | YES |
| 12 | UGT1A8 | UGT1A8 | UGT1A8 | 1170 | 0.18 | 0.67 | YES |
| 13 | UGT2B11 | UGT2B11 | UGT2B11 | 1269 | 0.16 | 0.69 | YES |
| 14 | UGT2B4 | UGT2B4 | UGT2B4 | 1532 | 0.14 | 0.7 | YES |
| 15 | UGT2B15 | UGT2B15 | UGT2B15 | 2095 | 0.1 | 0.68 | NO |
| 16 | XYLB | XYLB | XYLB | 2900 | 0.07 | 0.65 | NO |
| 17 | LOC729020 | LOC729020 | LOC729020 | 4657 | 0.028 | 0.55 | NO |
| 18 | RPE | RPE | RPE | 6721 | -0.0069 | 0.44 | NO |
| 19 | UGT1A7 | UGT1A7 | UGT1A7 | 7830 | -0.024 | 0.38 | NO |
| 20 | UGP2 | UGP2 | UGP2 | 8856 | -0.04 | 0.32 | NO |
| 21 | GUSB | GUSB | GUSB | 9575 | -0.054 | 0.29 | NO |
| 22 | UGT2A1 | UGT2A1 | UGT2A1 | 12806 | -0.16 | 0.13 | NO |
| 23 | UGT1A10 | UGT1A10 | UGT1A10 | 13047 | -0.17 | 0.15 | NO |
| 24 | UGT2A3 | UGT2A3 | UGT2A3 | 13587 | -0.2 | 0.14 | NO |
| 25 | AKR1B1 | AKR1B1 | AKR1B1 | 14039 | -0.22 | 0.15 | NO |
| 26 | DHDH | DHDH | DHDH | 16152 | -0.36 | 0.089 | NO |
Figure S95. Get High-res Image This plot shows mRNAseq_cNMF expression data heatmap (on the left) a RunningEnrichmentScore(RES) plot (on the top right) and a Signal2Noise(S2N) plot (on the bottom right) of genes in the pathway: KEGG TRYPTOPHAN METABOLISM.
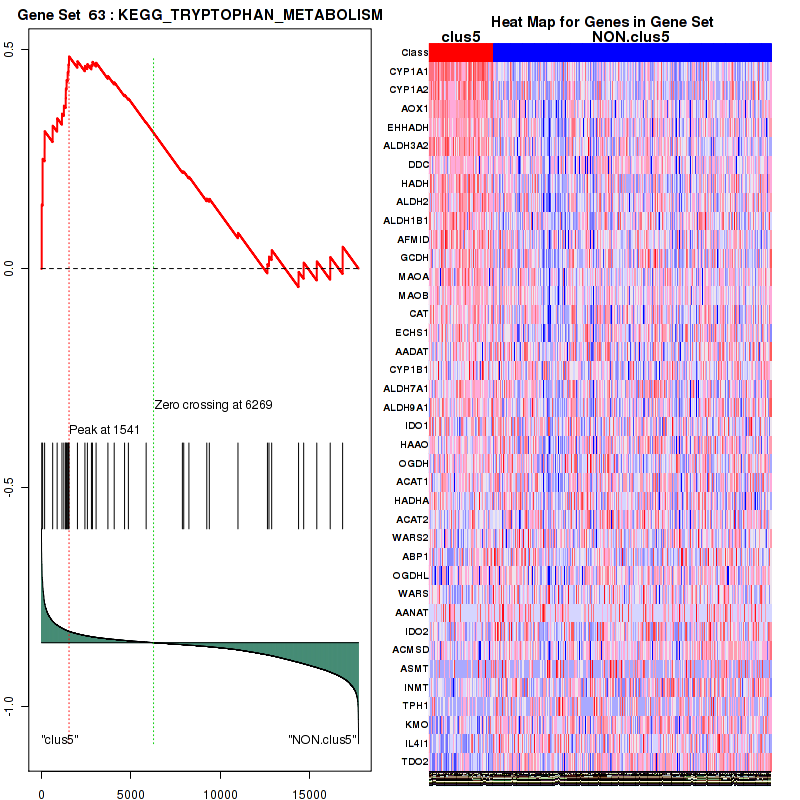
Figure S96. Get High-res Image For the top 5 core enriched genes in the pathway: KEGG TRYPTOPHAN METABOLISM, this volcano plot shows how much they are up/down-regulated and significant. The significance was calculated by empirical bayesian fit

Table S49. Get Full Table This table shows a Running Enrichment Score (RES) of each gene in this pathway, that is, the enrichment score at this point in the ranked list of genes. All genes are ranked by Signal-to-Noise (S2N), a measure of similarity as default and are used to obtain ES matrix of all genes. In this way, GSEA tool uses expression pattern of not only overlapped genes but also not-overlapped genes to produce ES matrix.
| Rank | GENE | SYMBOL | DESC | LIST.LOC | S2N | RES | CORE_ENRICHMENT |
|---|---|---|---|---|---|---|---|
| 1 | AOX1 | AOX1 | AOX1 | 177 | 0.48 | 0.085 | YES |
| 2 | HIBADH | HIBADH | HIBADH | 579 | 0.28 | 0.12 | YES |
| 3 | ALDH6A1 | ALDH6A1 | ALDH6A1 | 604 | 0.27 | 0.17 | YES |
| 4 | EHHADH | EHHADH | EHHADH | 627 | 0.26 | 0.22 | YES |
| 5 | ALDH3A2 | ALDH3A2 | ALDH3A2 | 878 | 0.22 | 0.25 | YES |
| 6 | MCEE | MCEE | MCEE | 1087 | 0.19 | 0.27 | YES |
| 7 | HADH | HADH | HADH | 1253 | 0.17 | 0.3 | YES |
| 8 | ALDH2 | ALDH2 | ALDH2 | 1357 | 0.16 | 0.32 | YES |
| 9 | ALDH1B1 | ALDH1B1 | ALDH1B1 | 1361 | 0.16 | 0.35 | YES |
| 10 | ACADSB | ACADSB | ACADSB | 1529 | 0.14 | 0.37 | YES |
| 11 | ACAA1 | ACAA1 | ACAA1 | 1658 | 0.13 | 0.39 | YES |
| 12 | ABAT | ABAT | ABAT | 1674 | 0.13 | 0.41 | YES |
| 13 | AUH | AUH | AUH | 1874 | 0.12 | 0.42 | YES |
| 14 | HMGCL | HMGCL | HMGCL | 2058 | 0.11 | 0.44 | YES |
| 15 | BCKDHB | BCKDHB | BCKDHB | 2159 | 0.1 | 0.45 | YES |
| 16 | ACADM | ACADM | ACADM | 2401 | 0.09 | 0.45 | YES |
| 17 | ECHS1 | ECHS1 | ECHS1 | 2429 | 0.088 | 0.47 | YES |
| 18 | DBT | DBT | DBT | 2571 | 0.083 | 0.48 | YES |
| 19 | MCCC2 | MCCC2 | MCCC2 | 2586 | 0.082 | 0.49 | YES |
| 20 | HIBCH | HIBCH | HIBCH | 2622 | 0.081 | 0.51 | YES |
| 21 | IVD | IVD | IVD | 2657 | 0.079 | 0.52 | YES |
| 22 | ALDH7A1 | ALDH7A1 | ALDH7A1 | 2851 | 0.072 | 0.52 | YES |
| 23 | ALDH9A1 | ALDH9A1 | ALDH9A1 | 3054 | 0.065 | 0.52 | YES |
| 24 | HSD17B10 | HSD17B10 | HSD17B10 | 3277 | 0.059 | 0.52 | YES |
| 25 | HMGCS1 | HMGCS1 | HMGCS1 | 3561 | 0.052 | 0.52 | YES |
| 26 | ACAA2 | ACAA2 | ACAA2 | 3577 | 0.051 | 0.53 | YES |
| 27 | PCCA | PCCA | PCCA | 3697 | 0.048 | 0.53 | YES |
| 28 | BCKDHA | BCKDHA | BCKDHA | 4220 | 0.037 | 0.51 | NO |
| 29 | ACAT1 | ACAT1 | ACAT1 | 4859 | 0.024 | 0.48 | NO |
| 30 | HADHB | HADHB | HADHB | 5851 | 0.0068 | 0.42 | NO |
| 31 | HADHA | HADHA | HADHA | 5855 | 0.0068 | 0.42 | NO |
| 32 | PCCB | PCCB | PCCB | 6156 | 0.0018 | 0.41 | NO |
| 33 | MUT | MUT | MUT | 6570 | -0.0044 | 0.38 | NO |
| 34 | ACAD8 | ACAD8 | ACAD8 | 6777 | -0.0077 | 0.37 | NO |
| 35 | MCCC1 | MCCC1 | MCCC1 | 7104 | -0.012 | 0.36 | NO |
| 36 | DLD | DLD | DLD | 7411 | -0.018 | 0.34 | NO |
| 37 | ACAT2 | ACAT2 | ACAT2 | 7881 | -0.024 | 0.32 | NO |
| 38 | ACADS | ACADS | ACADS | 8671 | -0.037 | 0.28 | NO |
| 39 | HMGCS2 | HMGCS2 | HMGCS2 | 10405 | -0.073 | 0.2 | NO |
| 40 | OXCT1 | OXCT1 | OXCT1 | 10868 | -0.085 | 0.19 | NO |
| 41 | BCAT2 | BCAT2 | BCAT2 | 13492 | -0.19 | 0.082 | NO |
| 42 | IL4I1 | IL4I1 | IL4I1 | 16146 | -0.36 | 0.003 | NO |
| 43 | OXCT2 | OXCT2 | OXCT2 | 16868 | -0.44 | 0.049 | NO |
Figure S97. Get High-res Image This plot shows mRNAseq_cNMF expression data heatmap (on the left) a RunningEnrichmentScore(RES) plot (on the top right) and a Signal2Noise(S2N) plot (on the bottom right) of genes in the pathway: KEGG PROPANOATE METABOLISM.
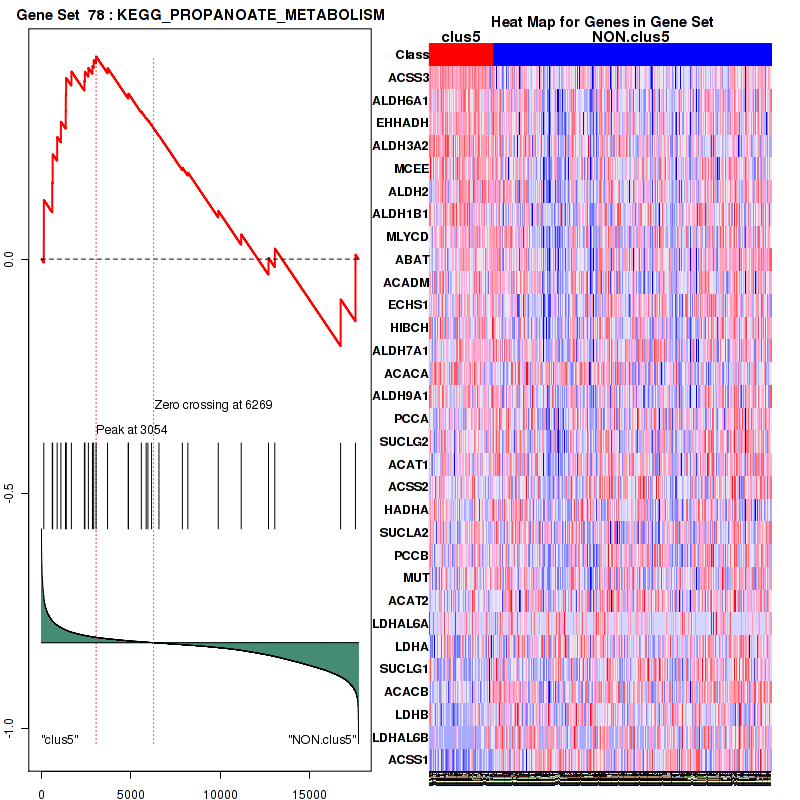
Figure S98. Get High-res Image For the top 5 core enriched genes in the pathway: KEGG PROPANOATE METABOLISM, this volcano plot shows how much they are up/down-regulated and significant. The significance was calculated by empirical bayesian fit
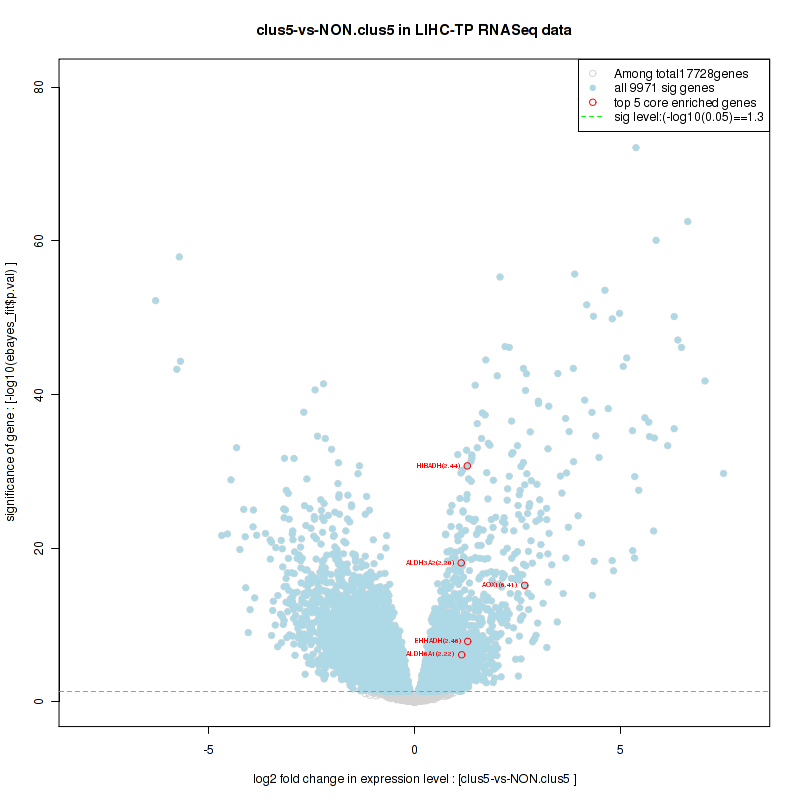
Table S50. Get Full Table This table shows a Running Enrichment Score (RES) of each gene in this pathway, that is, the enrichment score at this point in the ranked list of genes. All genes are ranked by Signal-to-Noise (S2N), a measure of similarity as default and are used to obtain ES matrix of all genes. In this way, GSEA tool uses expression pattern of not only overlapped genes but also not-overlapped genes to produce ES matrix.
| Rank | GENE | SYMBOL | DESC | LIST.LOC | S2N | RES | CORE_ENRICHMENT |
|---|---|---|---|---|---|---|---|
| 1 | ACSM3 | ACSM3 | ACSM3 | 344 | 0.37 | 0.078 | YES |
| 2 | ACSM5 | ACSM5 | ACSM5 | 367 | 0.35 | 0.17 | YES |
| 3 | ACSM2A | ACSM2A | ACSM2A | 488 | 0.31 | 0.24 | YES |
| 4 | ALDH3A2 | ALDH3A2 | ALDH3A2 | 878 | 0.22 | 0.28 | YES |
| 5 | HADH | HADH | HADH | 1253 | 0.17 | 0.3 | YES |
| 6 | ALDH2 | ALDH2 | ALDH2 | 1357 | 0.16 | 0.34 | YES |
| 7 | ALDH1B1 | ALDH1B1 | ALDH1B1 | 1361 | 0.16 | 0.38 | YES |
| 8 | ALDH5A1 | ALDH5A1 | ALDH5A1 | 1515 | 0.14 | 0.41 | YES |
| 9 | ABAT | ABAT | ABAT | 1674 | 0.13 | 0.43 | YES |
| 10 | BDH1 | BDH1 | BDH1 | 1865 | 0.12 | 0.45 | YES |
| 11 | L2HGDH | L2HGDH | L2HGDH | 1950 | 0.11 | 0.48 | YES |
| 12 | HMGCL | HMGCL | HMGCL | 2058 | 0.11 | 0.5 | YES |
| 13 | ACSM1 | ACSM1 | ACSM1 | 2283 | 0.095 | 0.51 | YES |
| 14 | ECHS1 | ECHS1 | ECHS1 | 2429 | 0.088 | 0.53 | YES |
| 15 | ALDH7A1 | ALDH7A1 | ALDH7A1 | 2851 | 0.072 | 0.52 | YES |
| 16 | GAD1 | GAD1 | GAD1 | 2970 | 0.068 | 0.54 | YES |
| 17 | ALDH9A1 | ALDH9A1 | ALDH9A1 | 3054 | 0.065 | 0.55 | YES |
| 18 | HMGCS1 | HMGCS1 | HMGCS1 | 3561 | 0.052 | 0.53 | NO |
| 19 | ACAT1 | ACAT1 | ACAT1 | 4859 | 0.024 | 0.46 | NO |
| 20 | HADHA | HADHA | HADHA | 5855 | 0.0068 | 0.41 | NO |
| 21 | PDHB | PDHB | PDHB | 6150 | 0.0018 | 0.4 | NO |
| 22 | ACAT2 | ACAT2 | ACAT2 | 7881 | -0.024 | 0.3 | NO |
| 23 | ACADS | ACADS | ACADS | 8671 | -0.037 | 0.27 | NO |
| 24 | PDHA1 | PDHA1 | PDHA1 | 9009 | -0.043 | 0.26 | NO |
| 25 | BDH2 | BDH2 | BDH2 | 9936 | -0.062 | 0.22 | NO |
| 26 | AKR1B10 | AKR1B10 | AKR1B10 | 10202 | -0.068 | 0.23 | NO |
| 27 | HMGCS2 | HMGCS2 | HMGCS2 | 10405 | -0.073 | 0.24 | NO |
| 28 | OXCT1 | OXCT1 | OXCT1 | 10868 | -0.085 | 0.23 | NO |
| 29 | AACS | AACS | AACS | 12555 | -0.15 | 0.18 | NO |
| 30 | OXCT2 | OXCT2 | OXCT2 | 16868 | -0.44 | 0.049 | NO |
Figure S99. Get High-res Image This plot shows mRNAseq_cNMF expression data heatmap (on the left) a RunningEnrichmentScore(RES) plot (on the top right) and a Signal2Noise(S2N) plot (on the bottom right) of genes in the pathway: KEGG BUTANOATE METABOLISM.
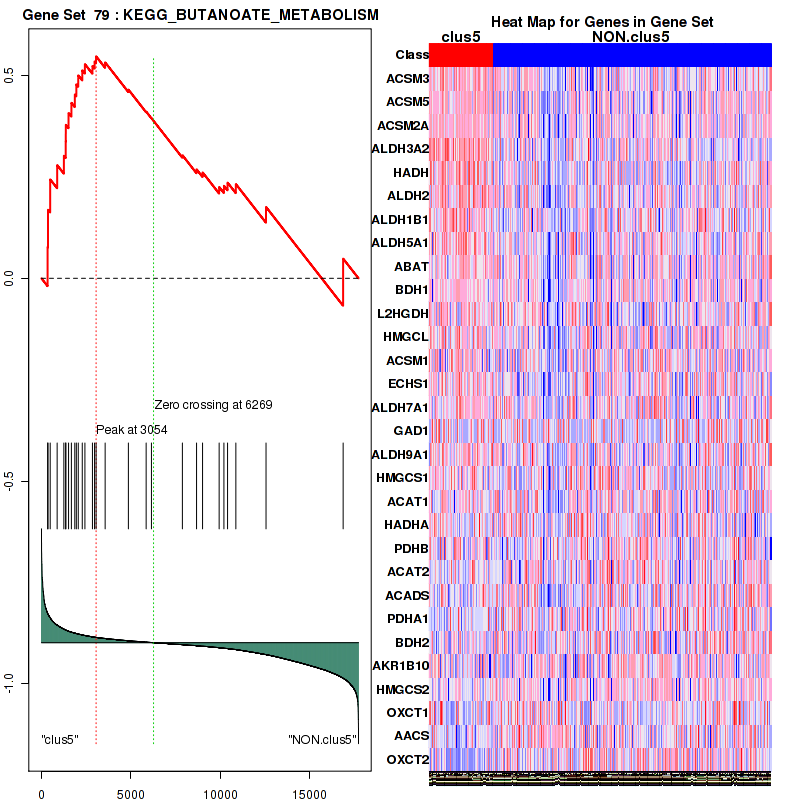
Figure S100. Get High-res Image For the top 5 core enriched genes in the pathway: KEGG BUTANOATE METABOLISM, this volcano plot shows how much they are up/down-regulated and significant. The significance was calculated by empirical bayesian fit
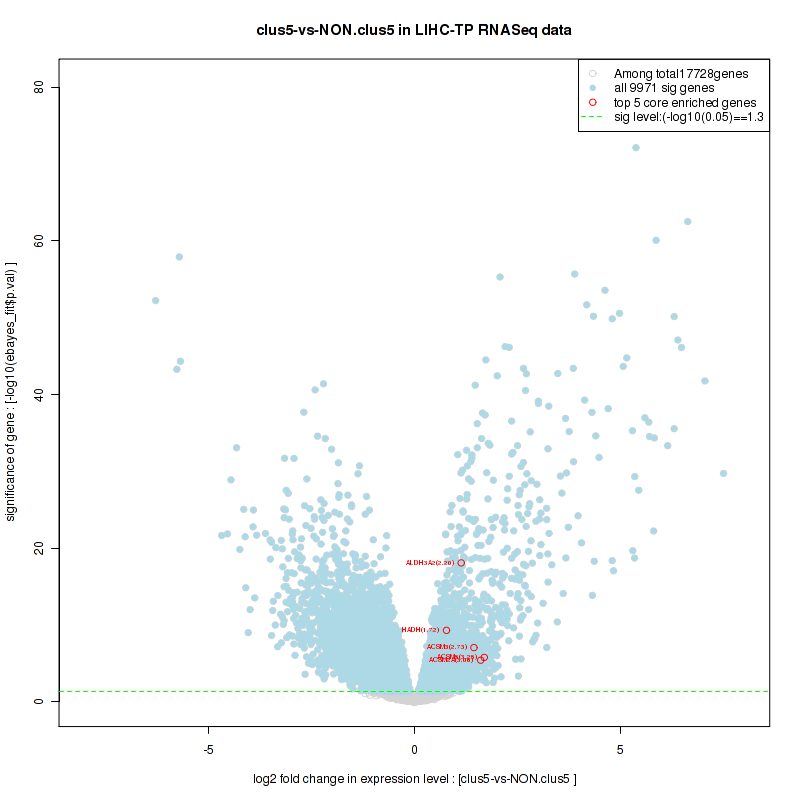
For the top enriched genes, if you want to check whether they are
-
up-regulated, please check the list of up-regulated genes
-
down-regulated, please check the list of down-regulated genes
For the top enriched genes, if you want to check whether they are
-
highly expressed genes, please check the list of high (top 30%) expressed genes
-
low expressed genes, please check the list of low (bottom 30%) expressed genes
An expression pattern of top(30%)/middle(30%)/low(30%) in this subtype against other subtypes is available in a heatmap
For the top enriched genes, if you want to check whether they are
-
significantly differently expressed genes by eBayes lm fit, please check the list of significant genes
-
Gene set database = c2.cp.v3.0-2.symbols.gmt
-
Expression data file = LIHC-TP.uncv2.mRNAseq_RSEM_normalized_log2.txt
-
Phenotype data file = LIHC-TP.mergedcluster.txt
For the Gene Set Enrichment Analysis (GSEA), Broad GSEA-P-R.1.0 version is used with class2: canonical pathways geneses from MSigDB. Further details about statistics are available inThe Broad GSEA website.
In addition to the links below, the full results of the analysis summarized in this report can also be downloaded programmatically using firehose_get, or interactively from either the Broad GDAC website or TCGA Data Coordination Center Portal.