This pipeline computes the correlation between significantly recurrent gene mutations and selected clinical features.
Testing the association between mutation status of 8 genes and 10 clinical features across 178 patients, one significant finding detected with Q value < 0.25.
-
NF1 mutation correlated to 'YEARS_TO_BIRTH'.
Table 1. Get Full Table Overview of the association between mutation status of 8 genes and 10 clinical features. Shown in the table are P values (Q values). Thresholded by Q value < 0.25, one significant finding detected.
|
Clinical Features |
Time to Death |
YEARS TO BIRTH |
TUMOR TISSUE SITE |
GENDER |
RADIATION THERAPY |
KARNOFSKY PERFORMANCE SCORE |
HISTOLOGICAL TYPE |
NUMBER OF LYMPH NODES |
RACE | ETHNICITY | ||
| nMutated (%) | nWild-Type | logrank test | Wilcoxon-test | Fisher's exact test | Fisher's exact test | Fisher's exact test | Wilcoxon-test | Fisher's exact test | Wilcoxon-test | Fisher's exact test | Fisher's exact test | |
| NF1 | 15 (8%) | 163 |
0.572 (1.00) |
0.00156 (0.125) |
0.313 (1.00) |
1 (1.00) |
1 (1.00) |
1 (1.00) |
0.751 (1.00) |
0.387 (1.00) |
0.283 (1.00) |
|
| HRAS | 18 (10%) | 160 |
0.433 (1.00) |
0.157 (1.00) |
0.203 (1.00) |
0.804 (1.00) |
1 (1.00) |
0.392 (1.00) |
0.478 (1.00) |
0.0992 (0.882) |
1 (1.00) |
|
| EPAS1 | 8 (4%) | 170 |
0.487 (1.00) |
0.966 (1.00) |
0.0359 (0.719) |
0.469 (1.00) |
0.21 (1.00) |
0.0502 (0.803) |
0.0128 (0.342) |
0.153 (1.00) |
1 (1.00) |
|
| NUDT11 | 5 (3%) | 173 |
0.643 (1.00) |
0.191 (1.00) |
1 (1.00) |
1 (1.00) |
1 (1.00) |
0.622 (1.00) |
0.186 (1.00) |
1 (1.00) |
||
| RET | 6 (3%) | 172 |
0.708 (1.00) |
0.441 (1.00) |
0.593 (1.00) |
0.7 (1.00) |
1 (1.00) |
1 (1.00) |
0.00631 (0.252) |
1 (1.00) |
||
| SHROOM4 | 3 (2%) | 175 |
0.755 (1.00) |
0.233 (1.00) |
0.45 (1.00) |
0.579 (1.00) |
1 (1.00) |
0.229 (1.00) |
1 (1.00) |
0.0694 (0.837) |
||
| AMMECR1 | 3 (2%) | 175 |
0.803 (1.00) |
0.296 (1.00) |
0.0837 (0.837) |
1 (1.00) |
1 (1.00) |
0.0782 (0.837) |
0.402 (1.00) |
1 (1.00) |
||
| GPR128 | 4 (2%) | 174 |
0.722 (1.00) |
0.891 (1.00) |
1 (1.00) |
0.635 (1.00) |
1 (1.00) |
1 (1.00) |
0.495 (1.00) |
1 (1.00) |
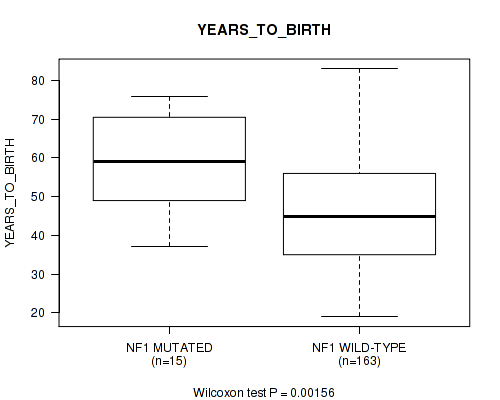
P value = 0.00156 (Wilcoxon-test), Q value = 0.12
Table S1. Gene #2: 'NF1 MUTATION STATUS' versus Clinical Feature #2: 'YEARS_TO_BIRTH'
| nPatients | Mean (Std.Dev) | |
|---|---|---|
| ALL | 178 | 47.2 (15.1) |
| NF1 MUTATED | 15 | 59.4 (13.4) |
| NF1 WILD-TYPE | 163 | 46.1 (14.8) |
Figure S1. Get High-res Image Gene #2: 'NF1 MUTATION STATUS' versus Clinical Feature #2: 'YEARS_TO_BIRTH'
-
Mutation data file = sample_sig_gene_table.txt from Mutsig_2CV pipeline
-
Processed Mutation data file = /xchip/cga/gdac-prod/tcga-gdac/jobResults/GDAC_Correlate_Genomic_Events_Preprocess/PCPG-TP/19897198/transformed.cor.cli.txt
-
Clinical data file = /xchip/cga/gdac-prod/tcga-gdac/jobResults/Append_Data/PCPG-TP/19775435/PCPG-TP.merged_data.txt
-
Number of patients = 178
-
Number of significantly mutated genes = 8
-
Number of selected clinical features = 10
-
Exclude genes that fewer than K tumors have mutations, K = 3
For survival clinical features, the Kaplan-Meier survival curves of tumors with and without gene mutations were plotted and the statistical significance P values were estimated by logrank test (Bland and Altman 2004) using the 'survdiff' function in R
For binary or multi-class clinical features (nominal or ordinal), two-tailed Fisher's exact tests (Fisher 1922) were used to estimate the P values using the 'fisher.test' function in R
For multiple hypothesis correction, Q value is the False Discovery Rate (FDR) analogue of the P value (Benjamini and Hochberg 1995), defined as the minimum FDR at which the test may be called significant. We used the 'Benjamini and Hochberg' method of 'p.adjust' function in R to convert P values into Q values.
In addition to the links below, the full results of the analysis summarized in this report can also be downloaded programmatically using firehose_get, or interactively from either the Broad GDAC website or TCGA Data Coordination Center Portal.