This pipeline computes the correlation between significantly recurrent gene mutations and selected clinical features.
Testing the association between mutation status of 23 genes and 9 clinical features across 244 patients, one significant finding detected with Q value < 0.25.
-
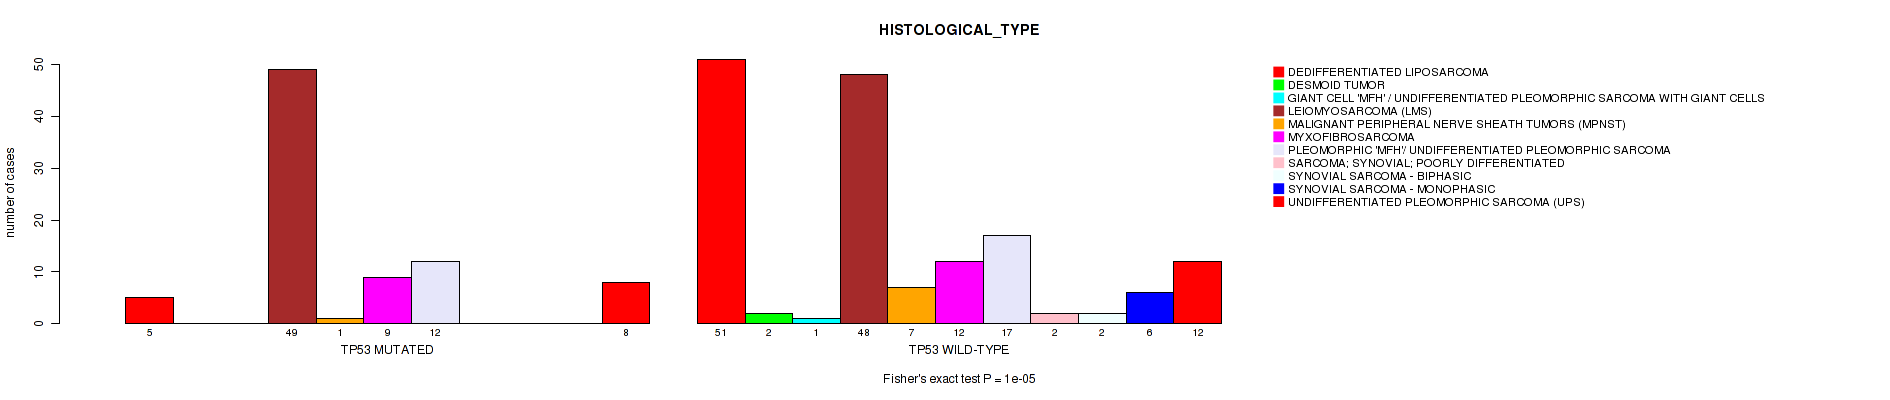
TP53 mutation correlated to 'HISTOLOGICAL_TYPE'.
Table 1. Get Full Table Overview of the association between mutation status of 23 genes and 9 clinical features. Shown in the table are P values (Q values). Thresholded by Q value < 0.25, one significant finding detected.
|
Clinical Features |
Time to Death |
YEARS TO BIRTH |
TUMOR TISSUE SITE |
GENDER |
RADIATION THERAPY |
HISTOLOGICAL TYPE |
RESIDUAL TUMOR |
RACE | ETHNICITY | ||
| nMutated (%) | nWild-Type | logrank test | Wilcoxon-test | Fisher's exact test | Fisher's exact test | Fisher's exact test | Fisher's exact test | Fisher's exact test | Fisher's exact test | Fisher's exact test | |
| TP53 | 84 (34%) | 160 |
0.648 (1.00) |
0.333 (1.00) |
0.168 (1.00) |
0.685 (1.00) |
1 (1.00) |
1e-05 (0.00207) |
0.772 (1.00) |
0.746 (1.00) |
0.177 (1.00) |
| ATRX | 37 (15%) | 207 |
0.224 (1.00) |
0.0129 (0.737) |
0.791 (1.00) |
0.479 (1.00) |
0.315 (1.00) |
0.225 (1.00) |
0.77 (1.00) |
0.585 (1.00) |
1 (1.00) |
| RB1 | 24 (10%) | 220 |
0.962 (1.00) |
0.922 (1.00) |
0.907 (1.00) |
0.202 (1.00) |
0.0557 (1.00) |
0.0328 (0.969) |
0.602 (1.00) |
1 (1.00) |
1 (1.00) |
| NUMBL | 9 (4%) | 235 |
0.694 (1.00) |
0.177 (1.00) |
0.991 (1.00) |
0.737 (1.00) |
0.452 (1.00) |
0.434 (1.00) |
0.18 (1.00) |
1 (1.00) |
1 (1.00) |
| MSH3 | 7 (3%) | 237 |
0.94 (1.00) |
0.616 (1.00) |
0.646 (1.00) |
0.127 (1.00) |
1 (1.00) |
0.723 (1.00) |
0.882 (1.00) |
1 (1.00) |
0.133 (1.00) |
| EOMES | 6 (2%) | 238 |
0.495 (1.00) |
0.906 (1.00) |
0.0701 (1.00) |
0.42 (1.00) |
0.0552 (1.00) |
0.138 (1.00) |
0.862 (1.00) |
0.46 (1.00) |
1 (1.00) |
| PKD2 | 6 (2%) | 238 |
0.422 (1.00) |
0.566 (1.00) |
0.769 (1.00) |
0.689 (1.00) |
1 (1.00) |
0.34 (1.00) |
1 (1.00) |
1 (1.00) |
0.111 (1.00) |
| LTBP3 | 5 (2%) | 239 |
0.591 (1.00) |
0.692 (1.00) |
0.373 (1.00) |
0.665 (1.00) |
0.325 (1.00) |
0.66 (1.00) |
0.479 (1.00) |
0.401 (1.00) |
1 (1.00) |
| SHROOM4 | 8 (3%) | 236 |
0.372 (1.00) |
0.728 (1.00) |
0.771 (1.00) |
0.292 (1.00) |
1 (1.00) |
0.816 (1.00) |
0.813 (1.00) |
0.174 (1.00) |
1 (1.00) |
| WNK1 | 6 (2%) | 238 |
0.633 (1.00) |
0.444 (1.00) |
0.174 (1.00) |
0.42 (1.00) |
0.188 (1.00) |
0.284 (1.00) |
0.731 (1.00) |
1 (1.00) |
1 (1.00) |
| ANP32E | 4 (2%) | 240 |
0.599 (1.00) |
0.608 (1.00) |
0.0944 (1.00) |
0.626 (1.00) |
1 (1.00) |
0.573 (1.00) |
0.369 (1.00) |
0.111 (1.00) |
1 (1.00) |
| PTEN | 7 (3%) | 237 |
0.712 (1.00) |
0.277 (1.00) |
0.0221 (0.916) |
1 (1.00) |
0.355 (1.00) |
0.805 (1.00) |
0.523 (1.00) |
1 (1.00) |
1 (1.00) |
| KRTAP5-5 | 7 (3%) | 237 |
0.702 (1.00) |
0.138 (1.00) |
0.706 (1.00) |
0.455 (1.00) |
0.407 (1.00) |
0.383 (1.00) |
0.0993 (1.00) |
1 (1.00) |
0.153 (1.00) |
| TRAF7 | 4 (2%) | 240 |
0.907 (1.00) |
0.869 (1.00) |
0.427 (1.00) |
0.339 (1.00) |
1 (1.00) |
0.343 (1.00) |
0.613 (1.00) |
1 (1.00) |
1 (1.00) |
| MEGF9 | 3 (1%) | 241 |
0.258 (1.00) |
0.299 (1.00) |
0.0142 (0.737) |
0.598 (1.00) |
1 (1.00) |
0.472 (1.00) |
0.365 (1.00) |
1 (1.00) |
1 (1.00) |
| LOR | 6 (2%) | 238 |
0.94 (1.00) |
0.869 (1.00) |
0.3 (1.00) |
0.42 (1.00) |
1 (1.00) |
0.202 (1.00) |
0.413 (1.00) |
1 (1.00) |
1 (1.00) |
| CABLES1 | 3 (1%) | 241 |
0.495 (1.00) |
0.833 (1.00) |
0.404 (1.00) |
0.598 (1.00) |
1 (1.00) |
1 (1.00) |
0.709 (1.00) |
1 (1.00) |
1 (1.00) |
| COL18A1 | 7 (3%) | 237 |
0.99 (1.00) |
0.374 (1.00) |
0.074 (1.00) |
0.254 (1.00) |
0.407 (1.00) |
0.213 (1.00) |
0.33 (1.00) |
0.513 (1.00) |
1 (1.00) |
| LHCGR | 6 (2%) | 238 |
0.357 (1.00) |
0.295 (1.00) |
0.0789 (1.00) |
1 (1.00) |
0.355 (1.00) |
0.0584 (1.00) |
0.732 (1.00) |
1 (1.00) |
1 (1.00) |
| NF1 | 10 (4%) | 234 |
0.584 (1.00) |
0.156 (1.00) |
0.167 (1.00) |
1 (1.00) |
0.475 (1.00) |
0.0285 (0.969) |
0.163 (1.00) |
1 (1.00) |
1 (1.00) |
| FOXD2 | 3 (1%) | 241 |
0.266 (1.00) |
0.704 (1.00) |
0.759 (1.00) |
1 (1.00) |
1 (1.00) |
0.173 (1.00) |
1 (1.00) |
1 (1.00) |
|
| MMP17 | 3 (1%) | 241 |
0.24 (1.00) |
0.329 (1.00) |
0.19 (1.00) |
0.598 (1.00) |
0.561 (1.00) |
0.00489 (0.506) |
0.71 (1.00) |
1 (1.00) |
0.0459 (1.00) |
| ASTE1 | 3 (1%) | 241 |
0.26 (1.00) |
0.795 (1.00) |
0.758 (1.00) |
0.0979 (1.00) |
1 (1.00) |
0.0912 (1.00) |
1 (1.00) |
1 (1.00) |
0.0682 (1.00) |
P value = 1e-05 (Fisher's exact test), Q value = 0.0021
Table S1. Gene #1: 'TP53 MUTATION STATUS' versus Clinical Feature #6: 'HISTOLOGICAL_TYPE'
| nPatients | DEDIFFERENTIATED LIPOSARCOMA | DESMOID TUMOR | GIANT CELL 'MFH' / UNDIFFERENTIATED PLEOMORPHIC SARCOMA WITH GIANT CELLS | LEIOMYOSARCOMA (LMS) | MALIGNANT PERIPHERAL NERVE SHEATH TUMORS (MPNST) | MYXOFIBROSARCOMA | PLEOMORPHIC 'MFH'/ UNDIFFERENTIATED PLEOMORPHIC SARCOMA | SARCOMA; SYNOVIAL; POORLY DIFFERENTIATED | SYNOVIAL SARCOMA - BIPHASIC | SYNOVIAL SARCOMA - MONOPHASIC | UNDIFFERENTIATED PLEOMORPHIC SARCOMA (UPS) |
|---|---|---|---|---|---|---|---|---|---|---|---|
| ALL | 56 | 2 | 1 | 97 | 8 | 21 | 29 | 2 | 2 | 6 | 20 |
| TP53 MUTATED | 5 | 0 | 0 | 49 | 1 | 9 | 12 | 0 | 0 | 0 | 8 |
| TP53 WILD-TYPE | 51 | 2 | 1 | 48 | 7 | 12 | 17 | 2 | 2 | 6 | 12 |
Figure S1. Get High-res Image Gene #1: 'TP53 MUTATION STATUS' versus Clinical Feature #6: 'HISTOLOGICAL_TYPE'
-
Mutation data file = sample_sig_gene_table.txt from Mutsig_2CV pipeline
-
Processed Mutation data file = /xchip/cga/gdac-prod/tcga-gdac/jobResults/GDAC_Correlate_Genomic_Events_Preprocess/SARC-TP/19898602/transformed.cor.cli.txt
-
Clinical data file = /xchip/cga/gdac-prod/tcga-gdac/jobResults/Append_Data/SARC-TP/19775498/SARC-TP.merged_data.txt
-
Number of patients = 244
-
Number of significantly mutated genes = 23
-
Number of selected clinical features = 9
-
Exclude genes that fewer than K tumors have mutations, K = 3
For survival clinical features, the Kaplan-Meier survival curves of tumors with and without gene mutations were plotted and the statistical significance P values were estimated by logrank test (Bland and Altman 2004) using the 'survdiff' function in R
For binary or multi-class clinical features (nominal or ordinal), two-tailed Fisher's exact tests (Fisher 1922) were used to estimate the P values using the 'fisher.test' function in R
For multiple hypothesis correction, Q value is the False Discovery Rate (FDR) analogue of the P value (Benjamini and Hochberg 1995), defined as the minimum FDR at which the test may be called significant. We used the 'Benjamini and Hochberg' method of 'p.adjust' function in R to convert P values into Q values.
In addition to the links below, the full results of the analysis summarized in this report can also be downloaded programmatically using firehose_get, or interactively from either the Broad GDAC website or TCGA Data Coordination Center Portal.