This pipeline attempts to calculate the pearson correlation between APOBEC_MutLoad_MinEstimate and mRnaseq data of each gene across samples to determine if the APOBEC_MutLoad_MinEstimate also result in differential expressions.
The correlation coefficients in 10, 20, 30, 40, 50, 60, 70, 80, 90 percentiles are -0.0943, -0.0645, -0.0421, -0.0243, -0.0073, 0.0109, 0.0307, 0.0538, 0.0841, respectively.
Number of samples used for the calculation are shown in Table 1. Figure 1 shows the distribution of calculated correlation coefficients and quantile-quantile plot of the calculated correlation coefficients against a normal distribution. Table 2 shows the top 20 genes ordered by the value of correlation coefficients.
Table 1. Counts of mRNAseq and number of samples in APOBEC_MutLoad_MinEstimate and expression data sets and common to both
| Category | APOBEC_MutLoad_MinEstimate | Expression | Common |
|---|---|---|---|
| Sample | 290 | 367 | 290 |
Figure 1. Summary figures. Left: histogram showing the distribution of the calculated correlations across samples for all Genes. Right: QQ plot of the calculated correlations across samples. The QQ plot is used to plot the quantiles of the calculated correlation coefficients against that derived from a normal distribution. Points deviating from the blue line indicate deviation from normality.
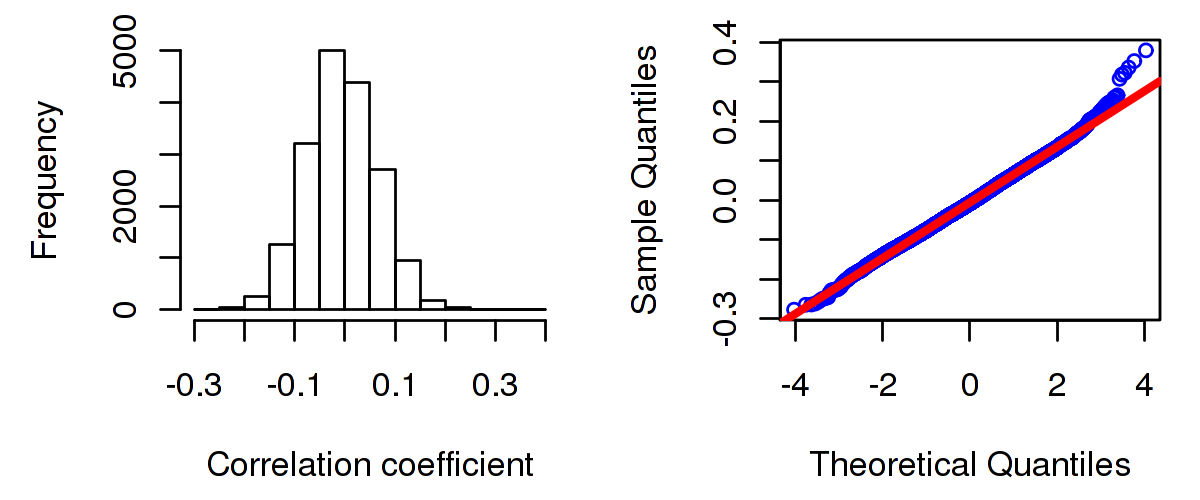
Table 2. Get Full Table Top 20 genes ranked by correlation coefficients
| geneID | cor | p-value | q-value |
|---|---|---|---|
| AHSG|197 | 0.3795 | 3.68524226703748e-05 | 0.059671257949302 |
| PRB2|653247 | 0.3525 | 0.000492695085792194 | 0.162073286859791 |
| AMY1A|276 | 0.336 | 3.75046233180854e-07 | 0.00338798014743924 |
| PRB1|5542 | 0.3226 | 0.00112581029720316 | 0.221087115647494 |
| PARP6|56965 | 0.3182 | 3.03399114720548e-08 | 0.000548151180565615 |
| LOC153328|153328 | 0.3074 | 0.000976554946509722 | 0.20960639126307 |
| ITLN2|142683 | 0.2657 | 0.000142987177085052 | 0.107639555349818 |
| GAGE12J|729396 | 0.2611 | 0.00382301169452592 | 0.362847821188325 |
| PRB3|5544 | 0.26 | 0.00684226922243347 | 0.437665105841921 |
| ITGB1BP1|9270 | 0.2531 | 1.28569006339063e-05 | 0.0332355740204831 |
| HAO2|51179 | 0.2507 | 0.000713792654708723 | 0.186234049358677 |
| APOA2|336 | 0.2477 | 0.0149574590362018 | 0.502671930617265 |
| OR7E5P|219445 | 0.2476 | 0.0173368703329628 | 0.524679719028918 |
| LOC285033|285033 | 0.2469 | 2.10931759365707e-05 | 0.042343378849558 |
| FGF5|2250 | 0.2439 | 0.000967981775940707 | 0.20960639126307 |
| GPR26|2849 | 0.243 | 0.0164543755875841 | 0.514015639904517 |
| RPL23AP82|284942 | 0.2389 | 3.96333146284178e-05 | 0.059671257949302 |
| NBPF4|148545 | 0.2387 | 0.000267218760003907 | 0.133162920418091 |
| VIL1|7429 | 0.2352 | 0.0162568094671274 | 0.511789797132692 |
| CALHM3|119395 | 0.2345 | 0.0160418543810497 | 0.509364117930447 |
Gene level (TCGA Level III) mRNAseq expression data and APOBEC_MutLoad_MinEstimate derived by Mutation_APOBEC pipeline were used to do this analysis. Pearson correlation coefficients were calculated for APOBEC_MutLoad_MinEstimate and each gene across all the samples that were common.
Pearson correlation with pairwise.complete.obs was used to do this analysis.
In addition to the links below, the full results of the analysis summarized in this report can also be downloaded programmatically using firehose_get, or interactively from either the Broad GDAC website or TCGA Data Coordination Center Portal.