This pipeline computes the correlation between significant arm-level copy number variations (cnvs) and selected clinical features.
Testing the association between copy number variation 74 arm-level events and 10 clinical features across 134 patients, 14 significant findings detected with Q value < 0.25.
-
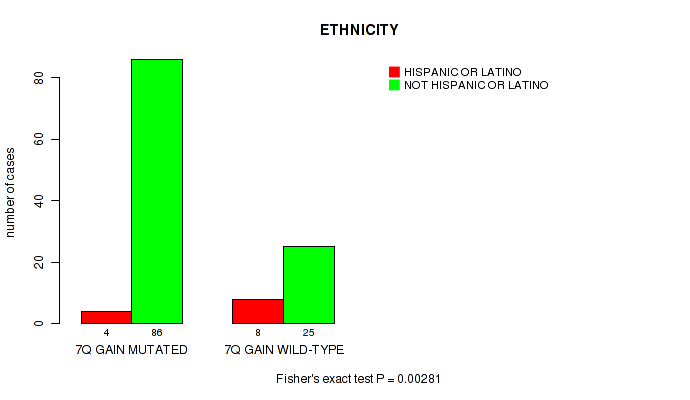
7q gain cnv correlated to 'ETHNICITY'.
-
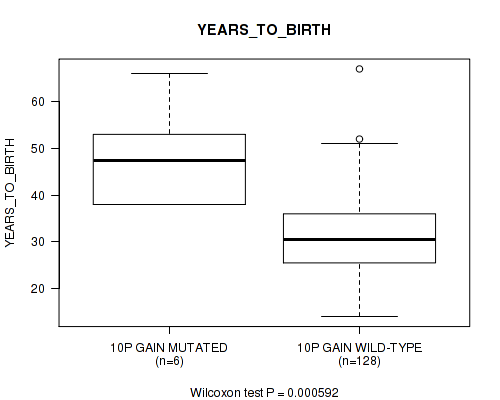
10p gain cnv correlated to 'YEARS_TO_BIRTH'.
-
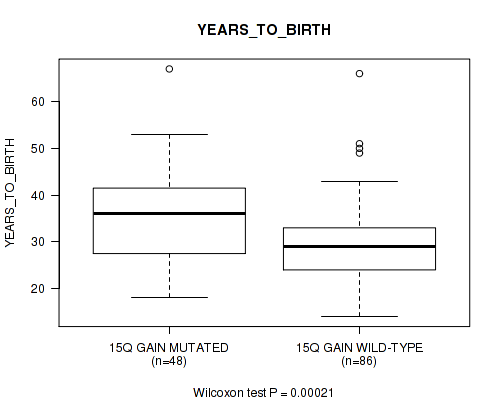
15q gain cnv correlated to 'YEARS_TO_BIRTH'.
-
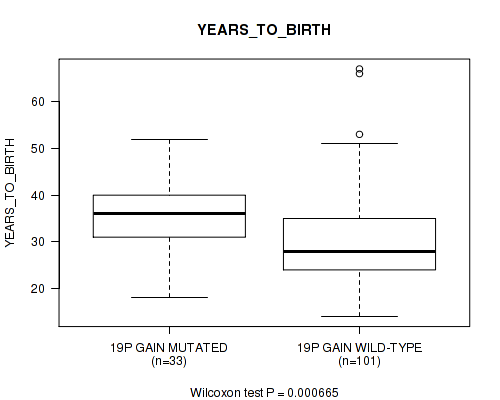
19p gain cnv correlated to 'YEARS_TO_BIRTH'.
-
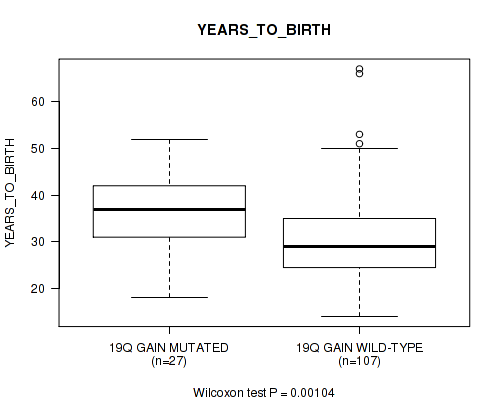
19q gain cnv correlated to 'YEARS_TO_BIRTH'.
-
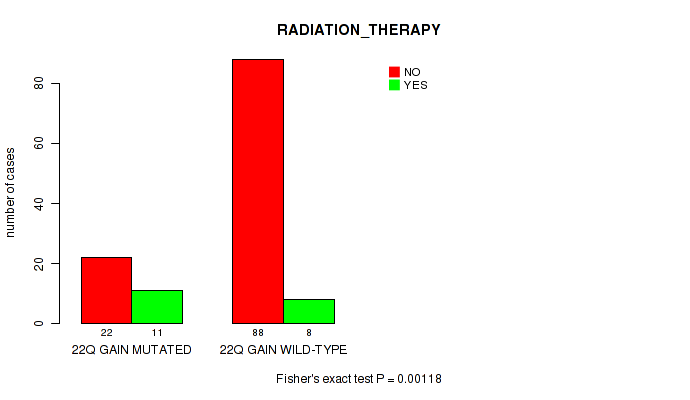
22q gain cnv correlated to 'RADIATION_THERAPY'.
-
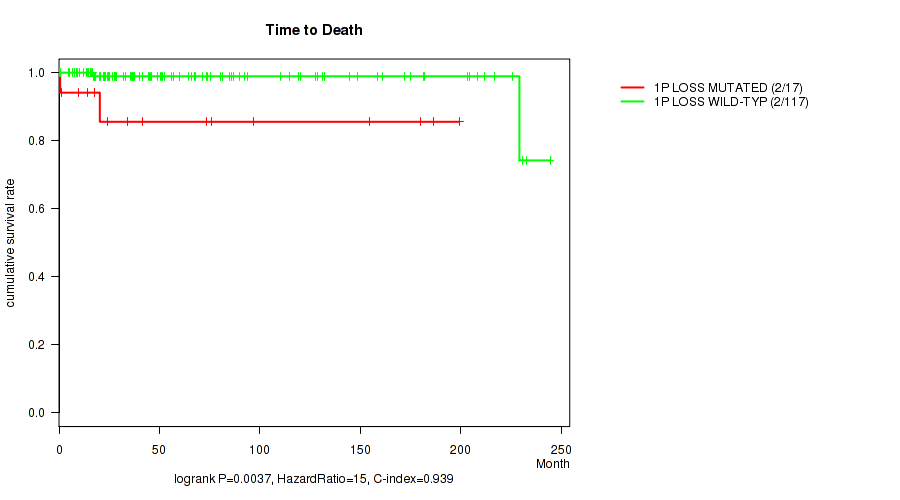
1p loss cnv correlated to 'Time to Death'.
-
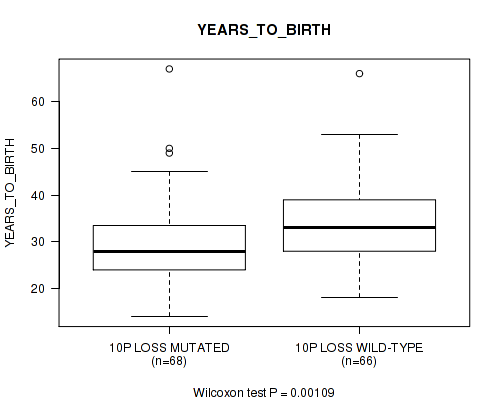
10p loss cnv correlated to 'YEARS_TO_BIRTH'.
-
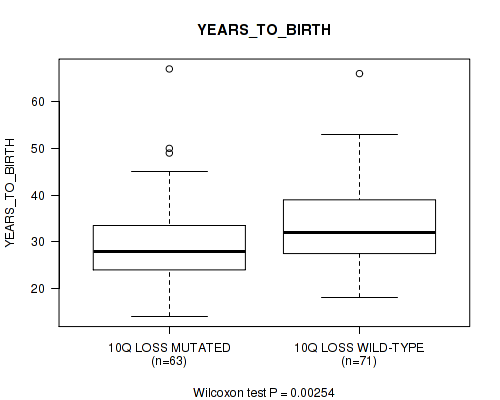
10q loss cnv correlated to 'YEARS_TO_BIRTH'.
-
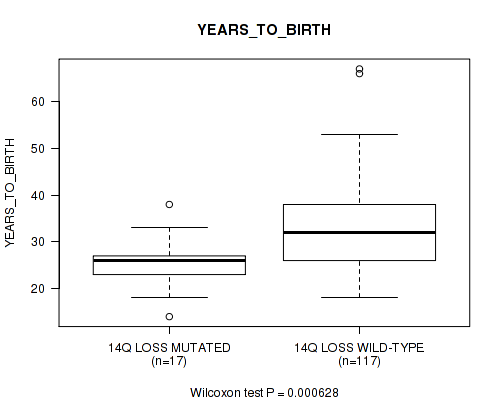
14q loss cnv correlated to 'YEARS_TO_BIRTH'.
-
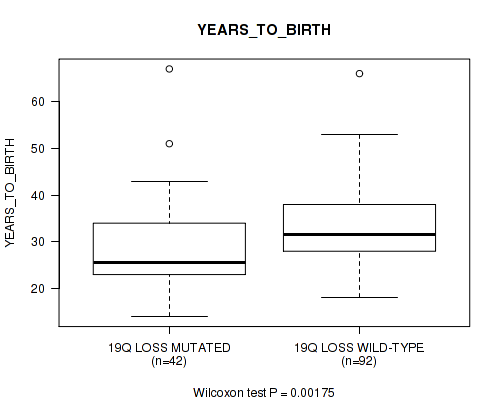
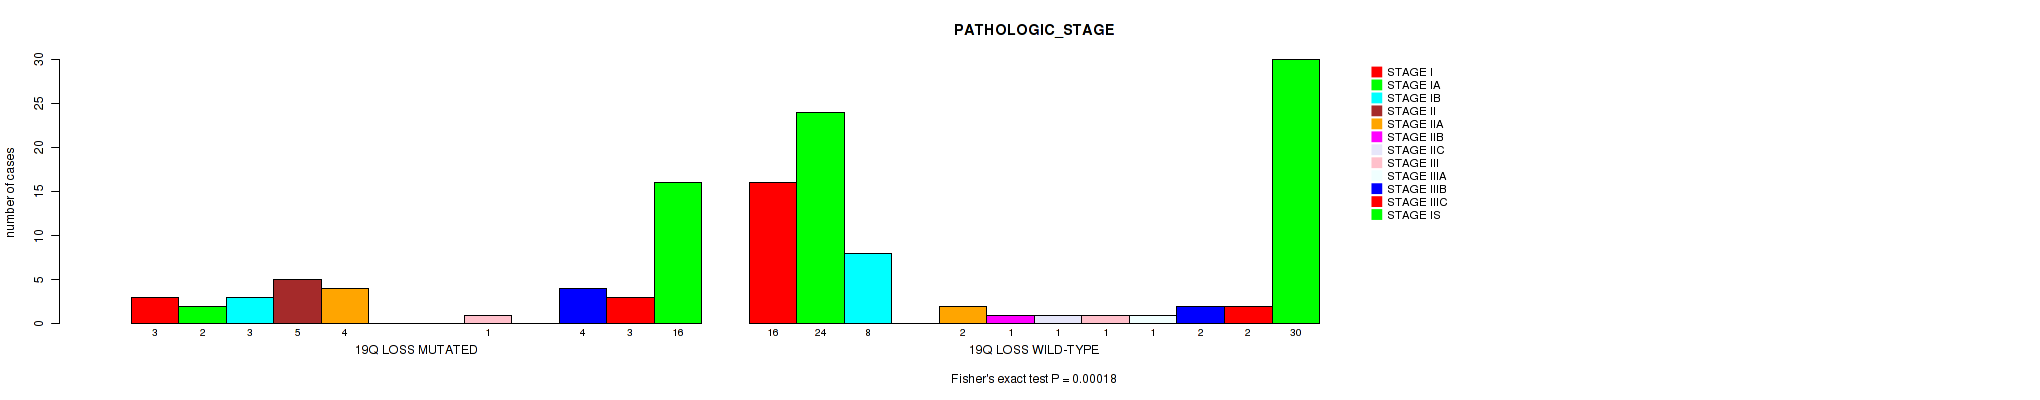
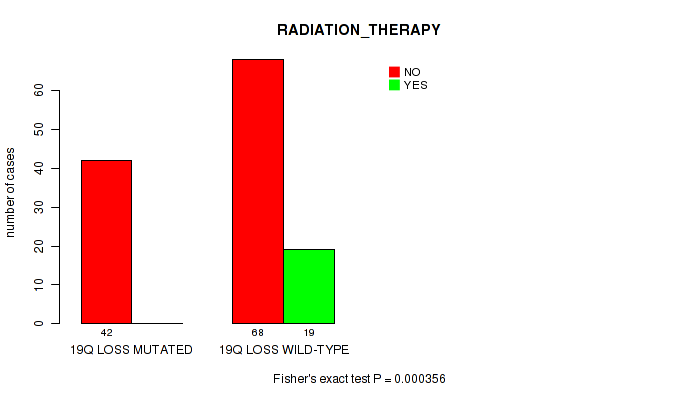
19q loss cnv correlated to 'YEARS_TO_BIRTH', 'PATHOLOGIC_STAGE', and 'RADIATION_THERAPY'.
-
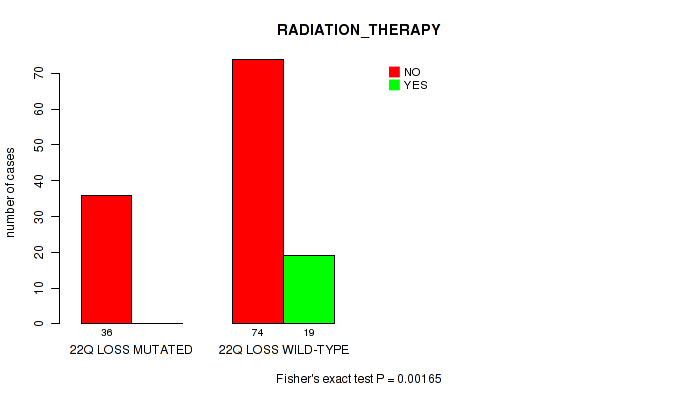
22q loss cnv correlated to 'RADIATION_THERAPY'.
Table 1. Get Full Table Overview of the association between significant copy number variation of 74 arm-level events and 10 clinical features. Shown in the table are P values (Q values). Thresholded by Q value < 0.25, 14 significant findings detected.
|
Clinical Features |
Time to Death |
YEARS TO BIRTH |
PATHOLOGIC STAGE |
PATHOLOGY T STAGE |
PATHOLOGY N STAGE |
PATHOLOGY M STAGE |
RADIATION THERAPY |
KARNOFSKY PERFORMANCE SCORE |
RACE | ETHNICITY | ||
| nCNV (%) | nWild-Type | logrank test | Wilcoxon-test | Fisher's exact test | Fisher's exact test | Fisher's exact test | Fisher's exact test | Fisher's exact test | Wilcoxon-test | Fisher's exact test | Fisher's exact test | |
| 19q loss | 42 (31%) | 92 |
0.617 (1.00) |
0.00175 (0.118) |
0.00018 (0.0778) |
0.149 (0.89) |
0.105 (0.833) |
0.596 (1.00) |
0.000356 (0.082) |
0.329 (0.958) |
1 (1.00) |
0.751 (1.00) |
| 7q gain | 97 (72%) | 37 |
0.956 (1.00) |
0.909 (1.00) |
0.314 (0.958) |
0.0674 (0.723) |
1 (1.00) |
1 (1.00) |
0.417 (0.99) |
0.545 (1.00) |
0.856 (1.00) |
0.00281 (0.16) |
| 10p gain | 6 (4%) | 128 |
0.74 (1.00) |
0.000592 (0.082) |
0.949 (1.00) |
0.171 (0.924) |
1 (1.00) |
1 (1.00) |
0.558 (1.00) |
0.337 (0.958) |
1 (1.00) |
|
| 15q gain | 48 (36%) | 86 |
0.988 (1.00) |
0.00021 (0.0778) |
0.182 (0.926) |
0.951 (1.00) |
1 (1.00) |
0.295 (0.958) |
1 (1.00) |
0.329 (0.958) |
1 (1.00) |
0.535 (1.00) |
| 19p gain | 33 (25%) | 101 |
0.338 (0.958) |
0.000665 (0.082) |
0.116 (0.833) |
0.395 (0.987) |
0.668 (1.00) |
0.571 (1.00) |
0.242 (0.958) |
0.64 (1.00) |
1 (1.00) |
0.176 (0.926) |
| 19q gain | 27 (20%) | 107 |
0.406 (0.987) |
0.00104 (0.0973) |
0.126 (0.863) |
0.28 (0.958) |
1 (1.00) |
0.582 (1.00) |
0.0558 (0.677) |
0.394 (0.987) |
1 (1.00) |
0.0666 (0.723) |
| 22q gain | 35 (26%) | 99 |
0.32 (0.958) |
0.0541 (0.677) |
0.394 (0.987) |
0.167 (0.915) |
0.426 (0.99) |
0.573 (1.00) |
0.00118 (0.0973) |
0.864 (1.00) |
0.715 (1.00) |
1 (1.00) |
| 1p loss | 17 (13%) | 117 |
0.0037 (0.195) |
0.728 (1.00) |
0.896 (1.00) |
0.359 (0.979) |
0.671 (1.00) |
1 (1.00) |
1 (1.00) |
0.0488 (0.677) |
0.227 (0.958) |
1 (1.00) |
| 10p loss | 68 (51%) | 66 |
0.457 (1.00) |
0.00109 (0.0973) |
0.0718 (0.728) |
0.356 (0.979) |
0.0575 (0.686) |
0.619 (1.00) |
0.0249 (0.624) |
0.0766 (0.736) |
0.0866 (0.789) |
1 (1.00) |
| 10q loss | 63 (47%) | 71 |
0.291 (0.958) |
0.00254 (0.157) |
0.0466 (0.677) |
0.39 (0.987) |
0.0303 (0.624) |
0.334 (0.958) |
0.0234 (0.624) |
0.0294 (0.624) |
0.7 (1.00) |
0.0331 (0.628) |
| 14q loss | 17 (13%) | 117 |
0.598 (1.00) |
0.000628 (0.082) |
0.207 (0.953) |
0.464 (1.00) |
0.0623 (0.709) |
0.374 (0.987) |
0.465 (1.00) |
0.942 (1.00) |
0.769 (1.00) |
0.627 (1.00) |
| 22q loss | 38 (28%) | 96 |
0.715 (1.00) |
0.489 (1.00) |
0.0297 (0.624) |
0.062 (0.709) |
0.509 (1.00) |
0.307 (0.958) |
0.00165 (0.118) |
0.0441 (0.677) |
0.226 (0.958) |
0.736 (1.00) |
| 1p gain | 32 (24%) | 102 |
0.836 (1.00) |
0.116 (0.833) |
0.383 (0.987) |
0.0553 (0.677) |
0.187 (0.926) |
1 (1.00) |
0.159 (0.907) |
0.514 (1.00) |
0.716 (1.00) |
0.495 (1.00) |
| 1q gain | 55 (41%) | 79 |
0.777 (1.00) |
0.333 (0.958) |
0.267 (0.958) |
0.0251 (0.624) |
0.362 (0.979) |
0.634 (1.00) |
0.617 (1.00) |
0.416 (0.99) |
0.52 (1.00) |
0.0278 (0.624) |
| 2p gain | 39 (29%) | 95 |
0.884 (1.00) |
0.825 (1.00) |
0.984 (1.00) |
0.449 (1.00) |
0.517 (1.00) |
1 (1.00) |
0.792 (1.00) |
0.0592 (0.696) |
0.861 (1.00) |
1 (1.00) |
| 2q gain | 38 (28%) | 96 |
0.695 (1.00) |
0.228 (0.958) |
0.993 (1.00) |
0.421 (0.99) |
0.735 (1.00) |
1 (1.00) |
0.408 (0.987) |
0.393 (0.987) |
0.856 (1.00) |
0.512 (1.00) |
| 3p gain | 23 (17%) | 111 |
0.456 (1.00) |
0.285 (0.958) |
0.924 (1.00) |
0.443 (1.00) |
1 (1.00) |
0.131 (0.863) |
0.194 (0.926) |
0.379 (0.987) |
0.64 (1.00) |
0.429 (0.99) |
| 3q gain | 32 (24%) | 102 |
0.946 (1.00) |
0.915 (1.00) |
0.487 (1.00) |
0.0383 (0.677) |
0.481 (1.00) |
0.221 (0.958) |
0.56 (1.00) |
0.469 (1.00) |
0.839 (1.00) |
1 (1.00) |
| 4p gain | 3 (2%) | 131 |
0.814 (1.00) |
0.609 (1.00) |
0.857 (1.00) |
0.365 (0.979) |
1 (1.00) |
1 (1.00) |
0.631 (1.00) |
0.216 (0.958) |
1 (1.00) |
|
| 5p gain | 6 (4%) | 128 |
0.709 (1.00) |
0.0197 (0.609) |
0.435 (0.995) |
0.412 (0.987) |
0.533 (1.00) |
1 (1.00) |
0.591 (1.00) |
0.016 (0.539) |
1 (1.00) |
0.467 (1.00) |
| 5q gain | 3 (2%) | 131 |
0.818 (1.00) |
0.101 (0.829) |
0.123 (0.853) |
1 (1.00) |
1 (1.00) |
1 (1.00) |
0.267 (0.958) |
|||
| 6p gain | 21 (16%) | 113 |
0.335 (0.958) |
0.353 (0.979) |
0.66 (1.00) |
0.541 (1.00) |
1 (1.00) |
0.526 (1.00) |
0.309 (0.958) |
0.505 (1.00) |
0.463 (1.00) |
0.411 (0.987) |
| 6q gain | 17 (13%) | 117 |
0.496 (1.00) |
0.623 (1.00) |
0.259 (0.958) |
0.326 (0.958) |
0.643 (1.00) |
0.465 (1.00) |
0.0747 (0.728) |
0.922 (1.00) |
0.543 (1.00) |
0.37 (0.986) |
| 7p gain | 111 (83%) | 23 |
0.745 (1.00) |
1 (1.00) |
0.682 (1.00) |
1 (1.00) |
1 (1.00) |
0.526 (1.00) |
1 (1.00) |
0.703 (1.00) |
0.806 (1.00) |
0.0257 (0.624) |
| 8p gain | 102 (76%) | 32 |
0.273 (0.958) |
0.466 (1.00) |
0.695 (1.00) |
0.939 (1.00) |
1 (1.00) |
0.0361 (0.668) |
0.159 (0.907) |
0.306 (0.958) |
0.84 (1.00) |
0.732 (1.00) |
| 8q gain | 104 (78%) | 30 |
0.269 (0.958) |
0.23 (0.958) |
0.386 (0.987) |
0.555 (1.00) |
1 (1.00) |
0.0288 (0.624) |
0.0732 (0.728) |
0.203 (0.953) |
0.702 (1.00) |
0.278 (0.958) |
| 9p gain | 14 (10%) | 120 |
0.403 (0.987) |
0.546 (1.00) |
0.593 (1.00) |
0.336 (0.958) |
1 (1.00) |
0.692 (1.00) |
0.428 (0.99) |
1 (1.00) |
0.0945 (0.813) |
|
| 9q gain | 15 (11%) | 119 |
0.379 (0.987) |
0.285 (0.958) |
0.23 (0.958) |
0.802 (1.00) |
1 (1.00) |
0.35 (0.978) |
1 (1.00) |
0.692 (1.00) |
0.325 (0.958) |
1 (1.00) |
| 10q gain | 8 (6%) | 126 |
0.673 (1.00) |
0.00749 (0.292) |
0.928 (1.00) |
0.202 (0.953) |
1 (1.00) |
1 (1.00) |
1 (1.00) |
0.627 (1.00) |
1 (1.00) |
0.522 (1.00) |
| 11p gain | 9 (7%) | 125 |
0.455 (1.00) |
0.673 (1.00) |
0.325 (0.958) |
0.664 (1.00) |
1 (1.00) |
1 (1.00) |
0.355 (0.979) |
0.784 (1.00) |
1 (1.00) |
1 (1.00) |
| 11q gain | 4 (3%) | 130 |
0.512 (1.00) |
0.671 (1.00) |
0.148 (0.89) |
1 (1.00) |
1 (1.00) |
1 (1.00) |
0.0937 (0.813) |
1 (1.00) |
1 (1.00) |
|
| 12p gain | 130 (97%) | 4 |
0.75 (1.00) |
0.969 (1.00) |
0.194 (0.926) |
0.709 (1.00) |
1 (1.00) |
0.476 (1.00) |
0.116 (0.833) |
1 (1.00) |
1 (1.00) |
|
| 12q gain | 91 (68%) | 43 |
0.533 (1.00) |
0.0477 (0.677) |
0.246 (0.958) |
0.554 (1.00) |
0.738 (1.00) |
1 (1.00) |
0.111 (0.833) |
0.864 (1.00) |
0.568 (1.00) |
0.339 (0.958) |
| 14q gain | 45 (34%) | 89 |
0.382 (0.987) |
0.0993 (0.828) |
0.173 (0.925) |
0.95 (1.00) |
0.307 (0.958) |
1 (1.00) |
0.113 (0.833) |
0.0859 (0.789) |
1 (1.00) |
0.212 (0.958) |
| 16p gain | 13 (10%) | 121 |
0.157 (0.907) |
0.57 (1.00) |
0.672 (1.00) |
0.0874 (0.789) |
0.643 (1.00) |
0.325 (0.958) |
0.69 (1.00) |
0.622 (1.00) |
0.668 (1.00) |
0.292 (0.958) |
| 16q gain | 13 (10%) | 121 |
0.182 (0.926) |
0.254 (0.958) |
0.674 (1.00) |
0.165 (0.915) |
0.643 (1.00) |
0.325 (0.958) |
0.69 (1.00) |
0.622 (1.00) |
0.666 (1.00) |
0.292 (0.958) |
| 17p gain | 32 (24%) | 102 |
0.457 (1.00) |
0.204 (0.953) |
0.131 (0.863) |
0.165 (0.915) |
0.513 (1.00) |
0.278 (0.958) |
0.0417 (0.677) |
0.189 (0.926) |
0.603 (1.00) |
0.729 (1.00) |
| 17q gain | 43 (32%) | 91 |
0.129 (0.863) |
0.334 (0.958) |
0.265 (0.958) |
0.335 (0.958) |
1 (1.00) |
0.596 (1.00) |
0.0328 (0.628) |
0.41 (0.987) |
0.312 (0.958) |
0.749 (1.00) |
| 18p gain | 4 (3%) | 130 |
0.805 (1.00) |
0.794 (1.00) |
0.362 (0.979) |
1 (1.00) |
1 (1.00) |
1 (1.00) |
1 (1.00) |
0.38 (0.987) |
0.131 (0.863) |
1 (1.00) |
| 20p gain | 30 (22%) | 104 |
0.922 (1.00) |
0.636 (1.00) |
0.139 (0.865) |
0.00654 (0.288) |
0.426 (0.99) |
0.194 (0.926) |
0.24 (0.958) |
0.325 (0.958) |
0.837 (1.00) |
1 (1.00) |
| 20q gain | 33 (25%) | 101 |
0.983 (1.00) |
0.7 (1.00) |
0.0531 (0.677) |
0.0287 (0.624) |
0.712 (1.00) |
0.221 (0.958) |
0.155 (0.907) |
0.256 (0.958) |
0.606 (1.00) |
0.294 (0.958) |
| 21q gain | 113 (84%) | 21 |
0.108 (0.833) |
0.0417 (0.677) |
0.464 (1.00) |
0.304 (0.958) |
0.713 (1.00) |
0.486 (1.00) |
1 (1.00) |
0.884 (1.00) |
0.323 (0.958) |
1 (1.00) |
| xp gain | 18 (13%) | 116 |
0.365 (0.979) |
0.158 (0.907) |
0.713 (1.00) |
0.612 (1.00) |
0.185 (0.926) |
0.108 (0.833) |
0.0747 (0.728) |
0.147 (0.89) |
1 (1.00) |
0.688 (1.00) |
| xq gain | 18 (13%) | 116 |
0.365 (0.979) |
0.0926 (0.813) |
0.605 (1.00) |
0.383 (0.987) |
0.0979 (0.828) |
0.486 (1.00) |
0.0747 (0.728) |
0.235 (0.958) |
1 (1.00) |
0.688 (1.00) |
| 1q loss | 8 (6%) | 126 |
0.0522 (0.677) |
0.52 (1.00) |
0.902 (1.00) |
0.149 (0.89) |
0.576 (1.00) |
1 (1.00) |
0.335 (0.958) |
0.138 (0.865) |
0.0499 (0.677) |
1 (1.00) |
| 2p loss | 5 (4%) | 129 |
0.74 (1.00) |
0.747 (1.00) |
0.262 (0.958) |
0.265 (0.958) |
1 (1.00) |
1 (1.00) |
0.61 (1.00) |
1 (1.00) |
0.407 (0.987) |
|
| 2q loss | 6 (4%) | 128 |
0.689 (1.00) |
0.996 (1.00) |
0.0995 (0.828) |
0.547 (1.00) |
0.119 (0.833) |
1 (1.00) |
0.591 (1.00) |
0.655 (1.00) |
1 (1.00) |
0.467 (1.00) |
| 3p loss | 30 (22%) | 104 |
0.832 (1.00) |
0.0502 (0.677) |
0.388 (0.987) |
0.588 (1.00) |
0.712 (1.00) |
0.578 (1.00) |
1 (1.00) |
0.453 (1.00) |
0.165 (0.915) |
0.725 (1.00) |
| 3q loss | 22 (16%) | 112 |
0.336 (0.958) |
0.137 (0.865) |
0.572 (1.00) |
0.554 (1.00) |
0.268 (0.958) |
1 (1.00) |
1 (1.00) |
0.254 (0.958) |
0.273 (0.958) |
1 (1.00) |
| 4p loss | 84 (63%) | 50 |
0.205 (0.953) |
0.186 (0.926) |
0.337 (0.958) |
0.147 (0.89) |
0.334 (0.958) |
1 (1.00) |
1 (1.00) |
0.326 (0.958) |
0.876 (1.00) |
0.757 (1.00) |
| 4q loss | 99 (74%) | 35 |
0.306 (0.958) |
0.193 (0.926) |
0.34 (0.958) |
0.0507 (0.677) |
0.0259 (0.624) |
1 (1.00) |
0.572 (1.00) |
0.411 (0.987) |
0.115 (0.833) |
0.73 (1.00) |
| 5p loss | 93 (69%) | 41 |
0.966 (1.00) |
0.75 (1.00) |
0.394 (0.987) |
0.0154 (0.539) |
1 (1.00) |
0.583 (1.00) |
0.179 (0.926) |
0.322 (0.958) |
0.647 (1.00) |
0.752 (1.00) |
| 5q loss | 91 (68%) | 43 |
0.981 (1.00) |
0.744 (1.00) |
0.0449 (0.677) |
0.00701 (0.288) |
0.334 (0.958) |
0.596 (1.00) |
0.0328 (0.628) |
0.239 (0.958) |
0.566 (1.00) |
1 (1.00) |
| 6p loss | 11 (8%) | 123 |
0.61 (1.00) |
0.0421 (0.677) |
0.871 (1.00) |
0.856 (1.00) |
0.322 (0.958) |
1 (1.00) |
1 (1.00) |
0.316 (0.958) |
0.604 (1.00) |
1 (1.00) |
| 6q loss | 14 (10%) | 120 |
0.411 (0.987) |
0.0825 (0.773) |
0.402 (0.987) |
0.691 (1.00) |
1 (1.00) |
0.325 (0.958) |
0.692 (1.00) |
0.823 (1.00) |
0.669 (1.00) |
1 (1.00) |
| 8p loss | 10 (7%) | 124 |
0.455 (1.00) |
0.632 (1.00) |
0.0555 (0.677) |
0.573 (1.00) |
0.119 (0.833) |
0.0169 (0.545) |
0.355 (0.979) |
0.108 (0.833) |
0.527 (1.00) |
1 (1.00) |
| 8q loss | 4 (3%) | 130 |
0.512 (1.00) |
0.844 (1.00) |
0.0653 (0.723) |
0.0746 (0.728) |
0.0664 (0.723) |
1 (1.00) |
0.216 (0.958) |
1 (1.00) |
||
| 9p loss | 56 (42%) | 78 |
0.791 (1.00) |
0.406 (0.987) |
0.304 (0.958) |
0.59 (1.00) |
1 (1.00) |
0.308 (0.958) |
0.132 (0.863) |
0.896 (1.00) |
0.524 (1.00) |
0.557 (1.00) |
| 9q loss | 50 (37%) | 84 |
0.693 (1.00) |
0.65 (1.00) |
0.491 (1.00) |
0.906 (1.00) |
1 (1.00) |
0.633 (1.00) |
0.612 (1.00) |
0.708 (1.00) |
0.768 (1.00) |
0.37 (0.986) |
| 11p loss | 89 (66%) | 45 |
0.567 (1.00) |
0.169 (0.917) |
0.955 (1.00) |
0.508 (1.00) |
0.189 (0.926) |
1 (1.00) |
0.114 (0.833) |
0.864 (1.00) |
1 (1.00) |
0.753 (1.00) |
| 11q loss | 105 (78%) | 29 |
0.18 (0.926) |
0.587 (1.00) |
0.764 (1.00) |
0.511 (1.00) |
0.0523 (0.677) |
1 (1.00) |
0.0718 (0.728) |
0.107 (0.833) |
0.133 (0.863) |
0.701 (1.00) |
| 13q loss | 104 (78%) | 30 |
0.324 (0.958) |
0.31 (0.958) |
0.879 (1.00) |
0.134 (0.863) |
0.26 (0.958) |
1 (1.00) |
0.24 (0.958) |
0.946 (1.00) |
0.379 (0.987) |
1 (1.00) |
| 15q loss | 22 (16%) | 112 |
0.694 (1.00) |
0.214 (0.958) |
0.111 (0.833) |
0.722 (1.00) |
0.455 (1.00) |
0.119 (0.833) |
0.0422 (0.677) |
0.711 (1.00) |
0.346 (0.97) |
0.688 (1.00) |
| 16p loss | 43 (32%) | 91 |
0.469 (1.00) |
0.981 (1.00) |
0.635 (1.00) |
0.5 (1.00) |
0.721 (1.00) |
0.305 (0.958) |
0.423 (0.99) |
0.429 (0.99) |
0.865 (1.00) |
1 (1.00) |
| 16q loss | 46 (34%) | 88 |
0.229 (0.958) |
0.894 (1.00) |
0.683 (1.00) |
0.26 (0.958) |
1 (1.00) |
0.297 (0.958) |
0.794 (1.00) |
0.553 (1.00) |
0.671 (1.00) |
1 (1.00) |
| 17p loss | 35 (26%) | 99 |
0.969 (1.00) |
0.166 (0.915) |
0.846 (1.00) |
0.742 (1.00) |
0.693 (1.00) |
0.571 (1.00) |
0.0824 (0.773) |
0.548 (1.00) |
0.246 (0.958) |
0.296 (0.958) |
| 17q loss | 15 (11%) | 119 |
0.55 (1.00) |
0.288 (0.958) |
0.58 (1.00) |
0.546 (1.00) |
0.605 (1.00) |
1 (1.00) |
0.0244 (0.624) |
0.858 (1.00) |
0.722 (1.00) |
1 (1.00) |
| 18p loss | 104 (78%) | 30 |
0.364 (0.979) |
0.272 (0.958) |
0.859 (1.00) |
0.237 (0.958) |
0.26 (0.958) |
1 (1.00) |
0.771 (1.00) |
0.551 (1.00) |
0.474 (1.00) |
0.732 (1.00) |
| 18q loss | 110 (82%) | 24 |
0.401 (0.987) |
0.159 (0.907) |
0.622 (1.00) |
0.0927 (0.813) |
0.432 (0.994) |
0.564 (1.00) |
1 (1.00) |
0.392 (0.987) |
0.642 (1.00) |
1 (1.00) |
| 19p loss | 40 (30%) | 94 |
0.566 (1.00) |
0.0124 (0.458) |
0.00575 (0.284) |
0.174 (0.925) |
0.0549 (0.677) |
0.583 (1.00) |
0.00696 (0.288) |
0.561 (1.00) |
1 (1.00) |
1 (1.00) |
| 20p loss | 28 (21%) | 106 |
0.863 (1.00) |
0.671 (1.00) |
0.247 (0.958) |
0.544 (1.00) |
0.135 (0.863) |
0.207 (0.953) |
0.245 (0.958) |
0.72 (1.00) |
0.58 (1.00) |
0.725 (1.00) |
| 20q loss | 15 (11%) | 119 |
0.78 (1.00) |
0.228 (0.958) |
0.436 (0.995) |
0.243 (0.958) |
0.605 (1.00) |
0.421 (0.99) |
1 (1.00) |
0.488 (1.00) |
1 (1.00) |
0.64 (1.00) |
| xp loss | 23 (17%) | 111 |
0.329 (0.958) |
0.732 (1.00) |
0.211 (0.958) |
0.621 (1.00) |
0.185 (0.926) |
1 (1.00) |
1 (1.00) |
0.272 (0.958) |
0.809 (1.00) |
0.429 (0.99) |
| xq loss | 23 (17%) | 111 |
0.329 (0.958) |
0.922 (1.00) |
0.298 (0.958) |
0.405 (0.987) |
0.18 (0.926) |
0.526 (1.00) |
1 (1.00) |
0.391 (0.987) |
0.806 (1.00) |
0.429 (0.99) |
P value = 0.00281 (Fisher's exact test), Q value = 0.16
Table S1. Gene #13: '7q gain' versus Clinical Feature #10: 'ETHNICITY'
| nPatients | HISPANIC OR LATINO | NOT HISPANIC OR LATINO |
|---|---|---|
| ALL | 12 | 111 |
| 7Q GAIN MUTATED | 4 | 86 |
| 7Q GAIN WILD-TYPE | 8 | 25 |
Figure S1. Get High-res Image Gene #13: '7q gain' versus Clinical Feature #10: 'ETHNICITY'
P value = 0.000592 (Wilcoxon-test), Q value = 0.082
Table S2. Gene #18: '10p gain' versus Clinical Feature #2: 'YEARS_TO_BIRTH'
| nPatients | Mean (Std.Dev) | |
|---|---|---|
| ALL | 134 | 32.0 (9.3) |
| 10P GAIN MUTATED | 6 | 48.3 (10.7) |
| 10P GAIN WILD-TYPE | 128 | 31.2 (8.5) |
Figure S2. Get High-res Image Gene #18: '10p gain' versus Clinical Feature #2: 'YEARS_TO_BIRTH'
P value = 0.00021 (Wilcoxon-test), Q value = 0.078
Table S3. Gene #25: '15q gain' versus Clinical Feature #2: 'YEARS_TO_BIRTH'
| nPatients | Mean (Std.Dev) | |
|---|---|---|
| ALL | 134 | 32.0 (9.3) |
| 15Q GAIN MUTATED | 48 | 35.9 (10.1) |
| 15Q GAIN WILD-TYPE | 86 | 29.8 (8.1) |
Figure S3. Get High-res Image Gene #25: '15q gain' versus Clinical Feature #2: 'YEARS_TO_BIRTH'
P value = 0.000665 (Wilcoxon-test), Q value = 0.082
Table S4. Gene #31: '19p gain' versus Clinical Feature #2: 'YEARS_TO_BIRTH'
| nPatients | Mean (Std.Dev) | |
|---|---|---|
| ALL | 134 | 32.0 (9.3) |
| 19P GAIN MUTATED | 33 | 35.9 (8.3) |
| 19P GAIN WILD-TYPE | 101 | 30.7 (9.3) |
Figure S4. Get High-res Image Gene #31: '19p gain' versus Clinical Feature #2: 'YEARS_TO_BIRTH'
P value = 0.00104 (Wilcoxon-test), Q value = 0.097
Table S5. Gene #32: '19q gain' versus Clinical Feature #2: 'YEARS_TO_BIRTH'
| nPatients | Mean (Std.Dev) | |
|---|---|---|
| ALL | 134 | 32.0 (9.3) |
| 19Q GAIN MUTATED | 27 | 36.3 (8.3) |
| 19Q GAIN WILD-TYPE | 107 | 30.9 (9.3) |
Figure S5. Get High-res Image Gene #32: '19q gain' versus Clinical Feature #2: 'YEARS_TO_BIRTH'
P value = 0.00118 (Fisher's exact test), Q value = 0.097
Table S6. Gene #36: '22q gain' versus Clinical Feature #7: 'RADIATION_THERAPY'
| nPatients | NO | YES |
|---|---|---|
| ALL | 110 | 19 |
| 22Q GAIN MUTATED | 22 | 11 |
| 22Q GAIN WILD-TYPE | 88 | 8 |
Figure S6. Get High-res Image Gene #36: '22q gain' versus Clinical Feature #7: 'RADIATION_THERAPY'
P value = 0.0037 (logrank test), Q value = 0.2
Table S7. Gene #39: '1p loss' versus Clinical Feature #1: 'Time to Death'
| nPatients | nDeath | Duration Range (Median), Month | |
|---|---|---|---|
| ALL | 134 | 4 | 0.1 - 244.5 (41.5) |
| 1P LOSS MUTATED | 17 | 2 | 0.6 - 199.2 (34.2) |
| 1P LOSS WILD-TYPE | 117 | 2 | 0.1 - 244.5 (41.7) |
Figure S7. Get High-res Image Gene #39: '1p loss' versus Clinical Feature #1: 'Time to Death'
P value = 0.00109 (Wilcoxon-test), Q value = 0.097
Table S8. Gene #55: '10p loss' versus Clinical Feature #2: 'YEARS_TO_BIRTH'
| nPatients | Mean (Std.Dev) | |
|---|---|---|
| ALL | 134 | 32.0 (9.3) |
| 10P LOSS MUTATED | 68 | 29.6 (8.6) |
| 10P LOSS WILD-TYPE | 66 | 34.4 (9.4) |
Figure S8. Get High-res Image Gene #55: '10p loss' versus Clinical Feature #2: 'YEARS_TO_BIRTH'
P value = 0.00254 (Wilcoxon-test), Q value = 0.16
Table S9. Gene #56: '10q loss' versus Clinical Feature #2: 'YEARS_TO_BIRTH'
| nPatients | Mean (Std.Dev) | |
|---|---|---|
| ALL | 134 | 32.0 (9.3) |
| 10Q LOSS MUTATED | 63 | 29.6 (8.8) |
| 10Q LOSS WILD-TYPE | 71 | 34.1 (9.3) |
Figure S9. Get High-res Image Gene #56: '10q loss' versus Clinical Feature #2: 'YEARS_TO_BIRTH'
P value = 0.000628 (Wilcoxon-test), Q value = 0.082
Table S10. Gene #60: '14q loss' versus Clinical Feature #2: 'YEARS_TO_BIRTH'
| nPatients | Mean (Std.Dev) | |
|---|---|---|
| ALL | 134 | 32.0 (9.3) |
| 14Q LOSS MUTATED | 17 | 25.4 (5.7) |
| 14Q LOSS WILD-TYPE | 117 | 32.9 (9.4) |
Figure S10. Get High-res Image Gene #60: '14q loss' versus Clinical Feature #2: 'YEARS_TO_BIRTH'
P value = 0.00175 (Wilcoxon-test), Q value = 0.12
Table S11. Gene #69: '19q loss' versus Clinical Feature #2: 'YEARS_TO_BIRTH'
| nPatients | Mean (Std.Dev) | |
|---|---|---|
| ALL | 134 | 32.0 (9.3) |
| 19Q LOSS MUTATED | 42 | 29.0 (10.1) |
| 19Q LOSS WILD-TYPE | 92 | 33.4 (8.6) |
Figure S11. Get High-res Image Gene #69: '19q loss' versus Clinical Feature #2: 'YEARS_TO_BIRTH'
P value = 0.00018 (Fisher's exact test), Q value = 0.078
Table S12. Gene #69: '19q loss' versus Clinical Feature #3: 'PATHOLOGIC_STAGE'
| nPatients | STAGE I | STAGE IA | STAGE IB | STAGE II | STAGE IIA | STAGE IIB | STAGE IIC | STAGE III | STAGE IIIA | STAGE IIIB | STAGE IIIC | STAGE IS |
|---|---|---|---|---|---|---|---|---|---|---|---|---|
| ALL | 19 | 26 | 11 | 5 | 6 | 1 | 1 | 2 | 1 | 6 | 5 | 46 |
| 19Q LOSS MUTATED | 3 | 2 | 3 | 5 | 4 | 0 | 0 | 1 | 0 | 4 | 3 | 16 |
| 19Q LOSS WILD-TYPE | 16 | 24 | 8 | 0 | 2 | 1 | 1 | 1 | 1 | 2 | 2 | 30 |
Figure S12. Get High-res Image Gene #69: '19q loss' versus Clinical Feature #3: 'PATHOLOGIC_STAGE'
P value = 0.000356 (Fisher's exact test), Q value = 0.082
Table S13. Gene #69: '19q loss' versus Clinical Feature #7: 'RADIATION_THERAPY'
| nPatients | NO | YES |
|---|---|---|
| ALL | 110 | 19 |
| 19Q LOSS MUTATED | 42 | 0 |
| 19Q LOSS WILD-TYPE | 68 | 19 |
Figure S13. Get High-res Image Gene #69: '19q loss' versus Clinical Feature #7: 'RADIATION_THERAPY'
P value = 0.00165 (Fisher's exact test), Q value = 0.12
Table S14. Gene #72: '22q loss' versus Clinical Feature #7: 'RADIATION_THERAPY'
| nPatients | NO | YES |
|---|---|---|
| ALL | 110 | 19 |
| 22Q LOSS MUTATED | 36 | 0 |
| 22Q LOSS WILD-TYPE | 74 | 19 |
Figure S14. Get High-res Image Gene #72: '22q loss' versus Clinical Feature #7: 'RADIATION_THERAPY'
-
Copy number data file = broad_values_by_arm.txt from GISTIC pipeline
-
Processed Copy number data file = /xchip/cga/gdac-prod/tcga-gdac/jobResults/GDAC_Correlate_Genomic_Events_Preprocess/TGCT-TP/19781848/transformed.cor.cli.txt
-
Clinical data file = /xchip/cga/gdac-prod/tcga-gdac/jobResults/Append_Data/TGCT-TP/19775566/TGCT-TP.merged_data.txt
-
Number of patients = 134
-
Number of significantly arm-level cnvs = 74
-
Number of selected clinical features = 10
-
Exclude regions that fewer than K tumors have mutations, K = 3
For survival clinical features, the Kaplan-Meier survival curves of tumors with and without gene mutations were plotted and the statistical significance P values were estimated by logrank test (Bland and Altman 2004) using the 'survdiff' function in R
For binary or multi-class clinical features (nominal or ordinal), two-tailed Fisher's exact tests (Fisher 1922) were used to estimate the P values using the 'fisher.test' function in R
For multiple hypothesis correction, Q value is the False Discovery Rate (FDR) analogue of the P value (Benjamini and Hochberg 1995), defined as the minimum FDR at which the test may be called significant. We used the 'Benjamini and Hochberg' method of 'p.adjust' function in R to convert P values into Q values.
In addition to the links below, the full results of the analysis summarized in this report can also be downloaded programmatically using firehose_get, or interactively from either the Broad GDAC website or TCGA Data Coordination Center Portal.