This pipeline computes the correlation between significantly recurrent gene mutations and selected clinical features.
Testing the association between mutation status of 11 genes and 17 clinical features across 401 patients, 13 significant findings detected with Q value < 0.25.
-
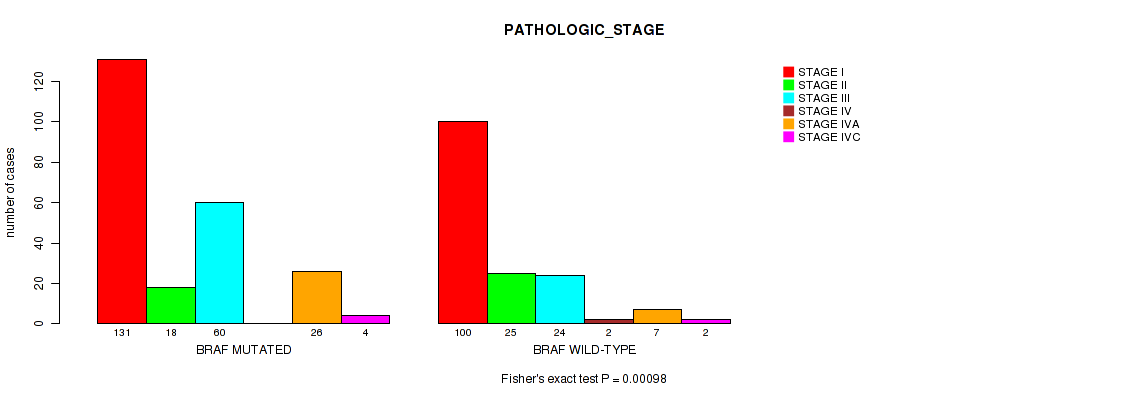
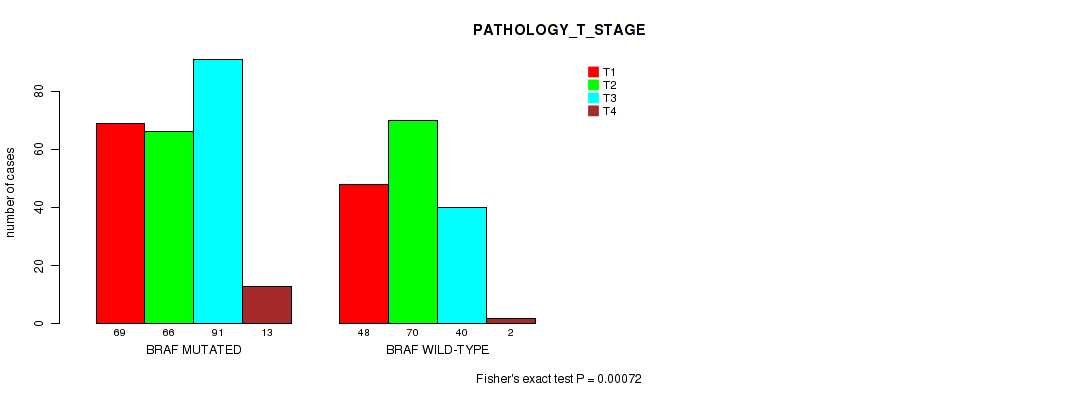
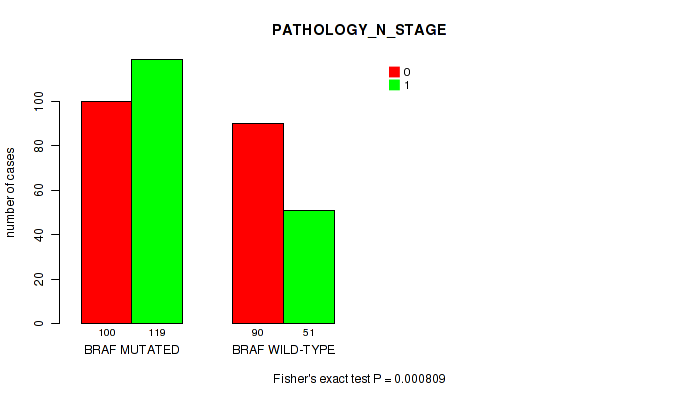
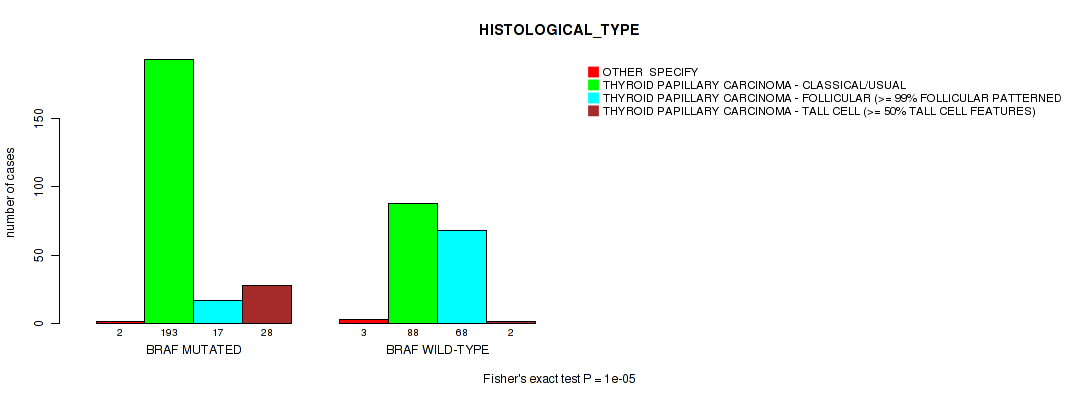
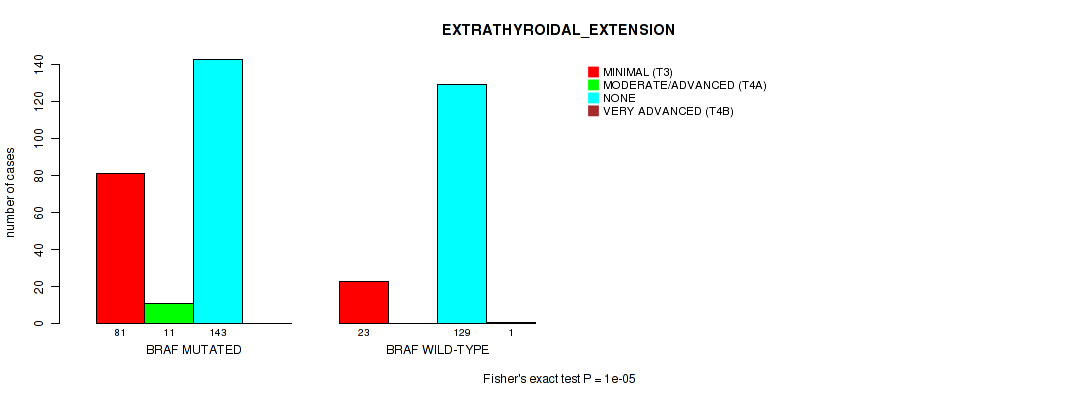
BRAF mutation correlated to 'PATHOLOGIC_STAGE', 'PATHOLOGY_T_STAGE', 'PATHOLOGY_N_STAGE', 'HISTOLOGICAL_TYPE', and 'EXTRATHYROIDAL_EXTENSION'.
-
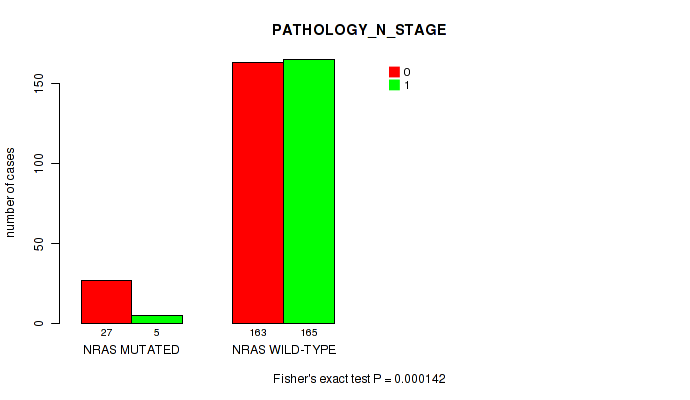
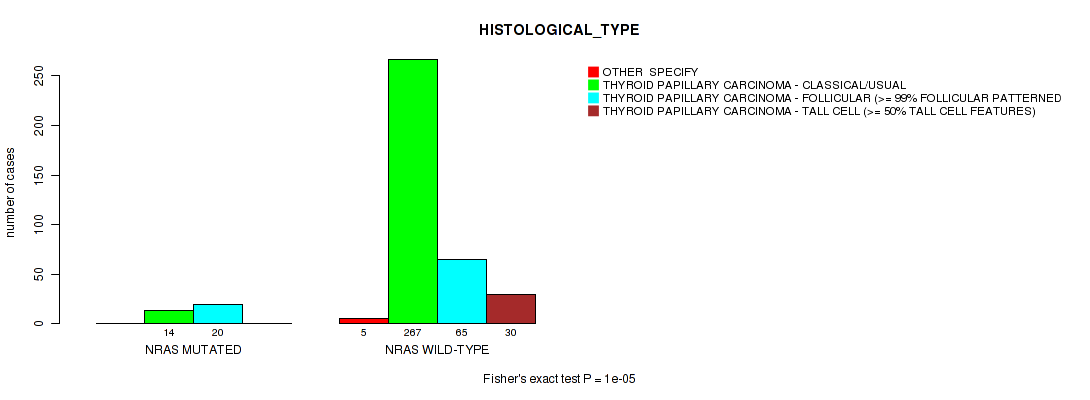
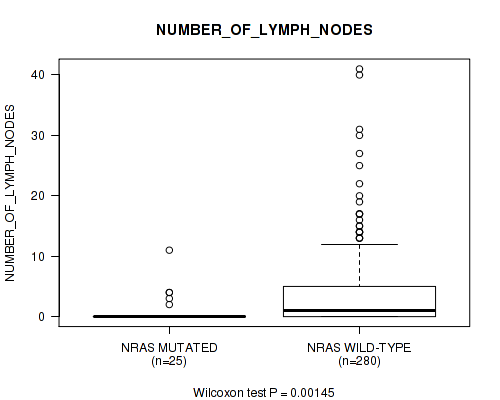
NRAS mutation correlated to 'PATHOLOGY_N_STAGE', 'HISTOLOGICAL_TYPE', and 'NUMBER_OF_LYMPH_NODES'.
-
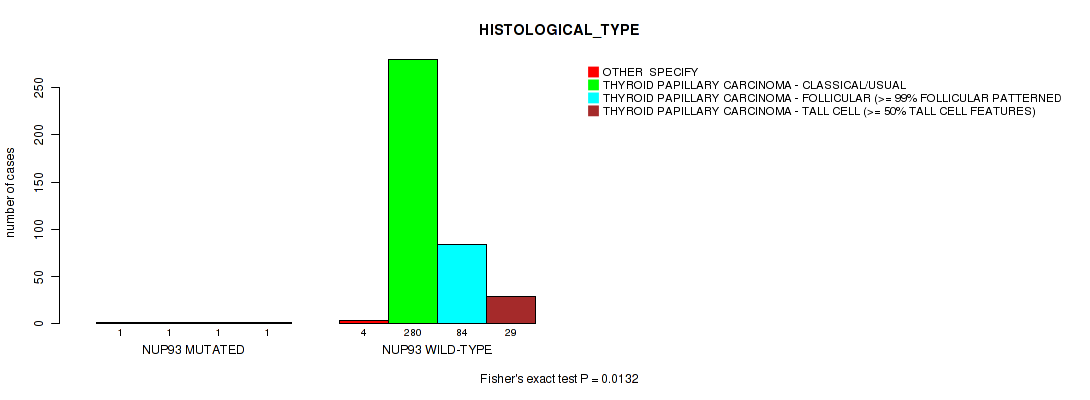
NUP93 mutation correlated to 'HISTOLOGICAL_TYPE'.
-
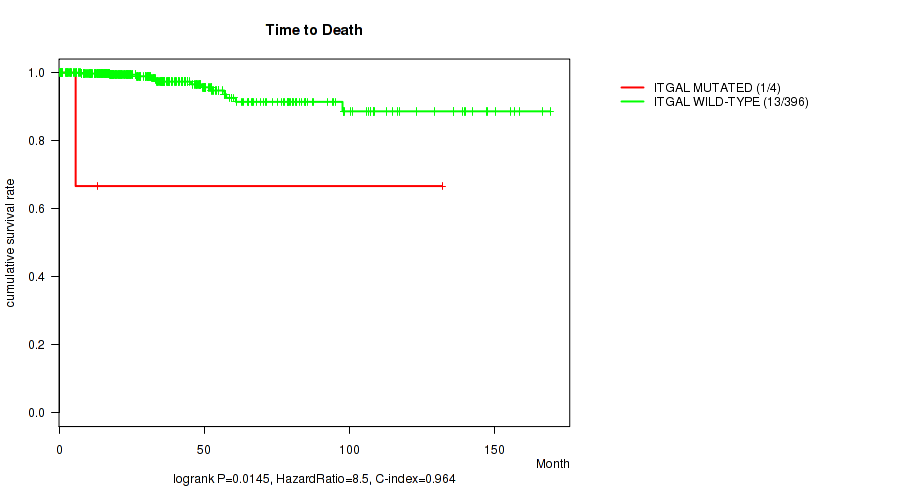
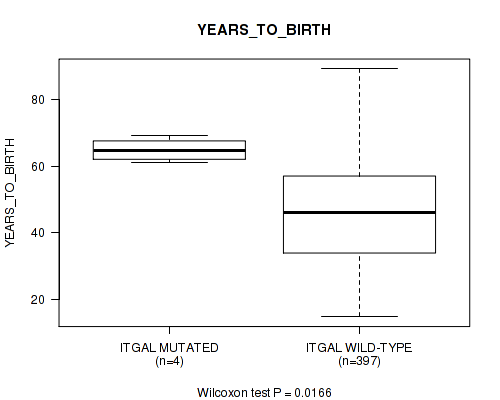
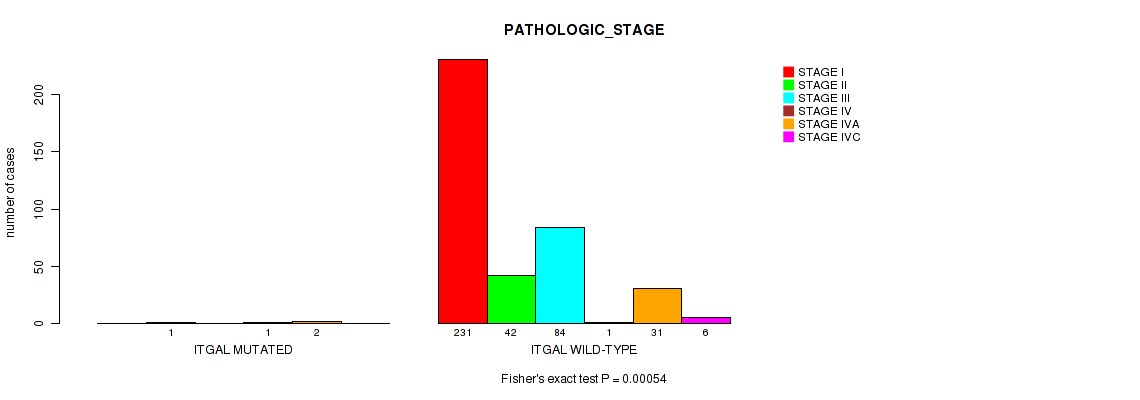
ITGAL mutation correlated to 'Time to Death', 'YEARS_TO_BIRTH', 'PATHOLOGIC_STAGE', and 'EXTRATHYROIDAL_EXTENSION'.
Table 1. Get Full Table Overview of the association between mutation status of 11 genes and 17 clinical features. Shown in the table are P values (Q values). Thresholded by Q value < 0.25, 13 significant findings detected.
|
Clinical Features |
Time to Death |
YEARS TO BIRTH |
PATHOLOGIC STAGE |
PATHOLOGY T STAGE |
PATHOLOGY N STAGE |
PATHOLOGY M STAGE |
GENDER |
RADIATION THERAPY |
HISTOLOGICAL TYPE |
RADIATION EXPOSURE |
EXTRATHYROIDAL EXTENSION |
RESIDUAL TUMOR |
NUMBER OF LYMPH NODES |
MULTIFOCALITY |
TUMOR SIZE |
RACE | ETHNICITY | ||
| nMutated (%) | nWild-Type | logrank test | Wilcoxon-test | Fisher's exact test | Fisher's exact test | Fisher's exact test | Fisher's exact test | Fisher's exact test | Fisher's exact test | Fisher's exact test | Fisher's exact test | Fisher's exact test | Fisher's exact test | Wilcoxon-test | Fisher's exact test | Wilcoxon-test | Fisher's exact test | Fisher's exact test | |
| BRAF | 240 (60%) | 161 |
0.72 (1.00) |
0.314 (1.00) |
0.00098 (0.0229) |
0.00072 (0.0216) |
0.000809 (0.0216) |
1 (1.00) |
0.244 (1.00) |
1 (1.00) |
1e-05 (0.000623) |
0.595 (1.00) |
1e-05 (0.000623) |
0.354 (1.00) |
0.0356 (0.391) |
0.918 (1.00) |
0.209 (0.997) |
0.892 (1.00) |
0.438 (1.00) |
| ITGAL | 4 (1%) | 397 |
0.0145 (0.225) |
0.0166 (0.238) |
0.00054 (0.0202) |
0.143 (0.89) |
0.347 (1.00) |
1 (1.00) |
0.0538 (0.507) |
0.268 (1.00) |
0.709 (1.00) |
1 (1.00) |
0.00135 (0.0272) |
0.0981 (0.705) |
0.627 (1.00) |
0.438 (1.00) |
1 (1.00) |
0.263 (1.00) |
|
| NRAS | 34 (8%) | 367 |
0.428 (1.00) |
0.538 (1.00) |
0.0319 (0.382) |
0.13 (0.841) |
0.000142 (0.00666) |
0.441 (1.00) |
1 (1.00) |
0.463 (1.00) |
1e-05 (0.000623) |
1 (1.00) |
0.187 (0.995) |
0.688 (1.00) |
0.00145 (0.0272) |
0.372 (1.00) |
0.546 (1.00) |
0.0963 (0.705) |
0.057 (0.507) |
| NUP93 | 4 (1%) | 397 |
0.834 (1.00) |
0.517 (1.00) |
0.632 (1.00) |
0.733 (1.00) |
0.347 (1.00) |
1 (1.00) |
1 (1.00) |
0.643 (1.00) |
0.0132 (0.225) |
1 (1.00) |
1 (1.00) |
0.516 (1.00) |
0.412 (1.00) |
0.339 (1.00) |
0.989 (1.00) |
0.194 (0.995) |
1 (1.00) |
| HRAS | 14 (3%) | 387 |
0.56 (1.00) |
0.332 (1.00) |
0.349 (1.00) |
0.783 (1.00) |
0.389 (1.00) |
0.248 (1.00) |
0.761 (1.00) |
0.0817 (0.671) |
0.0249 (0.333) |
1 (1.00) |
0.689 (1.00) |
0.197 (0.995) |
0.681 (1.00) |
1 (1.00) |
0.703 (1.00) |
0.103 (0.715) |
0.614 (1.00) |
| EIF1AX | 6 (1%) | 395 |
0.0327 (0.382) |
0.0566 (0.507) |
0.918 (1.00) |
1 (1.00) |
0.625 (1.00) |
1 (1.00) |
0.179 (0.984) |
0.242 (1.00) |
0.0921 (0.705) |
1 (1.00) |
1 (1.00) |
0.281 (1.00) |
0.77 (1.00) |
0.666 (1.00) |
0.461 (1.00) |
1 (1.00) |
|
| PPM1D | 5 (1%) | 396 |
0.783 (1.00) |
0.158 (0.923) |
0.213 (0.997) |
0.286 (1.00) |
1 (1.00) |
1 (1.00) |
0.606 (1.00) |
1 (1.00) |
1 (1.00) |
1 (1.00) |
0.11 (0.738) |
0.356 (1.00) |
1 (1.00) |
0.511 (1.00) |
1 (1.00) |
1 (1.00) |
|
| KRAS | 4 (1%) | 397 |
0.874 (1.00) |
0.461 (1.00) |
1 (1.00) |
0.207 (0.997) |
0.625 (1.00) |
1 (1.00) |
0.576 (1.00) |
1 (1.00) |
0.47 (1.00) |
1 (1.00) |
1 (1.00) |
0.416 (1.00) |
0.277 (1.00) |
1 (1.00) |
0.757 (1.00) |
1 (1.00) |
|
| DLC1 | 4 (1%) | 397 |
0.0414 (0.43) |
0.785 (1.00) |
0.724 (1.00) |
1 (1.00) |
0.604 (1.00) |
1 (1.00) |
1 (1.00) |
1 (1.00) |
1 (1.00) |
1 (1.00) |
0.389 (1.00) |
0.515 (1.00) |
0.627 (1.00) |
0.567 (1.00) |
1 (1.00) |
0.263 (1.00) |
|
| TG | 11 (3%) | 390 |
0.254 (1.00) |
0.156 (0.923) |
0.422 (1.00) |
0.0825 (0.671) |
1 (1.00) |
1 (1.00) |
1 (1.00) |
0.371 (1.00) |
0.397 (1.00) |
1 (1.00) |
0.485 (1.00) |
1 (1.00) |
0.684 (1.00) |
1 (1.00) |
0.845 (1.00) |
0.415 (1.00) |
1 (1.00) |
| NLRP6 | 3 (1%) | 398 |
0.662 (1.00) |
0.434 (1.00) |
0.789 (1.00) |
0.169 (0.958) |
0.604 (1.00) |
1 (1.00) |
0.268 (1.00) |
0.659 (1.00) |
1 (1.00) |
1 (1.00) |
1 (1.00) |
0.359 (1.00) |
0.597 (1.00) |
1 (1.00) |
P value = 0.00098 (Fisher's exact test), Q value = 0.023
Table S1. Gene #1: 'BRAF MUTATION STATUS' versus Clinical Feature #3: 'PATHOLOGIC_STAGE'
| nPatients | STAGE I | STAGE II | STAGE III | STAGE IV | STAGE IVA | STAGE IVC |
|---|---|---|---|---|---|---|
| ALL | 231 | 43 | 84 | 2 | 33 | 6 |
| BRAF MUTATED | 131 | 18 | 60 | 0 | 26 | 4 |
| BRAF WILD-TYPE | 100 | 25 | 24 | 2 | 7 | 2 |
Figure S1. Get High-res Image Gene #1: 'BRAF MUTATION STATUS' versus Clinical Feature #3: 'PATHOLOGIC_STAGE'
P value = 0.00072 (Fisher's exact test), Q value = 0.022
Table S2. Gene #1: 'BRAF MUTATION STATUS' versus Clinical Feature #4: 'PATHOLOGY_T_STAGE'
| nPatients | T1 | T2 | T3 | T4 |
|---|---|---|---|---|
| ALL | 117 | 136 | 131 | 15 |
| BRAF MUTATED | 69 | 66 | 91 | 13 |
| BRAF WILD-TYPE | 48 | 70 | 40 | 2 |
Figure S2. Get High-res Image Gene #1: 'BRAF MUTATION STATUS' versus Clinical Feature #4: 'PATHOLOGY_T_STAGE'
P value = 0.000809 (Fisher's exact test), Q value = 0.022
Table S3. Gene #1: 'BRAF MUTATION STATUS' versus Clinical Feature #5: 'PATHOLOGY_N_STAGE'
| nPatients | 0 | 1 |
|---|---|---|
| ALL | 190 | 170 |
| BRAF MUTATED | 100 | 119 |
| BRAF WILD-TYPE | 90 | 51 |
Figure S3. Get High-res Image Gene #1: 'BRAF MUTATION STATUS' versus Clinical Feature #5: 'PATHOLOGY_N_STAGE'
P value = 1e-05 (Fisher's exact test), Q value = 0.00062
Table S4. Gene #1: 'BRAF MUTATION STATUS' versus Clinical Feature #9: 'HISTOLOGICAL_TYPE'
| nPatients | OTHER SPECIFY | THYROID PAPILLARY CARCINOMA - CLASSICAL/USUAL | THYROID PAPILLARY CARCINOMA - FOLLICULAR (>= 99% FOLLICULAR PATTERNED) | THYROID PAPILLARY CARCINOMA - TALL CELL (>= 50% TALL CELL FEATURES) |
|---|---|---|---|---|
| ALL | 5 | 281 | 85 | 30 |
| BRAF MUTATED | 2 | 193 | 17 | 28 |
| BRAF WILD-TYPE | 3 | 88 | 68 | 2 |
Figure S4. Get High-res Image Gene #1: 'BRAF MUTATION STATUS' versus Clinical Feature #9: 'HISTOLOGICAL_TYPE'
P value = 1e-05 (Fisher's exact test), Q value = 0.00062
Table S5. Gene #1: 'BRAF MUTATION STATUS' versus Clinical Feature #11: 'EXTRATHYROIDAL_EXTENSION'
| nPatients | MINIMAL (T3) | MODERATE/ADVANCED (T4A) | NONE | VERY ADVANCED (T4B) |
|---|---|---|---|---|
| ALL | 104 | 11 | 272 | 1 |
| BRAF MUTATED | 81 | 11 | 143 | 0 |
| BRAF WILD-TYPE | 23 | 0 | 129 | 1 |
Figure S5. Get High-res Image Gene #1: 'BRAF MUTATION STATUS' versus Clinical Feature #11: 'EXTRATHYROIDAL_EXTENSION'
P value = 0.000142 (Fisher's exact test), Q value = 0.0067
Table S6. Gene #2: 'NRAS MUTATION STATUS' versus Clinical Feature #5: 'PATHOLOGY_N_STAGE'
| nPatients | 0 | 1 |
|---|---|---|
| ALL | 190 | 170 |
| NRAS MUTATED | 27 | 5 |
| NRAS WILD-TYPE | 163 | 165 |
Figure S6. Get High-res Image Gene #2: 'NRAS MUTATION STATUS' versus Clinical Feature #5: 'PATHOLOGY_N_STAGE'
P value = 1e-05 (Fisher's exact test), Q value = 0.00062
Table S7. Gene #2: 'NRAS MUTATION STATUS' versus Clinical Feature #9: 'HISTOLOGICAL_TYPE'
| nPatients | OTHER SPECIFY | THYROID PAPILLARY CARCINOMA - CLASSICAL/USUAL | THYROID PAPILLARY CARCINOMA - FOLLICULAR (>= 99% FOLLICULAR PATTERNED) | THYROID PAPILLARY CARCINOMA - TALL CELL (>= 50% TALL CELL FEATURES) |
|---|---|---|---|---|
| ALL | 5 | 281 | 85 | 30 |
| NRAS MUTATED | 0 | 14 | 20 | 0 |
| NRAS WILD-TYPE | 5 | 267 | 65 | 30 |
Figure S7. Get High-res Image Gene #2: 'NRAS MUTATION STATUS' versus Clinical Feature #9: 'HISTOLOGICAL_TYPE'
P value = 0.00145 (Wilcoxon-test), Q value = 0.027
Table S8. Gene #2: 'NRAS MUTATION STATUS' versus Clinical Feature #13: 'NUMBER_OF_LYMPH_NODES'
| nPatients | Mean (Std.Dev) | |
|---|---|---|
| ALL | 305 | 3.4 (6.0) |
| NRAS MUTATED | 25 | 1.0 (2.4) |
| NRAS WILD-TYPE | 280 | 3.6 (6.2) |
Figure S8. Get High-res Image Gene #2: 'NRAS MUTATION STATUS' versus Clinical Feature #13: 'NUMBER_OF_LYMPH_NODES'
P value = 0.0132 (Fisher's exact test), Q value = 0.23
Table S9. Gene #5: 'NUP93 MUTATION STATUS' versus Clinical Feature #9: 'HISTOLOGICAL_TYPE'
| nPatients | OTHER SPECIFY | THYROID PAPILLARY CARCINOMA - CLASSICAL/USUAL | THYROID PAPILLARY CARCINOMA - FOLLICULAR (>= 99% FOLLICULAR PATTERNED) | THYROID PAPILLARY CARCINOMA - TALL CELL (>= 50% TALL CELL FEATURES) |
|---|---|---|---|---|
| ALL | 5 | 281 | 85 | 30 |
| NUP93 MUTATED | 1 | 1 | 1 | 1 |
| NUP93 WILD-TYPE | 4 | 280 | 84 | 29 |
Figure S9. Get High-res Image Gene #5: 'NUP93 MUTATION STATUS' versus Clinical Feature #9: 'HISTOLOGICAL_TYPE'
P value = 0.0145 (logrank test), Q value = 0.23
Table S10. Gene #9: 'ITGAL MUTATION STATUS' versus Clinical Feature #1: 'Time to Death'
| nPatients | nDeath | Duration Range (Median), Month | |
|---|---|---|---|
| ALL | 400 | 14 | 0.2 - 169.3 (31.0) |
| ITGAL MUTATED | 4 | 1 | 4.0 - 132.1 (9.6) |
| ITGAL WILD-TYPE | 396 | 13 | 0.2 - 169.3 (31.0) |
Figure S10. Get High-res Image Gene #9: 'ITGAL MUTATION STATUS' versus Clinical Feature #1: 'Time to Death'
P value = 0.0166 (Wilcoxon-test), Q value = 0.24
Table S11. Gene #9: 'ITGAL MUTATION STATUS' versus Clinical Feature #2: 'YEARS_TO_BIRTH'
| nPatients | Mean (Std.Dev) | |
|---|---|---|
| ALL | 401 | 47.1 (15.7) |
| ITGAL MUTATED | 4 | 64.8 (3.5) |
| ITGAL WILD-TYPE | 397 | 46.9 (15.7) |
Figure S11. Get High-res Image Gene #9: 'ITGAL MUTATION STATUS' versus Clinical Feature #2: 'YEARS_TO_BIRTH'
P value = 0.00054 (Fisher's exact test), Q value = 0.02
Table S12. Gene #9: 'ITGAL MUTATION STATUS' versus Clinical Feature #3: 'PATHOLOGIC_STAGE'
| nPatients | STAGE I | STAGE II | STAGE III | STAGE IV | STAGE IVA | STAGE IVC |
|---|---|---|---|---|---|---|
| ALL | 231 | 43 | 84 | 2 | 33 | 6 |
| ITGAL MUTATED | 0 | 1 | 0 | 1 | 2 | 0 |
| ITGAL WILD-TYPE | 231 | 42 | 84 | 1 | 31 | 6 |
Figure S12. Get High-res Image Gene #9: 'ITGAL MUTATION STATUS' versus Clinical Feature #3: 'PATHOLOGIC_STAGE'
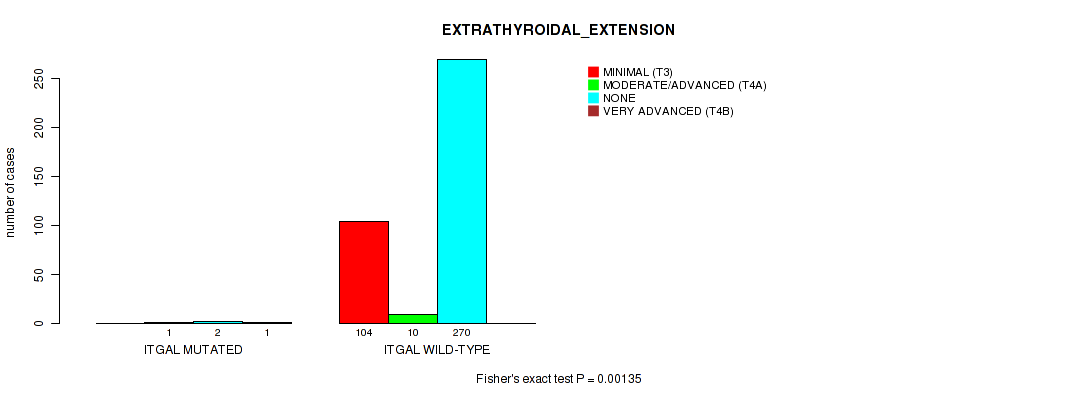
P value = 0.00135 (Fisher's exact test), Q value = 0.027
Table S13. Gene #9: 'ITGAL MUTATION STATUS' versus Clinical Feature #11: 'EXTRATHYROIDAL_EXTENSION'
| nPatients | MINIMAL (T3) | MODERATE/ADVANCED (T4A) | NONE | VERY ADVANCED (T4B) |
|---|---|---|---|---|
| ALL | 104 | 11 | 272 | 1 |
| ITGAL MUTATED | 0 | 1 | 2 | 1 |
| ITGAL WILD-TYPE | 104 | 10 | 270 | 0 |
Figure S13. Get High-res Image Gene #9: 'ITGAL MUTATION STATUS' versus Clinical Feature #11: 'EXTRATHYROIDAL_EXTENSION'
-
Mutation data file = sample_sig_gene_table.txt from Mutsig_2CV pipeline
-
Processed Mutation data file = /xchip/cga/gdac-prod/tcga-gdac/jobResults/GDAC_Correlate_Genomic_Events_Preprocess/THCA-TP/19898941/transformed.cor.cli.txt
-
Clinical data file = /xchip/cga/gdac-prod/tcga-gdac/jobResults/Append_Data/THCA-TP/19775590/THCA-TP.merged_data.txt
-
Number of patients = 401
-
Number of significantly mutated genes = 11
-
Number of selected clinical features = 17
-
Exclude genes that fewer than K tumors have mutations, K = 3
For survival clinical features, the Kaplan-Meier survival curves of tumors with and without gene mutations were plotted and the statistical significance P values were estimated by logrank test (Bland and Altman 2004) using the 'survdiff' function in R
For binary or multi-class clinical features (nominal or ordinal), two-tailed Fisher's exact tests (Fisher 1922) were used to estimate the P values using the 'fisher.test' function in R
For multiple hypothesis correction, Q value is the False Discovery Rate (FDR) analogue of the P value (Benjamini and Hochberg 1995), defined as the minimum FDR at which the test may be called significant. We used the 'Benjamini and Hochberg' method of 'p.adjust' function in R to convert P values into Q values.
In addition to the links below, the full results of the analysis summarized in this report can also be downloaded programmatically using firehose_get, or interactively from either the Broad GDAC website or TCGA Data Coordination Center Portal.