This pipeline computes the correlation between significant copy number variation (cnv focal) genes and selected clinical features.
Testing the association between copy number variation 12 focal events and 8 clinical features across 123 patients, 27 significant findings detected with Q value < 0.25.
-
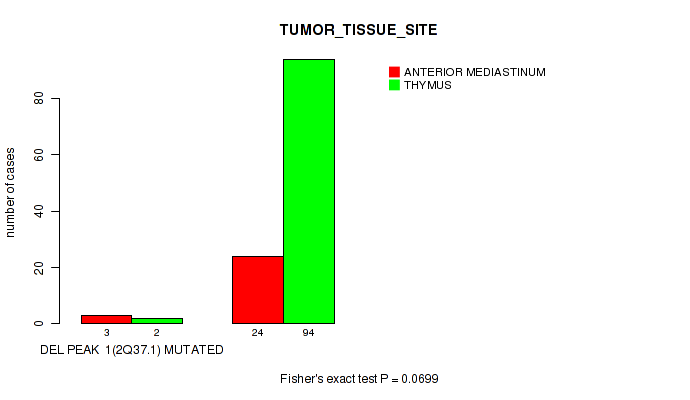
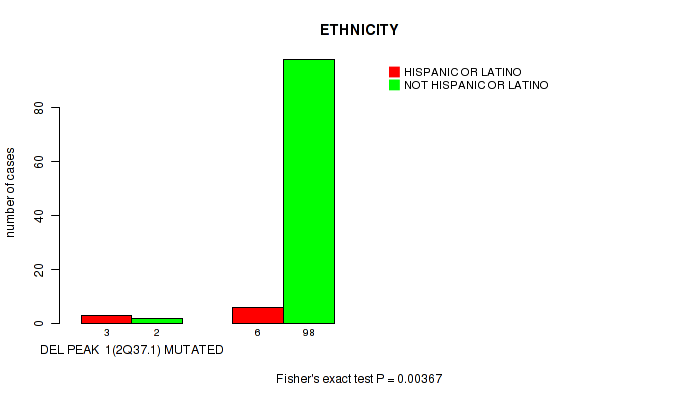
del_2q37.1 cnv correlated to 'TUMOR_TISSUE_SITE' and 'ETHNICITY'.
-
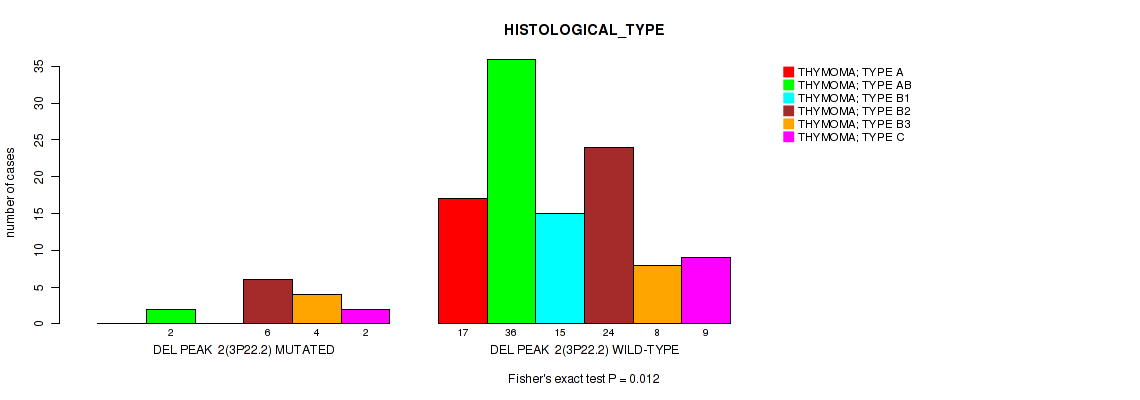
del_3p22.2 cnv correlated to 'HISTOLOGICAL_TYPE' and 'ETHNICITY'.
-
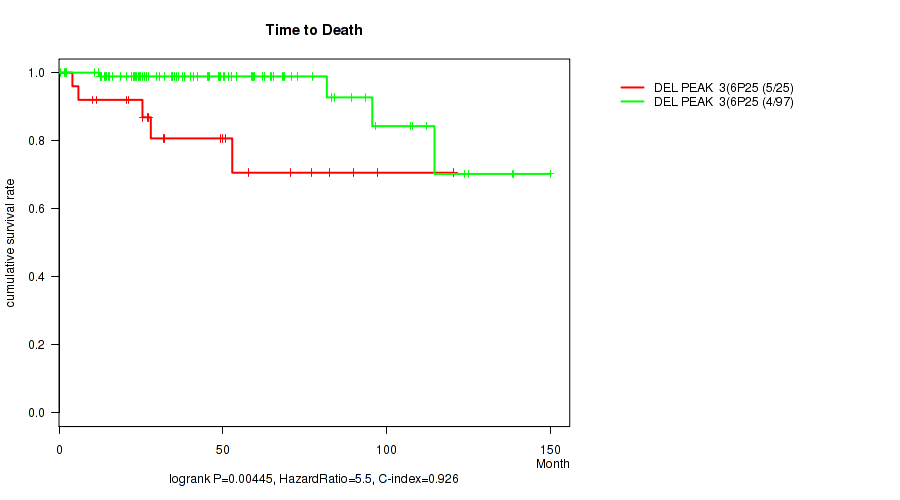
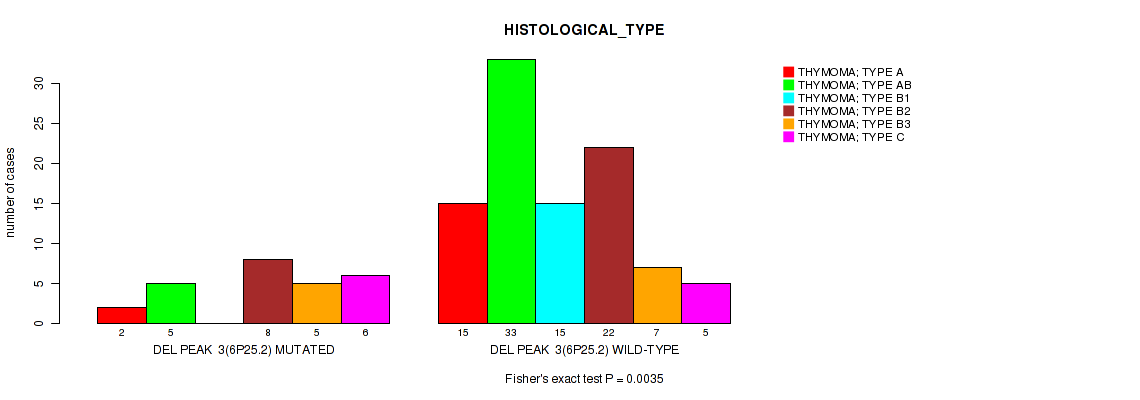
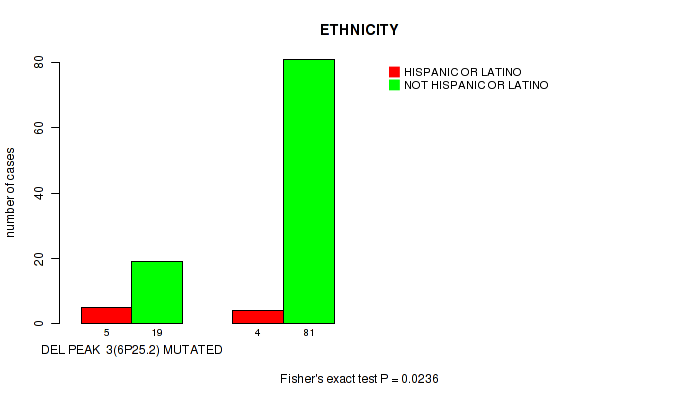
del_6p25.2 cnv correlated to 'Time to Death', 'HISTOLOGICAL_TYPE', and 'ETHNICITY'.
-
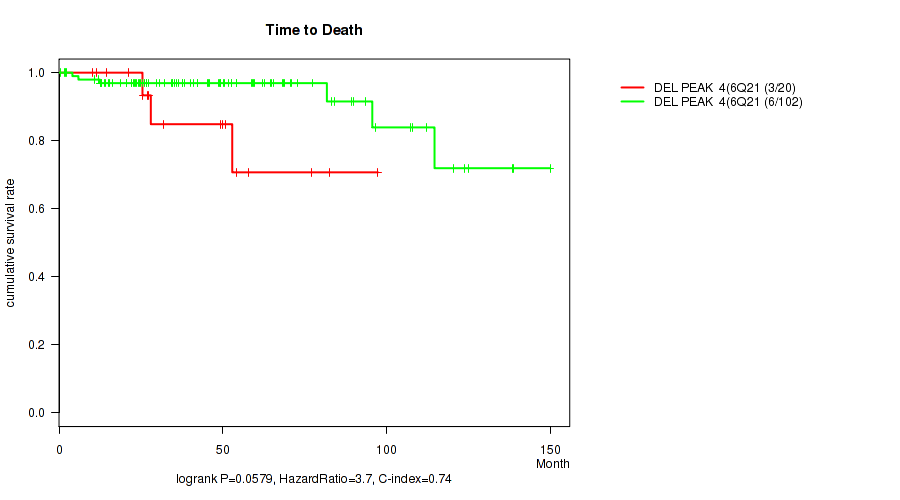
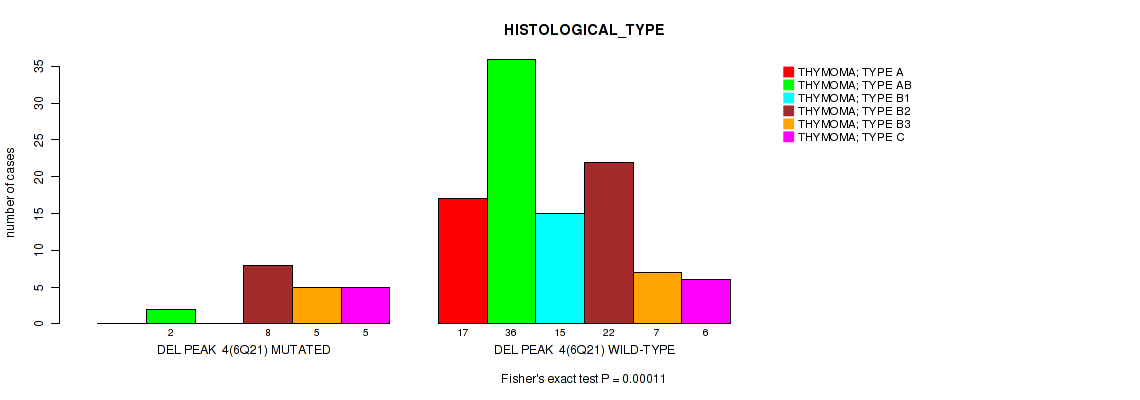
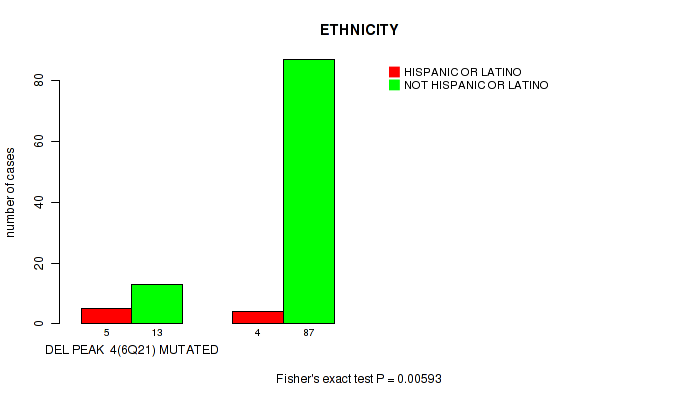
del_6q21 cnv correlated to 'Time to Death', 'HISTOLOGICAL_TYPE', and 'ETHNICITY'.
-
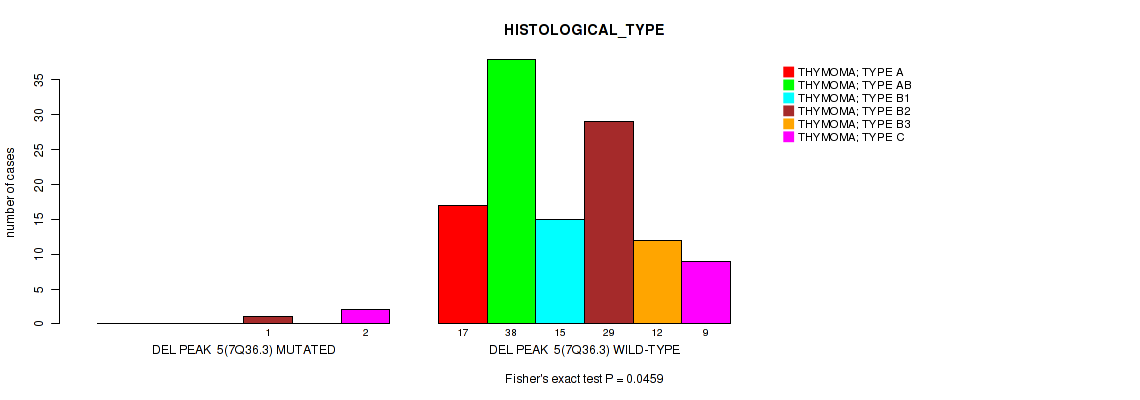
del_7q36.3 cnv correlated to 'HISTOLOGICAL_TYPE'.
-
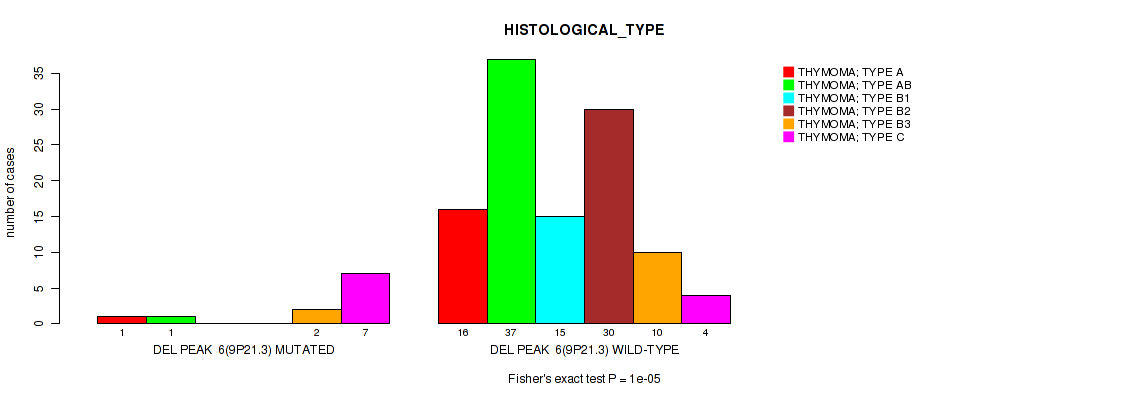
del_9p21.3 cnv correlated to 'HISTOLOGICAL_TYPE'.
-
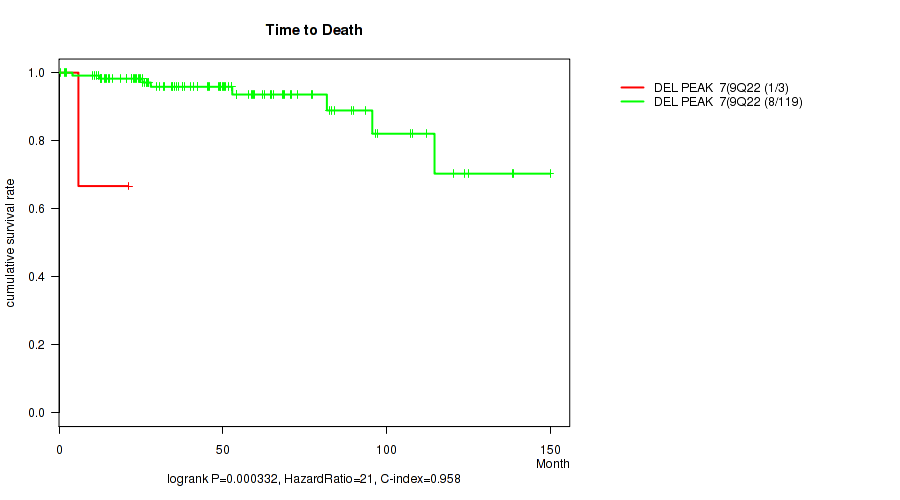
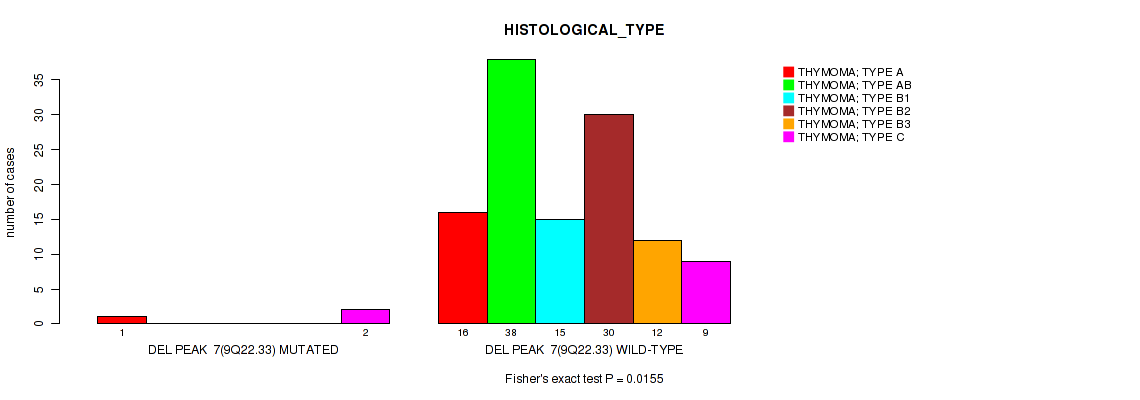
del_9q22.33 cnv correlated to 'Time to Death' and 'HISTOLOGICAL_TYPE'.
-
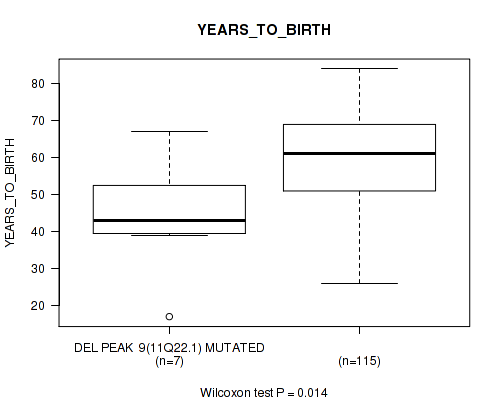
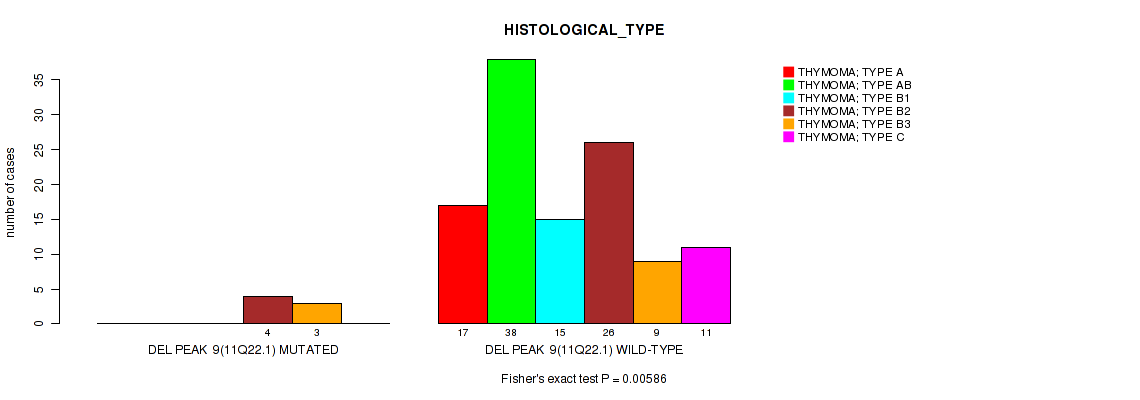
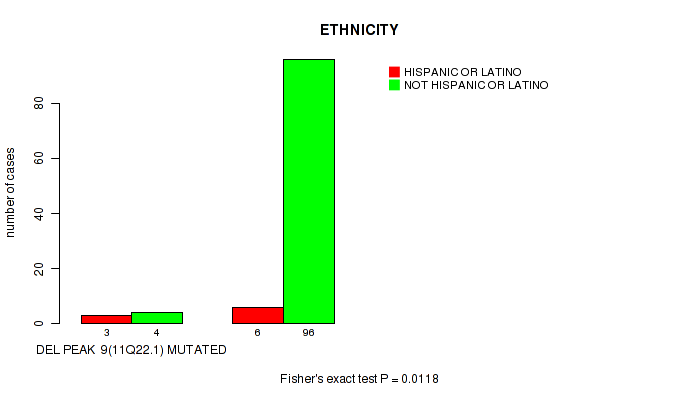
del_11q22.1 cnv correlated to 'YEARS_TO_BIRTH', 'HISTOLOGICAL_TYPE', and 'ETHNICITY'.
-
del_19p13.11 cnv correlated to 'YEARS_TO_BIRTH', 'TUMOR_TISSUE_SITE', 'HISTOLOGICAL_TYPE', and 'ETHNICITY'.
-
del_22q12.1 cnv correlated to 'YEARS_TO_BIRTH', 'HISTOLOGICAL_TYPE', and 'ETHNICITY'.
-
del_22q13.32 cnv correlated to 'YEARS_TO_BIRTH', 'HISTOLOGICAL_TYPE', and 'ETHNICITY'.
Table 1. Get Full Table Overview of the association between significant copy number variation of 12 focal events and 8 clinical features. Shown in the table are P values (Q values). Thresholded by Q value < 0.25, 27 significant findings detected.
|
Clinical Features |
Time to Death |
YEARS TO BIRTH |
TUMOR TISSUE SITE |
GENDER |
RADIATION THERAPY |
HISTOLOGICAL TYPE |
RACE | ETHNICITY | ||
| nCNV (%) | nWild-Type | logrank test | Wilcoxon-test | Fisher's exact test | Fisher's exact test | Fisher's exact test | Fisher's exact test | Fisher's exact test | Fisher's exact test | |
| del 19p13 11 | 5 (4%) | 118 |
0.675 (0.887) |
0.0628 (0.249) |
0.0699 (0.249) |
0.193 (0.515) |
1 (1.00) |
7e-05 (0.00336) |
1 (1.00) |
0.0535 (0.233) |
| del 6p25 2 | 26 (21%) | 97 |
0.00445 (0.061) |
0.718 (0.906) |
1 (1.00) |
1 (1.00) |
0.645 (0.88) |
0.0035 (0.0587) |
0.277 (0.605) |
0.0236 (0.119) |
| del 6q21 | 20 (16%) | 103 |
0.0579 (0.242) |
0.187 (0.514) |
0.379 (0.714) |
0.626 (0.88) |
0.609 (0.88) |
0.00011 (0.00352) |
0.502 (0.803) |
0.00593 (0.0633) |
| del 11q22 1 | 7 (6%) | 116 |
0.439 (0.745) |
0.014 (0.0843) |
0.178 (0.514) |
0.442 (0.745) |
0.229 (0.538) |
0.00586 (0.0633) |
0.705 (0.903) |
0.0118 (0.077) |
| del 22q12 1 | 19 (15%) | 104 |
0.37 (0.71) |
0.0102 (0.077) |
0.128 (0.41) |
0.455 (0.753) |
0.797 (0.968) |
0.0686 (0.249) |
0.87 (1.00) |
0.00777 (0.0745) |
| del 22q13 32 | 15 (12%) | 108 |
0.763 (0.952) |
0.0284 (0.136) |
0.0947 (0.325) |
0.411 (0.745) |
0.144 (0.446) |
0.00925 (0.077) |
1 (1.00) |
0.0199 (0.106) |
| del 2q37 1 | 5 (4%) | 118 |
0.625 (0.88) |
0.333 (0.665) |
0.0699 (0.249) |
1 (1.00) |
0.66 (0.88) |
0.434 (0.745) |
0.304 (0.635) |
0.00367 (0.0587) |
| del 3p22 2 | 14 (11%) | 109 |
0.199 (0.516) |
0.656 (0.88) |
0.187 (0.514) |
1 (1.00) |
0.552 (0.841) |
0.012 (0.077) |
1 (1.00) |
0.0113 (0.077) |
| del 9q22 33 | 3 (2%) | 120 |
0.000332 (0.00796) |
0.329 (0.665) |
0.528 (0.817) |
1 (1.00) |
0.268 (0.599) |
0.0155 (0.0878) |
1 (1.00) |
0.23 (0.538) |
| del 7q36 3 | 3 (2%) | 120 |
0.777 (0.957) |
0.62 (0.88) |
0.528 (0.817) |
0.607 (0.88) |
0.268 (0.599) |
0.0459 (0.21) |
1 (1.00) |
0.23 (0.538) |
| del 9p21 3 | 11 (9%) | 112 |
0.471 (0.766) |
0.122 (0.403) |
0.705 (0.903) |
0.35 (0.686) |
1 (1.00) |
1e-05 (0.00096) |
1 (1.00) |
0.225 (0.538) |
| del 10q26 3 | 6 (5%) | 117 |
0.172 (0.514) |
0.845 (1.00) |
1 (1.00) |
0.425 (0.745) |
1 (1.00) |
0.296 (0.631) |
0.65 (0.88) |
0.411 (0.745) |
P value = 0.0699 (Fisher's exact test), Q value = 0.25
Table S1. Gene #1: 'del_2q37.1' versus Clinical Feature #3: 'TUMOR_TISSUE_SITE'
| nPatients | ANTERIOR MEDIASTINUM | THYMUS |
|---|---|---|
| ALL | 27 | 96 |
| DEL PEAK 1(2Q37.1) MUTATED | 3 | 2 |
| DEL PEAK 1(2Q37.1) WILD-TYPE | 24 | 94 |
Figure S1. Get High-res Image Gene #1: 'del_2q37.1' versus Clinical Feature #3: 'TUMOR_TISSUE_SITE'
P value = 0.00367 (Fisher's exact test), Q value = 0.059
Table S2. Gene #1: 'del_2q37.1' versus Clinical Feature #8: 'ETHNICITY'
| nPatients | HISPANIC OR LATINO | NOT HISPANIC OR LATINO |
|---|---|---|
| ALL | 9 | 100 |
| DEL PEAK 1(2Q37.1) MUTATED | 3 | 2 |
| DEL PEAK 1(2Q37.1) WILD-TYPE | 6 | 98 |
Figure S2. Get High-res Image Gene #1: 'del_2q37.1' versus Clinical Feature #8: 'ETHNICITY'
P value = 0.012 (Fisher's exact test), Q value = 0.077
Table S3. Gene #2: 'del_3p22.2' versus Clinical Feature #6: 'HISTOLOGICAL_TYPE'
| nPatients | THYMOMA; TYPE A | THYMOMA; TYPE AB | THYMOMA; TYPE B1 | THYMOMA; TYPE B2 | THYMOMA; TYPE B3 | THYMOMA; TYPE C |
|---|---|---|---|---|---|---|
| ALL | 17 | 38 | 15 | 30 | 12 | 11 |
| DEL PEAK 2(3P22.2) MUTATED | 0 | 2 | 0 | 6 | 4 | 2 |
| DEL PEAK 2(3P22.2) WILD-TYPE | 17 | 36 | 15 | 24 | 8 | 9 |
Figure S3. Get High-res Image Gene #2: 'del_3p22.2' versus Clinical Feature #6: 'HISTOLOGICAL_TYPE'
P value = 0.0113 (Fisher's exact test), Q value = 0.077
Table S4. Gene #2: 'del_3p22.2' versus Clinical Feature #8: 'ETHNICITY'
| nPatients | HISPANIC OR LATINO | NOT HISPANIC OR LATINO |
|---|---|---|
| ALL | 9 | 100 |
| DEL PEAK 2(3P22.2) MUTATED | 4 | 9 |
| DEL PEAK 2(3P22.2) WILD-TYPE | 5 | 91 |
Figure S4. Get High-res Image Gene #2: 'del_3p22.2' versus Clinical Feature #8: 'ETHNICITY'

P value = 0.00445 (logrank test), Q value = 0.061
Table S5. Gene #3: 'del_6p25.2' versus Clinical Feature #1: 'Time to Death'
| nPatients | nDeath | Duration Range (Median), Month | |
|---|---|---|---|
| ALL | 122 | 9 | 0.5 - 150.0 (40.6) |
| DEL PEAK 3(6P25.2) MUTATED | 25 | 5 | 4.1 - 120.4 (31.9) |
| DEL PEAK 3(6P25.2) WILD-TYPE | 97 | 4 | 0.5 - 150.0 (42.1) |
Figure S5. Get High-res Image Gene #3: 'del_6p25.2' versus Clinical Feature #1: 'Time to Death'
P value = 0.0035 (Fisher's exact test), Q value = 0.059
Table S6. Gene #3: 'del_6p25.2' versus Clinical Feature #6: 'HISTOLOGICAL_TYPE'
| nPatients | THYMOMA; TYPE A | THYMOMA; TYPE AB | THYMOMA; TYPE B1 | THYMOMA; TYPE B2 | THYMOMA; TYPE B3 | THYMOMA; TYPE C |
|---|---|---|---|---|---|---|
| ALL | 17 | 38 | 15 | 30 | 12 | 11 |
| DEL PEAK 3(6P25.2) MUTATED | 2 | 5 | 0 | 8 | 5 | 6 |
| DEL PEAK 3(6P25.2) WILD-TYPE | 15 | 33 | 15 | 22 | 7 | 5 |
Figure S6. Get High-res Image Gene #3: 'del_6p25.2' versus Clinical Feature #6: 'HISTOLOGICAL_TYPE'
P value = 0.0236 (Fisher's exact test), Q value = 0.12
Table S7. Gene #3: 'del_6p25.2' versus Clinical Feature #8: 'ETHNICITY'
| nPatients | HISPANIC OR LATINO | NOT HISPANIC OR LATINO |
|---|---|---|
| ALL | 9 | 100 |
| DEL PEAK 3(6P25.2) MUTATED | 5 | 19 |
| DEL PEAK 3(6P25.2) WILD-TYPE | 4 | 81 |
Figure S7. Get High-res Image Gene #3: 'del_6p25.2' versus Clinical Feature #8: 'ETHNICITY'
P value = 0.0579 (logrank test), Q value = 0.24
Table S8. Gene #4: 'del_6q21' versus Clinical Feature #1: 'Time to Death'
| nPatients | nDeath | Duration Range (Median), Month | |
|---|---|---|---|
| ALL | 122 | 9 | 0.5 - 150.0 (40.6) |
| DEL PEAK 4(6Q21) MUTATED | 20 | 3 | 10.4 - 97.4 (30.0) |
| DEL PEAK 4(6Q21) WILD-TYPE | 102 | 6 | 0.5 - 150.0 (41.7) |
Figure S8. Get High-res Image Gene #4: 'del_6q21' versus Clinical Feature #1: 'Time to Death'
P value = 0.00011 (Fisher's exact test), Q value = 0.0035
Table S9. Gene #4: 'del_6q21' versus Clinical Feature #6: 'HISTOLOGICAL_TYPE'
| nPatients | THYMOMA; TYPE A | THYMOMA; TYPE AB | THYMOMA; TYPE B1 | THYMOMA; TYPE B2 | THYMOMA; TYPE B3 | THYMOMA; TYPE C |
|---|---|---|---|---|---|---|
| ALL | 17 | 38 | 15 | 30 | 12 | 11 |
| DEL PEAK 4(6Q21) MUTATED | 0 | 2 | 0 | 8 | 5 | 5 |
| DEL PEAK 4(6Q21) WILD-TYPE | 17 | 36 | 15 | 22 | 7 | 6 |
Figure S9. Get High-res Image Gene #4: 'del_6q21' versus Clinical Feature #6: 'HISTOLOGICAL_TYPE'
P value = 0.00593 (Fisher's exact test), Q value = 0.063
Table S10. Gene #4: 'del_6q21' versus Clinical Feature #8: 'ETHNICITY'
| nPatients | HISPANIC OR LATINO | NOT HISPANIC OR LATINO |
|---|---|---|
| ALL | 9 | 100 |
| DEL PEAK 4(6Q21) MUTATED | 5 | 13 |
| DEL PEAK 4(6Q21) WILD-TYPE | 4 | 87 |
Figure S10. Get High-res Image Gene #4: 'del_6q21' versus Clinical Feature #8: 'ETHNICITY'
P value = 0.0459 (Fisher's exact test), Q value = 0.21
Table S11. Gene #5: 'del_7q36.3' versus Clinical Feature #6: 'HISTOLOGICAL_TYPE'
| nPatients | THYMOMA; TYPE A | THYMOMA; TYPE AB | THYMOMA; TYPE B1 | THYMOMA; TYPE B2 | THYMOMA; TYPE B3 | THYMOMA; TYPE C |
|---|---|---|---|---|---|---|
| ALL | 17 | 38 | 15 | 30 | 12 | 11 |
| DEL PEAK 5(7Q36.3) MUTATED | 0 | 0 | 0 | 1 | 0 | 2 |
| DEL PEAK 5(7Q36.3) WILD-TYPE | 17 | 38 | 15 | 29 | 12 | 9 |
Figure S11. Get High-res Image Gene #5: 'del_7q36.3' versus Clinical Feature #6: 'HISTOLOGICAL_TYPE'
P value = 1e-05 (Fisher's exact test), Q value = 0.00096
Table S12. Gene #6: 'del_9p21.3' versus Clinical Feature #6: 'HISTOLOGICAL_TYPE'
| nPatients | THYMOMA; TYPE A | THYMOMA; TYPE AB | THYMOMA; TYPE B1 | THYMOMA; TYPE B2 | THYMOMA; TYPE B3 | THYMOMA; TYPE C |
|---|---|---|---|---|---|---|
| ALL | 17 | 38 | 15 | 30 | 12 | 11 |
| DEL PEAK 6(9P21.3) MUTATED | 1 | 1 | 0 | 0 | 2 | 7 |
| DEL PEAK 6(9P21.3) WILD-TYPE | 16 | 37 | 15 | 30 | 10 | 4 |
Figure S12. Get High-res Image Gene #6: 'del_9p21.3' versus Clinical Feature #6: 'HISTOLOGICAL_TYPE'
P value = 0.000332 (logrank test), Q value = 0.008
Table S13. Gene #7: 'del_9q22.33' versus Clinical Feature #1: 'Time to Death'
| nPatients | nDeath | Duration Range (Median), Month | |
|---|---|---|---|
| ALL | 122 | 9 | 0.5 - 150.0 (40.6) |
| DEL PEAK 7(9Q22.33) MUTATED | 3 | 1 | 5.9 - 21.1 (21.1) |
| DEL PEAK 7(9Q22.33) WILD-TYPE | 119 | 8 | 0.5 - 150.0 (42.1) |
Figure S13. Get High-res Image Gene #7: 'del_9q22.33' versus Clinical Feature #1: 'Time to Death'
P value = 0.0155 (Fisher's exact test), Q value = 0.088
Table S14. Gene #7: 'del_9q22.33' versus Clinical Feature #6: 'HISTOLOGICAL_TYPE'
| nPatients | THYMOMA; TYPE A | THYMOMA; TYPE AB | THYMOMA; TYPE B1 | THYMOMA; TYPE B2 | THYMOMA; TYPE B3 | THYMOMA; TYPE C |
|---|---|---|---|---|---|---|
| ALL | 17 | 38 | 15 | 30 | 12 | 11 |
| DEL PEAK 7(9Q22.33) MUTATED | 1 | 0 | 0 | 0 | 0 | 2 |
| DEL PEAK 7(9Q22.33) WILD-TYPE | 16 | 38 | 15 | 30 | 12 | 9 |
Figure S14. Get High-res Image Gene #7: 'del_9q22.33' versus Clinical Feature #6: 'HISTOLOGICAL_TYPE'
P value = 0.014 (Wilcoxon-test), Q value = 0.084
Table S15. Gene #9: 'del_11q22.1' versus Clinical Feature #2: 'YEARS_TO_BIRTH'
| nPatients | Mean (Std.Dev) | |
|---|---|---|
| ALL | 122 | 58.3 (13.0) |
| DEL PEAK 9(11Q22.1) MUTATED | 7 | 44.4 (16.5) |
| DEL PEAK 9(11Q22.1) WILD-TYPE | 115 | 59.1 (12.4) |
Figure S15. Get High-res Image Gene #9: 'del_11q22.1' versus Clinical Feature #2: 'YEARS_TO_BIRTH'
P value = 0.00586 (Fisher's exact test), Q value = 0.063
Table S16. Gene #9: 'del_11q22.1' versus Clinical Feature #6: 'HISTOLOGICAL_TYPE'
| nPatients | THYMOMA; TYPE A | THYMOMA; TYPE AB | THYMOMA; TYPE B1 | THYMOMA; TYPE B2 | THYMOMA; TYPE B3 | THYMOMA; TYPE C |
|---|---|---|---|---|---|---|
| ALL | 17 | 38 | 15 | 30 | 12 | 11 |
| DEL PEAK 9(11Q22.1) MUTATED | 0 | 0 | 0 | 4 | 3 | 0 |
| DEL PEAK 9(11Q22.1) WILD-TYPE | 17 | 38 | 15 | 26 | 9 | 11 |
Figure S16. Get High-res Image Gene #9: 'del_11q22.1' versus Clinical Feature #6: 'HISTOLOGICAL_TYPE'
P value = 0.0118 (Fisher's exact test), Q value = 0.077
Table S17. Gene #9: 'del_11q22.1' versus Clinical Feature #8: 'ETHNICITY'
| nPatients | HISPANIC OR LATINO | NOT HISPANIC OR LATINO |
|---|---|---|
| ALL | 9 | 100 |
| DEL PEAK 9(11Q22.1) MUTATED | 3 | 4 |
| DEL PEAK 9(11Q22.1) WILD-TYPE | 6 | 96 |
Figure S17. Get High-res Image Gene #9: 'del_11q22.1' versus Clinical Feature #8: 'ETHNICITY'
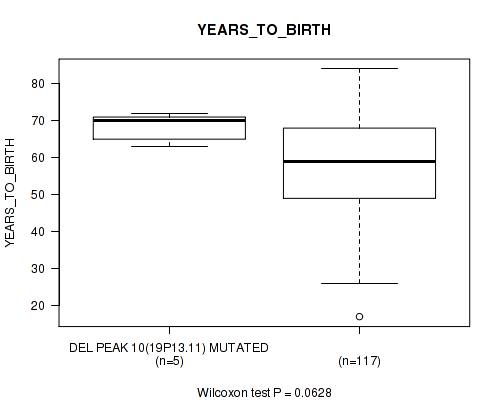
P value = 0.0628 (Wilcoxon-test), Q value = 0.25
Table S18. Gene #10: 'del_19p13.11' versus Clinical Feature #2: 'YEARS_TO_BIRTH'
| nPatients | Mean (Std.Dev) | |
|---|---|---|
| ALL | 122 | 58.3 (13.0) |
| DEL PEAK 10(19P13.11) MUTATED | 5 | 68.2 (4.0) |
| DEL PEAK 10(19P13.11) WILD-TYPE | 117 | 57.8 (13.1) |
Figure S18. Get High-res Image Gene #10: 'del_19p13.11' versus Clinical Feature #2: 'YEARS_TO_BIRTH'
P value = 0.0699 (Fisher's exact test), Q value = 0.25
Table S19. Gene #10: 'del_19p13.11' versus Clinical Feature #3: 'TUMOR_TISSUE_SITE'
| nPatients | ANTERIOR MEDIASTINUM | THYMUS |
|---|---|---|
| ALL | 27 | 96 |
| DEL PEAK 10(19P13.11) MUTATED | 3 | 2 |
| DEL PEAK 10(19P13.11) WILD-TYPE | 24 | 94 |
Figure S19. Get High-res Image Gene #10: 'del_19p13.11' versus Clinical Feature #3: 'TUMOR_TISSUE_SITE'

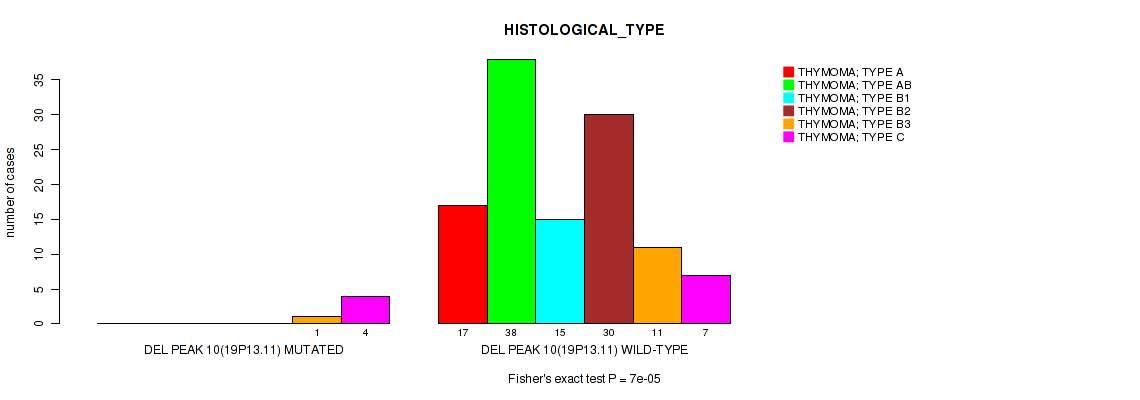
P value = 7e-05 (Fisher's exact test), Q value = 0.0034
Table S20. Gene #10: 'del_19p13.11' versus Clinical Feature #6: 'HISTOLOGICAL_TYPE'
| nPatients | THYMOMA; TYPE A | THYMOMA; TYPE AB | THYMOMA; TYPE B1 | THYMOMA; TYPE B2 | THYMOMA; TYPE B3 | THYMOMA; TYPE C |
|---|---|---|---|---|---|---|
| ALL | 17 | 38 | 15 | 30 | 12 | 11 |
| DEL PEAK 10(19P13.11) MUTATED | 0 | 0 | 0 | 0 | 1 | 4 |
| DEL PEAK 10(19P13.11) WILD-TYPE | 17 | 38 | 15 | 30 | 11 | 7 |
Figure S20. Get High-res Image Gene #10: 'del_19p13.11' versus Clinical Feature #6: 'HISTOLOGICAL_TYPE'
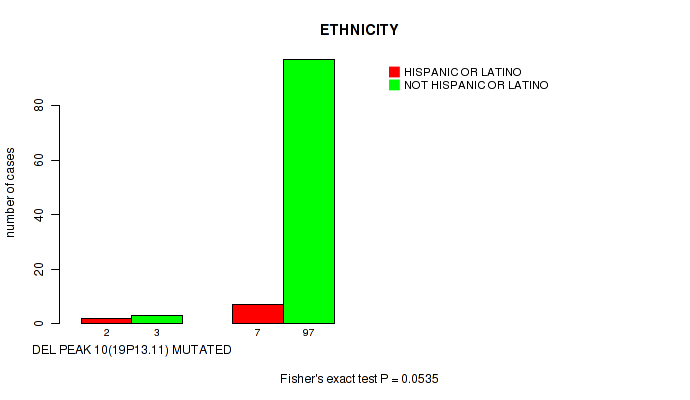
P value = 0.0535 (Fisher's exact test), Q value = 0.23
Table S21. Gene #10: 'del_19p13.11' versus Clinical Feature #8: 'ETHNICITY'
| nPatients | HISPANIC OR LATINO | NOT HISPANIC OR LATINO |
|---|---|---|
| ALL | 9 | 100 |
| DEL PEAK 10(19P13.11) MUTATED | 2 | 3 |
| DEL PEAK 10(19P13.11) WILD-TYPE | 7 | 97 |
Figure S21. Get High-res Image Gene #10: 'del_19p13.11' versus Clinical Feature #8: 'ETHNICITY'
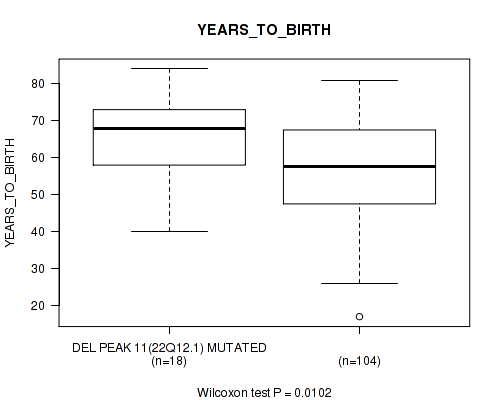
P value = 0.0102 (Wilcoxon-test), Q value = 0.077
Table S22. Gene #11: 'del_22q12.1' versus Clinical Feature #2: 'YEARS_TO_BIRTH'
| nPatients | Mean (Std.Dev) | |
|---|---|---|
| ALL | 122 | 58.3 (13.0) |
| DEL PEAK 11(22Q12.1) MUTATED | 18 | 65.3 (11.3) |
| DEL PEAK 11(22Q12.1) WILD-TYPE | 104 | 57.0 (12.9) |
Figure S22. Get High-res Image Gene #11: 'del_22q12.1' versus Clinical Feature #2: 'YEARS_TO_BIRTH'
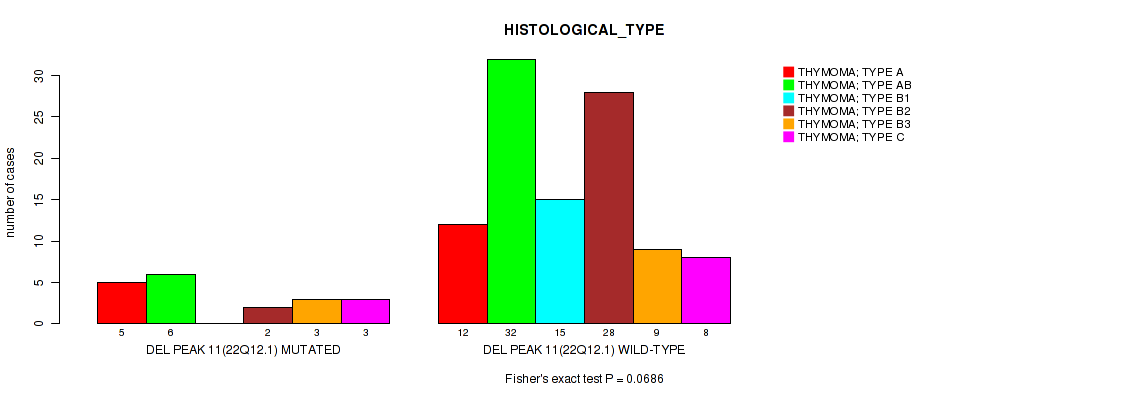
P value = 0.0686 (Fisher's exact test), Q value = 0.25
Table S23. Gene #11: 'del_22q12.1' versus Clinical Feature #6: 'HISTOLOGICAL_TYPE'
| nPatients | THYMOMA; TYPE A | THYMOMA; TYPE AB | THYMOMA; TYPE B1 | THYMOMA; TYPE B2 | THYMOMA; TYPE B3 | THYMOMA; TYPE C |
|---|---|---|---|---|---|---|
| ALL | 17 | 38 | 15 | 30 | 12 | 11 |
| DEL PEAK 11(22Q12.1) MUTATED | 5 | 6 | 0 | 2 | 3 | 3 |
| DEL PEAK 11(22Q12.1) WILD-TYPE | 12 | 32 | 15 | 28 | 9 | 8 |
Figure S23. Get High-res Image Gene #11: 'del_22q12.1' versus Clinical Feature #6: 'HISTOLOGICAL_TYPE'
P value = 0.00777 (Fisher's exact test), Q value = 0.075
Table S24. Gene #11: 'del_22q12.1' versus Clinical Feature #8: 'ETHNICITY'
| nPatients | HISPANIC OR LATINO | NOT HISPANIC OR LATINO |
|---|---|---|
| ALL | 9 | 100 |
| DEL PEAK 11(22Q12.1) MUTATED | 5 | 14 |
| DEL PEAK 11(22Q12.1) WILD-TYPE | 4 | 86 |
Figure S24. Get High-res Image Gene #11: 'del_22q12.1' versus Clinical Feature #8: 'ETHNICITY'

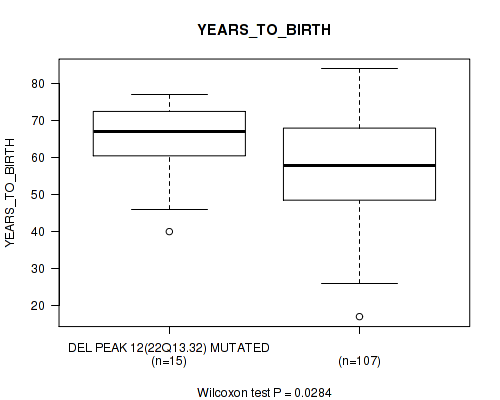
P value = 0.0284 (Wilcoxon-test), Q value = 0.14
Table S25. Gene #12: 'del_22q13.32' versus Clinical Feature #2: 'YEARS_TO_BIRTH'
| nPatients | Mean (Std.Dev) | |
|---|---|---|
| ALL | 122 | 58.3 (13.0) |
| DEL PEAK 12(22Q13.32) MUTATED | 15 | 64.7 (11.2) |
| DEL PEAK 12(22Q13.32) WILD-TYPE | 107 | 57.4 (13.0) |
Figure S25. Get High-res Image Gene #12: 'del_22q13.32' versus Clinical Feature #2: 'YEARS_TO_BIRTH'
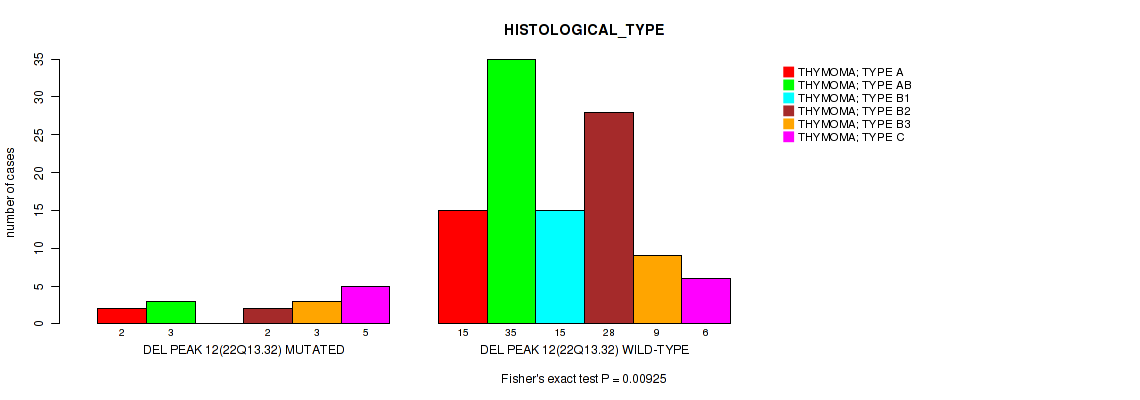
P value = 0.00925 (Fisher's exact test), Q value = 0.077
Table S26. Gene #12: 'del_22q13.32' versus Clinical Feature #6: 'HISTOLOGICAL_TYPE'
| nPatients | THYMOMA; TYPE A | THYMOMA; TYPE AB | THYMOMA; TYPE B1 | THYMOMA; TYPE B2 | THYMOMA; TYPE B3 | THYMOMA; TYPE C |
|---|---|---|---|---|---|---|
| ALL | 17 | 38 | 15 | 30 | 12 | 11 |
| DEL PEAK 12(22Q13.32) MUTATED | 2 | 3 | 0 | 2 | 3 | 5 |
| DEL PEAK 12(22Q13.32) WILD-TYPE | 15 | 35 | 15 | 28 | 9 | 6 |
Figure S26. Get High-res Image Gene #12: 'del_22q13.32' versus Clinical Feature #6: 'HISTOLOGICAL_TYPE'
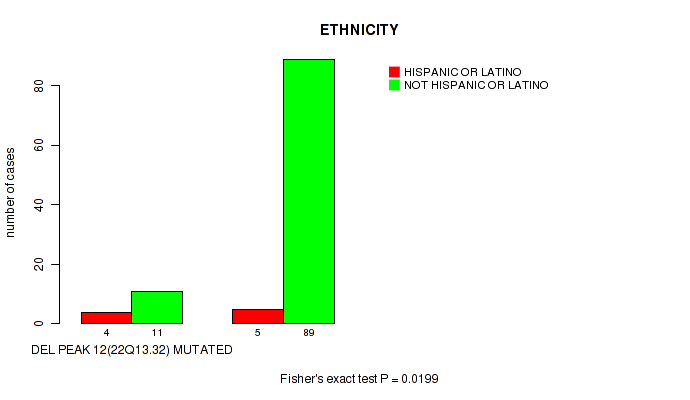
P value = 0.0199 (Fisher's exact test), Q value = 0.11
Table S27. Gene #12: 'del_22q13.32' versus Clinical Feature #8: 'ETHNICITY'
| nPatients | HISPANIC OR LATINO | NOT HISPANIC OR LATINO |
|---|---|---|
| ALL | 9 | 100 |
| DEL PEAK 12(22Q13.32) MUTATED | 4 | 11 |
| DEL PEAK 12(22Q13.32) WILD-TYPE | 5 | 89 |
Figure S27. Get High-res Image Gene #12: 'del_22q13.32' versus Clinical Feature #8: 'ETHNICITY'
-
Copy number data file = all_lesions.txt from GISTIC pipeline
-
Processed Copy number data file = /xchip/cga/gdac-prod/tcga-gdac/jobResults/GDAC_Correlate_Genomic_Events_Preprocess/THYM-TP/19781936/transformed.cor.cli.txt
-
Clinical data file = /xchip/cga/gdac-prod/tcga-gdac/jobResults/Append_Data/THYM-TP/19775615/THYM-TP.merged_data.txt
-
Number of patients = 123
-
Number of significantly focal cnvs = 12
-
Number of selected clinical features = 8
-
Exclude genes that fewer than K tumors have mutations, K = 3
For survival clinical features, the Kaplan-Meier survival curves of tumors with and without gene mutations were plotted and the statistical significance P values were estimated by logrank test (Bland and Altman 2004) using the 'survdiff' function in R
For binary or multi-class clinical features (nominal or ordinal), two-tailed Fisher's exact tests (Fisher 1922) were used to estimate the P values using the 'fisher.test' function in R
For multiple hypothesis correction, Q value is the False Discovery Rate (FDR) analogue of the P value (Benjamini and Hochberg 1995), defined as the minimum FDR at which the test may be called significant. We used the 'Benjamini and Hochberg' method of 'p.adjust' function in R to convert P values into Q values.
In addition to the links below, the full results of the analysis summarized in this report can also be downloaded programmatically using firehose_get, or interactively from either the Broad GDAC website or TCGA Data Coordination Center Portal.