This pipeline computes the correlation between significantly recurrent gene mutations and selected clinical features.
Testing the association between mutation status of 20 genes and 39 clinical features across 194 patients, 2 significant findings detected with Q value < 0.25.
-
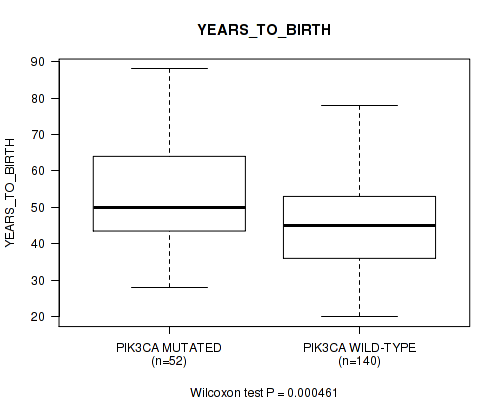
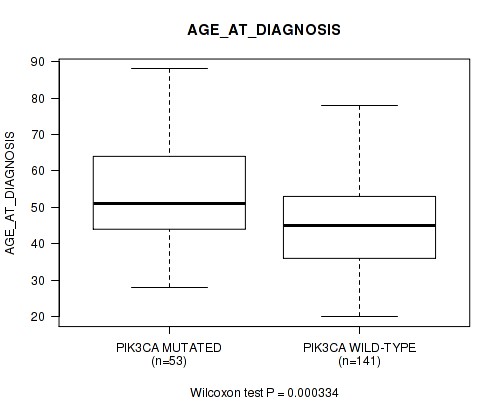
PIK3CA mutation correlated to 'YEARS_TO_BIRTH' and 'AGE_AT_DIAGNOSIS'.
Table 1. Get Full Table Overview of the association between mutation status of 20 genes and 39 clinical features. Shown in the table are P values (Q values). Thresholded by Q value < 0.25, 2 significant findings detected.
|
Clinical Features |
Time to Death |
YEARS TO BIRTH |
PATHOLOGY T STAGE |
PATHOLOGY N STAGE |
PATHOLOGY M STAGE |
RADIATION THERAPY |
HISTOLOGICAL TYPE |
NUMBER PACK YEARS SMOKED |
NUMBER OF LYMPH NODES |
RACE | ETHNICITY |
WEIGHT KG AT DIAGNOSIS |
TUMOR STATUS |
NEOPLASM HISTOLOGIC GRADE |
TOBACCO SMOKING YEAR STOPPED |
TOBACCO SMOKING PACK YEARS SMOKED |
TOBACCO SMOKING HISTORY |
AGEBEGANSMOKINGINYEARS |
RADIATION THERAPY STATUS |
PREGNANCIES COUNT TOTAL |
PREGNANCIES COUNT STILLBIRTH |
PREGNANCY SPONTANEOUS ABORTION COUNT |
PREGNANCIES COUNT LIVE BIRTH |
PREGNANCY THERAPEUTIC ABORTION COUNT |
PREGNANCIES COUNT ECTOPIC |
POS LYMPH NODE LOCATION |
MENOPAUSE STATUS |
LYMPHOVASCULAR INVOLVEMENT |
LYMPH NODES EXAMINED HE COUNT |
LYMPH NODES EXAMINED |
KERATINIZATION SQUAMOUS CELL |
INITIAL PATHOLOGIC DX YEAR |
HISTORY HORMONAL CONTRACEPTIVES USE |
HEIGHT CM AT DIAGNOSIS |
CORPUS INVOLVEMENT |
CHEMO CONCURRENT TYPE |
CERVIX SUV RESULTS |
AGE AT DIAGNOSIS |
CLINICAL STAGE |
||
| nMutated (%) | nWild-Type | logrank test | Wilcoxon-test | Fisher's exact test | Fisher's exact test | Fisher's exact test | Fisher's exact test | Fisher's exact test | Wilcoxon-test | Wilcoxon-test | Fisher's exact test | Fisher's exact test | Wilcoxon-test | Fisher's exact test | Fisher's exact test | Wilcoxon-test | Wilcoxon-test | Wilcoxon-test | Wilcoxon-test | Fisher's exact test | Wilcoxon-test | Wilcoxon-test | Wilcoxon-test | Wilcoxon-test | Wilcoxon-test | Wilcoxon-test | Fisher's exact test | Fisher's exact test | Fisher's exact test | Wilcoxon-test | Wilcoxon-test | Fisher's exact test | Wilcoxon-test | Fisher's exact test | Wilcoxon-test | Fisher's exact test | Fisher's exact test | Wilcoxon-test | Wilcoxon-test | Fisher's exact test | |
| PIK3CA | 53 (27%) | 141 |
0.643 (1.00) |
0.000461 (0.18) |
0.185 (1.00) |
0.541 (1.00) |
0.264 (1.00) |
0.819 (1.00) |
0.643 (1.00) |
0.102 (0.927) |
0.421 (1.00) |
0.0792 (0.897) |
0.00185 (0.263) |
0.776 (1.00) |
0.564 (1.00) |
0.086 (0.927) |
0.903 (1.00) |
0.102 (0.927) |
0.329 (1.00) |
0.584 (1.00) |
0.515 (1.00) |
0.702 (1.00) |
0.863 (1.00) |
0.938 (1.00) |
0.884 (1.00) |
0.243 (1.00) |
0.502 (1.00) |
0.365 (1.00) |
0.00707 (0.501) |
0.684 (1.00) |
0.421 (1.00) |
0.917 (1.00) |
0.513 (1.00) |
0.815 (1.00) |
0.935 (1.00) |
0.0596 (0.86) |
0.351 (1.00) |
0.0839 (0.921) |
0.915 (1.00) |
0.000334 (0.18) |
0.33 (1.00) |
| PTEN | 15 (8%) | 179 |
0.222 (1.00) |
0.00549 (0.501) |
0.22 (1.00) |
0.725 (1.00) |
0.264 (1.00) |
0.228 (1.00) |
0.474 (1.00) |
0.412 (1.00) |
0.553 (1.00) |
0.52 (1.00) |
1 (1.00) |
0.691 (1.00) |
1 (1.00) |
0.632 (1.00) |
0.943 (1.00) |
0.412 (1.00) |
0.33 (1.00) |
0.281 (1.00) |
1 (1.00) |
0.621 (1.00) |
0.028 (0.732) |
0.191 (1.00) |
0.587 (1.00) |
0.34 (1.00) |
0.9 (1.00) |
0.245 (1.00) |
0.202 (1.00) |
1 (1.00) |
0.553 (1.00) |
0.719 (1.00) |
1 (1.00) |
0.861 (1.00) |
0.309 (1.00) |
0.729 (1.00) |
0.03 (0.745) |
0.0541 (0.86) |
0.0062 (0.501) |
0.181 (1.00) |
|
| HLA-B | 11 (6%) | 183 |
0.487 (1.00) |
0.322 (1.00) |
0.102 (0.927) |
1 (1.00) |
1 (1.00) |
0.695 (1.00) |
0.745 (1.00) |
0.309 (1.00) |
0.73 (1.00) |
0.0683 (0.86) |
0.0113 (0.552) |
0.554 (1.00) |
0.732 (1.00) |
0.0595 (0.86) |
0.857 (1.00) |
0.309 (1.00) |
0.415 (1.00) |
0.043 (0.86) |
1 (1.00) |
0.0417 (0.86) |
0.441 (1.00) |
0.0647 (0.86) |
0.342 (1.00) |
0.0242 (0.732) |
0.9 (1.00) |
0.542 (1.00) |
1 (1.00) |
0.73 (1.00) |
0.881 (1.00) |
0.665 (1.00) |
0.969 (1.00) |
0.787 (1.00) |
0.2 (1.00) |
0.574 (1.00) |
1 (1.00) |
0.346 (1.00) |
0.069 (0.86) |
||
| HLA-A | 16 (8%) | 178 |
0.288 (1.00) |
0.231 (1.00) |
0.149 (1.00) |
0.0305 (0.745) |
1 (1.00) |
1 (1.00) |
0.717 (1.00) |
0.0527 (0.86) |
0.0592 (0.86) |
0.546 (1.00) |
0.351 (1.00) |
0.681 (1.00) |
0.364 (1.00) |
0.0107 (0.552) |
0.259 (1.00) |
0.0527 (0.86) |
0.549 (1.00) |
0.874 (1.00) |
1 (1.00) |
0.323 (1.00) |
0.588 (1.00) |
0.201 (1.00) |
0.434 (1.00) |
0.317 (1.00) |
0.991 (1.00) |
0.503 (1.00) |
0.541 (1.00) |
0.712 (1.00) |
0.0592 (0.86) |
0.335 (1.00) |
0.738 (1.00) |
0.301 (1.00) |
1 (1.00) |
0.288 (1.00) |
0.293 (1.00) |
1 (1.00) |
0.144 (1.00) |
0.235 (1.00) |
|
| KRAS | 11 (6%) | 183 |
0.514 (1.00) |
0.836 (1.00) |
0.197 (1.00) |
1 (1.00) |
0.182 (1.00) |
1 (1.00) |
0.00147 (0.263) |
0.347 (1.00) |
0.979 (1.00) |
0.449 (1.00) |
1 (1.00) |
0.455 (1.00) |
0.141 (1.00) |
0.627 (1.00) |
0.347 (1.00) |
0.67 (1.00) |
0.57 (1.00) |
1 (1.00) |
0.099 (0.927) |
0.579 (1.00) |
0.566 (1.00) |
0.631 (1.00) |
0.359 (1.00) |
0.464 (1.00) |
1 (1.00) |
0.529 (1.00) |
0.089 (0.927) |
0.979 (1.00) |
0.202 (1.00) |
0.528 (1.00) |
0.884 (1.00) |
0.366 (1.00) |
0.691 (1.00) |
1 (1.00) |
0.0172 (0.732) |
0.795 (1.00) |
0.816 (1.00) |
||
| MLL2 | 22 (11%) | 172 |
0.05 (0.86) |
0.178 (1.00) |
0.87 (1.00) |
0.766 (1.00) |
1 (1.00) |
0.542 (1.00) |
0.92 (1.00) |
0.643 (1.00) |
0.296 (1.00) |
0.705 (1.00) |
0.663 (1.00) |
0.786 (1.00) |
0.785 (1.00) |
0.9 (1.00) |
0.643 (1.00) |
0.506 (1.00) |
0.779 (1.00) |
1 (1.00) |
0.538 (1.00) |
0.795 (1.00) |
0.188 (1.00) |
0.463 (1.00) |
0.996 (1.00) |
0.869 (1.00) |
0.142 (1.00) |
0.8 (1.00) |
0.158 (1.00) |
0.296 (1.00) |
0.8 (1.00) |
0.774 (1.00) |
0.595 (1.00) |
0.658 (1.00) |
0.22 (1.00) |
0.0277 (0.732) |
1 (1.00) |
0.195 (1.00) |
0.226 (1.00) |
||
| FBXW7 | 19 (10%) | 175 |
0.76 (1.00) |
0.415 (1.00) |
0.0706 (0.86) |
0.137 (1.00) |
1 (1.00) |
1 (1.00) |
0.655 (1.00) |
0.988 (1.00) |
0.159 (1.00) |
0.919 (1.00) |
0.648 (1.00) |
0.718 (1.00) |
0.257 (1.00) |
0.691 (1.00) |
0.409 (1.00) |
0.988 (1.00) |
0.415 (1.00) |
0.581 (1.00) |
1 (1.00) |
0.495 (1.00) |
0.513 (1.00) |
0.215 (1.00) |
0.283 (1.00) |
0.503 (1.00) |
0.264 (1.00) |
0.161 (1.00) |
0.741 (1.00) |
0.787 (1.00) |
0.159 (1.00) |
0.374 (1.00) |
1 (1.00) |
0.639 (1.00) |
0.458 (1.00) |
0.203 (1.00) |
1 (1.00) |
0.434 (1.00) |
0.381 (1.00) |
0.455 (1.00) |
|
| EP300 | 21 (11%) | 173 |
0.702 (1.00) |
0.0241 (0.732) |
0.283 (1.00) |
0.277 (1.00) |
1 (1.00) |
0.495 (1.00) |
0.771 (1.00) |
0.91 (1.00) |
0.401 (1.00) |
0.631 (1.00) |
0.694 (1.00) |
0.542 (1.00) |
1 (1.00) |
0.834 (1.00) |
0.91 (1.00) |
0.341 (1.00) |
0.185 (1.00) |
1 (1.00) |
0.525 (1.00) |
0.729 (1.00) |
0.323 (1.00) |
0.116 (0.985) |
0.93 (1.00) |
0.233 (1.00) |
0.217 (1.00) |
0.17 (1.00) |
0.78 (1.00) |
0.401 (1.00) |
0.721 (1.00) |
0.553 (1.00) |
0.903 (1.00) |
0.276 (1.00) |
0.64 (1.00) |
0.65 (1.00) |
1 (1.00) |
0.0278 (0.732) |
0.021 (0.732) |
||
| MAPK1 | 9 (5%) | 185 |
0.0975 (0.927) |
0.179 (1.00) |
0.409 (1.00) |
1 (1.00) |
1 (1.00) |
1 (1.00) |
0.812 (1.00) |
0.179 (1.00) |
0.658 (1.00) |
1 (1.00) |
0.555 (1.00) |
0.505 (1.00) |
0.457 (1.00) |
0.245 (1.00) |
0.179 (1.00) |
0.525 (1.00) |
0.222 (1.00) |
1 (1.00) |
0.62 (1.00) |
0.503 (1.00) |
0.349 (1.00) |
0.732 (1.00) |
0.188 (1.00) |
0.378 (1.00) |
0.473 (1.00) |
0.155 (1.00) |
0.658 (1.00) |
0.76 (1.00) |
0.676 (1.00) |
0.948 (1.00) |
1 (1.00) |
0.22 (1.00) |
0.293 (1.00) |
0.19 (1.00) |
0.352 (1.00) |
||||
| MLL3 | 29 (15%) | 165 |
0.0661 (0.86) |
0.157 (1.00) |
0.418 (1.00) |
0.775 (1.00) |
1 (1.00) |
0.256 (1.00) |
0.98 (1.00) |
0.713 (1.00) |
0.73 (1.00) |
0.0474 (0.86) |
0.404 (1.00) |
0.629 (1.00) |
0.0716 (0.86) |
0.803 (1.00) |
0.413 (1.00) |
0.713 (1.00) |
0.269 (1.00) |
0.753 (1.00) |
1 (1.00) |
0.486 (1.00) |
0.916 (1.00) |
0.714 (1.00) |
0.764 (1.00) |
0.187 (1.00) |
0.566 (1.00) |
0.893 (1.00) |
0.127 (1.00) |
0.439 (1.00) |
0.73 (1.00) |
0.741 (1.00) |
0.78 (1.00) |
0.0481 (0.86) |
0.327 (1.00) |
0.868 (1.00) |
1 (1.00) |
1 (1.00) |
0.171 (1.00) |
0.435 (1.00) |
|
| ARID1A | 14 (7%) | 180 |
0.589 (1.00) |
0.163 (1.00) |
0.00231 (0.263) |
1 (1.00) |
0.0446 (0.86) |
0.695 (1.00) |
0.0068 (0.501) |
0.848 (1.00) |
0.213 (1.00) |
0.0216 (0.732) |
0.84 (1.00) |
0.523 (1.00) |
0.382 (1.00) |
0.0446 (0.86) |
0.288 (1.00) |
0.618 (1.00) |
0.0349 (0.8) |
0.551 (1.00) |
0.0535 (0.86) |
0.187 (1.00) |
0.801 (1.00) |
1 (1.00) |
0.739 (1.00) |
0.848 (1.00) |
0.47 (1.00) |
1 (1.00) |
0.602 (1.00) |
1 (1.00) |
0.319 (1.00) |
1 (1.00) |
0.00977 (0.544) |
0.176 (1.00) |
0.0655 (0.86) |
||||||
| NFE2L2 | 12 (6%) | 182 |
0.754 (1.00) |
0.923 (1.00) |
0.14 (1.00) |
0.679 (1.00) |
1 (1.00) |
0.398 (1.00) |
0.765 (1.00) |
0.677 (1.00) |
0.771 (1.00) |
0.306 (1.00) |
0.238 (1.00) |
0.447 (1.00) |
0.17 (1.00) |
0.0821 (0.915) |
0.59 (1.00) |
0.677 (1.00) |
0.0269 (0.732) |
0.326 (1.00) |
1 (1.00) |
0.176 (1.00) |
0.413 (1.00) |
0.491 (1.00) |
0.405 (1.00) |
0.113 (0.969) |
0.991 (1.00) |
0.368 (1.00) |
1 (1.00) |
0.209 (1.00) |
0.771 (1.00) |
0.075 (0.886) |
0.501 (1.00) |
0.0557 (0.86) |
0.842 (1.00) |
0.768 (1.00) |
0.23 (1.00) |
1 (1.00) |
0.82 (1.00) |
0.956 (1.00) |
0.0948 (0.927) |
| CASP8 | 9 (5%) | 185 |
0.93 (1.00) |
0.33 (1.00) |
0.162 (1.00) |
0.665 (1.00) |
1 (1.00) |
1 (1.00) |
0.809 (1.00) |
0.0908 (0.927) |
0.707 (1.00) |
0.899 (1.00) |
0.453 (1.00) |
0.921 (1.00) |
0.457 (1.00) |
0.192 (1.00) |
0.615 (1.00) |
0.0908 (0.927) |
0.666 (1.00) |
0.27 (1.00) |
1 (1.00) |
0.475 (1.00) |
0.352 (1.00) |
0.0945 (0.927) |
0.164 (1.00) |
0.181 (1.00) |
0.378 (1.00) |
0.694 (1.00) |
0.12 (1.00) |
0.707 (1.00) |
0.805 (1.00) |
0.647 (1.00) |
0.251 (1.00) |
0.474 (1.00) |
0.907 (1.00) |
0.397 (1.00) |
1 (1.00) |
0.346 (1.00) |
0.235 (1.00) |
||
| FAT2 | 11 (6%) | 183 |
0.425 (1.00) |
0.155 (1.00) |
0.533 (1.00) |
1 (1.00) |
1 (1.00) |
0.383 (1.00) |
0.281 (1.00) |
0.0703 (0.86) |
0.722 (1.00) |
0.248 (1.00) |
0.0991 (0.927) |
0.376 (1.00) |
0.455 (1.00) |
0.0652 (0.86) |
0.0703 (0.86) |
0.976 (1.00) |
0.143 (1.00) |
1 (1.00) |
0.254 (1.00) |
0.539 (1.00) |
0.444 (1.00) |
0.246 (1.00) |
0.613 (1.00) |
0.574 (1.00) |
0.35 (1.00) |
0.559 (1.00) |
0.681 (1.00) |
0.722 (1.00) |
0.863 (1.00) |
0.665 (1.00) |
0.778 (1.00) |
0.786 (1.00) |
0.00847 (0.517) |
0.293 (1.00) |
1 (1.00) |
0.168 (1.00) |
0.491 (1.00) |
||
| ZNF750 | 9 (5%) | 185 |
0.949 (1.00) |
0.772 (1.00) |
0.528 (1.00) |
1 (1.00) |
1 (1.00) |
1 (1.00) |
0.51 (1.00) |
0.179 (1.00) |
0.227 (1.00) |
0.056 (0.86) |
0.201 (1.00) |
0.0228 (0.732) |
0.202 (1.00) |
0.437 (1.00) |
0.179 (1.00) |
0.477 (1.00) |
0.637 (1.00) |
1 (1.00) |
0.857 (1.00) |
0.111 (0.962) |
0.36 (1.00) |
0.188 (1.00) |
0.865 (1.00) |
0.517 (1.00) |
1 (1.00) |
1 (1.00) |
0.227 (1.00) |
0.268 (1.00) |
0.433 (1.00) |
0.31 (1.00) |
1 (1.00) |
0.00236 (0.263) |
0.168 (1.00) |
1 (1.00) |
0.901 (1.00) |
0.658 (1.00) |
|||
| C12ORF43 | 4 (2%) | 190 |
0.185 (1.00) |
0.564 (1.00) |
0.0666 (0.86) |
0.551 (1.00) |
1 (1.00) |
1 (1.00) |
1 (1.00) |
0.491 (1.00) |
1 (1.00) |
0.364 (1.00) |
0.574 (1.00) |
1 (1.00) |
0.2 (1.00) |
0.209 (1.00) |
0.58 (1.00) |
0.662 (1.00) |
0.497 (1.00) |
1 (1.00) |
0.198 (1.00) |
0.98 (1.00) |
0.0224 (0.732) |
0.577 (1.00) |
0.143 (1.00) |
||||||||||||||||
| C3ORF70 | 4 (2%) | 190 |
0.41 (1.00) |
0.956 (1.00) |
0.263 (1.00) |
0.551 (1.00) |
1 (1.00) |
1 (1.00) |
0.565 (1.00) |
0.671 (1.00) |
0.329 (1.00) |
0.485 (1.00) |
1 (1.00) |
0.0504 (0.86) |
0.967 (1.00) |
0.0321 (0.759) |
0.098 (0.927) |
1 (1.00) |
0.62 (1.00) |
1 (1.00) |
0.196 (1.00) |
0.537 (1.00) |
0.111 (0.962) |
0.978 (1.00) |
0.109 (0.962) |
||||||||||||||||
| BAP1 | 4 (2%) | 190 |
0.606 (1.00) |
0.672 (1.00) |
0.0986 (0.927) |
1 (1.00) |
1 (1.00) |
0.384 (1.00) |
1 (1.00) |
0.671 (1.00) |
0.574 (1.00) |
1 (1.00) |
0.407 (1.00) |
1 (1.00) |
0.679 (1.00) |
0.792 (1.00) |
1 (1.00) |
0.522 (1.00) |
1 (1.00) |
0.916 (1.00) |
0.00207 (0.263) |
0.285 (1.00) |
0.662 (1.00) |
0.587 (1.00) |
|||||||||||||||||
| USP28 | 4 (2%) | 190 |
0.865 (1.00) |
0.0201 (0.732) |
0.603 (1.00) |
1 (1.00) |
1 (1.00) |
1 (1.00) |
0.111 (0.962) |
0.797 (1.00) |
1 (1.00) |
1 (1.00) |
0.285 (1.00) |
1 (1.00) |
0.61 (1.00) |
0.645 (1.00) |
0.577 (1.00) |
0.0479 (0.86) |
0.55 (1.00) |
0.544 (1.00) |
0.209 (1.00) |
0.579 (1.00) |
0.0972 (0.927) |
0.497 (1.00) |
0.797 (1.00) |
0.829 (1.00) |
0.528 (1.00) |
0.0794 (0.897) |
1 (1.00) |
0.364 (1.00) |
1 (1.00) |
1 (1.00) |
0.0209 (0.732) |
1 (1.00) |
|||||||
| IFNGR1 | 6 (3%) | 188 |
0.433 (1.00) |
0.612 (1.00) |
0.0281 (0.732) |
0.534 (1.00) |
1 (1.00) |
0.578 (1.00) |
0.254 (1.00) |
0.347 (1.00) |
0.306 (1.00) |
0.453 (1.00) |
0.0762 (0.887) |
1 (1.00) |
0.736 (1.00) |
0.95 (1.00) |
1 (1.00) |
0.00861 (0.517) |
0.579 (1.00) |
0.178 (1.00) |
0.0646 (0.86) |
0.256 (1.00) |
0.446 (1.00) |
0.601 (1.00) |
0.245 (1.00) |
0.347 (1.00) |
0.252 (1.00) |
0.551 (1.00) |
0.778 (1.00) |
1 (1.00) |
0.866 (1.00) |
0.397 (1.00) |
0.636 (1.00) |
0.473 (1.00) |
P value = 0.000461 (Wilcoxon-test), Q value = 0.18
Table S1. Gene #12: 'PIK3CA MUTATION STATUS' versus Clinical Feature #2: 'YEARS_TO_BIRTH'
| nPatients | Mean (Std.Dev) | |
|---|---|---|
| ALL | 192 | 47.3 (13.2) |
| PIK3CA MUTATED | 52 | 53.4 (13.8) |
| PIK3CA WILD-TYPE | 140 | 45.0 (12.3) |
Figure S1. Get High-res Image Gene #12: 'PIK3CA MUTATION STATUS' versus Clinical Feature #2: 'YEARS_TO_BIRTH'
P value = 0.000334 (Wilcoxon-test), Q value = 0.18
Table S2. Gene #12: 'PIK3CA MUTATION STATUS' versus Clinical Feature #38: 'AGE_AT_DIAGNOSIS'
| nPatients | Mean (Std.Dev) | |
|---|---|---|
| ALL | 194 | 47.4 (13.2) |
| PIK3CA MUTATED | 53 | 53.5 (13.8) |
| PIK3CA WILD-TYPE | 141 | 45.1 (12.3) |
Figure S2. Get High-res Image Gene #12: 'PIK3CA MUTATION STATUS' versus Clinical Feature #38: 'AGE_AT_DIAGNOSIS'
-
Mutation data file = sample_sig_gene_table.txt from Mutsig_2CV pipeline
-
Processed Mutation data file = /xchip/cga/gdac-prod/tcga-gdac/jobResults/GDAC_Correlate_Genomic_Events_Preprocess/CESC-TP/22574677/transformed.cor.cli.txt
-
Clinical data file = /xchip/cga/gdac-prod/tcga-gdac/jobResults/Append_Data/CESC-TP/22489370/CESC-TP.merged_data.txt
-
Number of patients = 194
-
Number of significantly mutated genes = 20
-
Number of selected clinical features = 39
-
Exclude genes that fewer than K tumors have mutations, K = 3
For survival clinical features, the Kaplan-Meier survival curves of tumors with and without gene mutations were plotted and the statistical significance P values were estimated by logrank test (Bland and Altman 2004) using the 'survdiff' function in R
For binary or multi-class clinical features (nominal or ordinal), two-tailed Fisher's exact tests (Fisher 1922) were used to estimate the P values using the 'fisher.test' function in R
For multiple hypothesis correction, Q value is the False Discovery Rate (FDR) analogue of the P value (Benjamini and Hochberg 1995), defined as the minimum FDR at which the test may be called significant. We used the 'Benjamini and Hochberg' method of 'p.adjust' function in R to convert P values into Q values.
In addition to the links below, the full results of the analysis summarized in this report can also be downloaded programmatically using firehose_get, or interactively from either the Broad GDAC website or TCGA Data Coordination Center Portal.