This pipeline computes the correlation between APOBRC groups and selected clinical features.
Testing the association between APOBEC groups identified by 2 different apobec score and 39 clinical features across 194 patients, 2 significant findings detected with Q value < 0.25.
-
3 subtypes identified in current cancer cohort by 'APOBEC MUTLOAD MINESTIMATE'. These subtypes correlate to 'MENOPAUSE_STATUS'.
-
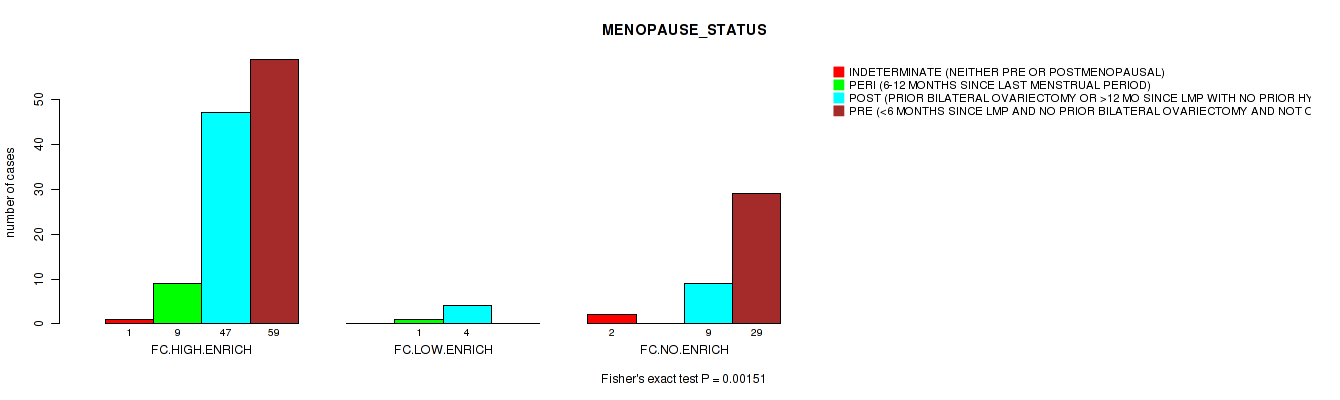
3 subtypes identified in current cancer cohort by 'APOBEC ENRICH'. These subtypes correlate to 'MENOPAUSE_STATUS'.
Table 1. Get Full Table Overview of the association between APOBEC groups by 2 different APOBEC scores and 39 clinical features. Shown in the table are P values (Q values). Thresholded by Q value < 0.25, 2 significant findings detected.
|
Clinical Features |
Statistical Tests |
APOBEC MUTLOAD MINESTIMATE |
APOBEC ENRICH |
| Time to Death | logrank test |
0.115 (0.562) |
0.692 (0.972) |
| YEARS TO BIRTH | Kruskal-Wallis (anova) |
0.109 (0.562) |
0.176 (0.623) |
| PATHOLOGY T STAGE | Fisher's exact test |
0.78 (0.972) |
0.801 (0.972) |
| PATHOLOGY N STAGE | Fisher's exact test |
0.972 (1.00) |
1 (1.00) |
| PATHOLOGY M STAGE | Fisher's exact test |
0.0348 (0.562) |
0.0827 (0.562) |
| RADIATION THERAPY | Fisher's exact test |
0.232 (0.753) |
0.872 (0.972) |
| HISTOLOGICAL TYPE | Fisher's exact test |
0.0473 (0.562) |
0.0635 (0.562) |
| NUMBER PACK YEARS SMOKED | Kruskal-Wallis (anova) |
0.175 (0.623) |
0.357 (0.845) |
| NUMBER OF LYMPH NODES | Kruskal-Wallis (anova) |
0.897 (0.972) |
0.849 (0.972) |
| RACE | Fisher's exact test |
0.57 (0.926) |
0.372 (0.854) |
| ETHNICITY | Fisher's exact test |
0.332 (0.845) |
0.75 (0.972) |
| WEIGHT KG AT DIAGNOSIS | Kruskal-Wallis (anova) |
0.582 (0.927) |
0.418 (0.881) |
| TUMOR STATUS | Fisher's exact test |
0.442 (0.884) |
0.804 (0.972) |
| NEOPLASM HISTOLOGIC GRADE | Fisher's exact test |
0.862 (0.972) |
0.599 (0.934) |
| TOBACCO SMOKING YEAR STOPPED | Kruskal-Wallis (anova) |
0.317 (0.845) |
0.246 (0.769) |
| TOBACCO SMOKING PACK YEARS SMOKED | Kruskal-Wallis (anova) |
0.175 (0.623) |
0.357 (0.845) |
| TOBACCO SMOKING HISTORY | Kruskal-Wallis (anova) |
0.612 (0.936) |
0.471 (0.914) |
| AGEBEGANSMOKINGINYEARS | Kruskal-Wallis (anova) |
0.324 (0.845) |
0.152 (0.623) |
| RADIATION THERAPY STATUS | Fisher's exact test |
1 (1.00) |
1 (1.00) |
| PREGNANCIES COUNT TOTAL | Kruskal-Wallis (anova) |
0.341 (0.845) |
0.693 (0.972) |
| PREGNANCIES COUNT STILLBIRTH | Kruskal-Wallis (anova) |
0.658 (0.969) |
0.88 (0.972) |
| PREGNANCY SPONTANEOUS ABORTION COUNT | Kruskal-Wallis (anova) |
0.842 (0.972) |
0.538 (0.914) |
| PREGNANCIES COUNT LIVE BIRTH | Kruskal-Wallis (anova) |
0.747 (0.972) |
0.547 (0.914) |
| PREGNANCY THERAPEUTIC ABORTION COUNT | Kruskal-Wallis (anova) |
0.403 (0.873) |
0.54 (0.914) |
| PREGNANCIES COUNT ECTOPIC | Kruskal-Wallis (anova) |
0.389 (0.866) |
0.339 (0.845) |
| POS LYMPH NODE LOCATION | Fisher's exact test |
0.0232 (0.562) |
0.497 (0.914) |
| MENOPAUSE STATUS | Fisher's exact test |
0.00149 (0.0589) |
0.00151 (0.0589) |
| LYMPHOVASCULAR INVOLVEMENT | Fisher's exact test |
0.718 (0.972) |
0.198 (0.672) |
| LYMPH NODES EXAMINED HE COUNT | Kruskal-Wallis (anova) |
0.897 (0.972) |
0.849 (0.972) |
| LYMPH NODES EXAMINED | Kruskal-Wallis (anova) |
0.833 (0.972) |
0.727 (0.972) |
| KERATINIZATION SQUAMOUS CELL | Fisher's exact test |
0.0801 (0.562) |
0.141 (0.623) |
| INITIAL PATHOLOGIC DX YEAR | Kruskal-Wallis (anova) |
0.0526 (0.562) |
0.0692 (0.562) |
| HISTORY HORMONAL CONTRACEPTIVES USE | Fisher's exact test |
0.633 (0.95) |
0.431 (0.884) |
| HEIGHT CM AT DIAGNOSIS | Kruskal-Wallis (anova) |
0.934 (0.998) |
0.525 (0.914) |
| CORPUS INVOLVEMENT | Fisher's exact test |
0.483 (0.914) |
0.831 (0.972) |
| CHEMO CONCURRENT TYPE | Fisher's exact test |
0.107 (0.562) |
0.0778 (0.562) |
| CERVIX SUV RESULTS | Kruskal-Wallis (anova) |
0.551 (0.914) |
|
| AGE AT DIAGNOSIS | Kruskal-Wallis (anova) |
0.0905 (0.562) |
0.157 (0.623) |
| CLINICAL STAGE | Fisher's exact test |
0.344 (0.845) |
0.0953 (0.562) |
Table S1. Description of APOBEC group #1: 'APOBEC MUTLOAD MINESTIMATE'
| Cluster Labels | 0 | HIGH | LOW |
|---|---|---|---|
| Number of samples | 46 | 74 | 74 |
P value = 0.00149 (Fisher's exact test), Q value = 0.059
Table S2. Clustering Approach #1: 'APOBEC MUTLOAD MINESTIMATE' versus Clinical Feature #27: 'MENOPAUSE_STATUS'
| nPatients | INDETERMINATE (NEITHER PRE OR POSTMENOPAUSAL) | PERI (6-12 MONTHS SINCE LAST MENSTRUAL PERIOD) | POST (PRIOR BILATERAL OVARIECTOMY OR >12 MO SINCE LMP WITH NO PRIOR HYSTERECTOMY) | PRE (<6 MONTHS SINCE LMP AND NO PRIOR BILATERAL OVARIECTOMY AND NOT ON ESTROGEN REPLACEMENT) |
|---|---|---|---|---|
| ALL | 3 | 10 | 60 | 88 |
| 0 | 2 | 0 | 9 | 29 |
| HIGH | 0 | 2 | 31 | 28 |
| LOW | 1 | 8 | 20 | 31 |
Figure S1. Get High-res Image Clustering Approach #1: 'APOBEC MUTLOAD MINESTIMATE' versus Clinical Feature #27: 'MENOPAUSE_STATUS'
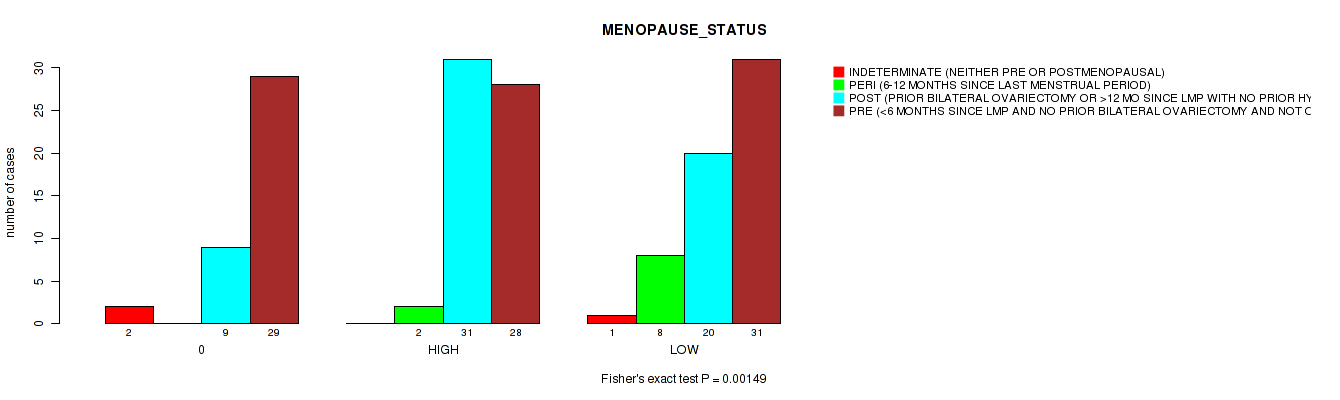
Table S3. Description of APOBEC group #2: 'APOBEC ENRICH'
| Cluster Labels | FC.HIGH.ENRICH | FC.LOW.ENRICH | FC.NO.ENRICH |
|---|---|---|---|
| Number of samples | 141 | 7 | 46 |
P value = 0.00151 (Fisher's exact test), Q value = 0.059
Table S4. Clustering Approach #2: 'APOBEC ENRICH' versus Clinical Feature #27: 'MENOPAUSE_STATUS'
| nPatients | INDETERMINATE (NEITHER PRE OR POSTMENOPAUSAL) | PERI (6-12 MONTHS SINCE LAST MENSTRUAL PERIOD) | POST (PRIOR BILATERAL OVARIECTOMY OR >12 MO SINCE LMP WITH NO PRIOR HYSTERECTOMY) | PRE (<6 MONTHS SINCE LMP AND NO PRIOR BILATERAL OVARIECTOMY AND NOT ON ESTROGEN REPLACEMENT) |
|---|---|---|---|---|
| ALL | 3 | 10 | 60 | 88 |
| FC.HIGH.ENRICH | 1 | 9 | 47 | 59 |
| FC.LOW.ENRICH | 0 | 1 | 4 | 0 |
| FC.NO.ENRICH | 2 | 0 | 9 | 29 |
Figure S2. Get High-res Image Clustering Approach #2: 'APOBEC ENRICH' versus Clinical Feature #27: 'MENOPAUSE_STATUS'
-
APOBEC groups file = /xchip/cga/gdac-prod/tcga-gdac/jobResults/APOBEC_Pipelines/CESC-TP/22522824/APOBEC_clinical_corr_input_22539499/APOBEC_for_clinical.correlaion.input.categorical.txt
-
Clinical data file = /xchip/cga/gdac-prod/tcga-gdac/jobResults/Append_Data/CESC-TP/22489370/CESC-TP.merged_data.txt
-
Number of patients = 194
-
Number of selected clinical features = 39
APOBEC classification based on APOBEC_MutLoad_MinEstimate : a. APOBEC non group -- samples with zero value, b. APOBEC high group -- samples above median value in non zero samples, c. APOBEC low group -- samples below median value in non zero samples.
APOBEC classification based on APOBEC_enrich : a. No Enrichmment group -- all samples with BH_Fisher_p-value_tCw > 0.05, b. Low enrichment group -- samples with BH_Fisher_p-value_tCw = < 0.05 and APOBEC_enrich=<2, c. High enrichment group -- samples with BH_Fisher_p-value_tCw =< 0.05 and APOBEC_enrich>2.
For survival clinical features, the Kaplan-Meier survival curves of tumors with and without gene mutations were plotted and the statistical significance P values were estimated by logrank test (Bland and Altman 2004) using the 'survdiff' function in R
For binary clinical features, two-tailed Fisher's exact tests (Fisher 1922) were used to estimate the P values using the 'fisher.test' function in R
For multiple hypothesis correction, Q value is the False Discovery Rate (FDR) analogue of the P value (Benjamini and Hochberg 1995), defined as the minimum FDR at which the test may be called significant. We used the 'Benjamini and Hochberg' method of 'p.adjust' function in R to convert P values into Q values.
In addition to the links below, the full results of the analysis summarized in this report can also be downloaded programmatically using firehose_get, or interactively from either the Broad GDAC website or TCGA Data Coordination Center Portal.