This pipeline computes the correlation between significant copy number variation (cnv focal) genes and selected clinical features.
Testing the association between copy number variation 75 focal events and 9 clinical features across 1085 patients, 398 significant findings detected with Q value < 0.25.
-
amp_1p36.21 cnv correlated to 'Time to Death', 'YEARS_TO_BIRTH', 'TUMOR_TISSUE_SITE', 'RADIATION_THERAPY', 'KARNOFSKY_PERFORMANCE_SCORE', and 'HISTOLOGICAL_TYPE'.
-
amp_1q22 cnv correlated to 'Time to Death', 'YEARS_TO_BIRTH', 'TUMOR_TISSUE_SITE', 'KARNOFSKY_PERFORMANCE_SCORE', 'HISTOLOGICAL_TYPE', and 'ETHNICITY'.
-
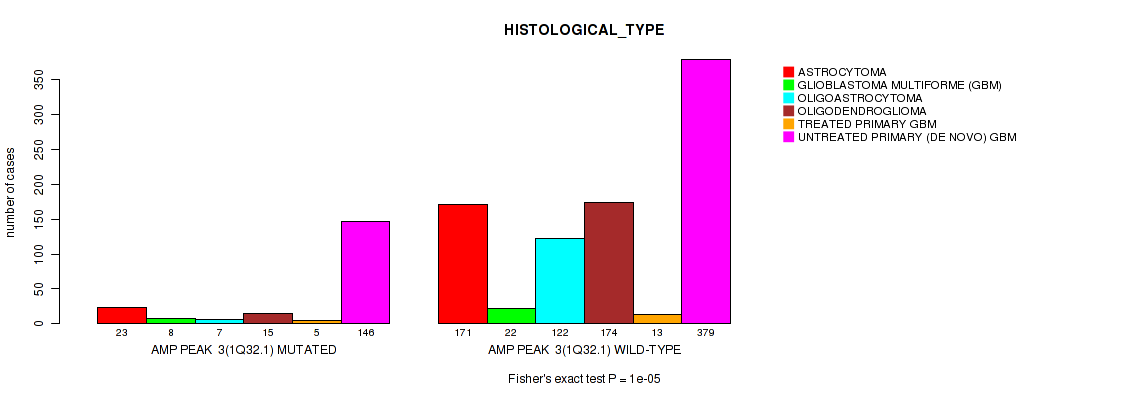
amp_1q32.1 cnv correlated to 'Time to Death', 'YEARS_TO_BIRTH', 'TUMOR_TISSUE_SITE', 'RADIATION_THERAPY', 'KARNOFSKY_PERFORMANCE_SCORE', 'HISTOLOGICAL_TYPE', and 'ETHNICITY'.
-
amp_1q44 cnv correlated to 'Time to Death', 'YEARS_TO_BIRTH', 'TUMOR_TISSUE_SITE', 'RADIATION_THERAPY', 'KARNOFSKY_PERFORMANCE_SCORE', and 'HISTOLOGICAL_TYPE'.
-
amp_2p24.3 cnv correlated to 'Time to Death', 'TUMOR_TISSUE_SITE', and 'HISTOLOGICAL_TYPE'.
-
amp_3q26.33 cnv correlated to 'Time to Death', 'YEARS_TO_BIRTH', 'TUMOR_TISSUE_SITE', 'KARNOFSKY_PERFORMANCE_SCORE', 'HISTOLOGICAL_TYPE', and 'ETHNICITY'.
-
amp_4p16.3 cnv correlated to 'Time to Death', 'YEARS_TO_BIRTH', 'TUMOR_TISSUE_SITE', 'RADIATION_THERAPY', and 'HISTOLOGICAL_TYPE'.
-
amp_4q12 cnv correlated to 'Time to Death', 'YEARS_TO_BIRTH', 'TUMOR_TISSUE_SITE', 'RADIATION_THERAPY', 'KARNOFSKY_PERFORMANCE_SCORE', and 'HISTOLOGICAL_TYPE'.
-
amp_5p15.33 cnv correlated to 'Time to Death', 'YEARS_TO_BIRTH', 'TUMOR_TISSUE_SITE', 'RADIATION_THERAPY', and 'HISTOLOGICAL_TYPE'.
-
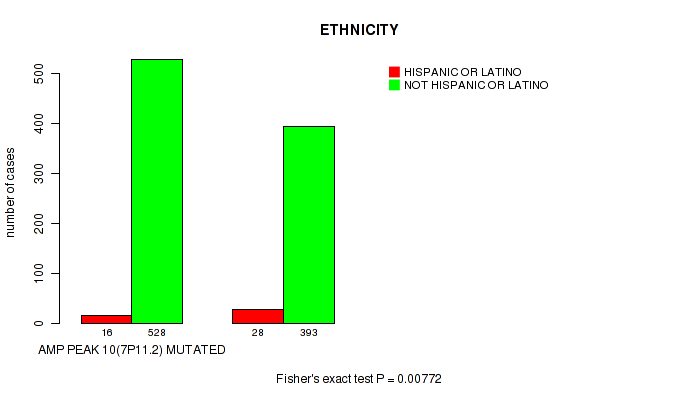
amp_7p11.2 cnv correlated to 'Time to Death', 'YEARS_TO_BIRTH', 'TUMOR_TISSUE_SITE', 'RADIATION_THERAPY', 'KARNOFSKY_PERFORMANCE_SCORE', 'HISTOLOGICAL_TYPE', 'RACE', and 'ETHNICITY'.
-
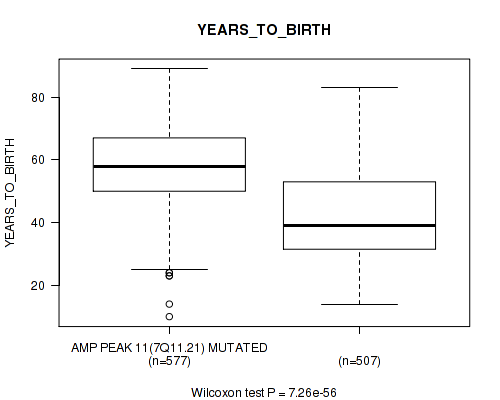
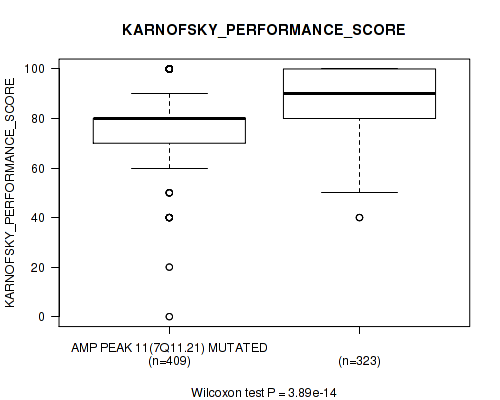
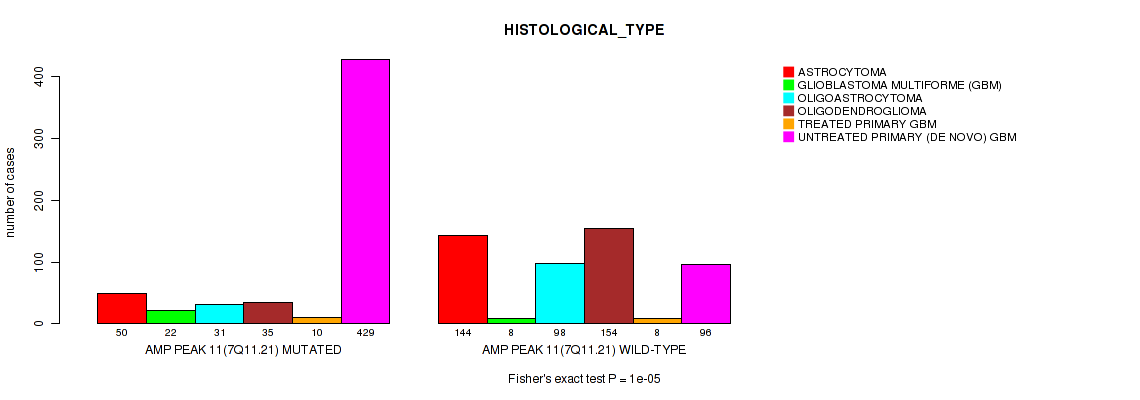
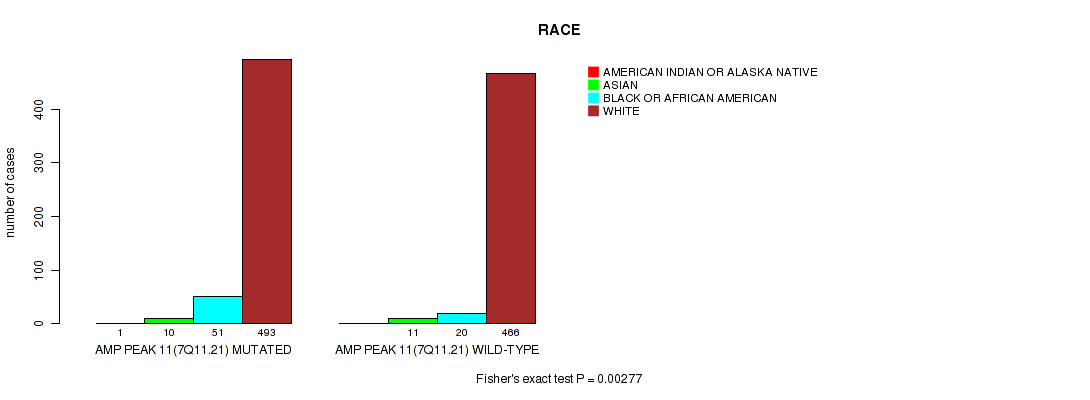
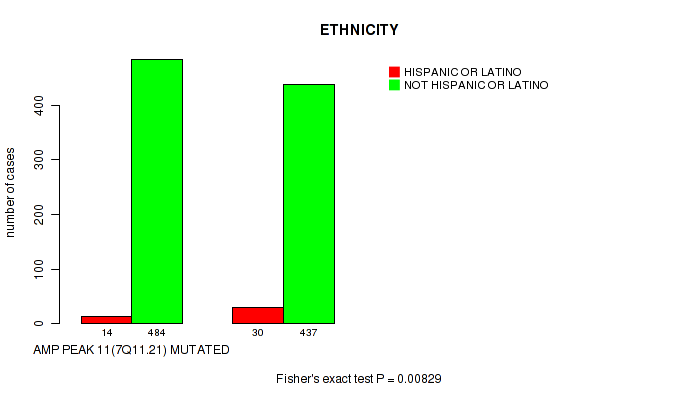
amp_7q11.21 cnv correlated to 'Time to Death', 'YEARS_TO_BIRTH', 'TUMOR_TISSUE_SITE', 'RADIATION_THERAPY', 'KARNOFSKY_PERFORMANCE_SCORE', 'HISTOLOGICAL_TYPE', 'RACE', and 'ETHNICITY'.
-
amp_7q21.2 cnv correlated to 'Time to Death', 'YEARS_TO_BIRTH', 'TUMOR_TISSUE_SITE', 'RADIATION_THERAPY', 'KARNOFSKY_PERFORMANCE_SCORE', 'HISTOLOGICAL_TYPE', 'RACE', and 'ETHNICITY'.
-
amp_7q31.2 cnv correlated to 'Time to Death', 'YEARS_TO_BIRTH', 'TUMOR_TISSUE_SITE', 'RADIATION_THERAPY', 'KARNOFSKY_PERFORMANCE_SCORE', 'HISTOLOGICAL_TYPE', 'RACE', and 'ETHNICITY'.
-
amp_7q32.3 cnv correlated to 'Time to Death', 'YEARS_TO_BIRTH', 'TUMOR_TISSUE_SITE', 'RADIATION_THERAPY', 'KARNOFSKY_PERFORMANCE_SCORE', 'HISTOLOGICAL_TYPE', 'RACE', and 'ETHNICITY'.
-
amp_8q24.21 cnv correlated to 'Time to Death', 'YEARS_TO_BIRTH', 'TUMOR_TISSUE_SITE', and 'HISTOLOGICAL_TYPE'.
-
amp_9q34.3 cnv correlated to 'Time to Death', 'YEARS_TO_BIRTH', 'TUMOR_TISSUE_SITE', 'GENDER', 'RADIATION_THERAPY', 'KARNOFSKY_PERFORMANCE_SCORE', and 'HISTOLOGICAL_TYPE'.
-
amp_10p15.1 cnv correlated to 'Time to Death', 'YEARS_TO_BIRTH', 'TUMOR_TISSUE_SITE', 'KARNOFSKY_PERFORMANCE_SCORE', 'HISTOLOGICAL_TYPE', and 'ETHNICITY'.
-
amp_11p13 cnv correlated to 'HISTOLOGICAL_TYPE'.
-
amp_11q24.1 cnv correlated to 'Time to Death', 'YEARS_TO_BIRTH', 'TUMOR_TISSUE_SITE', 'KARNOFSKY_PERFORMANCE_SCORE', and 'HISTOLOGICAL_TYPE'.
-
amp_12p13.32 cnv correlated to 'YEARS_TO_BIRTH' and 'RADIATION_THERAPY'.
-
amp_12q14.1 cnv correlated to 'Time to Death', 'YEARS_TO_BIRTH', 'TUMOR_TISSUE_SITE', 'RADIATION_THERAPY', 'KARNOFSKY_PERFORMANCE_SCORE', 'HISTOLOGICAL_TYPE', and 'ETHNICITY'.
-
amp_12q15 cnv correlated to 'Time to Death', 'YEARS_TO_BIRTH', 'TUMOR_TISSUE_SITE', 'RADIATION_THERAPY', 'KARNOFSKY_PERFORMANCE_SCORE', 'HISTOLOGICAL_TYPE', and 'ETHNICITY'.
-
amp_13q34 cnv correlated to 'KARNOFSKY_PERFORMANCE_SCORE'.
-
amp_14q32.33 cnv correlated to 'Time to Death', 'YEARS_TO_BIRTH', 'TUMOR_TISSUE_SITE', 'RADIATION_THERAPY', 'KARNOFSKY_PERFORMANCE_SCORE', and 'HISTOLOGICAL_TYPE'.
-
amp_17p13.2 cnv correlated to 'Time to Death', 'YEARS_TO_BIRTH', 'TUMOR_TISSUE_SITE', 'GENDER', and 'HISTOLOGICAL_TYPE'.
-
amp_17q25.1 cnv correlated to 'Time to Death', 'YEARS_TO_BIRTH', 'TUMOR_TISSUE_SITE', 'GENDER', and 'HISTOLOGICAL_TYPE'.
-
amp_19p13.3 cnv correlated to 'Time to Death', 'YEARS_TO_BIRTH', 'TUMOR_TISSUE_SITE', and 'HISTOLOGICAL_TYPE'.
-
amp_19q12 cnv correlated to 'Time to Death', 'YEARS_TO_BIRTH', 'TUMOR_TISSUE_SITE', 'RADIATION_THERAPY', 'KARNOFSKY_PERFORMANCE_SCORE', 'HISTOLOGICAL_TYPE', and 'RACE'.
-
amp_19q13.2 cnv correlated to 'Time to Death', 'YEARS_TO_BIRTH', 'TUMOR_TISSUE_SITE', 'RADIATION_THERAPY', 'KARNOFSKY_PERFORMANCE_SCORE', 'HISTOLOGICAL_TYPE', and 'RACE'.
-
amp_xp11.21 cnv correlated to 'Time to Death', 'YEARS_TO_BIRTH', 'TUMOR_TISSUE_SITE', 'GENDER', 'RADIATION_THERAPY', 'KARNOFSKY_PERFORMANCE_SCORE', 'HISTOLOGICAL_TYPE', and 'ETHNICITY'.
-
del_1p36.32 cnv correlated to 'Time to Death', 'TUMOR_TISSUE_SITE', 'RADIATION_THERAPY', 'KARNOFSKY_PERFORMANCE_SCORE', 'HISTOLOGICAL_TYPE', and 'RACE'.
-
del_1p36.23 cnv correlated to 'Time to Death', 'TUMOR_TISSUE_SITE', 'RADIATION_THERAPY', 'KARNOFSKY_PERFORMANCE_SCORE', 'HISTOLOGICAL_TYPE', and 'RACE'.
-
del_1p32.3 cnv correlated to 'Time to Death', 'TUMOR_TISSUE_SITE', 'RADIATION_THERAPY', 'KARNOFSKY_PERFORMANCE_SCORE', 'HISTOLOGICAL_TYPE', and 'RACE'.
-
del_1p22.1 cnv correlated to 'Time to Death', 'YEARS_TO_BIRTH', 'TUMOR_TISSUE_SITE', 'RADIATION_THERAPY', 'KARNOFSKY_PERFORMANCE_SCORE', 'HISTOLOGICAL_TYPE', and 'ETHNICITY'.
-
del_1q42.11 cnv correlated to 'Time to Death', 'YEARS_TO_BIRTH', 'TUMOR_TISSUE_SITE', and 'KARNOFSKY_PERFORMANCE_SCORE'.
-
del_2q22.1 cnv correlated to 'Time to Death', 'YEARS_TO_BIRTH', 'TUMOR_TISSUE_SITE', 'KARNOFSKY_PERFORMANCE_SCORE', 'HISTOLOGICAL_TYPE', and 'ETHNICITY'.
-
del_2q37.1 cnv correlated to 'YEARS_TO_BIRTH', 'TUMOR_TISSUE_SITE', and 'HISTOLOGICAL_TYPE'.
-
del_3p21.31 cnv correlated to 'RADIATION_THERAPY'.
-
del_3q13.31 cnv correlated to 'Time to Death' and 'RADIATION_THERAPY'.
-
del_4q34.3 cnv correlated to 'Time to Death', 'YEARS_TO_BIRTH', 'TUMOR_TISSUE_SITE', 'GENDER', and 'HISTOLOGICAL_TYPE'.
-
del_5p15.33 cnv correlated to 'RADIATION_THERAPY' and 'HISTOLOGICAL_TYPE'.
-
del_5q34 cnv correlated to 'YEARS_TO_BIRTH', 'RADIATION_THERAPY', and 'HISTOLOGICAL_TYPE'.
-
del_6p25.3 cnv correlated to 'Time to Death', 'YEARS_TO_BIRTH', 'TUMOR_TISSUE_SITE', 'KARNOFSKY_PERFORMANCE_SCORE', and 'HISTOLOGICAL_TYPE'.
-
del_6q22.31 cnv correlated to 'Time to Death', 'YEARS_TO_BIRTH', 'TUMOR_TISSUE_SITE', 'GENDER', 'RADIATION_THERAPY', 'KARNOFSKY_PERFORMANCE_SCORE', 'HISTOLOGICAL_TYPE', 'RACE', and 'ETHNICITY'.
-
del_6q26 cnv correlated to 'Time to Death', 'YEARS_TO_BIRTH', 'TUMOR_TISSUE_SITE', 'RADIATION_THERAPY', 'KARNOFSKY_PERFORMANCE_SCORE', and 'HISTOLOGICAL_TYPE'.
-
del_8p23.2 cnv correlated to 'Time to Death', 'YEARS_TO_BIRTH', 'TUMOR_TISSUE_SITE', 'RADIATION_THERAPY', 'HISTOLOGICAL_TYPE', and 'RACE'.
-
del_8q24.3 cnv correlated to 'Time to Death', 'TUMOR_TISSUE_SITE', 'RADIATION_THERAPY', and 'HISTOLOGICAL_TYPE'.
-
del_9p21.3 cnv correlated to 'Time to Death', 'YEARS_TO_BIRTH', 'TUMOR_TISSUE_SITE', 'RADIATION_THERAPY', 'KARNOFSKY_PERFORMANCE_SCORE', 'HISTOLOGICAL_TYPE', 'RACE', and 'ETHNICITY'.
-
del_10p15.3 cnv correlated to 'Time to Death', 'YEARS_TO_BIRTH', 'TUMOR_TISSUE_SITE', 'GENDER', 'RADIATION_THERAPY', 'KARNOFSKY_PERFORMANCE_SCORE', 'HISTOLOGICAL_TYPE', 'RACE', and 'ETHNICITY'.
-
del_10p13 cnv correlated to 'Time to Death', 'YEARS_TO_BIRTH', 'TUMOR_TISSUE_SITE', 'GENDER', 'RADIATION_THERAPY', 'KARNOFSKY_PERFORMANCE_SCORE', 'HISTOLOGICAL_TYPE', 'RACE', and 'ETHNICITY'.
-
del_10q23.31 cnv correlated to 'Time to Death', 'YEARS_TO_BIRTH', 'TUMOR_TISSUE_SITE', 'RADIATION_THERAPY', 'KARNOFSKY_PERFORMANCE_SCORE', 'HISTOLOGICAL_TYPE', 'RACE', and 'ETHNICITY'.
-
del_10q26.3 cnv correlated to 'Time to Death', 'YEARS_TO_BIRTH', 'TUMOR_TISSUE_SITE', 'RADIATION_THERAPY', 'KARNOFSKY_PERFORMANCE_SCORE', 'HISTOLOGICAL_TYPE', 'RACE', and 'ETHNICITY'.
-
del_11p15.5 cnv correlated to 'YEARS_TO_BIRTH', 'GENDER', 'RADIATION_THERAPY', and 'HISTOLOGICAL_TYPE'.
-
del_11p15.1 cnv correlated to 'Time to Death', 'TUMOR_TISSUE_SITE', 'GENDER', 'RADIATION_THERAPY', and 'HISTOLOGICAL_TYPE'.
-
del_11p11.2 cnv correlated to 'Time to Death', 'TUMOR_TISSUE_SITE', 'RADIATION_THERAPY', and 'HISTOLOGICAL_TYPE'.
-
del_12p13.1 cnv correlated to 'Time to Death', 'TUMOR_TISSUE_SITE', 'HISTOLOGICAL_TYPE', and 'ETHNICITY'.
-
del_12q12 cnv correlated to 'HISTOLOGICAL_TYPE'.
-
del_12q15 cnv correlated to 'HISTOLOGICAL_TYPE'.
-
del_13q14.2 cnv correlated to 'Time to Death', 'YEARS_TO_BIRTH', 'TUMOR_TISSUE_SITE', 'RADIATION_THERAPY', 'KARNOFSKY_PERFORMANCE_SCORE', and 'HISTOLOGICAL_TYPE'.
-
del_13q22.1 cnv correlated to 'Time to Death', 'YEARS_TO_BIRTH', 'TUMOR_TISSUE_SITE', 'RADIATION_THERAPY', 'KARNOFSKY_PERFORMANCE_SCORE', 'HISTOLOGICAL_TYPE', and 'ETHNICITY'.
-
del_14q13.1 cnv correlated to 'Time to Death', 'YEARS_TO_BIRTH', 'TUMOR_TISSUE_SITE', 'RADIATION_THERAPY', 'KARNOFSKY_PERFORMANCE_SCORE', 'HISTOLOGICAL_TYPE', 'RACE', and 'ETHNICITY'.
-
del_14q24.2 cnv correlated to 'Time to Death', 'YEARS_TO_BIRTH', 'TUMOR_TISSUE_SITE', 'GENDER', and 'HISTOLOGICAL_TYPE'.
-
del_14q31.3 cnv correlated to 'Time to Death', 'YEARS_TO_BIRTH', 'TUMOR_TISSUE_SITE', 'GENDER', 'HISTOLOGICAL_TYPE', and 'RACE'.
-
del_15q14 cnv correlated to 'Time to Death', 'YEARS_TO_BIRTH', 'TUMOR_TISSUE_SITE', 'KARNOFSKY_PERFORMANCE_SCORE', and 'HISTOLOGICAL_TYPE'.
-
del_16p12.2 cnv correlated to 'Time to Death', 'YEARS_TO_BIRTH', 'TUMOR_TISSUE_SITE', 'RADIATION_THERAPY', and 'HISTOLOGICAL_TYPE'.
-
del_16q23.1 cnv correlated to 'Time to Death', 'YEARS_TO_BIRTH', 'TUMOR_TISSUE_SITE', 'RADIATION_THERAPY', 'KARNOFSKY_PERFORMANCE_SCORE', and 'HISTOLOGICAL_TYPE'.
-
del_17p13.1 cnv correlated to 'Time to Death', 'YEARS_TO_BIRTH', 'TUMOR_TISSUE_SITE', 'GENDER', 'RADIATION_THERAPY', 'KARNOFSKY_PERFORMANCE_SCORE', and 'HISTOLOGICAL_TYPE'.
-
del_17q11.2 cnv correlated to 'Time to Death', 'YEARS_TO_BIRTH', 'TUMOR_TISSUE_SITE', 'RADIATION_THERAPY', 'KARNOFSKY_PERFORMANCE_SCORE', 'HISTOLOGICAL_TYPE', and 'RACE'.
-
del_19q13.41 cnv correlated to 'Time to Death', 'YEARS_TO_BIRTH', 'TUMOR_TISSUE_SITE', 'RADIATION_THERAPY', 'KARNOFSKY_PERFORMANCE_SCORE', 'HISTOLOGICAL_TYPE', and 'ETHNICITY'.
-
del_19q13.43 cnv correlated to 'Time to Death', 'YEARS_TO_BIRTH', 'TUMOR_TISSUE_SITE', 'RADIATION_THERAPY', 'KARNOFSKY_PERFORMANCE_SCORE', and 'HISTOLOGICAL_TYPE'.
-
del_22q13.32 cnv correlated to 'Time to Death', 'YEARS_TO_BIRTH', 'TUMOR_TISSUE_SITE', 'RADIATION_THERAPY', 'KARNOFSKY_PERFORMANCE_SCORE', 'HISTOLOGICAL_TYPE', and 'ETHNICITY'.
-
del_xq21.1 cnv correlated to 'YEARS_TO_BIRTH' and 'KARNOFSKY_PERFORMANCE_SCORE'.
Table 1. Get Full Table Overview of the association between significant copy number variation of 75 focal events and 9 clinical features. Shown in the table are P values (Q values). Thresholded by Q value < 0.25, 398 significant findings detected.
|
Clinical Features |
Time to Death |
YEARS TO BIRTH |
TUMOR TISSUE SITE |
GENDER |
RADIATION THERAPY |
KARNOFSKY PERFORMANCE SCORE |
HISTOLOGICAL TYPE |
RACE | ETHNICITY | ||
| nCNV (%) | nWild-Type | logrank test | Wilcoxon-test | Fisher's exact test | Fisher's exact test | Fisher's exact test | Wilcoxon-test | Fisher's exact test | Fisher's exact test | Fisher's exact test | |
| del 6q22 31 | 239 (22%) | 846 |
2.97e-12 (2.67e-11) |
1.22e-05 (4.66e-05) |
1.61e-07 (9.37e-07) |
0.138 (0.236) |
0.0233 (0.0516) |
0.00855 (0.0211) |
1e-05 (3.86e-05) |
0.116 (0.204) |
0.0947 (0.17) |
| del 10p15 3 | 549 (51%) | 536 |
0 (0) |
9.83e-72 (2.77e-70) |
9.83e-110 (3.69e-108) |
0.0649 (0.124) |
1.13e-15 (1.42e-14) |
2.81e-18 (4.22e-17) |
1e-05 (3.86e-05) |
0.00725 (0.0184) |
0.00497 (0.0132) |
| del 10p13 | 549 (51%) | 536 |
0 (0) |
6.25e-72 (1.83e-70) |
4.32e-111 (1.72e-109) |
0.0267 (0.0572) |
9.5e-17 (1.36e-15) |
1.11e-16 (1.56e-15) |
1e-05 (3.86e-05) |
0.0168 (0.0387) |
0.00497 (0.0132) |
| amp 7p11 2 | 630 (58%) | 455 |
0 (0) |
2.8e-69 (7.56e-68) |
3.16e-105 (1.12e-103) |
0.319 (0.461) |
6.09e-14 (6.33e-13) |
9.91e-20 (1.59e-18) |
1e-05 (3.86e-05) |
0.00536 (0.014) |
0.00772 (0.0194) |
| amp 7q11 21 | 577 (53%) | 508 |
0 (0) |
7.26e-56 (1.69e-54) |
2.7e-85 (8.67e-84) |
0.355 (0.5) |
4.12e-11 (3.43e-10) |
3.89e-14 (4.23e-13) |
1e-05 (3.86e-05) |
0.00277 (0.00782) |
0.00829 (0.0205) |
| amp 7q21 2 | 631 (58%) | 454 |
0 (0) |
9.66e-51 (2.17e-49) |
1.36e-72 (4.18e-71) |
0.803 (0.885) |
1.29e-11 (1.09e-10) |
1.64e-12 (1.49e-11) |
1e-05 (3.86e-05) |
0.00147 (0.00445) |
0.00265 (0.00751) |
| amp 7q31 2 | 641 (59%) | 444 |
0 (0) |
1.27e-40 (2.52e-39) |
1.12e-59 (2.81e-58) |
0.851 (0.912) |
1.05e-09 (7.23e-09) |
1.54e-09 (1.05e-08) |
1e-05 (3.86e-05) |
0.00796 (0.0199) |
0.00286 (0.00804) |
| amp 7q32 3 | 654 (60%) | 431 |
0 (0) |
3.08e-41 (6.31e-40) |
9.51e-59 (2.29e-57) |
0.753 (0.85) |
1.19e-10 (9.33e-10) |
2.22e-09 (1.47e-08) |
1e-05 (3.86e-05) |
0.006 (0.0155) |
0.00154 (0.00462) |
| amp xp11 21 | 104 (10%) | 981 |
9.97e-05 (0.000341) |
2.91e-06 (1.52e-05) |
1.86e-05 (6.93e-05) |
0.0284 (0.06) |
0.00966 (0.0235) |
0.0239 (0.0527) |
1e-05 (3.86e-05) |
0.568 (0.69) |
0.0303 (0.0637) |
| del 9p21 3 | 592 (55%) | 493 |
0 (0) |
1.65e-30 (2.85e-29) |
1.31e-38 (2.53e-37) |
0.422 (0.563) |
4.09e-10 (3e-09) |
2.15e-13 (2.13e-12) |
1e-05 (3.86e-05) |
0.0155 (0.0356) |
0.063 (0.121) |
| del 10q23 31 | 624 (58%) | 461 |
0 (0) |
4.02e-64 (1.04e-62) |
7.82e-119 (3.3e-117) |
0.663 (0.772) |
3.56e-19 (5.58e-18) |
9.71e-19 (1.49e-17) |
1e-05 (3.86e-05) |
0.00814 (0.0203) |
0.00819 (0.0203) |
| del 10q26 3 | 661 (61%) | 424 |
0 (0) |
2.56e-50 (5.57e-49) |
2.98e-97 (1.01e-95) |
0.95 (0.986) |
5.32e-17 (7.81e-16) |
1.5e-16 (2.03e-15) |
1e-05 (3.86e-05) |
0.00919 (0.0225) |
0.0269 (0.0573) |
| del 14q13 1 | 244 (22%) | 841 |
5.84e-11 (4.81e-10) |
1.67e-09 (1.12e-08) |
4.67e-12 (4.1e-11) |
0.377 (0.525) |
0.0205 (0.0456) |
0.00749 (0.0189) |
1e-05 (3.86e-05) |
0.0442 (0.0887) |
0.0568 (0.111) |
| amp 1q32 1 | 204 (19%) | 881 |
7.89e-13 (7.4e-12) |
2.59e-13 (2.54e-12) |
3.43e-16 (4.54e-15) |
0.753 (0.85) |
0.0171 (0.0391) |
0.000114 (0.000385) |
1e-05 (3.86e-05) |
0.39 (0.54) |
0.0147 (0.034) |
| amp 9q34 3 | 141 (13%) | 944 |
0.0388 (0.0792) |
0.0265 (0.057) |
0.000199 (0.000655) |
0.0675 (0.129) |
0.0859 (0.157) |
0.0747 (0.141) |
0.00048 (0.00153) |
0.251 (0.391) |
0.818 (0.894) |
| amp 12q14 1 | 171 (16%) | 914 |
5.66e-15 (6.48e-14) |
9.7e-06 (3.86e-05) |
7.86e-14 (8.04e-13) |
0.673 (0.781) |
0.0104 (0.025) |
0.13 (0.225) |
1e-05 (3.86e-05) |
0.316 (0.459) |
0.0337 (0.0702) |
| amp 12q15 | 111 (10%) | 974 |
1.7e-10 (1.31e-09) |
3.2e-05 (0.000117) |
8.88e-13 (8.21e-12) |
0.155 (0.262) |
0.0443 (0.0887) |
0.0251 (0.0546) |
1e-05 (3.86e-05) |
0.362 (0.509) |
0.0174 (0.0395) |
| amp 19q12 | 246 (23%) | 839 |
0 (0) |
3.68e-16 (4.78e-15) |
1.93e-38 (3.62e-37) |
0.419 (0.561) |
1.04e-07 (6.16e-07) |
7.05e-05 (0.000247) |
1e-05 (3.86e-05) |
0.0404 (0.0821) |
0.582 (0.699) |
| amp 19q13 2 | 230 (21%) | 855 |
0 (0) |
2.86e-15 (3.45e-14) |
2.11e-33 (3.74e-32) |
0.407 (0.554) |
6.05e-07 (3.35e-06) |
0.000511 (0.00162) |
1e-05 (3.86e-05) |
0.0336 (0.0702) |
0.567 (0.69) |
| del 1p22 1 | 234 (22%) | 851 |
0 (0) |
0.00479 (0.0128) |
6.19e-30 (1.04e-28) |
0.55 (0.676) |
4.4e-14 (4.72e-13) |
0.000183 (0.000607) |
1e-05 (3.86e-05) |
0.42 (0.561) |
0.14 (0.239) |
| del 13q22 1 | 365 (34%) | 720 |
4.66e-06 (2.4e-05) |
0.0122 (0.0287) |
6.38e-06 (3.21e-05) |
0.297 (0.442) |
0.0122 (0.0287) |
0.00181 (0.00531) |
0.0001 (0.000341) |
0.561 (0.687) |
0.142 (0.242) |
| del 17p13 1 | 116 (11%) | 969 |
2.65e-10 (1.97e-09) |
1.71e-07 (9.85e-07) |
5.36e-14 (5.66e-13) |
0.136 (0.234) |
0.0345 (0.0714) |
0.00479 (0.0128) |
1e-05 (3.86e-05) |
0.606 (0.723) |
0.466 (0.607) |
| del 17q11 2 | 93 (9%) | 992 |
5.28e-09 (3.33e-08) |
7.99e-05 (0.000276) |
3.94e-07 (2.22e-06) |
0.913 (0.966) |
0.117 (0.204) |
0.00354 (0.00973) |
5e-05 (0.00018) |
0.0931 (0.168) |
0.408 (0.554) |
| del 19q13 41 | 364 (34%) | 721 |
0 (0) |
2.55e-09 (1.66e-08) |
2.93e-35 (5.35e-34) |
0.193 (0.315) |
3.32e-08 (2.02e-07) |
2.52e-05 (9.28e-05) |
1e-05 (3.86e-05) |
0.817 (0.894) |
0.144 (0.245) |
| del 22q13 32 | 289 (27%) | 796 |
3.85e-12 (3.42e-11) |
1.92e-10 (1.45e-09) |
1.32e-16 (1.82e-15) |
0.531 (0.664) |
0.000175 (0.000581) |
0.004 (0.0109) |
1e-05 (3.86e-05) |
0.303 (0.448) |
0.118 (0.205) |
| amp 1p36 21 | 104 (10%) | 981 |
1.2e-13 (1.21e-12) |
2.2e-08 (1.36e-07) |
5.77e-16 (7.35e-15) |
0.466 (0.607) |
0.0522 (0.103) |
0.00153 (0.00461) |
1e-05 (3.86e-05) |
0.376 (0.524) |
0.791 (0.878) |
| amp 1q22 | 144 (13%) | 941 |
0.0189 (0.0424) |
0.00105 (0.00323) |
2.71e-06 (1.44e-05) |
0.318 (0.461) |
0.171 (0.284) |
0.0347 (0.0717) |
6e-05 (0.000213) |
0.343 (0.489) |
0.107 (0.188) |
| amp 1q44 | 129 (12%) | 956 |
2.63e-06 (1.41e-05) |
3.28e-06 (1.7e-05) |
3.34e-09 (2.13e-08) |
0.255 (0.393) |
0.123 (0.213) |
0.00191 (0.00559) |
1e-05 (3.86e-05) |
0.414 (0.56) |
0.809 (0.889) |
| amp 3q26 33 | 130 (12%) | 955 |
1.44e-15 (1.77e-14) |
5.2e-10 (3.69e-09) |
4.87e-15 (5.66e-14) |
0.344 (0.489) |
0.187 (0.308) |
0.00041 (0.00132) |
1e-05 (3.86e-05) |
0.344 (0.489) |
0.0774 (0.145) |
| amp 4q12 | 138 (13%) | 947 |
6.98e-10 (4.86e-09) |
5.29e-06 (2.68e-05) |
7.12e-11 (5.79e-10) |
0.167 (0.278) |
0.0859 (0.157) |
0.0547 (0.107) |
1e-05 (3.86e-05) |
0.47 (0.608) |
0.35 (0.494) |
| amp 10p15 1 | 88 (8%) | 997 |
4.74e-07 (2.64e-06) |
3.94e-15 (4.67e-14) |
5.83e-10 (4.1e-09) |
0.736 (0.838) |
1 (1.00) |
0.000762 (0.00238) |
1e-05 (3.86e-05) |
1 (1.00) |
0.0843 (0.156) |
| amp 14q32 33 | 44 (4%) | 1041 |
0.00179 (0.00528) |
9.57e-06 (3.86e-05) |
7.59e-05 (0.000264) |
0.212 (0.338) |
0.0643 (0.124) |
0.09 (0.164) |
0.00226 (0.00652) |
1 (1.00) |
0.254 (0.393) |
| del 1p36 32 | 315 (29%) | 770 |
7.08e-09 (4.43e-08) |
0.582 (0.699) |
1.44e-14 (1.62e-13) |
0.588 (0.703) |
6.2e-08 (3.74e-07) |
0.0272 (0.0576) |
1e-05 (3.86e-05) |
0.0217 (0.0481) |
0.736 (0.838) |
| del 1p36 23 | 344 (32%) | 741 |
1.29e-05 (4.87e-05) |
0.182 (0.301) |
8.52e-11 (6.78e-10) |
0.467 (0.608) |
2.97e-07 (1.7e-06) |
0.00252 (0.00718) |
1e-05 (3.86e-05) |
0.0996 (0.177) |
1 (1.00) |
| del 1p32 3 | 257 (24%) | 828 |
3.19e-13 (3.08e-12) |
0.232 (0.369) |
2.5e-27 (4.12e-26) |
1 (1.00) |
3.31e-13 (3.14e-12) |
0.00217 (0.00629) |
1e-05 (3.86e-05) |
0.036 (0.0742) |
0.279 (0.424) |
| del 2q22 1 | 68 (6%) | 1017 |
0.00355 (0.00973) |
0.0179 (0.0404) |
0.00564 (0.0147) |
0.899 (0.953) |
0.297 (0.442) |
0.0834 (0.155) |
0.00489 (0.013) |
0.345 (0.489) |
0.105 (0.185) |
| del 6q26 | 260 (24%) | 825 |
5.75e-12 (4.91e-11) |
0.00012 (0.000402) |
2.66e-09 (1.71e-08) |
0.194 (0.315) |
0.00228 (0.00655) |
0.00302 (0.00838) |
1e-05 (3.86e-05) |
0.225 (0.359) |
0.276 (0.42) |
| del 8p23 2 | 88 (8%) | 997 |
5.96e-05 (0.000213) |
6.92e-05 (0.000243) |
1.09e-05 (4.2e-05) |
0.822 (0.895) |
0.0111 (0.0264) |
0.319 (0.461) |
0.00014 (0.000468) |
0.0146 (0.0339) |
0.571 (0.691) |
| del 13q14 2 | 382 (35%) | 703 |
1.29e-05 (4.87e-05) |
0.0577 (0.112) |
1.24e-06 (6.81e-06) |
0.156 (0.263) |
0.00206 (0.00599) |
0.00413 (0.0112) |
1e-05 (3.86e-05) |
0.575 (0.693) |
0.263 (0.403) |
| del 14q31 3 | 275 (25%) | 810 |
0.00451 (0.0122) |
0.0999 (0.177) |
0.0591 (0.115) |
0.0477 (0.0946) |
0.324 (0.467) |
0.309 (0.453) |
0.0768 (0.144) |
0.0962 (0.172) |
0.859 (0.919) |
| del 16q23 1 | 128 (12%) | 957 |
2.54e-10 (1.9e-09) |
4.11e-05 (0.000149) |
4.36e-10 (3.16e-09) |
0.924 (0.968) |
0.0911 (0.165) |
0.00745 (0.0188) |
1e-05 (3.86e-05) |
0.345 (0.489) |
0.811 (0.889) |
| del 19q13 43 | 355 (33%) | 730 |
0 (0) |
2.98e-14 (3.29e-13) |
2.72e-41 (5.74e-40) |
0.265 (0.405) |
2.52e-09 (1.65e-08) |
2.85e-06 (1.5e-05) |
1e-05 (3.86e-05) |
0.3 (0.445) |
0.193 (0.315) |
| amp 4p16 3 | 69 (6%) | 1016 |
0.01 (0.0242) |
0.0341 (0.0708) |
0.00405 (0.011) |
0.45 (0.591) |
0.0272 (0.0576) |
0.569 (0.691) |
0.0409 (0.0826) |
0.489 (0.622) |
1 (1.00) |
| amp 5p15 33 | 76 (7%) | 1009 |
0.000777 (0.00241) |
0.0388 (0.0792) |
1.28e-06 (6.95e-06) |
0.47 (0.608) |
0.118 (0.205) |
0.841 (0.906) |
1e-05 (3.86e-05) |
0.272 (0.415) |
1 (1.00) |
| amp 11q24 1 | 112 (10%) | 973 |
1.68e-06 (9.06e-06) |
0.000446 (0.00143) |
5.41e-12 (4.68e-11) |
0.84 (0.906) |
0.162 (0.271) |
0.0109 (0.0261) |
1e-05 (3.86e-05) |
0.288 (0.434) |
0.45 (0.591) |
| amp 17p13 2 | 74 (7%) | 1011 |
0.00293 (0.00819) |
0.0115 (0.0271) |
0.00522 (0.0137) |
0.0664 (0.127) |
0.575 (0.693) |
0.787 (0.877) |
0.0051 (0.0134) |
0.489 (0.622) |
0.762 (0.855) |
| amp 17q25 1 | 127 (12%) | 958 |
5.13e-06 (2.62e-05) |
1.31e-05 (4.92e-05) |
0.00171 (0.0051) |
0.0858 (0.157) |
1 (1.00) |
0.794 (0.88) |
0.0154 (0.0356) |
0.721 (0.825) |
0.628 (0.74) |
| del 4q34 3 | 230 (21%) | 855 |
0.000118 (0.000398) |
0.0175 (0.0397) |
2.89e-05 (0.000106) |
0.0983 (0.175) |
0.251 (0.391) |
0.245 (0.385) |
0.00164 (0.0049) |
0.55 (0.676) |
0.346 (0.49) |
| del 6p25 3 | 138 (13%) | 947 |
7.99e-08 (4.77e-07) |
0.0376 (0.0771) |
0.00613 (0.0157) |
0.927 (0.968) |
0.51 (0.645) |
0.144 (0.245) |
0.057 (0.111) |
0.198 (0.319) |
0.489 (0.622) |
| del 11p15 1 | 176 (16%) | 909 |
0.0967 (0.173) |
0.653 (0.762) |
0.0701 (0.133) |
0.0448 (0.0895) |
0.0243 (0.0532) |
0.333 (0.479) |
0.00036 (0.00117) |
0.468 (0.608) |
0.528 (0.661) |
| del 14q24 2 | 291 (27%) | 794 |
0.00327 (0.00905) |
0.0938 (0.169) |
0.0196 (0.0437) |
0.0516 (0.102) |
0.42 (0.561) |
0.249 (0.388) |
0.0405 (0.0821) |
0.165 (0.276) |
0.483 (0.617) |
| del 15q14 | 215 (20%) | 870 |
2.78e-08 (1.71e-07) |
3.15e-07 (1.78e-06) |
4.6e-10 (3.3e-09) |
0.396 (0.543) |
0.528 (0.661) |
0.0244 (0.0532) |
1e-05 (3.86e-05) |
0.628 (0.74) |
0.567 (0.69) |
| del 16p12 2 | 114 (11%) | 971 |
1.63e-10 (1.26e-09) |
1.28e-07 (7.49e-07) |
8.54e-11 (6.78e-10) |
0.368 (0.515) |
0.0609 (0.118) |
0.447 (0.59) |
1e-05 (3.86e-05) |
0.571 (0.691) |
1 (1.00) |
| amp 8q24 21 | 169 (16%) | 916 |
0.000897 (0.00276) |
6.65e-05 (0.000235) |
0.000773 (0.00241) |
0.8 (0.884) |
0.425 (0.565) |
0.198 (0.319) |
0.00064 (0.00201) |
0.447 (0.59) |
0.203 (0.326) |
| amp 19p13 3 | 373 (34%) | 712 |
0.0104 (0.025) |
4.65e-05 (0.000168) |
1.6e-09 (1.08e-08) |
0.4 (0.546) |
0.763 (0.855) |
0.956 (0.991) |
1e-05 (3.86e-05) |
0.357 (0.501) |
0.521 (0.657) |
| del 1q42 11 | 78 (7%) | 1007 |
0.0181 (0.0407) |
0.024 (0.0528) |
0.045 (0.0895) |
0.634 (0.744) |
0.48 (0.616) |
0.00912 (0.0224) |
0.311 (0.454) |
0.212 (0.338) |
0.763 (0.855) |
| del 8q24 3 | 78 (7%) | 1007 |
0.0117 (0.0277) |
0.194 (0.315) |
0.0249 (0.0542) |
0.34 (0.488) |
0.0128 (0.0298) |
0.845 (0.908) |
0.082 (0.152) |
0.248 (0.388) |
1 (1.00) |
| del 11p15 5 | 234 (22%) | 851 |
0.609 (0.723) |
0.000556 (0.00175) |
0.46 (0.601) |
0.0516 (0.102) |
0.0111 (0.0264) |
0.537 (0.668) |
2e-05 (7.42e-05) |
0.796 (0.881) |
1 (1.00) |
| del 11p11 2 | 159 (15%) | 926 |
0.00242 (0.00692) |
0.396 (0.543) |
0.000295 (0.000962) |
0.259 (0.398) |
0.00294 (0.00819) |
0.672 (0.78) |
9e-05 (0.00031) |
0.654 (0.763) |
0.825 (0.896) |
| del 12p13 1 | 110 (10%) | 975 |
0.0432 (0.087) |
0.419 (0.561) |
0.00632 (0.0162) |
0.542 (0.671) |
0.154 (0.261) |
0.712 (0.816) |
0.0171 (0.0391) |
0.288 (0.434) |
0.116 (0.204) |
| amp 2p24 3 | 72 (7%) | 1013 |
0.0928 (0.168) |
0.705 (0.809) |
0.00724 (0.0184) |
0.537 (0.668) |
0.31 (0.454) |
0.391 (0.54) |
0.0689 (0.131) |
0.823 (0.895) |
0.757 (0.853) |
| del 2q37 1 | 121 (11%) | 964 |
0.472 (0.609) |
0.0265 (0.057) |
0.1 (0.177) |
0.496 (0.629) |
0.298 (0.443) |
0.475 (0.612) |
0.00601 (0.0155) |
0.389 (0.54) |
1 (1.00) |
| del 5q34 | 132 (12%) | 953 |
0.366 (0.513) |
0.0878 (0.16) |
0.926 (0.968) |
0.158 (0.265) |
0.00179 (0.00528) |
0.524 (0.659) |
0.00021 (0.000688) |
0.698 (0.802) |
1 (1.00) |
| amp 12p13 32 | 152 (14%) | 933 |
0.81 (0.889) |
0.0268 (0.0573) |
0.54 (0.67) |
0.287 (0.434) |
0.00973 (0.0236) |
0.875 (0.93) |
0.308 (0.452) |
0.742 (0.843) |
0.823 (0.895) |
| del 3q13 31 | 95 (9%) | 990 |
0.0798 (0.149) |
0.723 (0.825) |
0.237 (0.374) |
1 (1.00) |
0.0724 (0.137) |
0.452 (0.593) |
0.683 (0.788) |
0.481 (0.616) |
1 (1.00) |
| del 5p15 33 | 106 (10%) | 979 |
0.394 (0.542) |
0.627 (0.74) |
1 (1.00) |
0.679 (0.786) |
0.000381 (0.00123) |
0.296 (0.442) |
0.0259 (0.0559) |
0.743 (0.843) |
1 (1.00) |
| del xq21 1 | 183 (17%) | 902 |
0.477 (0.613) |
0.0306 (0.0641) |
0.194 (0.315) |
0.682 (0.788) |
0.564 (0.69) |
0.0818 (0.152) |
0.633 (0.744) |
0.696 (0.802) |
1 (1.00) |
| amp 11p13 | 59 (5%) | 1026 |
0.645 (0.755) |
0.918 (0.968) |
0.79 (0.878) |
0.416 (0.56) |
0.438 (0.581) |
0.413 (0.56) |
0.124 (0.215) |
0.926 (0.968) |
0.309 (0.453) |
| amp 13q34 | 54 (5%) | 1031 |
0.549 (0.676) |
0.99 (1.00) |
0.402 (0.548) |
0.396 (0.543) |
1 (1.00) |
0.0856 (0.157) |
0.587 (0.703) |
0.778 (0.87) |
1 (1.00) |
| del 3p21 31 | 109 (10%) | 976 |
0.866 (0.924) |
0.236 (0.373) |
1 (1.00) |
0.919 (0.968) |
0.00121 (0.00369) |
0.242 (0.38) |
0.593 (0.709) |
0.781 (0.872) |
0.203 (0.326) |
| del 12q12 | 147 (14%) | 938 |
0.828 (0.897) |
0.84 (0.906) |
0.929 (0.968) |
0.788 (0.877) |
0.29 (0.435) |
0.611 (0.724) |
0.00123 (0.00374) |
0.197 (0.318) |
0.257 (0.396) |
| del 12q15 | 142 (13%) | 943 |
0.87 (0.927) |
0.839 (0.906) |
0.528 (0.661) |
0.927 (0.968) |
0.392 (0.541) |
0.928 (0.968) |
0.00575 (0.0149) |
0.17 (0.283) |
1 (1.00) |
| del 1q44 | 69 (6%) | 1016 |
0.545 (0.674) |
0.642 (0.752) |
0.803 (0.885) |
0.45 (0.591) |
0.557 (0.683) |
0.86 (0.919) |
0.848 (0.91) |
0.931 (0.968) |
1 (1.00) |
| del 3q29 | 107 (10%) | 978 |
0.291 (0.436) |
0.914 (0.966) |
0.415 (0.56) |
0.607 (0.723) |
0.335 (0.482) |
0.181 (0.299) |
0.51 (0.645) |
0.879 (0.933) |
0.609 (0.723) |
| del 18q23 | 155 (14%) | 930 |
0.193 (0.315) |
0.283 (0.428) |
0.434 (0.577) |
0.253 (0.393) |
0.305 (0.449) |
0.748 (0.847) |
0.533 (0.665) |
0.238 (0.376) |
0.263 (0.403) |
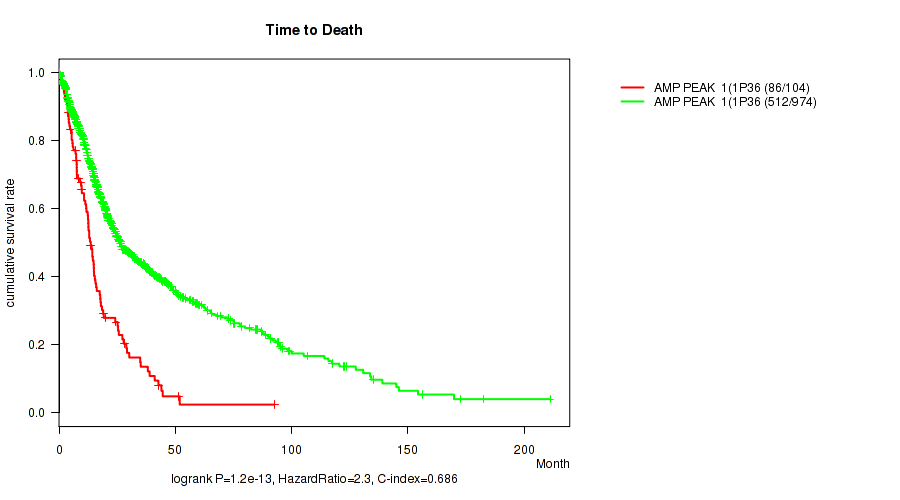
P value = 1.2e-13 (logrank test), Q value = 1.2e-12
Table S1. Gene #1: 'amp_1p36.21' versus Clinical Feature #1: 'Time to Death'
| nPatients | nDeath | Duration Range (Median), Month | |
|---|---|---|---|
| ALL | 1078 | 598 | 0.0 - 211.2 (16.0) |
| AMP PEAK 1(1P36.21) MUTATED | 104 | 86 | 0.1 - 92.7 (12.5) |
| AMP PEAK 1(1P36.21) WILD-TYPE | 974 | 512 | 0.0 - 211.2 (16.6) |
Figure S1. Get High-res Image Gene #1: 'amp_1p36.21' versus Clinical Feature #1: 'Time to Death'
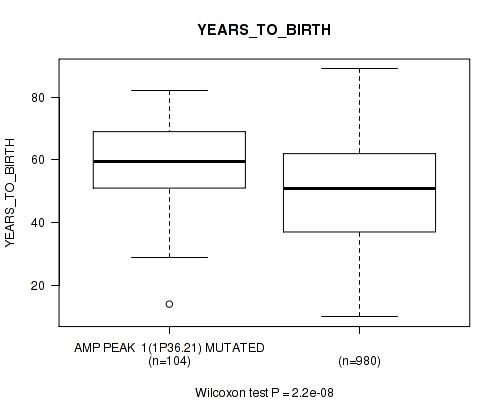
P value = 2.2e-08 (Wilcoxon-test), Q value = 1.4e-07
Table S2. Gene #1: 'amp_1p36.21' versus Clinical Feature #2: 'YEARS_TO_BIRTH'
| nPatients | Mean (Std.Dev) | |
|---|---|---|
| ALL | 1084 | 50.8 (15.8) |
| AMP PEAK 1(1P36.21) MUTATED | 104 | 58.7 (13.0) |
| AMP PEAK 1(1P36.21) WILD-TYPE | 980 | 50.0 (15.8) |
Figure S2. Get High-res Image Gene #1: 'amp_1p36.21' versus Clinical Feature #2: 'YEARS_TO_BIRTH'
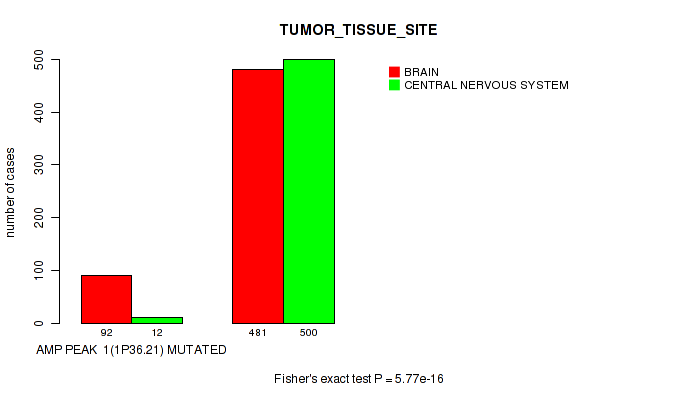
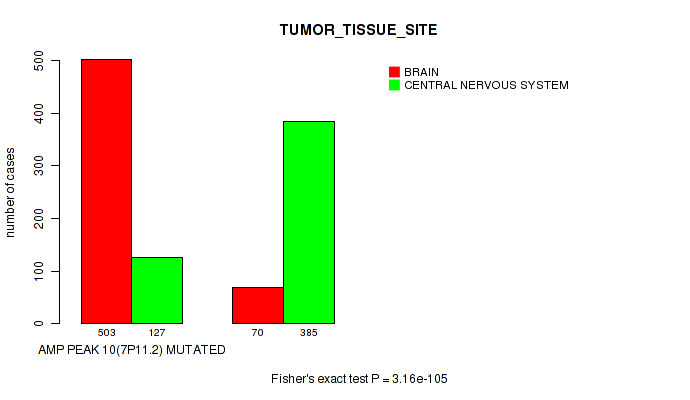
P value = 5.77e-16 (Fisher's exact test), Q value = 7.3e-15
Table S3. Gene #1: 'amp_1p36.21' versus Clinical Feature #3: 'TUMOR_TISSUE_SITE'
| nPatients | BRAIN | CENTRAL NERVOUS SYSTEM |
|---|---|---|
| ALL | 573 | 512 |
| AMP PEAK 1(1P36.21) MUTATED | 92 | 12 |
| AMP PEAK 1(1P36.21) WILD-TYPE | 481 | 500 |
Figure S3. Get High-res Image Gene #1: 'amp_1p36.21' versus Clinical Feature #3: 'TUMOR_TISSUE_SITE'
P value = 0.0522 (Fisher's exact test), Q value = 0.1
Table S4. Gene #1: 'amp_1p36.21' versus Clinical Feature #5: 'RADIATION_THERAPY'
| nPatients | NO | YES |
|---|---|---|
| ALL | 258 | 770 |
| AMP PEAK 1(1P36.21) MUTATED | 17 | 83 |
| AMP PEAK 1(1P36.21) WILD-TYPE | 241 | 687 |
Figure S4. Get High-res Image Gene #1: 'amp_1p36.21' versus Clinical Feature #5: 'RADIATION_THERAPY'

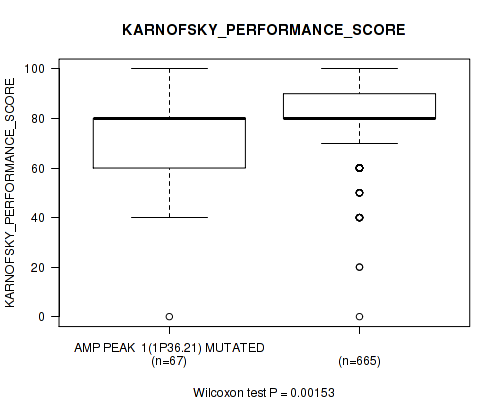
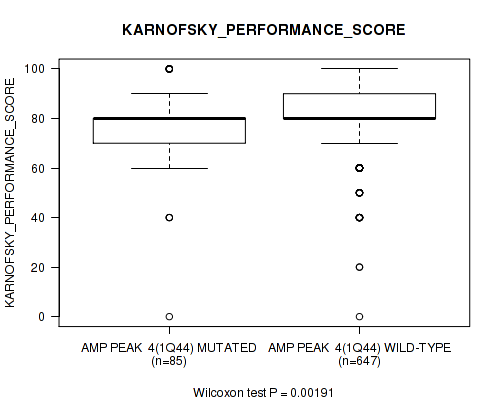
P value = 0.00153 (Wilcoxon-test), Q value = 0.0046
Table S5. Gene #1: 'amp_1p36.21' versus Clinical Feature #6: 'KARNOFSKY_PERFORMANCE_SCORE'
| nPatients | Mean (Std.Dev) | |
|---|---|---|
| ALL | 732 | 81.1 (15.3) |
| AMP PEAK 1(1P36.21) MUTATED | 67 | 75.5 (16.7) |
| AMP PEAK 1(1P36.21) WILD-TYPE | 665 | 81.6 (15.0) |
Figure S5. Get High-res Image Gene #1: 'amp_1p36.21' versus Clinical Feature #6: 'KARNOFSKY_PERFORMANCE_SCORE'
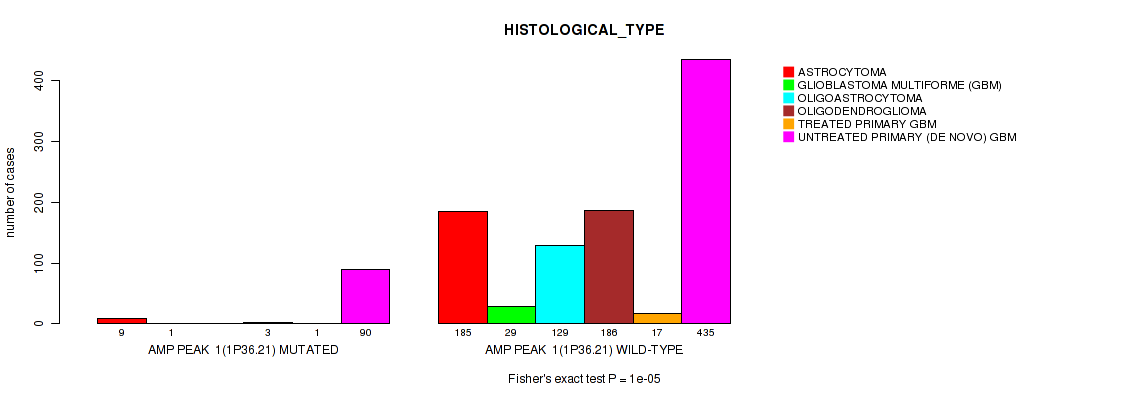
P value = 1e-05 (Fisher's exact test), Q value = 3.9e-05
Table S6. Gene #1: 'amp_1p36.21' versus Clinical Feature #7: 'HISTOLOGICAL_TYPE'
| nPatients | ASTROCYTOMA | GLIOBLASTOMA MULTIFORME (GBM) | OLIGOASTROCYTOMA | OLIGODENDROGLIOMA | TREATED PRIMARY GBM | UNTREATED PRIMARY (DE NOVO) GBM |
|---|---|---|---|---|---|---|
| ALL | 194 | 30 | 129 | 189 | 18 | 525 |
| AMP PEAK 1(1P36.21) MUTATED | 9 | 1 | 0 | 3 | 1 | 90 |
| AMP PEAK 1(1P36.21) WILD-TYPE | 185 | 29 | 129 | 186 | 17 | 435 |
Figure S6. Get High-res Image Gene #1: 'amp_1p36.21' versus Clinical Feature #7: 'HISTOLOGICAL_TYPE'
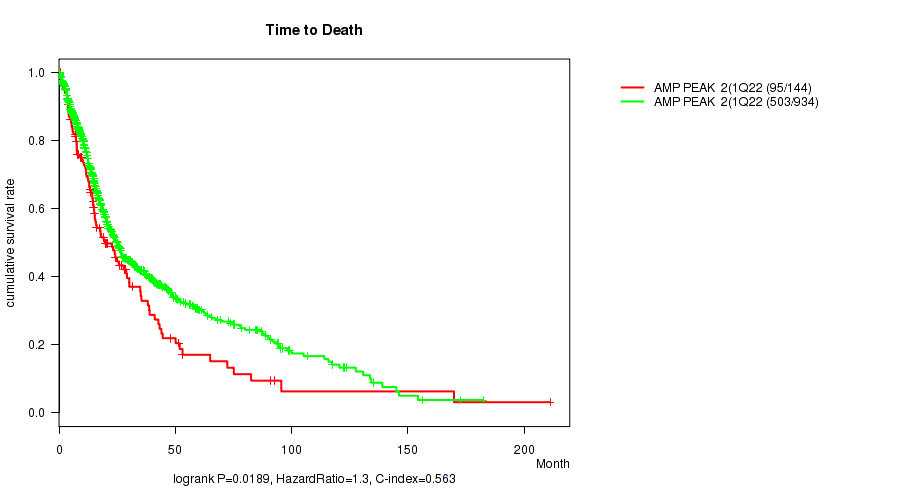
P value = 0.0189 (logrank test), Q value = 0.042
Table S7. Gene #2: 'amp_1q22' versus Clinical Feature #1: 'Time to Death'
| nPatients | nDeath | Duration Range (Median), Month | |
|---|---|---|---|
| ALL | 1078 | 598 | 0.0 - 211.2 (16.0) |
| AMP PEAK 2(1Q22) MUTATED | 144 | 95 | 0.1 - 211.2 (14.7) |
| AMP PEAK 2(1Q22) WILD-TYPE | 934 | 503 | 0.0 - 182.3 (16.3) |
Figure S7. Get High-res Image Gene #2: 'amp_1q22' versus Clinical Feature #1: 'Time to Death'
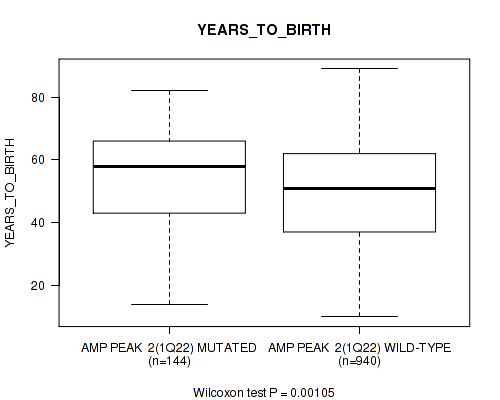
P value = 0.00105 (Wilcoxon-test), Q value = 0.0032
Table S8. Gene #2: 'amp_1q22' versus Clinical Feature #2: 'YEARS_TO_BIRTH'
| nPatients | Mean (Std.Dev) | |
|---|---|---|
| ALL | 1084 | 50.8 (15.8) |
| AMP PEAK 2(1Q22) MUTATED | 144 | 54.5 (15.5) |
| AMP PEAK 2(1Q22) WILD-TYPE | 940 | 50.2 (15.8) |
Figure S8. Get High-res Image Gene #2: 'amp_1q22' versus Clinical Feature #2: 'YEARS_TO_BIRTH'
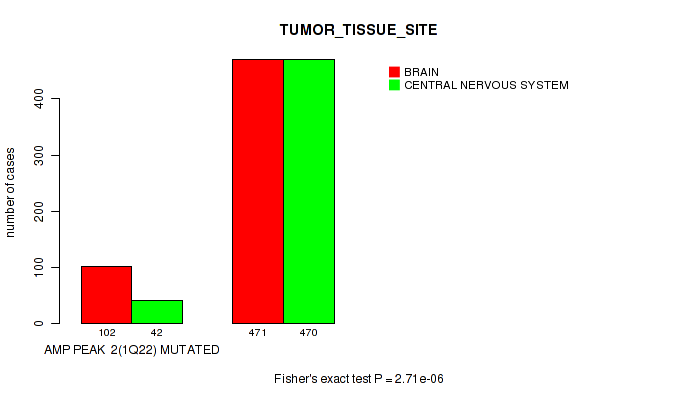
P value = 2.71e-06 (Fisher's exact test), Q value = 1.4e-05
Table S9. Gene #2: 'amp_1q22' versus Clinical Feature #3: 'TUMOR_TISSUE_SITE'
| nPatients | BRAIN | CENTRAL NERVOUS SYSTEM |
|---|---|---|
| ALL | 573 | 512 |
| AMP PEAK 2(1Q22) MUTATED | 102 | 42 |
| AMP PEAK 2(1Q22) WILD-TYPE | 471 | 470 |
Figure S9. Get High-res Image Gene #2: 'amp_1q22' versus Clinical Feature #3: 'TUMOR_TISSUE_SITE'
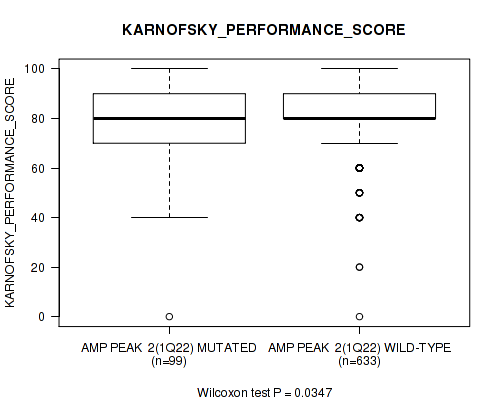
P value = 0.0347 (Wilcoxon-test), Q value = 0.072
Table S10. Gene #2: 'amp_1q22' versus Clinical Feature #6: 'KARNOFSKY_PERFORMANCE_SCORE'
| nPatients | Mean (Std.Dev) | |
|---|---|---|
| ALL | 732 | 81.1 (15.3) |
| AMP PEAK 2(1Q22) MUTATED | 99 | 78.0 (16.5) |
| AMP PEAK 2(1Q22) WILD-TYPE | 633 | 81.6 (15.1) |
Figure S10. Get High-res Image Gene #2: 'amp_1q22' versus Clinical Feature #6: 'KARNOFSKY_PERFORMANCE_SCORE'
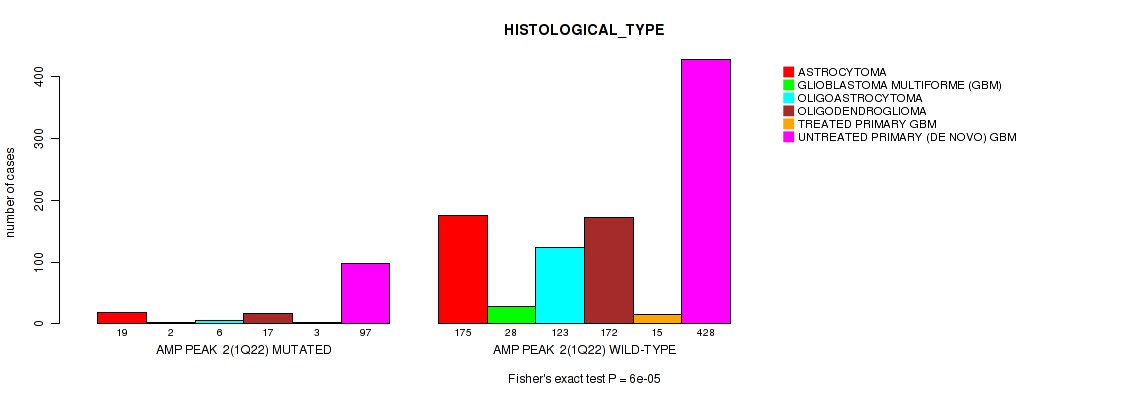
P value = 6e-05 (Fisher's exact test), Q value = 0.00021
Table S11. Gene #2: 'amp_1q22' versus Clinical Feature #7: 'HISTOLOGICAL_TYPE'
| nPatients | ASTROCYTOMA | GLIOBLASTOMA MULTIFORME (GBM) | OLIGOASTROCYTOMA | OLIGODENDROGLIOMA | TREATED PRIMARY GBM | UNTREATED PRIMARY (DE NOVO) GBM |
|---|---|---|---|---|---|---|
| ALL | 194 | 30 | 129 | 189 | 18 | 525 |
| AMP PEAK 2(1Q22) MUTATED | 19 | 2 | 6 | 17 | 3 | 97 |
| AMP PEAK 2(1Q22) WILD-TYPE | 175 | 28 | 123 | 172 | 15 | 428 |
Figure S11. Get High-res Image Gene #2: 'amp_1q22' versus Clinical Feature #7: 'HISTOLOGICAL_TYPE'
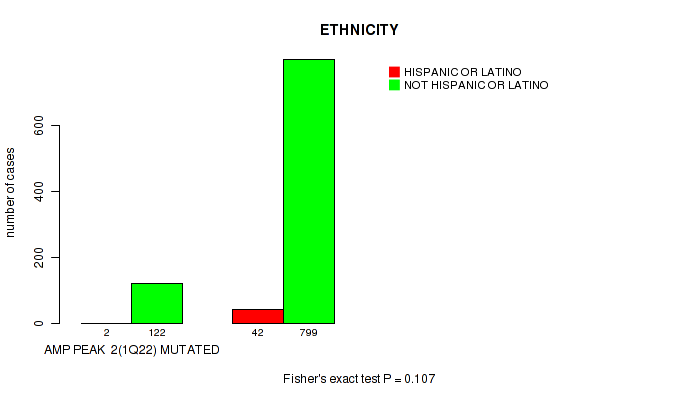
P value = 0.107 (Fisher's exact test), Q value = 0.19
Table S12. Gene #2: 'amp_1q22' versus Clinical Feature #9: 'ETHNICITY'
| nPatients | HISPANIC OR LATINO | NOT HISPANIC OR LATINO |
|---|---|---|
| ALL | 44 | 921 |
| AMP PEAK 2(1Q22) MUTATED | 2 | 122 |
| AMP PEAK 2(1Q22) WILD-TYPE | 42 | 799 |
Figure S12. Get High-res Image Gene #2: 'amp_1q22' versus Clinical Feature #9: 'ETHNICITY'
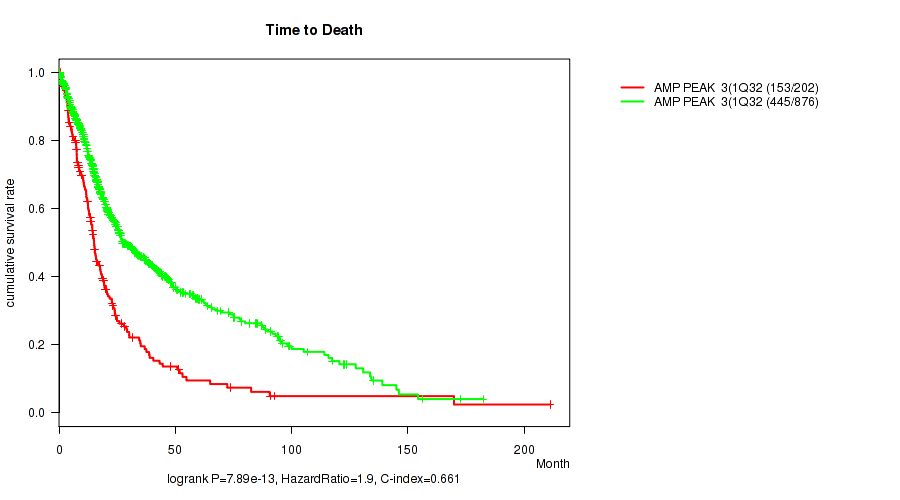
P value = 7.89e-13 (logrank test), Q value = 7.4e-12
Table S13. Gene #3: 'amp_1q32.1' versus Clinical Feature #1: 'Time to Death'
| nPatients | nDeath | Duration Range (Median), Month | |
|---|---|---|---|
| ALL | 1078 | 598 | 0.0 - 211.2 (16.0) |
| AMP PEAK 3(1Q32.1) MUTATED | 202 | 153 | 0.1 - 211.2 (13.4) |
| AMP PEAK 3(1Q32.1) WILD-TYPE | 876 | 445 | 0.0 - 182.3 (16.9) |
Figure S13. Get High-res Image Gene #3: 'amp_1q32.1' versus Clinical Feature #1: 'Time to Death'
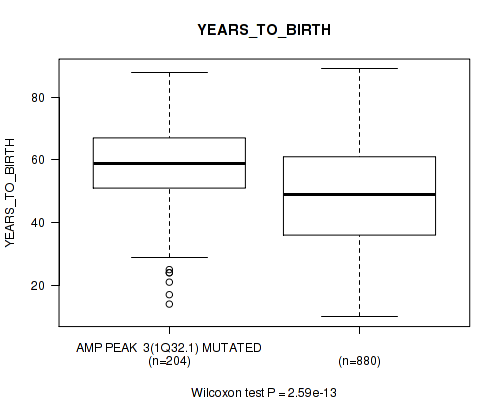
P value = 2.59e-13 (Wilcoxon-test), Q value = 2.5e-12
Table S14. Gene #3: 'amp_1q32.1' versus Clinical Feature #2: 'YEARS_TO_BIRTH'
| nPatients | Mean (Std.Dev) | |
|---|---|---|
| ALL | 1084 | 50.8 (15.8) |
| AMP PEAK 3(1Q32.1) MUTATED | 204 | 57.9 (14.0) |
| AMP PEAK 3(1Q32.1) WILD-TYPE | 880 | 49.2 (15.7) |
Figure S14. Get High-res Image Gene #3: 'amp_1q32.1' versus Clinical Feature #2: 'YEARS_TO_BIRTH'
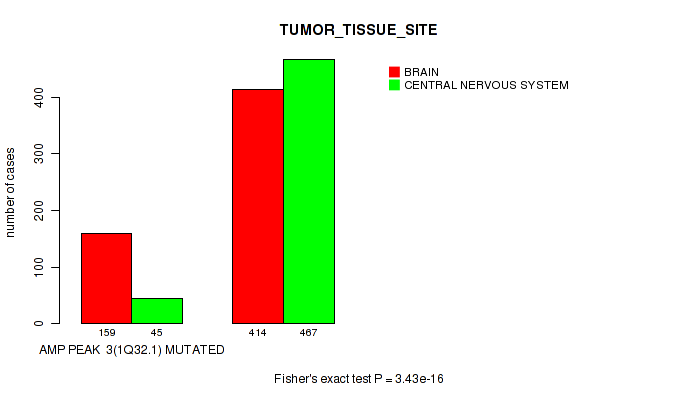
P value = 3.43e-16 (Fisher's exact test), Q value = 4.5e-15
Table S15. Gene #3: 'amp_1q32.1' versus Clinical Feature #3: 'TUMOR_TISSUE_SITE'
| nPatients | BRAIN | CENTRAL NERVOUS SYSTEM |
|---|---|---|
| ALL | 573 | 512 |
| AMP PEAK 3(1Q32.1) MUTATED | 159 | 45 |
| AMP PEAK 3(1Q32.1) WILD-TYPE | 414 | 467 |
Figure S15. Get High-res Image Gene #3: 'amp_1q32.1' versus Clinical Feature #3: 'TUMOR_TISSUE_SITE'
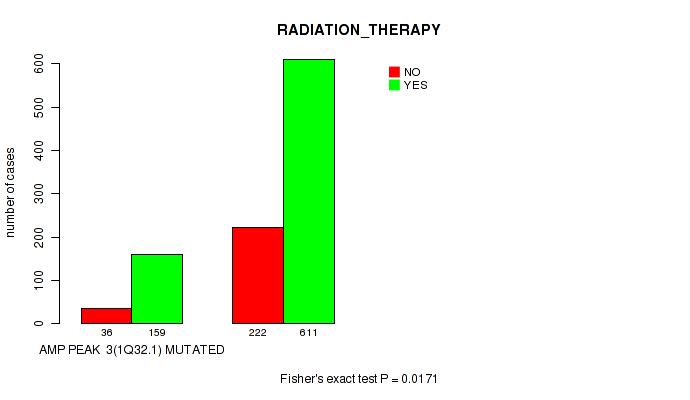
P value = 0.0171 (Fisher's exact test), Q value = 0.039
Table S16. Gene #3: 'amp_1q32.1' versus Clinical Feature #5: 'RADIATION_THERAPY'
| nPatients | NO | YES |
|---|---|---|
| ALL | 258 | 770 |
| AMP PEAK 3(1Q32.1) MUTATED | 36 | 159 |
| AMP PEAK 3(1Q32.1) WILD-TYPE | 222 | 611 |
Figure S16. Get High-res Image Gene #3: 'amp_1q32.1' versus Clinical Feature #5: 'RADIATION_THERAPY'
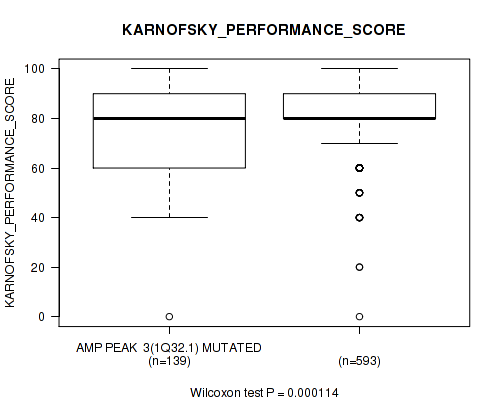
P value = 0.000114 (Wilcoxon-test), Q value = 0.00039
Table S17. Gene #3: 'amp_1q32.1' versus Clinical Feature #6: 'KARNOFSKY_PERFORMANCE_SCORE'
| nPatients | Mean (Std.Dev) | |
|---|---|---|
| ALL | 732 | 81.1 (15.3) |
| AMP PEAK 3(1Q32.1) MUTATED | 139 | 76.6 (16.3) |
| AMP PEAK 3(1Q32.1) WILD-TYPE | 593 | 82.1 (14.9) |
Figure S17. Get High-res Image Gene #3: 'amp_1q32.1' versus Clinical Feature #6: 'KARNOFSKY_PERFORMANCE_SCORE'
P value = 1e-05 (Fisher's exact test), Q value = 3.9e-05
Table S18. Gene #3: 'amp_1q32.1' versus Clinical Feature #7: 'HISTOLOGICAL_TYPE'
| nPatients | ASTROCYTOMA | GLIOBLASTOMA MULTIFORME (GBM) | OLIGOASTROCYTOMA | OLIGODENDROGLIOMA | TREATED PRIMARY GBM | UNTREATED PRIMARY (DE NOVO) GBM |
|---|---|---|---|---|---|---|
| ALL | 194 | 30 | 129 | 189 | 18 | 525 |
| AMP PEAK 3(1Q32.1) MUTATED | 23 | 8 | 7 | 15 | 5 | 146 |
| AMP PEAK 3(1Q32.1) WILD-TYPE | 171 | 22 | 122 | 174 | 13 | 379 |
Figure S18. Get High-res Image Gene #3: 'amp_1q32.1' versus Clinical Feature #7: 'HISTOLOGICAL_TYPE'
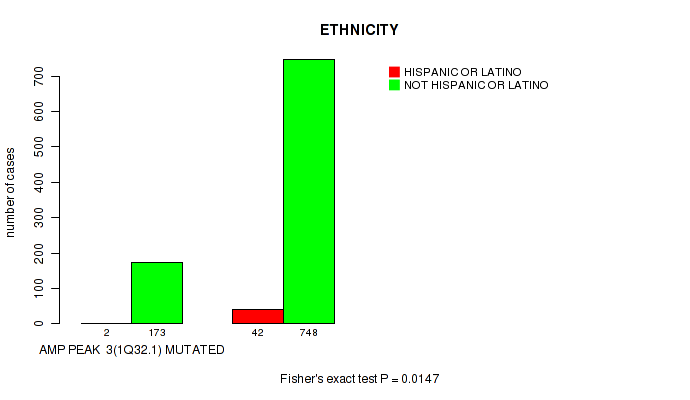
P value = 0.0147 (Fisher's exact test), Q value = 0.034
Table S19. Gene #3: 'amp_1q32.1' versus Clinical Feature #9: 'ETHNICITY'
| nPatients | HISPANIC OR LATINO | NOT HISPANIC OR LATINO |
|---|---|---|
| ALL | 44 | 921 |
| AMP PEAK 3(1Q32.1) MUTATED | 2 | 173 |
| AMP PEAK 3(1Q32.1) WILD-TYPE | 42 | 748 |
Figure S19. Get High-res Image Gene #3: 'amp_1q32.1' versus Clinical Feature #9: 'ETHNICITY'
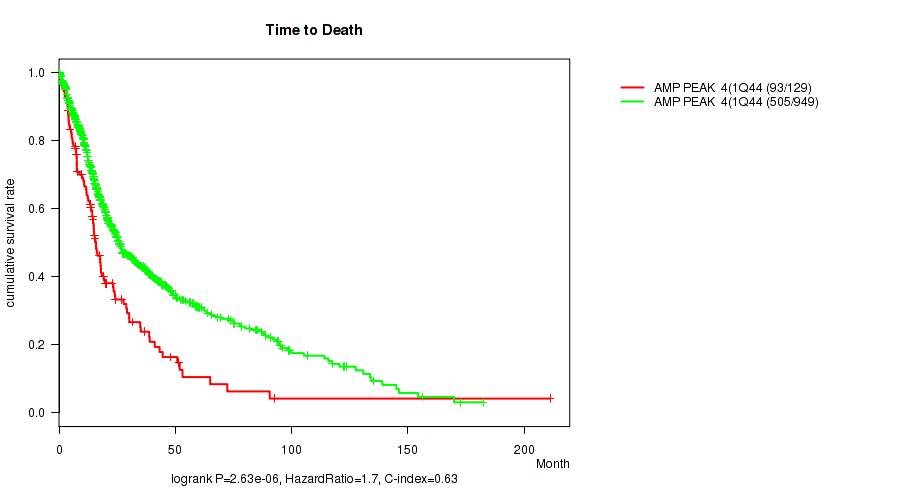
P value = 2.63e-06 (logrank test), Q value = 1.4e-05
Table S20. Gene #4: 'amp_1q44' versus Clinical Feature #1: 'Time to Death'
| nPatients | nDeath | Duration Range (Median), Month | |
|---|---|---|---|
| ALL | 1078 | 598 | 0.0 - 211.2 (16.0) |
| AMP PEAK 4(1Q44) MUTATED | 129 | 93 | 0.1 - 211.2 (14.3) |
| AMP PEAK 4(1Q44) WILD-TYPE | 949 | 505 | 0.0 - 182.3 (16.5) |
Figure S20. Get High-res Image Gene #4: 'amp_1q44' versus Clinical Feature #1: 'Time to Death'
P value = 3.28e-06 (Wilcoxon-test), Q value = 1.7e-05
Table S21. Gene #4: 'amp_1q44' versus Clinical Feature #2: 'YEARS_TO_BIRTH'
| nPatients | Mean (Std.Dev) | |
|---|---|---|
| ALL | 1084 | 50.8 (15.8) |
| AMP PEAK 4(1Q44) MUTATED | 129 | 56.6 (14.5) |
| AMP PEAK 4(1Q44) WILD-TYPE | 955 | 50.0 (15.8) |
Figure S21. Get High-res Image Gene #4: 'amp_1q44' versus Clinical Feature #2: 'YEARS_TO_BIRTH'

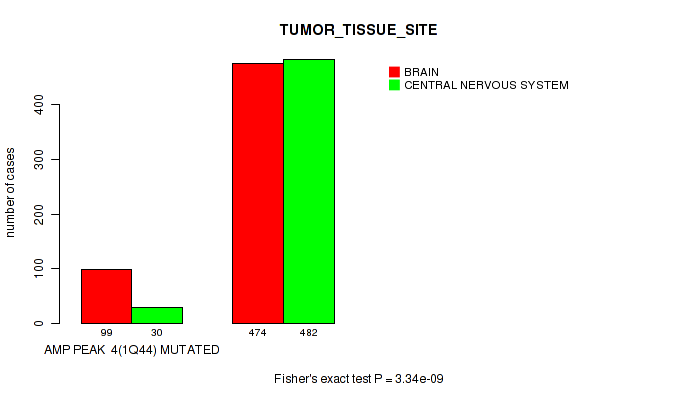
P value = 3.34e-09 (Fisher's exact test), Q value = 2.1e-08
Table S22. Gene #4: 'amp_1q44' versus Clinical Feature #3: 'TUMOR_TISSUE_SITE'
| nPatients | BRAIN | CENTRAL NERVOUS SYSTEM |
|---|---|---|
| ALL | 573 | 512 |
| AMP PEAK 4(1Q44) MUTATED | 99 | 30 |
| AMP PEAK 4(1Q44) WILD-TYPE | 474 | 482 |
Figure S22. Get High-res Image Gene #4: 'amp_1q44' versus Clinical Feature #3: 'TUMOR_TISSUE_SITE'
P value = 0.123 (Fisher's exact test), Q value = 0.21
Table S23. Gene #4: 'amp_1q44' versus Clinical Feature #5: 'RADIATION_THERAPY'
| nPatients | NO | YES |
|---|---|---|
| ALL | 258 | 770 |
| AMP PEAK 4(1Q44) MUTATED | 24 | 100 |
| AMP PEAK 4(1Q44) WILD-TYPE | 234 | 670 |
Figure S23. Get High-res Image Gene #4: 'amp_1q44' versus Clinical Feature #5: 'RADIATION_THERAPY'

P value = 0.00191 (Wilcoxon-test), Q value = 0.0056
Table S24. Gene #4: 'amp_1q44' versus Clinical Feature #6: 'KARNOFSKY_PERFORMANCE_SCORE'
| nPatients | Mean (Std.Dev) | |
|---|---|---|
| ALL | 732 | 81.1 (15.3) |
| AMP PEAK 4(1Q44) MUTATED | 85 | 76.5 (16.5) |
| AMP PEAK 4(1Q44) WILD-TYPE | 647 | 81.7 (15.0) |
Figure S24. Get High-res Image Gene #4: 'amp_1q44' versus Clinical Feature #6: 'KARNOFSKY_PERFORMANCE_SCORE'
P value = 1e-05 (Fisher's exact test), Q value = 3.9e-05
Table S25. Gene #4: 'amp_1q44' versus Clinical Feature #7: 'HISTOLOGICAL_TYPE'
| nPatients | ASTROCYTOMA | GLIOBLASTOMA MULTIFORME (GBM) | OLIGOASTROCYTOMA | OLIGODENDROGLIOMA | TREATED PRIMARY GBM | UNTREATED PRIMARY (DE NOVO) GBM |
|---|---|---|---|---|---|---|
| ALL | 194 | 30 | 129 | 189 | 18 | 525 |
| AMP PEAK 4(1Q44) MUTATED | 15 | 2 | 5 | 10 | 3 | 94 |
| AMP PEAK 4(1Q44) WILD-TYPE | 179 | 28 | 124 | 179 | 15 | 431 |
Figure S25. Get High-res Image Gene #4: 'amp_1q44' versus Clinical Feature #7: 'HISTOLOGICAL_TYPE'

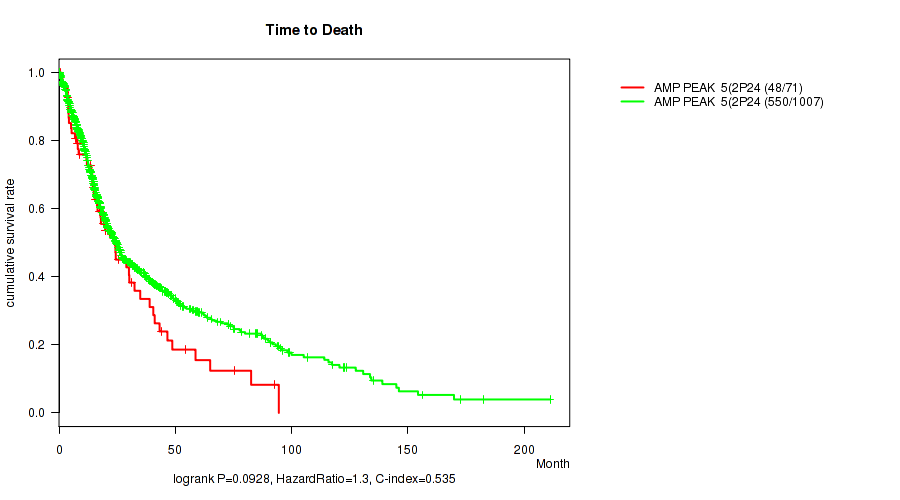
P value = 0.0928 (logrank test), Q value = 0.17
Table S26. Gene #5: 'amp_2p24.3' versus Clinical Feature #1: 'Time to Death'
| nPatients | nDeath | Duration Range (Median), Month | |
|---|---|---|---|
| ALL | 1078 | 598 | 0.0 - 211.2 (16.0) |
| AMP PEAK 5(2P24.3) MUTATED | 71 | 48 | 0.1 - 94.5 (16.4) |
| AMP PEAK 5(2P24.3) WILD-TYPE | 1007 | 550 | 0.0 - 211.2 (16.0) |
Figure S26. Get High-res Image Gene #5: 'amp_2p24.3' versus Clinical Feature #1: 'Time to Death'
P value = 0.00724 (Fisher's exact test), Q value = 0.018
Table S27. Gene #5: 'amp_2p24.3' versus Clinical Feature #3: 'TUMOR_TISSUE_SITE'
| nPatients | BRAIN | CENTRAL NERVOUS SYSTEM |
|---|---|---|
| ALL | 573 | 512 |
| AMP PEAK 5(2P24.3) MUTATED | 49 | 23 |
| AMP PEAK 5(2P24.3) WILD-TYPE | 524 | 489 |
Figure S27. Get High-res Image Gene #5: 'amp_2p24.3' versus Clinical Feature #3: 'TUMOR_TISSUE_SITE'

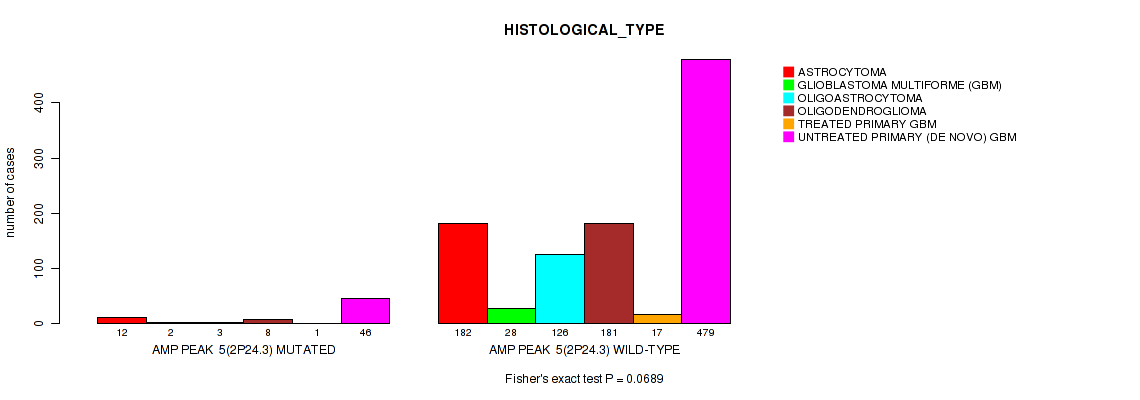
P value = 0.0689 (Fisher's exact test), Q value = 0.13
Table S28. Gene #5: 'amp_2p24.3' versus Clinical Feature #7: 'HISTOLOGICAL_TYPE'
| nPatients | ASTROCYTOMA | GLIOBLASTOMA MULTIFORME (GBM) | OLIGOASTROCYTOMA | OLIGODENDROGLIOMA | TREATED PRIMARY GBM | UNTREATED PRIMARY (DE NOVO) GBM |
|---|---|---|---|---|---|---|
| ALL | 194 | 30 | 129 | 189 | 18 | 525 |
| AMP PEAK 5(2P24.3) MUTATED | 12 | 2 | 3 | 8 | 1 | 46 |
| AMP PEAK 5(2P24.3) WILD-TYPE | 182 | 28 | 126 | 181 | 17 | 479 |
Figure S28. Get High-res Image Gene #5: 'amp_2p24.3' versus Clinical Feature #7: 'HISTOLOGICAL_TYPE'
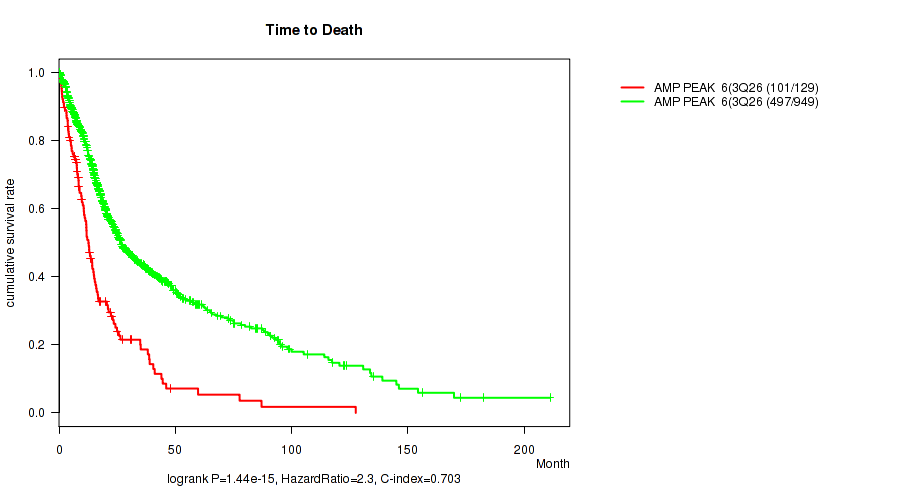
P value = 1.44e-15 (logrank test), Q value = 1.8e-14
Table S29. Gene #6: 'amp_3q26.33' versus Clinical Feature #1: 'Time to Death'
| nPatients | nDeath | Duration Range (Median), Month | |
|---|---|---|---|
| ALL | 1078 | 598 | 0.0 - 211.2 (16.0) |
| AMP PEAK 6(3Q26.33) MUTATED | 129 | 101 | 0.1 - 127.6 (10.6) |
| AMP PEAK 6(3Q26.33) WILD-TYPE | 949 | 497 | 0.0 - 211.2 (16.9) |
Figure S29. Get High-res Image Gene #6: 'amp_3q26.33' versus Clinical Feature #1: 'Time to Death'
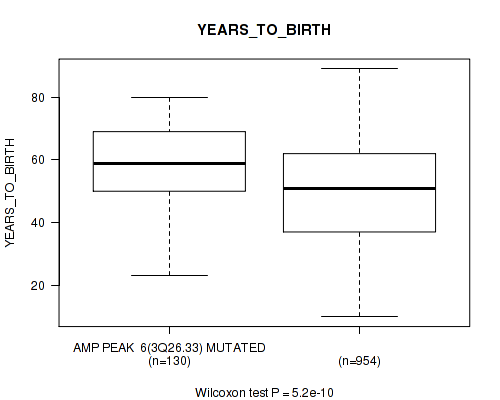
P value = 5.2e-10 (Wilcoxon-test), Q value = 3.7e-09
Table S30. Gene #6: 'amp_3q26.33' versus Clinical Feature #2: 'YEARS_TO_BIRTH'
| nPatients | Mean (Std.Dev) | |
|---|---|---|
| ALL | 1084 | 50.8 (15.8) |
| AMP PEAK 6(3Q26.33) MUTATED | 130 | 58.7 (12.9) |
| AMP PEAK 6(3Q26.33) WILD-TYPE | 954 | 49.7 (15.8) |
Figure S30. Get High-res Image Gene #6: 'amp_3q26.33' versus Clinical Feature #2: 'YEARS_TO_BIRTH'
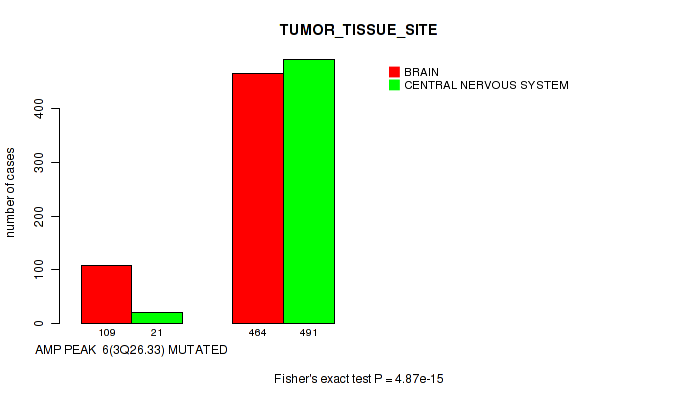
P value = 4.87e-15 (Fisher's exact test), Q value = 5.7e-14
Table S31. Gene #6: 'amp_3q26.33' versus Clinical Feature #3: 'TUMOR_TISSUE_SITE'
| nPatients | BRAIN | CENTRAL NERVOUS SYSTEM |
|---|---|---|
| ALL | 573 | 512 |
| AMP PEAK 6(3Q26.33) MUTATED | 109 | 21 |
| AMP PEAK 6(3Q26.33) WILD-TYPE | 464 | 491 |
Figure S31. Get High-res Image Gene #6: 'amp_3q26.33' versus Clinical Feature #3: 'TUMOR_TISSUE_SITE'
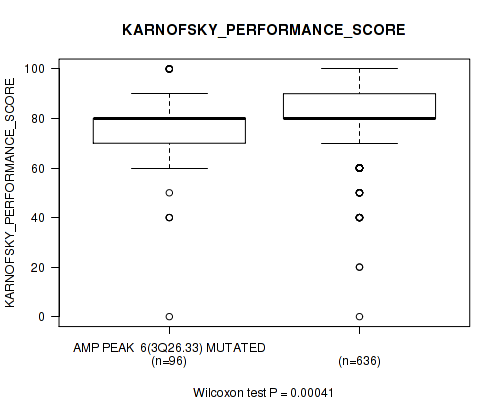
P value = 0.00041 (Wilcoxon-test), Q value = 0.0013
Table S32. Gene #6: 'amp_3q26.33' versus Clinical Feature #6: 'KARNOFSKY_PERFORMANCE_SCORE'
| nPatients | Mean (Std.Dev) | |
|---|---|---|
| ALL | 732 | 81.1 (15.3) |
| AMP PEAK 6(3Q26.33) MUTATED | 96 | 76.6 (15.3) |
| AMP PEAK 6(3Q26.33) WILD-TYPE | 636 | 81.8 (15.2) |
Figure S32. Get High-res Image Gene #6: 'amp_3q26.33' versus Clinical Feature #6: 'KARNOFSKY_PERFORMANCE_SCORE'
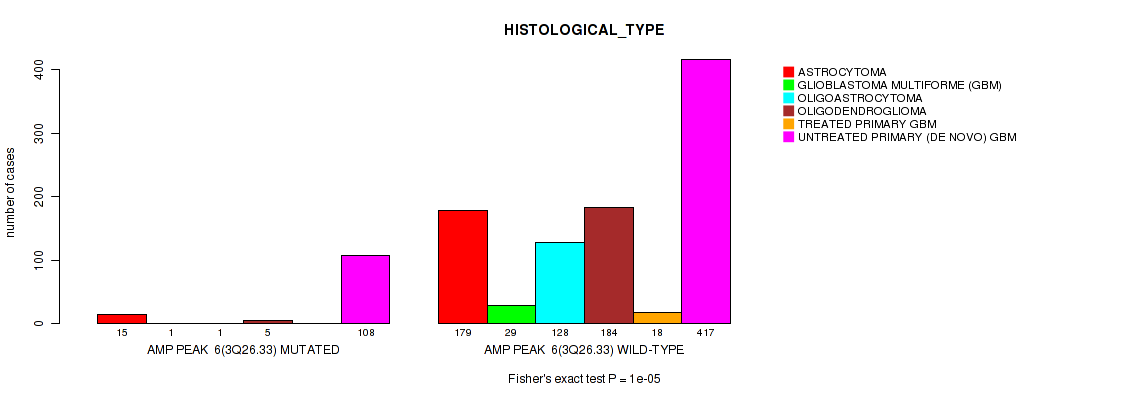
P value = 1e-05 (Fisher's exact test), Q value = 3.9e-05
Table S33. Gene #6: 'amp_3q26.33' versus Clinical Feature #7: 'HISTOLOGICAL_TYPE'
| nPatients | ASTROCYTOMA | GLIOBLASTOMA MULTIFORME (GBM) | OLIGOASTROCYTOMA | OLIGODENDROGLIOMA | TREATED PRIMARY GBM | UNTREATED PRIMARY (DE NOVO) GBM |
|---|---|---|---|---|---|---|
| ALL | 194 | 30 | 129 | 189 | 18 | 525 |
| AMP PEAK 6(3Q26.33) MUTATED | 15 | 1 | 1 | 5 | 0 | 108 |
| AMP PEAK 6(3Q26.33) WILD-TYPE | 179 | 29 | 128 | 184 | 18 | 417 |
Figure S33. Get High-res Image Gene #6: 'amp_3q26.33' versus Clinical Feature #7: 'HISTOLOGICAL_TYPE'
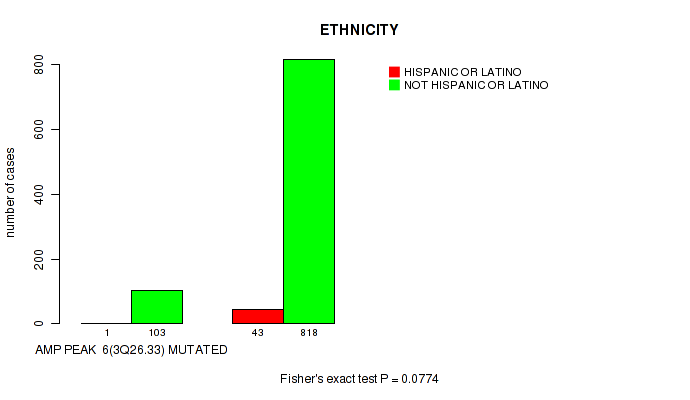
P value = 0.0774 (Fisher's exact test), Q value = 0.15
Table S34. Gene #6: 'amp_3q26.33' versus Clinical Feature #9: 'ETHNICITY'
| nPatients | HISPANIC OR LATINO | NOT HISPANIC OR LATINO |
|---|---|---|
| ALL | 44 | 921 |
| AMP PEAK 6(3Q26.33) MUTATED | 1 | 103 |
| AMP PEAK 6(3Q26.33) WILD-TYPE | 43 | 818 |
Figure S34. Get High-res Image Gene #6: 'amp_3q26.33' versus Clinical Feature #9: 'ETHNICITY'
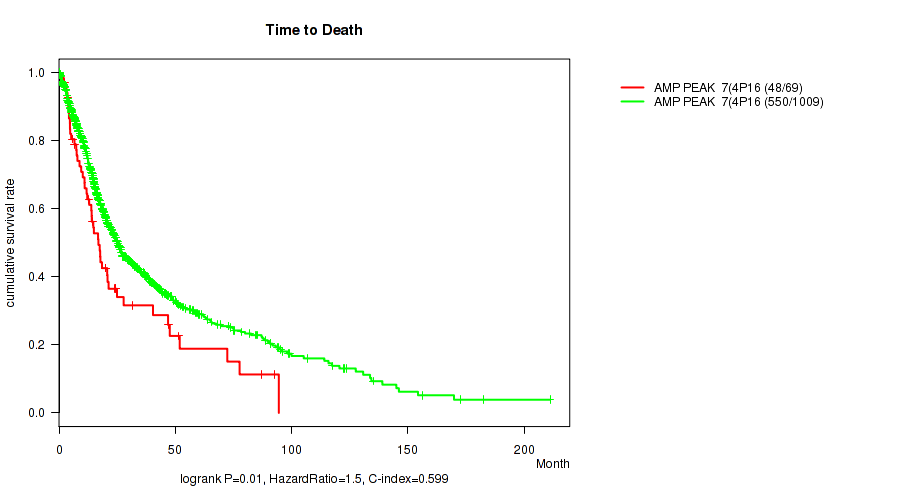
P value = 0.01 (logrank test), Q value = 0.024
Table S35. Gene #7: 'amp_4p16.3' versus Clinical Feature #1: 'Time to Death'
| nPatients | nDeath | Duration Range (Median), Month | |
|---|---|---|---|
| ALL | 1078 | 598 | 0.0 - 211.2 (16.0) |
| AMP PEAK 7(4P16.3) MUTATED | 69 | 48 | 0.2 - 94.5 (14.1) |
| AMP PEAK 7(4P16.3) WILD-TYPE | 1009 | 550 | 0.0 - 211.2 (16.1) |
Figure S35. Get High-res Image Gene #7: 'amp_4p16.3' versus Clinical Feature #1: 'Time to Death'
P value = 0.0341 (Wilcoxon-test), Q value = 0.071
Table S36. Gene #7: 'amp_4p16.3' versus Clinical Feature #2: 'YEARS_TO_BIRTH'
| nPatients | Mean (Std.Dev) | |
|---|---|---|
| ALL | 1084 | 50.8 (15.8) |
| AMP PEAK 7(4P16.3) MUTATED | 69 | 54.5 (14.5) |
| AMP PEAK 7(4P16.3) WILD-TYPE | 1015 | 50.6 (15.9) |
Figure S36. Get High-res Image Gene #7: 'amp_4p16.3' versus Clinical Feature #2: 'YEARS_TO_BIRTH'

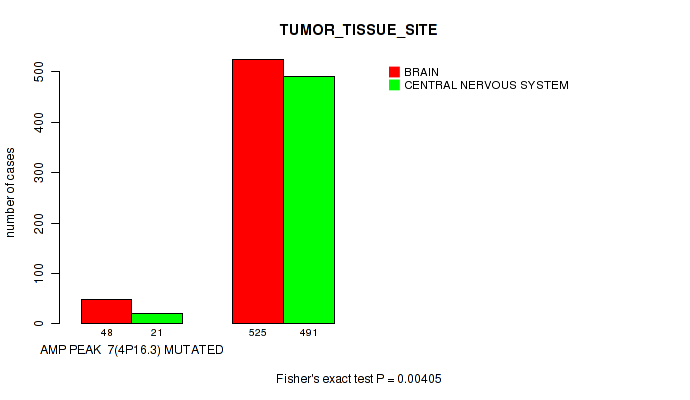
P value = 0.00405 (Fisher's exact test), Q value = 0.011
Table S37. Gene #7: 'amp_4p16.3' versus Clinical Feature #3: 'TUMOR_TISSUE_SITE'
| nPatients | BRAIN | CENTRAL NERVOUS SYSTEM |
|---|---|---|
| ALL | 573 | 512 |
| AMP PEAK 7(4P16.3) MUTATED | 48 | 21 |
| AMP PEAK 7(4P16.3) WILD-TYPE | 525 | 491 |
Figure S37. Get High-res Image Gene #7: 'amp_4p16.3' versus Clinical Feature #3: 'TUMOR_TISSUE_SITE'
P value = 0.0272 (Fisher's exact test), Q value = 0.058
Table S38. Gene #7: 'amp_4p16.3' versus Clinical Feature #5: 'RADIATION_THERAPY'
| nPatients | NO | YES |
|---|---|---|
| ALL | 258 | 770 |
| AMP PEAK 7(4P16.3) MUTATED | 9 | 57 |
| AMP PEAK 7(4P16.3) WILD-TYPE | 249 | 713 |
Figure S38. Get High-res Image Gene #7: 'amp_4p16.3' versus Clinical Feature #5: 'RADIATION_THERAPY'

P value = 0.0409 (Fisher's exact test), Q value = 0.083
Table S39. Gene #7: 'amp_4p16.3' versus Clinical Feature #7: 'HISTOLOGICAL_TYPE'
| nPatients | ASTROCYTOMA | GLIOBLASTOMA MULTIFORME (GBM) | OLIGOASTROCYTOMA | OLIGODENDROGLIOMA | TREATED PRIMARY GBM | UNTREATED PRIMARY (DE NOVO) GBM |
|---|---|---|---|---|---|---|
| ALL | 194 | 30 | 129 | 189 | 18 | 525 |
| AMP PEAK 7(4P16.3) MUTATED | 11 | 1 | 3 | 7 | 1 | 46 |
| AMP PEAK 7(4P16.3) WILD-TYPE | 183 | 29 | 126 | 182 | 17 | 479 |
Figure S39. Get High-res Image Gene #7: 'amp_4p16.3' versus Clinical Feature #7: 'HISTOLOGICAL_TYPE'

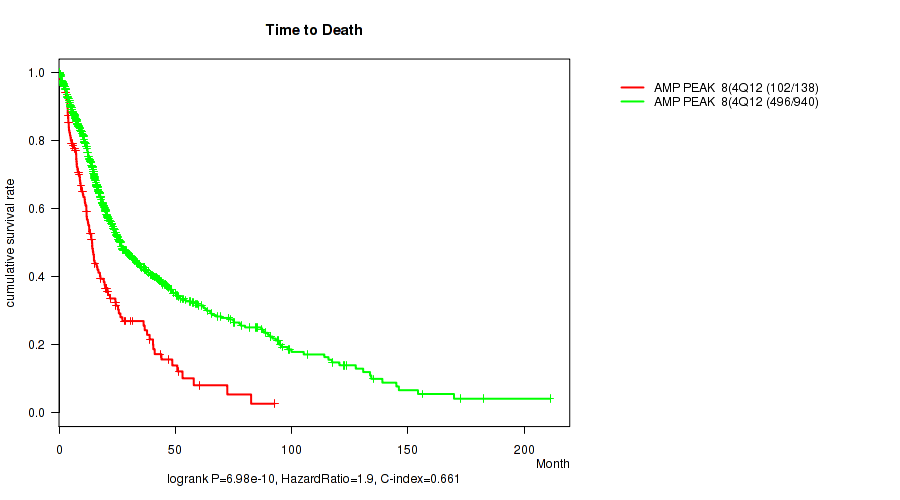
P value = 6.98e-10 (logrank test), Q value = 4.9e-09
Table S40. Gene #8: 'amp_4q12' versus Clinical Feature #1: 'Time to Death'
| nPatients | nDeath | Duration Range (Median), Month | |
|---|---|---|---|
| ALL | 1078 | 598 | 0.0 - 211.2 (16.0) |
| AMP PEAK 8(4Q12) MUTATED | 138 | 102 | 0.1 - 92.7 (11.9) |
| AMP PEAK 8(4Q12) WILD-TYPE | 940 | 496 | 0.0 - 211.2 (16.7) |
Figure S40. Get High-res Image Gene #8: 'amp_4q12' versus Clinical Feature #1: 'Time to Death'
P value = 5.29e-06 (Wilcoxon-test), Q value = 2.7e-05
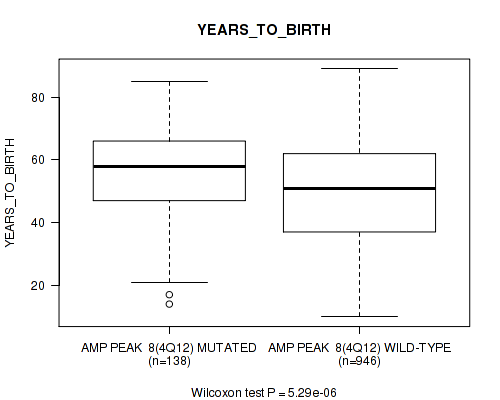
Table S41. Gene #8: 'amp_4q12' versus Clinical Feature #2: 'YEARS_TO_BIRTH'
| nPatients | Mean (Std.Dev) | |
|---|---|---|
| ALL | 1084 | 50.8 (15.8) |
| AMP PEAK 8(4Q12) MUTATED | 138 | 56.2 (15.1) |
| AMP PEAK 8(4Q12) WILD-TYPE | 946 | 50.0 (15.7) |
Figure S41. Get High-res Image Gene #8: 'amp_4q12' versus Clinical Feature #2: 'YEARS_TO_BIRTH'
P value = 7.12e-11 (Fisher's exact test), Q value = 5.8e-10
Table S42. Gene #8: 'amp_4q12' versus Clinical Feature #3: 'TUMOR_TISSUE_SITE'
| nPatients | BRAIN | CENTRAL NERVOUS SYSTEM |
|---|---|---|
| ALL | 573 | 512 |
| AMP PEAK 8(4Q12) MUTATED | 108 | 30 |
| AMP PEAK 8(4Q12) WILD-TYPE | 465 | 482 |
Figure S42. Get High-res Image Gene #8: 'amp_4q12' versus Clinical Feature #3: 'TUMOR_TISSUE_SITE'

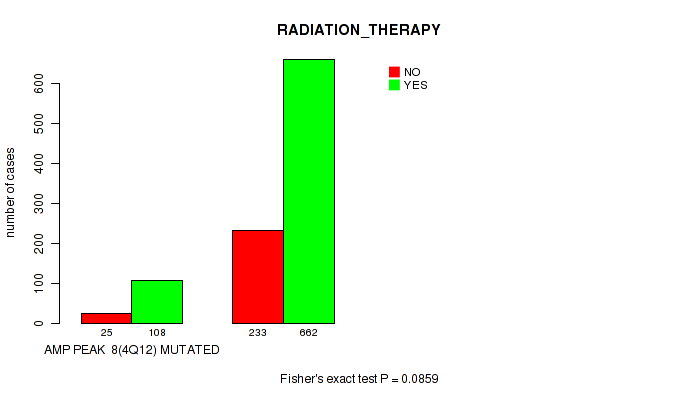
P value = 0.0859 (Fisher's exact test), Q value = 0.16
Table S43. Gene #8: 'amp_4q12' versus Clinical Feature #5: 'RADIATION_THERAPY'
| nPatients | NO | YES |
|---|---|---|
| ALL | 258 | 770 |
| AMP PEAK 8(4Q12) MUTATED | 25 | 108 |
| AMP PEAK 8(4Q12) WILD-TYPE | 233 | 662 |
Figure S43. Get High-res Image Gene #8: 'amp_4q12' versus Clinical Feature #5: 'RADIATION_THERAPY'
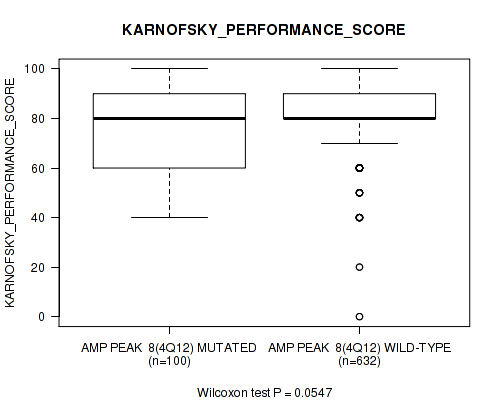
P value = 0.0547 (Wilcoxon-test), Q value = 0.11
Table S44. Gene #8: 'amp_4q12' versus Clinical Feature #6: 'KARNOFSKY_PERFORMANCE_SCORE'
| nPatients | Mean (Std.Dev) | |
|---|---|---|
| ALL | 732 | 81.1 (15.3) |
| AMP PEAK 8(4Q12) MUTATED | 100 | 78.7 (15.4) |
| AMP PEAK 8(4Q12) WILD-TYPE | 632 | 81.5 (15.2) |
Figure S44. Get High-res Image Gene #8: 'amp_4q12' versus Clinical Feature #6: 'KARNOFSKY_PERFORMANCE_SCORE'
P value = 1e-05 (Fisher's exact test), Q value = 3.9e-05
Table S45. Gene #8: 'amp_4q12' versus Clinical Feature #7: 'HISTOLOGICAL_TYPE'
| nPatients | ASTROCYTOMA | GLIOBLASTOMA MULTIFORME (GBM) | OLIGOASTROCYTOMA | OLIGODENDROGLIOMA | TREATED PRIMARY GBM | UNTREATED PRIMARY (DE NOVO) GBM |
|---|---|---|---|---|---|---|
| ALL | 194 | 30 | 129 | 189 | 18 | 525 |
| AMP PEAK 8(4Q12) MUTATED | 21 | 4 | 2 | 7 | 2 | 102 |
| AMP PEAK 8(4Q12) WILD-TYPE | 173 | 26 | 127 | 182 | 16 | 423 |
Figure S45. Get High-res Image Gene #8: 'amp_4q12' versus Clinical Feature #7: 'HISTOLOGICAL_TYPE'

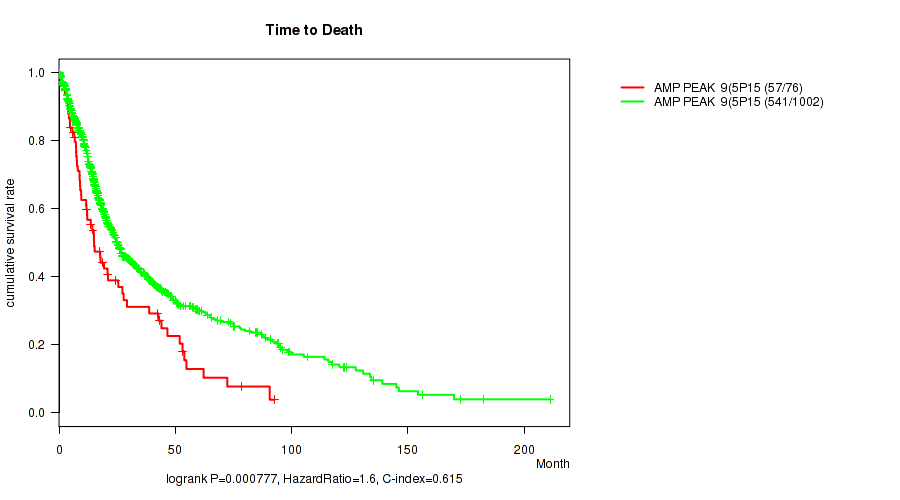
P value = 0.000777 (logrank test), Q value = 0.0024
Table S46. Gene #9: 'amp_5p15.33' versus Clinical Feature #1: 'Time to Death'
| nPatients | nDeath | Duration Range (Median), Month | |
|---|---|---|---|
| ALL | 1078 | 598 | 0.0 - 211.2 (16.0) |
| AMP PEAK 9(5P15.33) MUTATED | 76 | 57 | 0.2 - 92.7 (12.9) |
| AMP PEAK 9(5P15.33) WILD-TYPE | 1002 | 541 | 0.0 - 211.2 (16.2) |
Figure S46. Get High-res Image Gene #9: 'amp_5p15.33' versus Clinical Feature #1: 'Time to Death'
P value = 0.0388 (Wilcoxon-test), Q value = 0.079
Table S47. Gene #9: 'amp_5p15.33' versus Clinical Feature #2: 'YEARS_TO_BIRTH'
| nPatients | Mean (Std.Dev) | |
|---|---|---|
| ALL | 1084 | 50.8 (15.8) |
| AMP PEAK 9(5P15.33) MUTATED | 76 | 54.2 (16.4) |
| AMP PEAK 9(5P15.33) WILD-TYPE | 1008 | 50.6 (15.7) |
Figure S47. Get High-res Image Gene #9: 'amp_5p15.33' versus Clinical Feature #2: 'YEARS_TO_BIRTH'

P value = 1.28e-06 (Fisher's exact test), Q value = 6.9e-06
Table S48. Gene #9: 'amp_5p15.33' versus Clinical Feature #3: 'TUMOR_TISSUE_SITE'
| nPatients | BRAIN | CENTRAL NERVOUS SYSTEM |
|---|---|---|
| ALL | 573 | 512 |
| AMP PEAK 9(5P15.33) MUTATED | 60 | 16 |
| AMP PEAK 9(5P15.33) WILD-TYPE | 513 | 496 |
Figure S48. Get High-res Image Gene #9: 'amp_5p15.33' versus Clinical Feature #3: 'TUMOR_TISSUE_SITE'

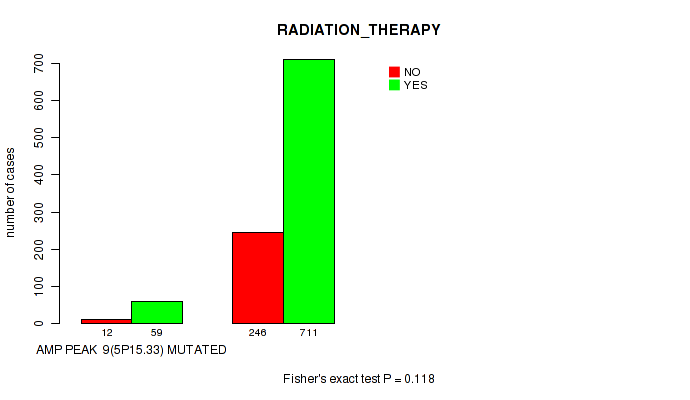
P value = 0.118 (Fisher's exact test), Q value = 0.21
Table S49. Gene #9: 'amp_5p15.33' versus Clinical Feature #5: 'RADIATION_THERAPY'
| nPatients | NO | YES |
|---|---|---|
| ALL | 258 | 770 |
| AMP PEAK 9(5P15.33) MUTATED | 12 | 59 |
| AMP PEAK 9(5P15.33) WILD-TYPE | 246 | 711 |
Figure S49. Get High-res Image Gene #9: 'amp_5p15.33' versus Clinical Feature #5: 'RADIATION_THERAPY'
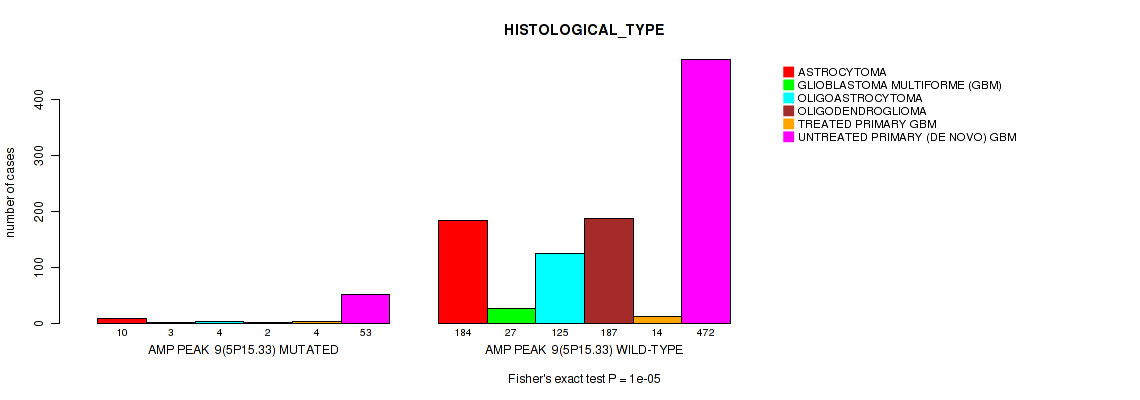
P value = 1e-05 (Fisher's exact test), Q value = 3.9e-05
Table S50. Gene #9: 'amp_5p15.33' versus Clinical Feature #7: 'HISTOLOGICAL_TYPE'
| nPatients | ASTROCYTOMA | GLIOBLASTOMA MULTIFORME (GBM) | OLIGOASTROCYTOMA | OLIGODENDROGLIOMA | TREATED PRIMARY GBM | UNTREATED PRIMARY (DE NOVO) GBM |
|---|---|---|---|---|---|---|
| ALL | 194 | 30 | 129 | 189 | 18 | 525 |
| AMP PEAK 9(5P15.33) MUTATED | 10 | 3 | 4 | 2 | 4 | 53 |
| AMP PEAK 9(5P15.33) WILD-TYPE | 184 | 27 | 125 | 187 | 14 | 472 |
Figure S50. Get High-res Image Gene #9: 'amp_5p15.33' versus Clinical Feature #7: 'HISTOLOGICAL_TYPE'
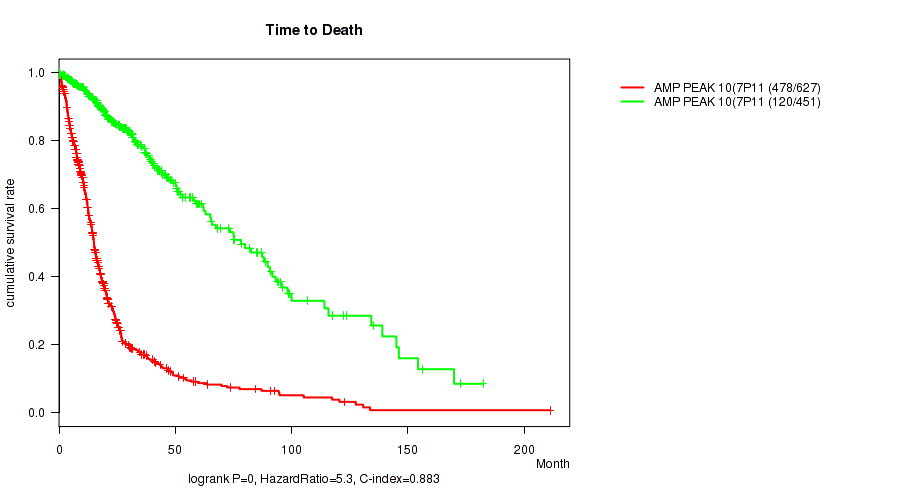
P value = 0 (logrank test), Q value = 0
Table S51. Gene #10: 'amp_7p11.2' versus Clinical Feature #1: 'Time to Death'
| nPatients | nDeath | Duration Range (Median), Month | |
|---|---|---|---|
| ALL | 1078 | 598 | 0.0 - 211.2 (16.0) |
| AMP PEAK 10(7P11.2) MUTATED | 627 | 478 | 0.1 - 211.2 (12.8) |
| AMP PEAK 10(7P11.2) WILD-TYPE | 451 | 120 | 0.0 - 182.3 (23.2) |
Figure S51. Get High-res Image Gene #10: 'amp_7p11.2' versus Clinical Feature #1: 'Time to Death'
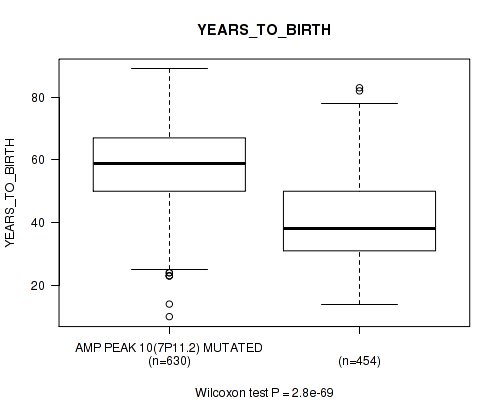
P value = 2.8e-69 (Wilcoxon-test), Q value = 7.6e-68
Table S52. Gene #10: 'amp_7p11.2' versus Clinical Feature #2: 'YEARS_TO_BIRTH'
| nPatients | Mean (Std.Dev) | |
|---|---|---|
| ALL | 1084 | 50.8 (15.8) |
| AMP PEAK 10(7P11.2) MUTATED | 630 | 57.9 (13.2) |
| AMP PEAK 10(7P11.2) WILD-TYPE | 454 | 41.0 (13.7) |
Figure S52. Get High-res Image Gene #10: 'amp_7p11.2' versus Clinical Feature #2: 'YEARS_TO_BIRTH'
P value = 3.16e-105 (Fisher's exact test), Q value = 1.1e-103
Table S53. Gene #10: 'amp_7p11.2' versus Clinical Feature #3: 'TUMOR_TISSUE_SITE'
| nPatients | BRAIN | CENTRAL NERVOUS SYSTEM |
|---|---|---|
| ALL | 573 | 512 |
| AMP PEAK 10(7P11.2) MUTATED | 503 | 127 |
| AMP PEAK 10(7P11.2) WILD-TYPE | 70 | 385 |
Figure S53. Get High-res Image Gene #10: 'amp_7p11.2' versus Clinical Feature #3: 'TUMOR_TISSUE_SITE'
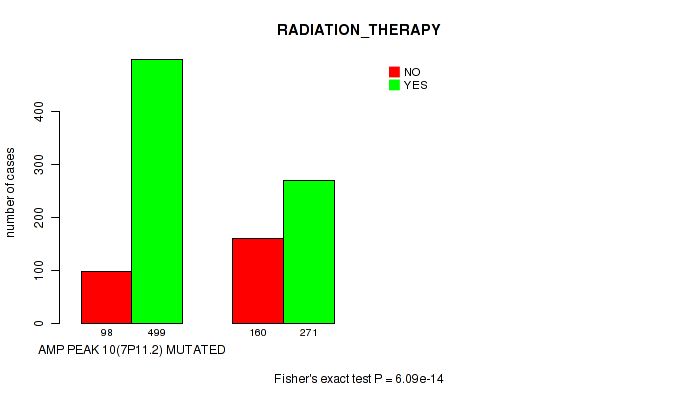
P value = 6.09e-14 (Fisher's exact test), Q value = 6.3e-13
Table S54. Gene #10: 'amp_7p11.2' versus Clinical Feature #5: 'RADIATION_THERAPY'
| nPatients | NO | YES |
|---|---|---|
| ALL | 258 | 770 |
| AMP PEAK 10(7P11.2) MUTATED | 98 | 499 |
| AMP PEAK 10(7P11.2) WILD-TYPE | 160 | 271 |
Figure S54. Get High-res Image Gene #10: 'amp_7p11.2' versus Clinical Feature #5: 'RADIATION_THERAPY'
P value = 9.91e-20 (Wilcoxon-test), Q value = 1.6e-18
Table S55. Gene #10: 'amp_7p11.2' versus Clinical Feature #6: 'KARNOFSKY_PERFORMANCE_SCORE'
| nPatients | Mean (Std.Dev) | |
|---|---|---|
| ALL | 732 | 81.1 (15.3) |
| AMP PEAK 10(7P11.2) MUTATED | 451 | 77.3 (16.1) |
| AMP PEAK 10(7P11.2) WILD-TYPE | 281 | 87.1 (11.6) |
Figure S55. Get High-res Image Gene #10: 'amp_7p11.2' versus Clinical Feature #6: 'KARNOFSKY_PERFORMANCE_SCORE'

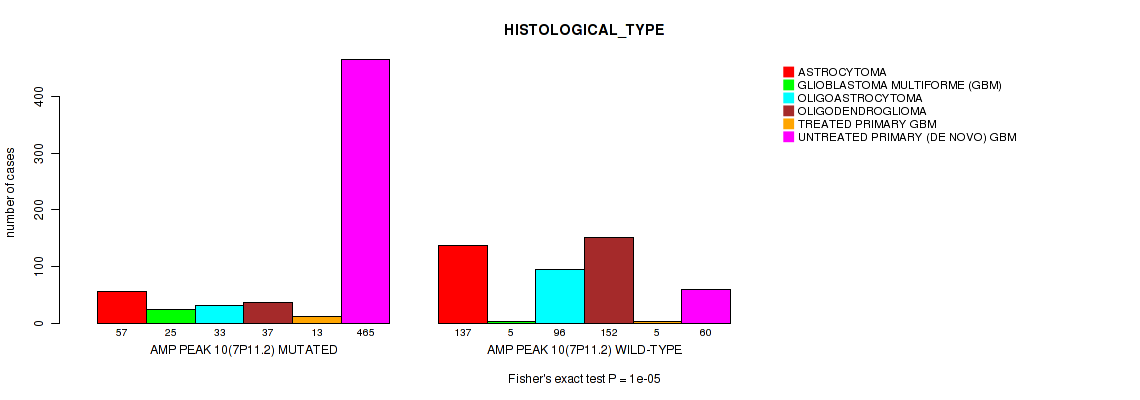
P value = 1e-05 (Fisher's exact test), Q value = 3.9e-05
Table S56. Gene #10: 'amp_7p11.2' versus Clinical Feature #7: 'HISTOLOGICAL_TYPE'
| nPatients | ASTROCYTOMA | GLIOBLASTOMA MULTIFORME (GBM) | OLIGOASTROCYTOMA | OLIGODENDROGLIOMA | TREATED PRIMARY GBM | UNTREATED PRIMARY (DE NOVO) GBM |
|---|---|---|---|---|---|---|
| ALL | 194 | 30 | 129 | 189 | 18 | 525 |
| AMP PEAK 10(7P11.2) MUTATED | 57 | 25 | 33 | 37 | 13 | 465 |
| AMP PEAK 10(7P11.2) WILD-TYPE | 137 | 5 | 96 | 152 | 5 | 60 |
Figure S56. Get High-res Image Gene #10: 'amp_7p11.2' versus Clinical Feature #7: 'HISTOLOGICAL_TYPE'
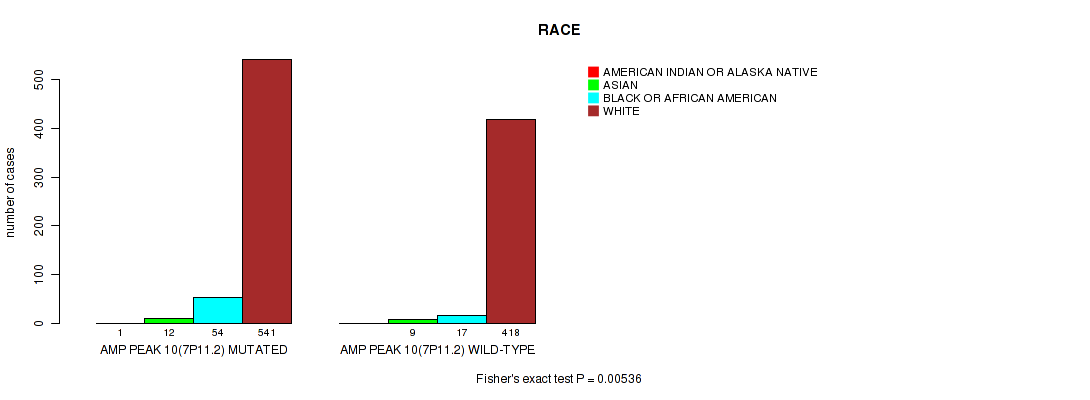
P value = 0.00536 (Fisher's exact test), Q value = 0.014
Table S57. Gene #10: 'amp_7p11.2' versus Clinical Feature #8: 'RACE'
| nPatients | AMERICAN INDIAN OR ALASKA NATIVE | ASIAN | BLACK OR AFRICAN AMERICAN | WHITE |
|---|---|---|---|---|
| ALL | 1 | 21 | 71 | 959 |
| AMP PEAK 10(7P11.2) MUTATED | 1 | 12 | 54 | 541 |
| AMP PEAK 10(7P11.2) WILD-TYPE | 0 | 9 | 17 | 418 |
Figure S57. Get High-res Image Gene #10: 'amp_7p11.2' versus Clinical Feature #8: 'RACE'
P value = 0.00772 (Fisher's exact test), Q value = 0.019
Table S58. Gene #10: 'amp_7p11.2' versus Clinical Feature #9: 'ETHNICITY'
| nPatients | HISPANIC OR LATINO | NOT HISPANIC OR LATINO |
|---|---|---|
| ALL | 44 | 921 |
| AMP PEAK 10(7P11.2) MUTATED | 16 | 528 |
| AMP PEAK 10(7P11.2) WILD-TYPE | 28 | 393 |
Figure S58. Get High-res Image Gene #10: 'amp_7p11.2' versus Clinical Feature #9: 'ETHNICITY'
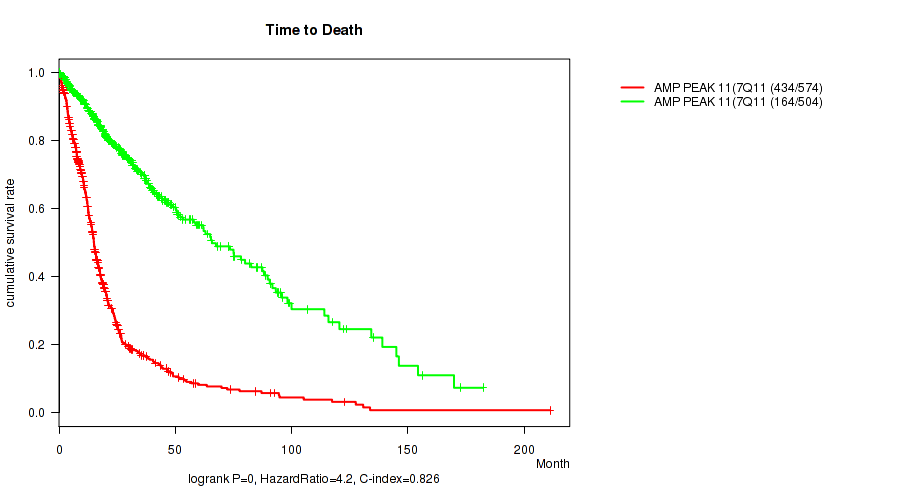
P value = 0 (logrank test), Q value = 0
Table S59. Gene #11: 'amp_7q11.21' versus Clinical Feature #1: 'Time to Death'
| nPatients | nDeath | Duration Range (Median), Month | |
|---|---|---|---|
| ALL | 1078 | 598 | 0.0 - 211.2 (16.0) |
| AMP PEAK 11(7Q11.21) MUTATED | 574 | 434 | 0.1 - 211.2 (12.7) |
| AMP PEAK 11(7Q11.21) WILD-TYPE | 504 | 164 | 0.0 - 182.3 (22.3) |
Figure S59. Get High-res Image Gene #11: 'amp_7q11.21' versus Clinical Feature #1: 'Time to Death'
P value = 7.26e-56 (Wilcoxon-test), Q value = 1.7e-54
Table S60. Gene #11: 'amp_7q11.21' versus Clinical Feature #2: 'YEARS_TO_BIRTH'
| nPatients | Mean (Std.Dev) | |
|---|---|---|
| ALL | 1084 | 50.8 (15.8) |
| AMP PEAK 11(7Q11.21) MUTATED | 577 | 57.9 (13.2) |
| AMP PEAK 11(7Q11.21) WILD-TYPE | 507 | 42.8 (14.6) |
Figure S60. Get High-res Image Gene #11: 'amp_7q11.21' versus Clinical Feature #2: 'YEARS_TO_BIRTH'
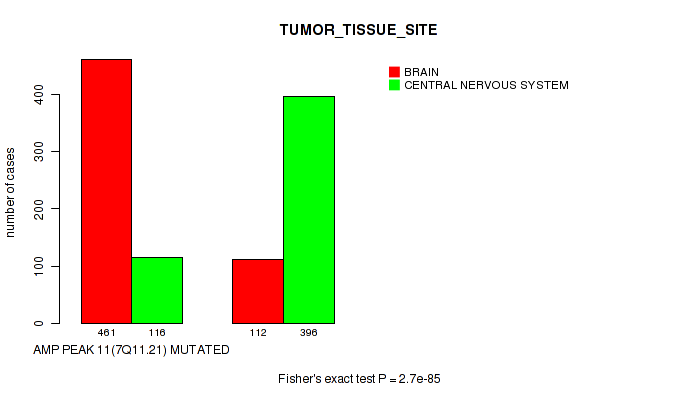
P value = 2.7e-85 (Fisher's exact test), Q value = 8.7e-84
Table S61. Gene #11: 'amp_7q11.21' versus Clinical Feature #3: 'TUMOR_TISSUE_SITE'
| nPatients | BRAIN | CENTRAL NERVOUS SYSTEM |
|---|---|---|
| ALL | 573 | 512 |
| AMP PEAK 11(7Q11.21) MUTATED | 461 | 116 |
| AMP PEAK 11(7Q11.21) WILD-TYPE | 112 | 396 |
Figure S61. Get High-res Image Gene #11: 'amp_7q11.21' versus Clinical Feature #3: 'TUMOR_TISSUE_SITE'
P value = 4.12e-11 (Fisher's exact test), Q value = 3.4e-10
Table S62. Gene #11: 'amp_7q11.21' versus Clinical Feature #5: 'RADIATION_THERAPY'
| nPatients | NO | YES |
|---|---|---|
| ALL | 258 | 770 |
| AMP PEAK 11(7Q11.21) MUTATED | 91 | 454 |
| AMP PEAK 11(7Q11.21) WILD-TYPE | 167 | 316 |
Figure S62. Get High-res Image Gene #11: 'amp_7q11.21' versus Clinical Feature #5: 'RADIATION_THERAPY'

P value = 3.89e-14 (Wilcoxon-test), Q value = 4.2e-13
Table S63. Gene #11: 'amp_7q11.21' versus Clinical Feature #6: 'KARNOFSKY_PERFORMANCE_SCORE'
| nPatients | Mean (Std.Dev) | |
|---|---|---|
| ALL | 732 | 81.1 (15.3) |
| AMP PEAK 11(7Q11.21) MUTATED | 409 | 77.6 (16.2) |
| AMP PEAK 11(7Q11.21) WILD-TYPE | 323 | 85.5 (12.7) |
Figure S63. Get High-res Image Gene #11: 'amp_7q11.21' versus Clinical Feature #6: 'KARNOFSKY_PERFORMANCE_SCORE'
P value = 1e-05 (Fisher's exact test), Q value = 3.9e-05
Table S64. Gene #11: 'amp_7q11.21' versus Clinical Feature #7: 'HISTOLOGICAL_TYPE'
| nPatients | ASTROCYTOMA | GLIOBLASTOMA MULTIFORME (GBM) | OLIGOASTROCYTOMA | OLIGODENDROGLIOMA | TREATED PRIMARY GBM | UNTREATED PRIMARY (DE NOVO) GBM |
|---|---|---|---|---|---|---|
| ALL | 194 | 30 | 129 | 189 | 18 | 525 |
| AMP PEAK 11(7Q11.21) MUTATED | 50 | 22 | 31 | 35 | 10 | 429 |
| AMP PEAK 11(7Q11.21) WILD-TYPE | 144 | 8 | 98 | 154 | 8 | 96 |
Figure S64. Get High-res Image Gene #11: 'amp_7q11.21' versus Clinical Feature #7: 'HISTOLOGICAL_TYPE'
P value = 0.00277 (Fisher's exact test), Q value = 0.0078
Table S65. Gene #11: 'amp_7q11.21' versus Clinical Feature #8: 'RACE'
| nPatients | AMERICAN INDIAN OR ALASKA NATIVE | ASIAN | BLACK OR AFRICAN AMERICAN | WHITE |
|---|---|---|---|---|
| ALL | 1 | 21 | 71 | 959 |
| AMP PEAK 11(7Q11.21) MUTATED | 1 | 10 | 51 | 493 |
| AMP PEAK 11(7Q11.21) WILD-TYPE | 0 | 11 | 20 | 466 |
Figure S65. Get High-res Image Gene #11: 'amp_7q11.21' versus Clinical Feature #8: 'RACE'
P value = 0.00829 (Fisher's exact test), Q value = 0.021
Table S66. Gene #11: 'amp_7q11.21' versus Clinical Feature #9: 'ETHNICITY'
| nPatients | HISPANIC OR LATINO | NOT HISPANIC OR LATINO |
|---|---|---|
| ALL | 44 | 921 |
| AMP PEAK 11(7Q11.21) MUTATED | 14 | 484 |
| AMP PEAK 11(7Q11.21) WILD-TYPE | 30 | 437 |
Figure S66. Get High-res Image Gene #11: 'amp_7q11.21' versus Clinical Feature #9: 'ETHNICITY'
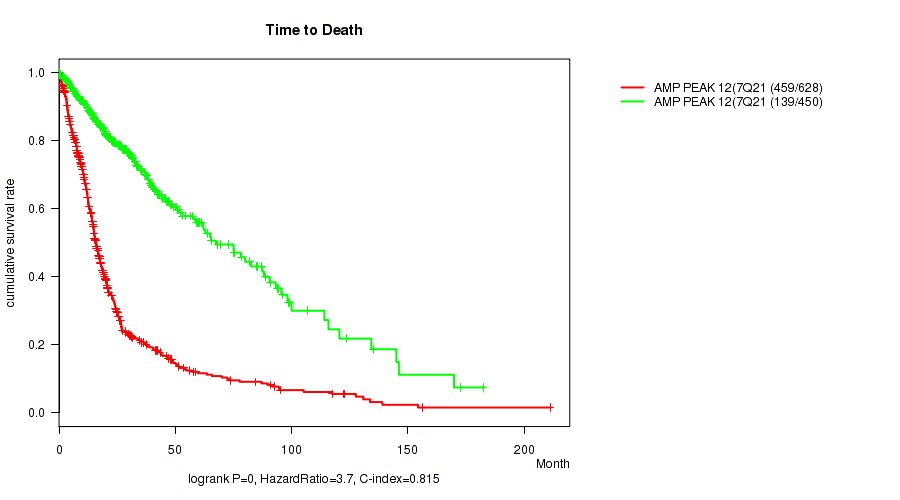
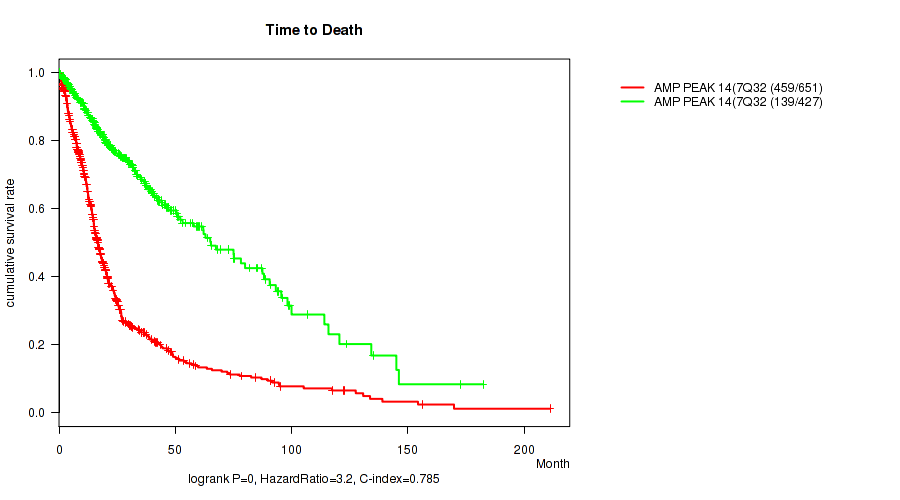
P value = 0 (logrank test), Q value = 0
Table S67. Gene #12: 'amp_7q21.2' versus Clinical Feature #1: 'Time to Death'
| nPatients | nDeath | Duration Range (Median), Month | |
|---|---|---|---|
| ALL | 1078 | 598 | 0.0 - 211.2 (16.0) |
| AMP PEAK 12(7Q21.2) MUTATED | 628 | 459 | 0.1 - 211.2 (13.8) |
| AMP PEAK 12(7Q21.2) WILD-TYPE | 450 | 139 | 0.0 - 182.3 (22.3) |
Figure S67. Get High-res Image Gene #12: 'amp_7q21.2' versus Clinical Feature #1: 'Time to Death'
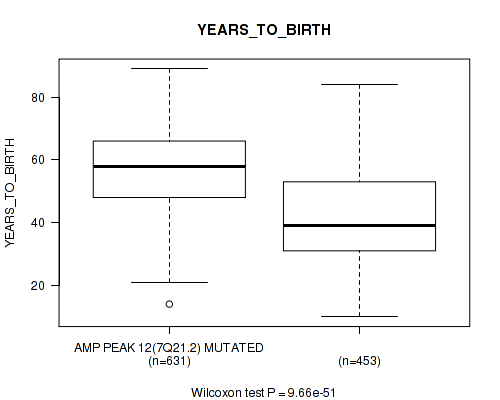
P value = 9.66e-51 (Wilcoxon-test), Q value = 2.2e-49
Table S68. Gene #12: 'amp_7q21.2' versus Clinical Feature #2: 'YEARS_TO_BIRTH'
| nPatients | Mean (Std.Dev) | |
|---|---|---|
| ALL | 1084 | 50.8 (15.8) |
| AMP PEAK 12(7Q21.2) MUTATED | 631 | 56.9 (13.5) |
| AMP PEAK 12(7Q21.2) WILD-TYPE | 453 | 42.4 (14.9) |
Figure S68. Get High-res Image Gene #12: 'amp_7q21.2' versus Clinical Feature #2: 'YEARS_TO_BIRTH'
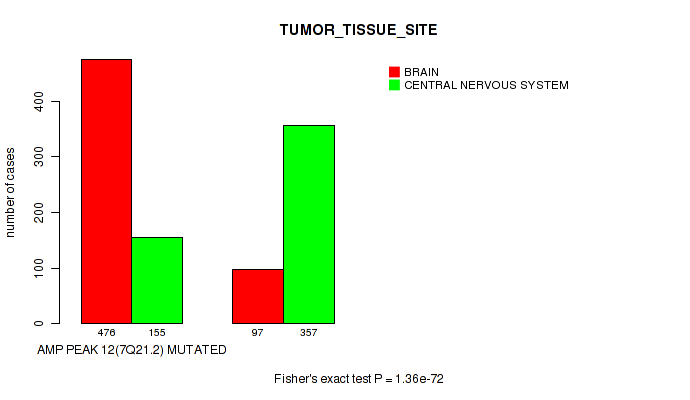
P value = 1.36e-72 (Fisher's exact test), Q value = 4.2e-71
Table S69. Gene #12: 'amp_7q21.2' versus Clinical Feature #3: 'TUMOR_TISSUE_SITE'
| nPatients | BRAIN | CENTRAL NERVOUS SYSTEM |
|---|---|---|
| ALL | 573 | 512 |
| AMP PEAK 12(7Q21.2) MUTATED | 476 | 155 |
| AMP PEAK 12(7Q21.2) WILD-TYPE | 97 | 357 |
Figure S69. Get High-res Image Gene #12: 'amp_7q21.2' versus Clinical Feature #3: 'TUMOR_TISSUE_SITE'
P value = 1.29e-11 (Fisher's exact test), Q value = 1.1e-10
Table S70. Gene #12: 'amp_7q21.2' versus Clinical Feature #5: 'RADIATION_THERAPY'
| nPatients | NO | YES |
|---|---|---|
| ALL | 258 | 770 |
| AMP PEAK 12(7Q21.2) MUTATED | 103 | 495 |
| AMP PEAK 12(7Q21.2) WILD-TYPE | 155 | 275 |
Figure S70. Get High-res Image Gene #12: 'amp_7q21.2' versus Clinical Feature #5: 'RADIATION_THERAPY'

P value = 1.64e-12 (Wilcoxon-test), Q value = 1.5e-11
Table S71. Gene #12: 'amp_7q21.2' versus Clinical Feature #6: 'KARNOFSKY_PERFORMANCE_SCORE'
| nPatients | Mean (Std.Dev) | |
|---|---|---|
| ALL | 732 | 81.1 (15.3) |
| AMP PEAK 12(7Q21.2) MUTATED | 443 | 78.0 (16.3) |
| AMP PEAK 12(7Q21.2) WILD-TYPE | 289 | 85.8 (12.1) |
Figure S71. Get High-res Image Gene #12: 'amp_7q21.2' versus Clinical Feature #6: 'KARNOFSKY_PERFORMANCE_SCORE'

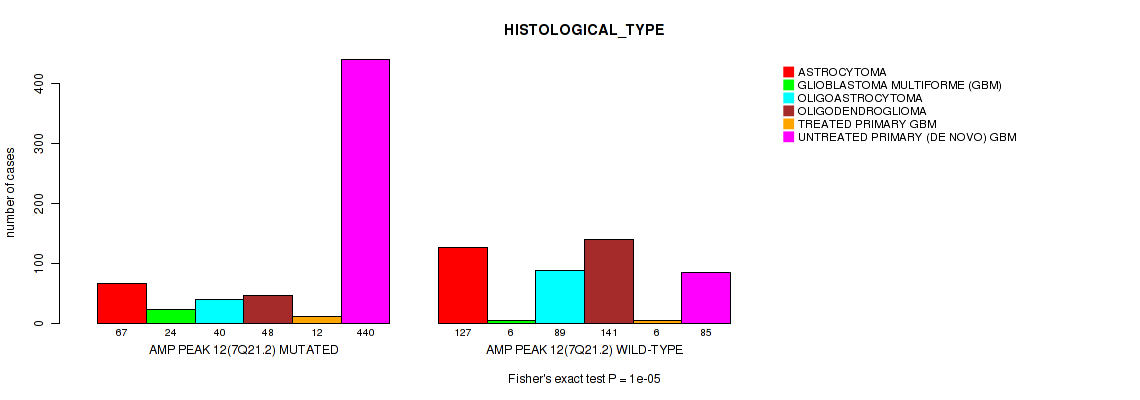
P value = 1e-05 (Fisher's exact test), Q value = 3.9e-05
Table S72. Gene #12: 'amp_7q21.2' versus Clinical Feature #7: 'HISTOLOGICAL_TYPE'
| nPatients | ASTROCYTOMA | GLIOBLASTOMA MULTIFORME (GBM) | OLIGOASTROCYTOMA | OLIGODENDROGLIOMA | TREATED PRIMARY GBM | UNTREATED PRIMARY (DE NOVO) GBM |
|---|---|---|---|---|---|---|
| ALL | 194 | 30 | 129 | 189 | 18 | 525 |
| AMP PEAK 12(7Q21.2) MUTATED | 67 | 24 | 40 | 48 | 12 | 440 |
| AMP PEAK 12(7Q21.2) WILD-TYPE | 127 | 6 | 89 | 141 | 6 | 85 |
Figure S72. Get High-res Image Gene #12: 'amp_7q21.2' versus Clinical Feature #7: 'HISTOLOGICAL_TYPE'
P value = 0.00147 (Fisher's exact test), Q value = 0.0044
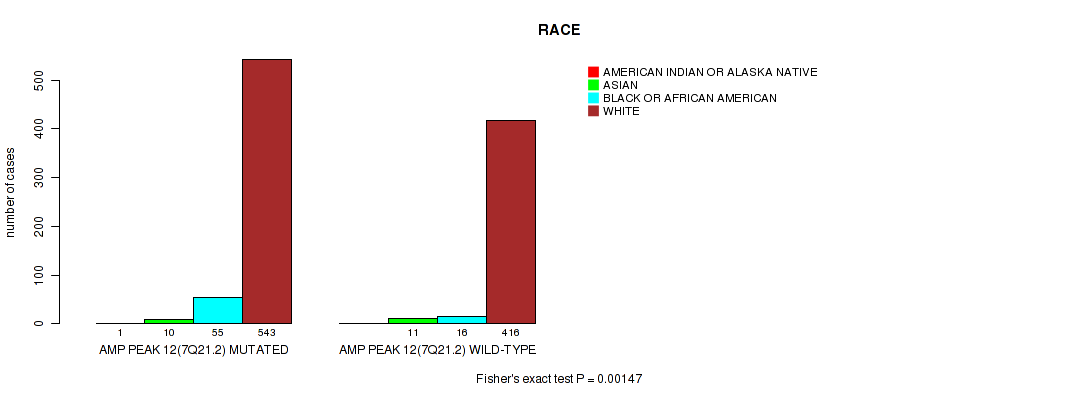
Table S73. Gene #12: 'amp_7q21.2' versus Clinical Feature #8: 'RACE'
| nPatients | AMERICAN INDIAN OR ALASKA NATIVE | ASIAN | BLACK OR AFRICAN AMERICAN | WHITE |
|---|---|---|---|---|
| ALL | 1 | 21 | 71 | 959 |
| AMP PEAK 12(7Q21.2) MUTATED | 1 | 10 | 55 | 543 |
| AMP PEAK 12(7Q21.2) WILD-TYPE | 0 | 11 | 16 | 416 |
Figure S73. Get High-res Image Gene #12: 'amp_7q21.2' versus Clinical Feature #8: 'RACE'
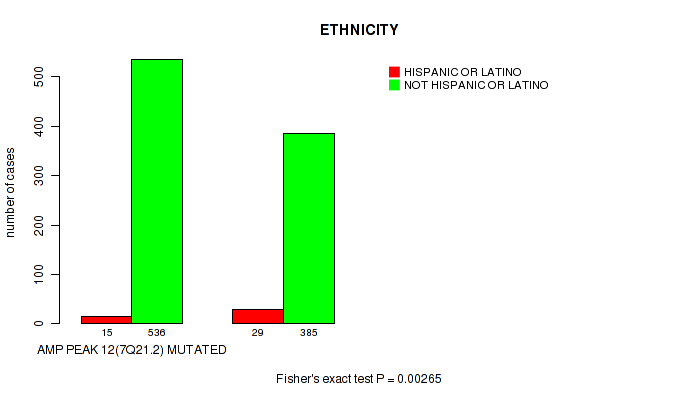
P value = 0.00265 (Fisher's exact test), Q value = 0.0075
Table S74. Gene #12: 'amp_7q21.2' versus Clinical Feature #9: 'ETHNICITY'
| nPatients | HISPANIC OR LATINO | NOT HISPANIC OR LATINO |
|---|---|---|
| ALL | 44 | 921 |
| AMP PEAK 12(7Q21.2) MUTATED | 15 | 536 |
| AMP PEAK 12(7Q21.2) WILD-TYPE | 29 | 385 |
Figure S74. Get High-res Image Gene #12: 'amp_7q21.2' versus Clinical Feature #9: 'ETHNICITY'
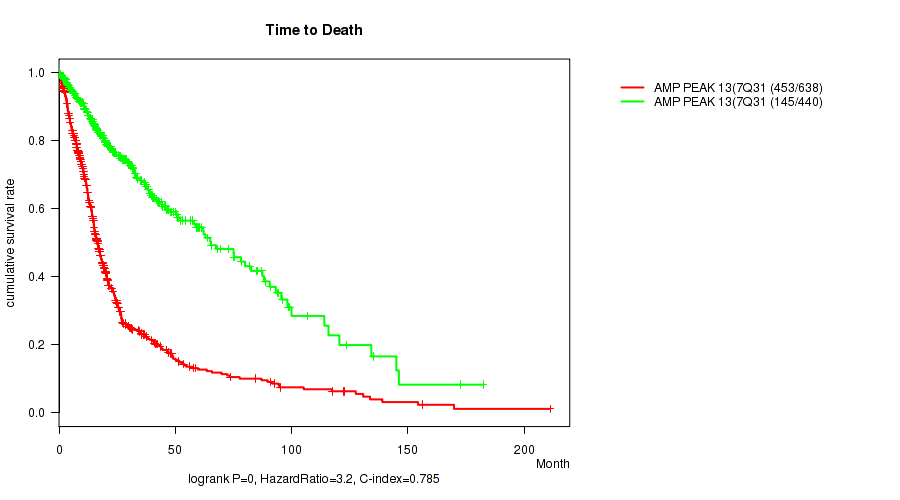
P value = 0 (logrank test), Q value = 0
Table S75. Gene #13: 'amp_7q31.2' versus Clinical Feature #1: 'Time to Death'
| nPatients | nDeath | Duration Range (Median), Month | |
|---|---|---|---|
| ALL | 1078 | 598 | 0.0 - 211.2 (16.0) |
| AMP PEAK 13(7Q31.2) MUTATED | 638 | 453 | 0.1 - 211.2 (14.0) |
| AMP PEAK 13(7Q31.2) WILD-TYPE | 440 | 145 | 0.0 - 182.3 (21.3) |
Figure S75. Get High-res Image Gene #13: 'amp_7q31.2' versus Clinical Feature #1: 'Time to Death'
P value = 1.27e-40 (Wilcoxon-test), Q value = 2.5e-39
Table S76. Gene #13: 'amp_7q31.2' versus Clinical Feature #2: 'YEARS_TO_BIRTH'
| nPatients | Mean (Std.Dev) | |
|---|---|---|
| ALL | 1084 | 50.8 (15.8) |
| AMP PEAK 13(7Q31.2) MUTATED | 641 | 56.1 (13.8) |
| AMP PEAK 13(7Q31.2) WILD-TYPE | 443 | 43.1 (15.4) |
Figure S76. Get High-res Image Gene #13: 'amp_7q31.2' versus Clinical Feature #2: 'YEARS_TO_BIRTH'

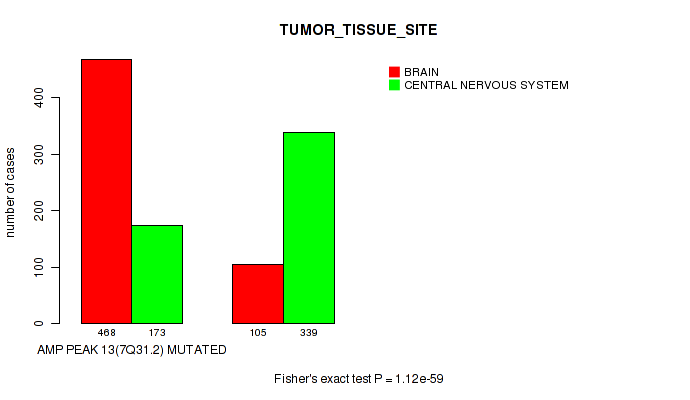
P value = 1.12e-59 (Fisher's exact test), Q value = 2.8e-58
Table S77. Gene #13: 'amp_7q31.2' versus Clinical Feature #3: 'TUMOR_TISSUE_SITE'
| nPatients | BRAIN | CENTRAL NERVOUS SYSTEM |
|---|---|---|
| ALL | 573 | 512 |
| AMP PEAK 13(7Q31.2) MUTATED | 468 | 173 |
| AMP PEAK 13(7Q31.2) WILD-TYPE | 105 | 339 |
Figure S77. Get High-res Image Gene #13: 'amp_7q31.2' versus Clinical Feature #3: 'TUMOR_TISSUE_SITE'
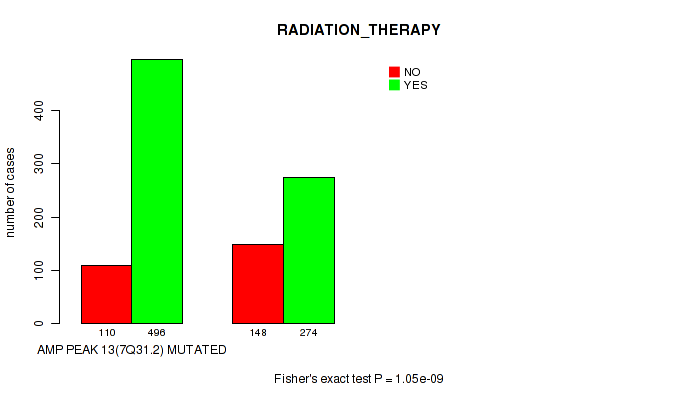
P value = 1.05e-09 (Fisher's exact test), Q value = 7.2e-09
Table S78. Gene #13: 'amp_7q31.2' versus Clinical Feature #5: 'RADIATION_THERAPY'
| nPatients | NO | YES |
|---|---|---|
| ALL | 258 | 770 |
| AMP PEAK 13(7Q31.2) MUTATED | 110 | 496 |
| AMP PEAK 13(7Q31.2) WILD-TYPE | 148 | 274 |
Figure S78. Get High-res Image Gene #13: 'amp_7q31.2' versus Clinical Feature #5: 'RADIATION_THERAPY'
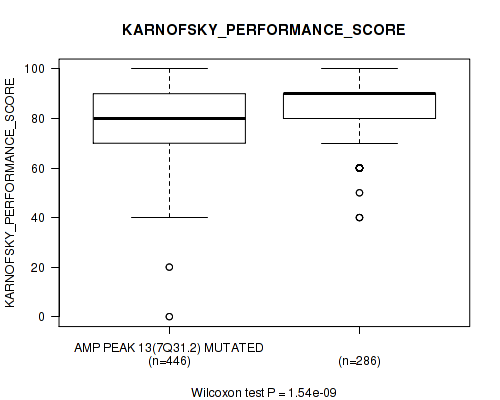
P value = 1.54e-09 (Wilcoxon-test), Q value = 1.1e-08
Table S79. Gene #13: 'amp_7q31.2' versus Clinical Feature #6: 'KARNOFSKY_PERFORMANCE_SCORE'
| nPatients | Mean (Std.Dev) | |
|---|---|---|
| ALL | 732 | 81.1 (15.3) |
| AMP PEAK 13(7Q31.2) MUTATED | 446 | 78.5 (16.0) |
| AMP PEAK 13(7Q31.2) WILD-TYPE | 286 | 85.0 (13.1) |
Figure S79. Get High-res Image Gene #13: 'amp_7q31.2' versus Clinical Feature #6: 'KARNOFSKY_PERFORMANCE_SCORE'
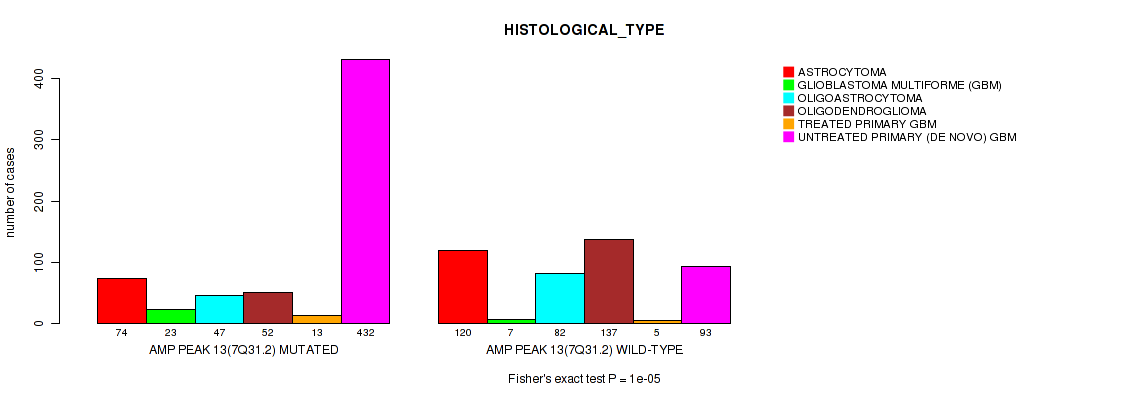
P value = 1e-05 (Fisher's exact test), Q value = 3.9e-05
Table S80. Gene #13: 'amp_7q31.2' versus Clinical Feature #7: 'HISTOLOGICAL_TYPE'
| nPatients | ASTROCYTOMA | GLIOBLASTOMA MULTIFORME (GBM) | OLIGOASTROCYTOMA | OLIGODENDROGLIOMA | TREATED PRIMARY GBM | UNTREATED PRIMARY (DE NOVO) GBM |
|---|---|---|---|---|---|---|
| ALL | 194 | 30 | 129 | 189 | 18 | 525 |
| AMP PEAK 13(7Q31.2) MUTATED | 74 | 23 | 47 | 52 | 13 | 432 |
| AMP PEAK 13(7Q31.2) WILD-TYPE | 120 | 7 | 82 | 137 | 5 | 93 |
Figure S80. Get High-res Image Gene #13: 'amp_7q31.2' versus Clinical Feature #7: 'HISTOLOGICAL_TYPE'
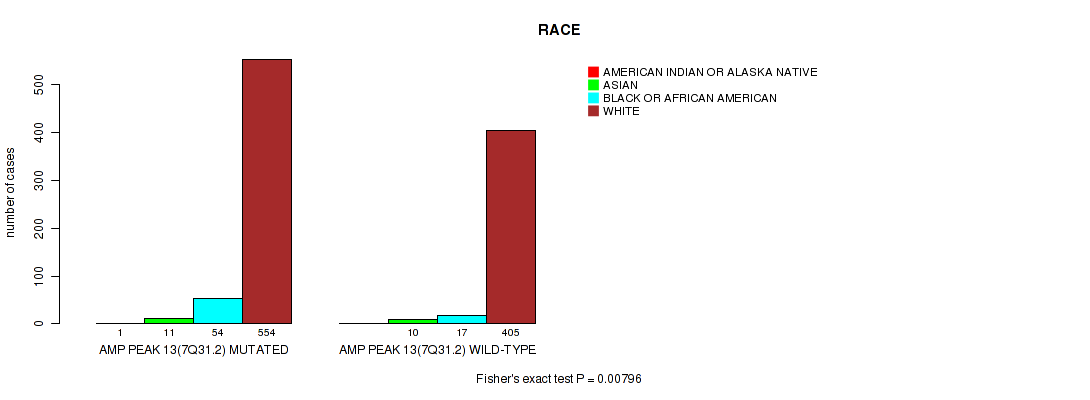
P value = 0.00796 (Fisher's exact test), Q value = 0.02
Table S81. Gene #13: 'amp_7q31.2' versus Clinical Feature #8: 'RACE'
| nPatients | AMERICAN INDIAN OR ALASKA NATIVE | ASIAN | BLACK OR AFRICAN AMERICAN | WHITE |
|---|---|---|---|---|
| ALL | 1 | 21 | 71 | 959 |
| AMP PEAK 13(7Q31.2) MUTATED | 1 | 11 | 54 | 554 |
| AMP PEAK 13(7Q31.2) WILD-TYPE | 0 | 10 | 17 | 405 |
Figure S81. Get High-res Image Gene #13: 'amp_7q31.2' versus Clinical Feature #8: 'RACE'
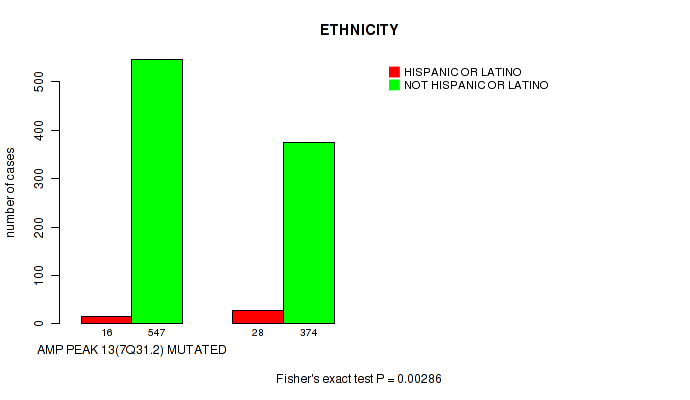
P value = 0.00286 (Fisher's exact test), Q value = 0.008
Table S82. Gene #13: 'amp_7q31.2' versus Clinical Feature #9: 'ETHNICITY'
| nPatients | HISPANIC OR LATINO | NOT HISPANIC OR LATINO |
|---|---|---|
| ALL | 44 | 921 |
| AMP PEAK 13(7Q31.2) MUTATED | 16 | 547 |
| AMP PEAK 13(7Q31.2) WILD-TYPE | 28 | 374 |
Figure S82. Get High-res Image Gene #13: 'amp_7q31.2' versus Clinical Feature #9: 'ETHNICITY'
P value = 0 (logrank test), Q value = 0
Table S83. Gene #14: 'amp_7q32.3' versus Clinical Feature #1: 'Time to Death'
| nPatients | nDeath | Duration Range (Median), Month | |
|---|---|---|---|
| ALL | 1078 | 598 | 0.0 - 211.2 (16.0) |
| AMP PEAK 14(7Q32.3) MUTATED | 651 | 459 | 0.1 - 211.2 (14.0) |
| AMP PEAK 14(7Q32.3) WILD-TYPE | 427 | 139 | 0.0 - 182.3 (21.4) |
Figure S83. Get High-res Image Gene #14: 'amp_7q32.3' versus Clinical Feature #1: 'Time to Death'
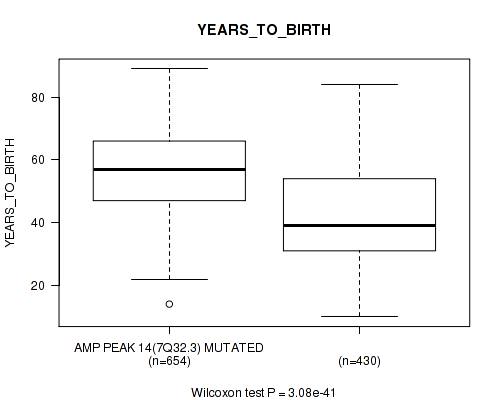
P value = 3.08e-41 (Wilcoxon-test), Q value = 6.3e-40
Table S84. Gene #14: 'amp_7q32.3' versus Clinical Feature #2: 'YEARS_TO_BIRTH'
| nPatients | Mean (Std.Dev) | |
|---|---|---|
| ALL | 1084 | 50.8 (15.8) |
| AMP PEAK 14(7Q32.3) MUTATED | 654 | 56.1 (13.8) |
| AMP PEAK 14(7Q32.3) WILD-TYPE | 430 | 42.8 (15.4) |
Figure S84. Get High-res Image Gene #14: 'amp_7q32.3' versus Clinical Feature #2: 'YEARS_TO_BIRTH'
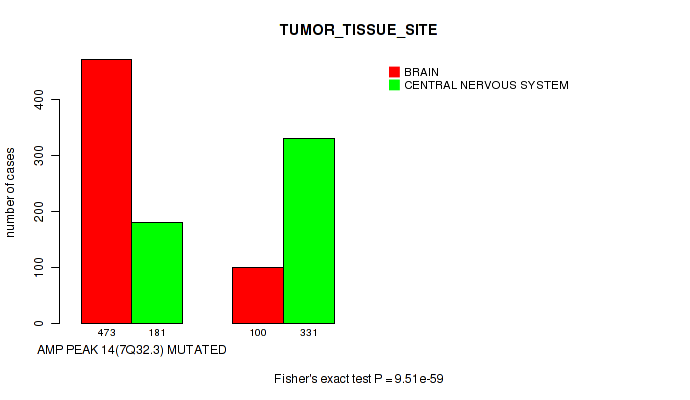
P value = 9.51e-59 (Fisher's exact test), Q value = 2.3e-57
Table S85. Gene #14: 'amp_7q32.3' versus Clinical Feature #3: 'TUMOR_TISSUE_SITE'
| nPatients | BRAIN | CENTRAL NERVOUS SYSTEM |
|---|---|---|
| ALL | 573 | 512 |
| AMP PEAK 14(7Q32.3) MUTATED | 473 | 181 |
| AMP PEAK 14(7Q32.3) WILD-TYPE | 100 | 331 |
Figure S85. Get High-res Image Gene #14: 'amp_7q32.3' versus Clinical Feature #3: 'TUMOR_TISSUE_SITE'
P value = 1.19e-10 (Fisher's exact test), Q value = 9.3e-10
Table S86. Gene #14: 'amp_7q32.3' versus Clinical Feature #5: 'RADIATION_THERAPY'
| nPatients | NO | YES |
|---|---|---|
| ALL | 258 | 770 |
| AMP PEAK 14(7Q32.3) MUTATED | 111 | 508 |
| AMP PEAK 14(7Q32.3) WILD-TYPE | 147 | 262 |
Figure S86. Get High-res Image Gene #14: 'amp_7q32.3' versus Clinical Feature #5: 'RADIATION_THERAPY'

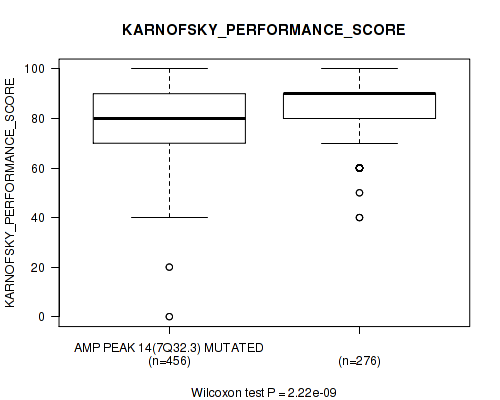
P value = 2.22e-09 (Wilcoxon-test), Q value = 1.5e-08
Table S87. Gene #14: 'amp_7q32.3' versus Clinical Feature #6: 'KARNOFSKY_PERFORMANCE_SCORE'
| nPatients | Mean (Std.Dev) | |
|---|---|---|
| ALL | 732 | 81.1 (15.3) |
| AMP PEAK 14(7Q32.3) MUTATED | 456 | 78.6 (16.2) |
| AMP PEAK 14(7Q32.3) WILD-TYPE | 276 | 85.2 (12.7) |
Figure S87. Get High-res Image Gene #14: 'amp_7q32.3' versus Clinical Feature #6: 'KARNOFSKY_PERFORMANCE_SCORE'
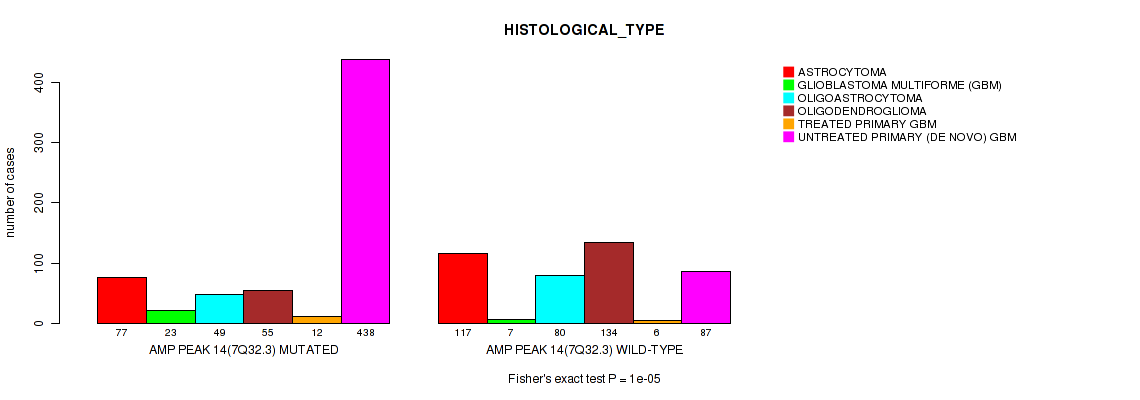
P value = 1e-05 (Fisher's exact test), Q value = 3.9e-05
Table S88. Gene #14: 'amp_7q32.3' versus Clinical Feature #7: 'HISTOLOGICAL_TYPE'
| nPatients | ASTROCYTOMA | GLIOBLASTOMA MULTIFORME (GBM) | OLIGOASTROCYTOMA | OLIGODENDROGLIOMA | TREATED PRIMARY GBM | UNTREATED PRIMARY (DE NOVO) GBM |
|---|---|---|---|---|---|---|
| ALL | 194 | 30 | 129 | 189 | 18 | 525 |
| AMP PEAK 14(7Q32.3) MUTATED | 77 | 23 | 49 | 55 | 12 | 438 |
| AMP PEAK 14(7Q32.3) WILD-TYPE | 117 | 7 | 80 | 134 | 6 | 87 |
Figure S88. Get High-res Image Gene #14: 'amp_7q32.3' versus Clinical Feature #7: 'HISTOLOGICAL_TYPE'
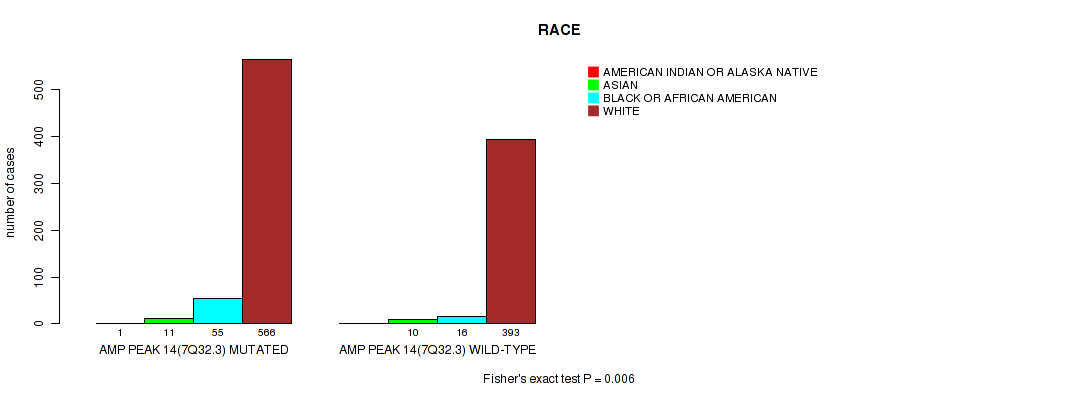
P value = 0.006 (Fisher's exact test), Q value = 0.015
Table S89. Gene #14: 'amp_7q32.3' versus Clinical Feature #8: 'RACE'
| nPatients | AMERICAN INDIAN OR ALASKA NATIVE | ASIAN | BLACK OR AFRICAN AMERICAN | WHITE |
|---|---|---|---|---|
| ALL | 1 | 21 | 71 | 959 |
| AMP PEAK 14(7Q32.3) MUTATED | 1 | 11 | 55 | 566 |
| AMP PEAK 14(7Q32.3) WILD-TYPE | 0 | 10 | 16 | 393 |
Figure S89. Get High-res Image Gene #14: 'amp_7q32.3' versus Clinical Feature #8: 'RACE'
P value = 0.00154 (Fisher's exact test), Q value = 0.0046
Table S90. Gene #14: 'amp_7q32.3' versus Clinical Feature #9: 'ETHNICITY'
| nPatients | HISPANIC OR LATINO | NOT HISPANIC OR LATINO |
|---|---|---|
| ALL | 44 | 921 |
| AMP PEAK 14(7Q32.3) MUTATED | 16 | 560 |
| AMP PEAK 14(7Q32.3) WILD-TYPE | 28 | 361 |
Figure S90. Get High-res Image Gene #14: 'amp_7q32.3' versus Clinical Feature #9: 'ETHNICITY'

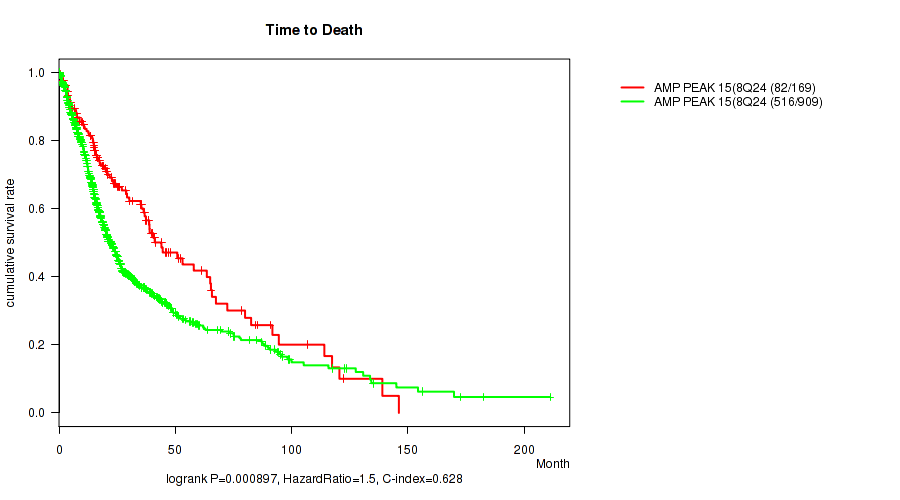
P value = 0.000897 (logrank test), Q value = 0.0028
Table S91. Gene #15: 'amp_8q24.21' versus Clinical Feature #1: 'Time to Death'
| nPatients | nDeath | Duration Range (Median), Month | |
|---|---|---|---|
| ALL | 1078 | 598 | 0.0 - 211.2 (16.0) |
| AMP PEAK 15(8Q24.21) MUTATED | 169 | 82 | 0.1 - 146.1 (20.0) |
| AMP PEAK 15(8Q24.21) WILD-TYPE | 909 | 516 | 0.0 - 211.2 (15.3) |
Figure S91. Get High-res Image Gene #15: 'amp_8q24.21' versus Clinical Feature #1: 'Time to Death'
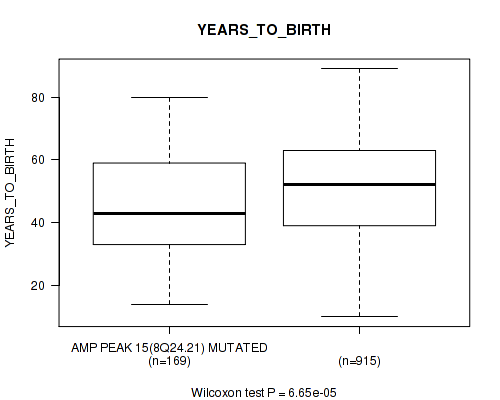
P value = 6.65e-05 (Wilcoxon-test), Q value = 0.00024
Table S92. Gene #15: 'amp_8q24.21' versus Clinical Feature #2: 'YEARS_TO_BIRTH'
| nPatients | Mean (Std.Dev) | |
|---|---|---|
| ALL | 1084 | 50.8 (15.8) |
| AMP PEAK 15(8Q24.21) MUTATED | 169 | 46.2 (16.2) |
| AMP PEAK 15(8Q24.21) WILD-TYPE | 915 | 51.7 (15.6) |
Figure S92. Get High-res Image Gene #15: 'amp_8q24.21' versus Clinical Feature #2: 'YEARS_TO_BIRTH'
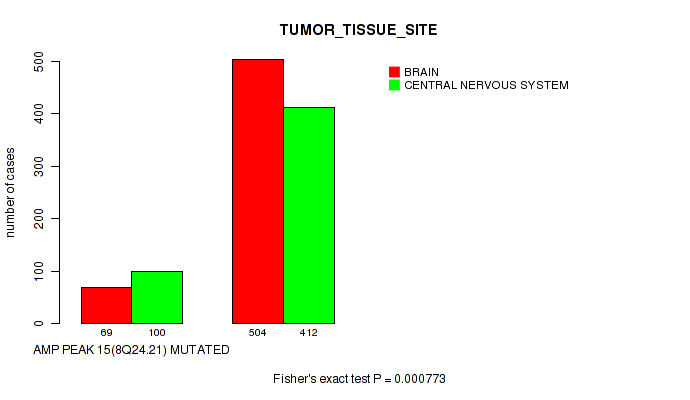
P value = 0.000773 (Fisher's exact test), Q value = 0.0024
Table S93. Gene #15: 'amp_8q24.21' versus Clinical Feature #3: 'TUMOR_TISSUE_SITE'
| nPatients | BRAIN | CENTRAL NERVOUS SYSTEM |
|---|---|---|
| ALL | 573 | 512 |
| AMP PEAK 15(8Q24.21) MUTATED | 69 | 100 |
| AMP PEAK 15(8Q24.21) WILD-TYPE | 504 | 412 |
Figure S93. Get High-res Image Gene #15: 'amp_8q24.21' versus Clinical Feature #3: 'TUMOR_TISSUE_SITE'
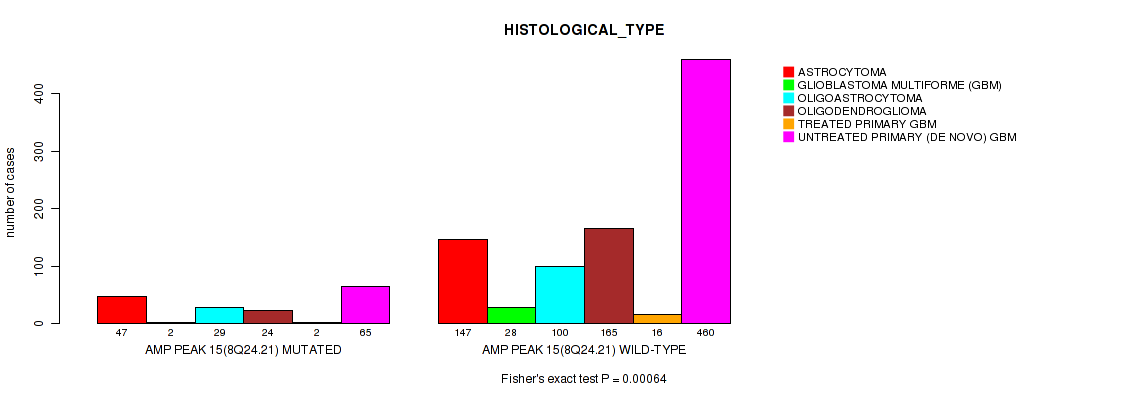
P value = 0.00064 (Fisher's exact test), Q value = 0.002
Table S94. Gene #15: 'amp_8q24.21' versus Clinical Feature #7: 'HISTOLOGICAL_TYPE'
| nPatients | ASTROCYTOMA | GLIOBLASTOMA MULTIFORME (GBM) | OLIGOASTROCYTOMA | OLIGODENDROGLIOMA | TREATED PRIMARY GBM | UNTREATED PRIMARY (DE NOVO) GBM |
|---|---|---|---|---|---|---|
| ALL | 194 | 30 | 129 | 189 | 18 | 525 |
| AMP PEAK 15(8Q24.21) MUTATED | 47 | 2 | 29 | 24 | 2 | 65 |
| AMP PEAK 15(8Q24.21) WILD-TYPE | 147 | 28 | 100 | 165 | 16 | 460 |
Figure S94. Get High-res Image Gene #15: 'amp_8q24.21' versus Clinical Feature #7: 'HISTOLOGICAL_TYPE'
P value = 0.0388 (logrank test), Q value = 0.079
Table S95. Gene #16: 'amp_9q34.3' versus Clinical Feature #1: 'Time to Death'
| nPatients | nDeath | Duration Range (Median), Month | |
|---|---|---|---|
| ALL | 1078 | 598 | 0.0 - 211.2 (16.0) |
| AMP PEAK 16(9Q34.3) MUTATED | 141 | 90 | 0.1 - 172.8 (15.0) |
| AMP PEAK 16(9Q34.3) WILD-TYPE | 937 | 508 | 0.0 - 211.2 (16.2) |
Figure S95. Get High-res Image Gene #16: 'amp_9q34.3' versus Clinical Feature #1: 'Time to Death'

P value = 0.0265 (Wilcoxon-test), Q value = 0.057
Table S96. Gene #16: 'amp_9q34.3' versus Clinical Feature #2: 'YEARS_TO_BIRTH'
| nPatients | Mean (Std.Dev) | |
|---|---|---|
| ALL | 1084 | 50.8 (15.8) |
| AMP PEAK 16(9Q34.3) MUTATED | 141 | 53.2 (16.7) |
| AMP PEAK 16(9Q34.3) WILD-TYPE | 943 | 50.5 (15.6) |
Figure S96. Get High-res Image Gene #16: 'amp_9q34.3' versus Clinical Feature #2: 'YEARS_TO_BIRTH'

P value = 0.000199 (Fisher's exact test), Q value = 0.00066
Table S97. Gene #16: 'amp_9q34.3' versus Clinical Feature #3: 'TUMOR_TISSUE_SITE'
| nPatients | BRAIN | CENTRAL NERVOUS SYSTEM |
|---|---|---|
| ALL | 573 | 512 |
| AMP PEAK 16(9Q34.3) MUTATED | 95 | 46 |
| AMP PEAK 16(9Q34.3) WILD-TYPE | 478 | 466 |
Figure S97. Get High-res Image Gene #16: 'amp_9q34.3' versus Clinical Feature #3: 'TUMOR_TISSUE_SITE'
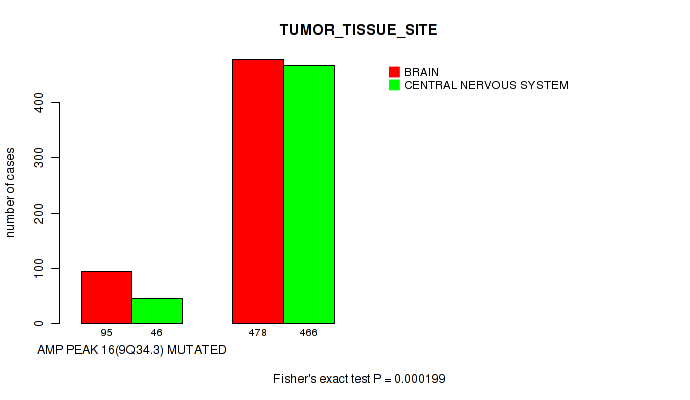
P value = 0.0675 (Fisher's exact test), Q value = 0.13
Table S98. Gene #16: 'amp_9q34.3' versus Clinical Feature #4: 'GENDER'
| nPatients | FEMALE | MALE |
|---|---|---|
| ALL | 453 | 632 |
| AMP PEAK 16(9Q34.3) MUTATED | 69 | 72 |
| AMP PEAK 16(9Q34.3) WILD-TYPE | 384 | 560 |
Figure S98. Get High-res Image Gene #16: 'amp_9q34.3' versus Clinical Feature #4: 'GENDER'
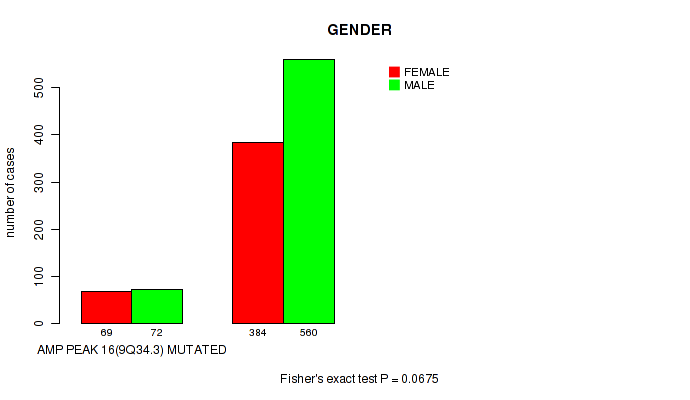
P value = 0.0859 (Fisher's exact test), Q value = 0.16
Table S99. Gene #16: 'amp_9q34.3' versus Clinical Feature #5: 'RADIATION_THERAPY'
| nPatients | NO | YES |
|---|---|---|
| ALL | 258 | 770 |
| AMP PEAK 16(9Q34.3) MUTATED | 25 | 108 |
| AMP PEAK 16(9Q34.3) WILD-TYPE | 233 | 662 |
Figure S99. Get High-res Image Gene #16: 'amp_9q34.3' versus Clinical Feature #5: 'RADIATION_THERAPY'
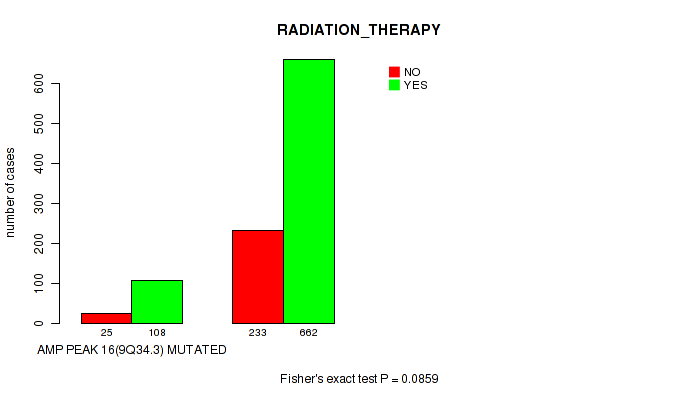
P value = 0.0747 (Wilcoxon-test), Q value = 0.14
Table S100. Gene #16: 'amp_9q34.3' versus Clinical Feature #6: 'KARNOFSKY_PERFORMANCE_SCORE'
| nPatients | Mean (Std.Dev) | |
|---|---|---|
| ALL | 732 | 81.1 (15.3) |
| AMP PEAK 16(9Q34.3) MUTATED | 104 | 78.3 (16.9) |
| AMP PEAK 16(9Q34.3) WILD-TYPE | 628 | 81.5 (15.0) |
Figure S100. Get High-res Image Gene #16: 'amp_9q34.3' versus Clinical Feature #6: 'KARNOFSKY_PERFORMANCE_SCORE'

P value = 0.00048 (Fisher's exact test), Q value = 0.0015
Table S101. Gene #16: 'amp_9q34.3' versus Clinical Feature #7: 'HISTOLOGICAL_TYPE'
| nPatients | ASTROCYTOMA | GLIOBLASTOMA MULTIFORME (GBM) | OLIGOASTROCYTOMA | OLIGODENDROGLIOMA | TREATED PRIMARY GBM | UNTREATED PRIMARY (DE NOVO) GBM |
|---|---|---|---|---|---|---|
| ALL | 194 | 30 | 129 | 189 | 18 | 525 |
| AMP PEAK 16(9Q34.3) MUTATED | 24 | 4 | 13 | 9 | 2 | 89 |
| AMP PEAK 16(9Q34.3) WILD-TYPE | 170 | 26 | 116 | 180 | 16 | 436 |
Figure S101. Get High-res Image Gene #16: 'amp_9q34.3' versus Clinical Feature #7: 'HISTOLOGICAL_TYPE'
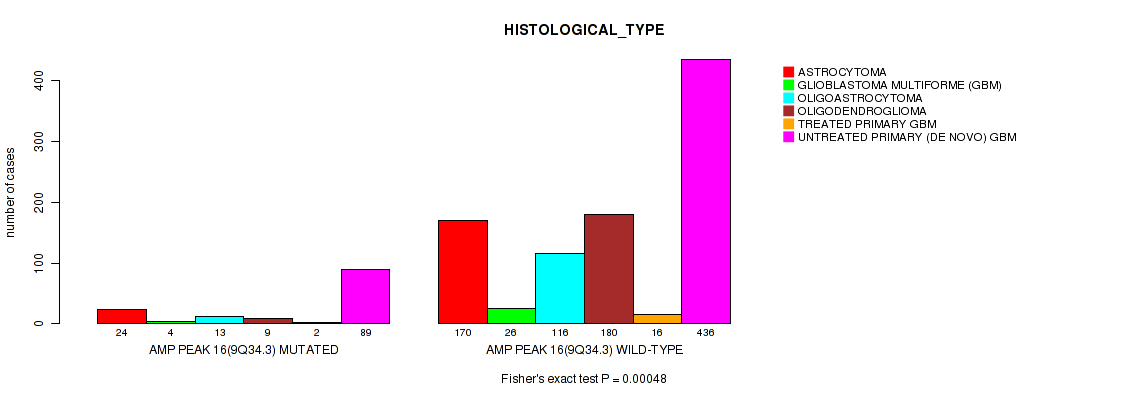
P value = 4.74e-07 (logrank test), Q value = 2.6e-06
Table S102. Gene #17: 'amp_10p15.1' versus Clinical Feature #1: 'Time to Death'
| nPatients | nDeath | Duration Range (Median), Month | |
|---|---|---|---|
| ALL | 1078 | 598 | 0.0 - 211.2 (16.0) |
| AMP PEAK 17(10P15.1) MUTATED | 88 | 31 | 0.1 - 172.8 (28.6) |
| AMP PEAK 17(10P15.1) WILD-TYPE | 990 | 567 | 0.0 - 211.2 (15.3) |
Figure S102. Get High-res Image Gene #17: 'amp_10p15.1' versus Clinical Feature #1: 'Time to Death'
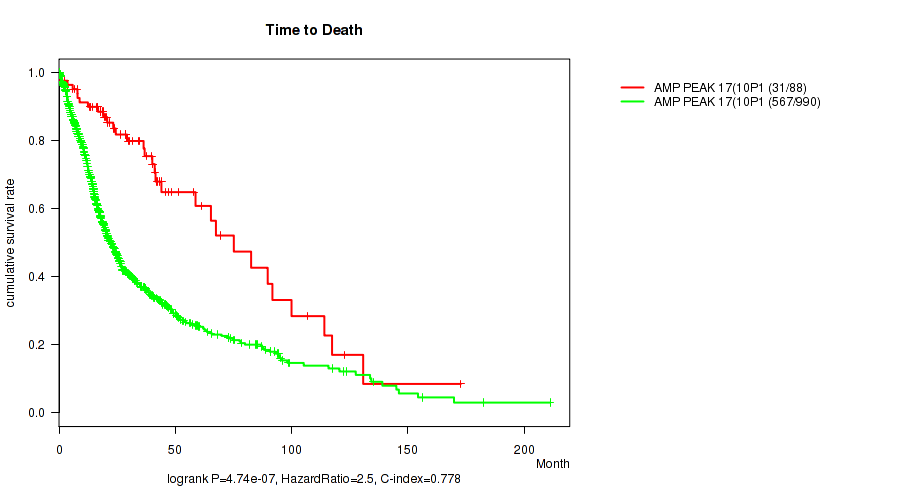
P value = 3.94e-15 (Wilcoxon-test), Q value = 4.7e-14
Table S103. Gene #17: 'amp_10p15.1' versus Clinical Feature #2: 'YEARS_TO_BIRTH'
| nPatients | Mean (Std.Dev) | |
|---|---|---|
| ALL | 1084 | 50.8 (15.8) |
| AMP PEAK 17(10P15.1) MUTATED | 88 | 38.2 (12.4) |
| AMP PEAK 17(10P15.1) WILD-TYPE | 996 | 51.9 (15.6) |
Figure S103. Get High-res Image Gene #17: 'amp_10p15.1' versus Clinical Feature #2: 'YEARS_TO_BIRTH'
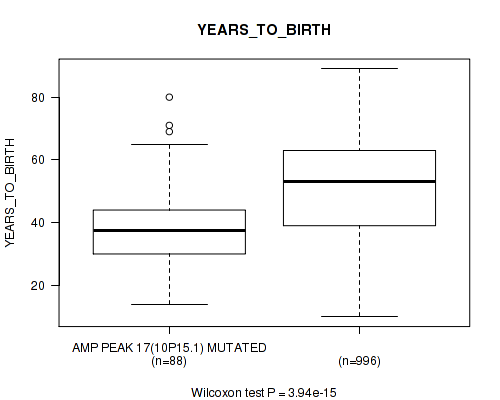
P value = 5.83e-10 (Fisher's exact test), Q value = 4.1e-09
Table S104. Gene #17: 'amp_10p15.1' versus Clinical Feature #3: 'TUMOR_TISSUE_SITE'
| nPatients | BRAIN | CENTRAL NERVOUS SYSTEM |
|---|---|---|
| ALL | 573 | 512 |
| AMP PEAK 17(10P15.1) MUTATED | 19 | 69 |
| AMP PEAK 17(10P15.1) WILD-TYPE | 554 | 443 |
Figure S104. Get High-res Image Gene #17: 'amp_10p15.1' versus Clinical Feature #3: 'TUMOR_TISSUE_SITE'
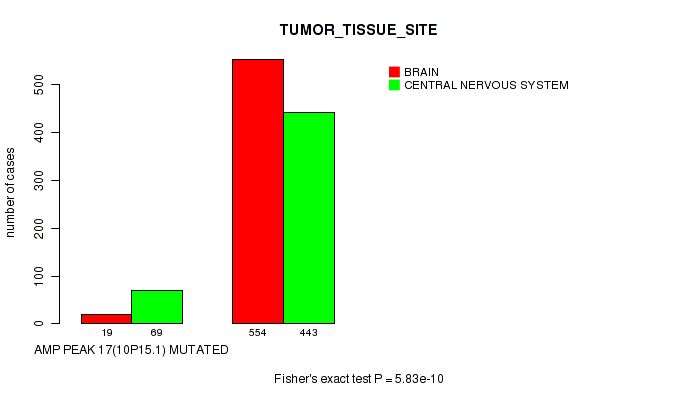
P value = 0.000762 (Wilcoxon-test), Q value = 0.0024
Table S105. Gene #17: 'amp_10p15.1' versus Clinical Feature #6: 'KARNOFSKY_PERFORMANCE_SCORE'
| nPatients | Mean (Std.Dev) | |
|---|---|---|
| ALL | 732 | 81.1 (15.3) |
| AMP PEAK 17(10P15.1) MUTATED | 58 | 86.9 (11.9) |
| AMP PEAK 17(10P15.1) WILD-TYPE | 674 | 80.6 (15.5) |
Figure S105. Get High-res Image Gene #17: 'amp_10p15.1' versus Clinical Feature #6: 'KARNOFSKY_PERFORMANCE_SCORE'
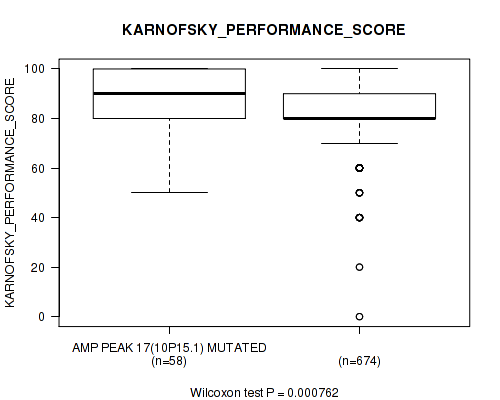
P value = 1e-05 (Fisher's exact test), Q value = 3.9e-05
Table S106. Gene #17: 'amp_10p15.1' versus Clinical Feature #7: 'HISTOLOGICAL_TYPE'
| nPatients | ASTROCYTOMA | GLIOBLASTOMA MULTIFORME (GBM) | OLIGOASTROCYTOMA | OLIGODENDROGLIOMA | TREATED PRIMARY GBM | UNTREATED PRIMARY (DE NOVO) GBM |
|---|---|---|---|---|---|---|
| ALL | 194 | 30 | 129 | 189 | 18 | 525 |
| AMP PEAK 17(10P15.1) MUTATED | 37 | 1 | 23 | 9 | 1 | 17 |
| AMP PEAK 17(10P15.1) WILD-TYPE | 157 | 29 | 106 | 180 | 17 | 508 |
Figure S106. Get High-res Image Gene #17: 'amp_10p15.1' versus Clinical Feature #7: 'HISTOLOGICAL_TYPE'
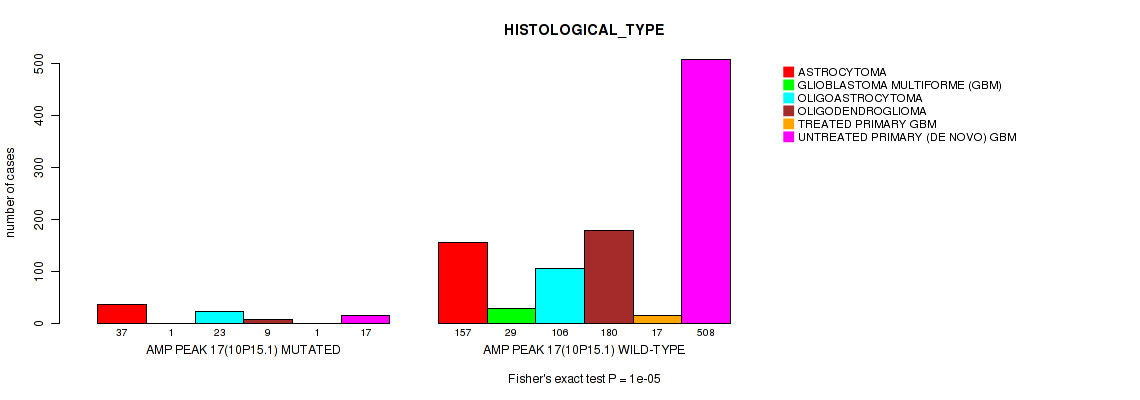
P value = 0.0843 (Fisher's exact test), Q value = 0.16
Table S107. Gene #17: 'amp_10p15.1' versus Clinical Feature #9: 'ETHNICITY'
| nPatients | HISPANIC OR LATINO | NOT HISPANIC OR LATINO |
|---|---|---|
| ALL | 44 | 921 |
| AMP PEAK 17(10P15.1) MUTATED | 7 | 73 |
| AMP PEAK 17(10P15.1) WILD-TYPE | 37 | 848 |
Figure S107. Get High-res Image Gene #17: 'amp_10p15.1' versus Clinical Feature #9: 'ETHNICITY'

P value = 0.124 (Fisher's exact test), Q value = 0.21
Table S108. Gene #18: 'amp_11p13' versus Clinical Feature #7: 'HISTOLOGICAL_TYPE'
| nPatients | ASTROCYTOMA | GLIOBLASTOMA MULTIFORME (GBM) | OLIGOASTROCYTOMA | OLIGODENDROGLIOMA | TREATED PRIMARY GBM | UNTREATED PRIMARY (DE NOVO) GBM |
|---|---|---|---|---|---|---|
| ALL | 194 | 30 | 129 | 189 | 18 | 525 |
| AMP PEAK 18(11P13) MUTATED | 5 | 2 | 7 | 17 | 1 | 27 |
| AMP PEAK 18(11P13) WILD-TYPE | 189 | 28 | 122 | 172 | 17 | 498 |
Figure S108. Get High-res Image Gene #18: 'amp_11p13' versus Clinical Feature #7: 'HISTOLOGICAL_TYPE'
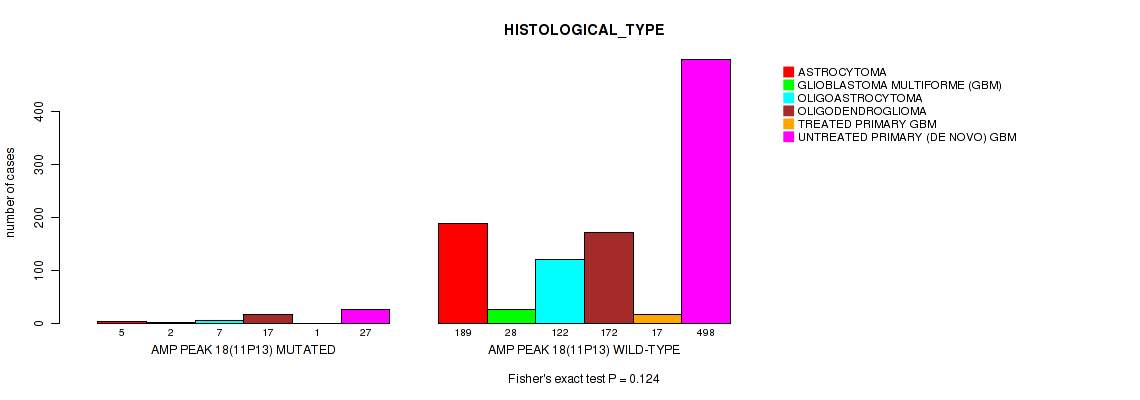
P value = 1.68e-06 (logrank test), Q value = 9.1e-06
Table S109. Gene #19: 'amp_11q24.1' versus Clinical Feature #1: 'Time to Death'
| nPatients | nDeath | Duration Range (Median), Month | |
|---|---|---|---|
| ALL | 1078 | 598 | 0.0 - 211.2 (16.0) |
| AMP PEAK 19(11Q24.1) MUTATED | 111 | 40 | 0.2 - 211.2 (24.2) |
| AMP PEAK 19(11Q24.1) WILD-TYPE | 967 | 558 | 0.0 - 172.8 (15.3) |
Figure S109. Get High-res Image Gene #19: 'amp_11q24.1' versus Clinical Feature #1: 'Time to Death'
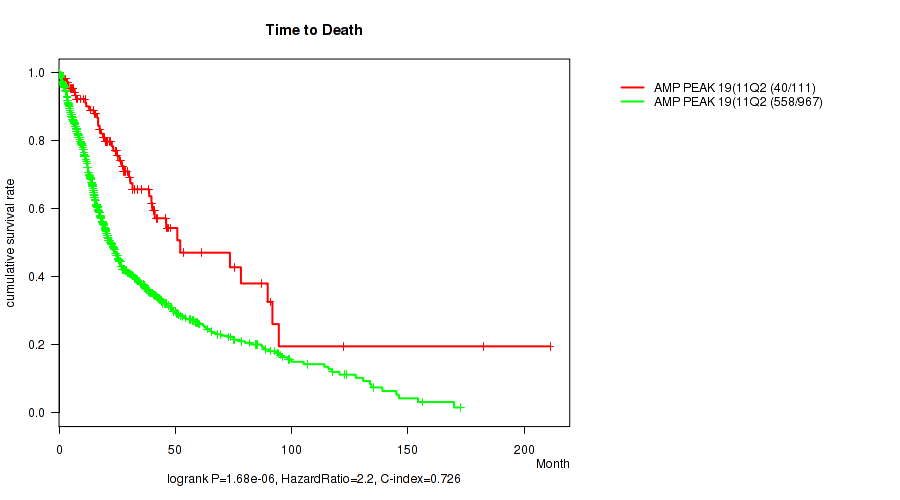
P value = 0.000446 (Wilcoxon-test), Q value = 0.0014
Table S110. Gene #19: 'amp_11q24.1' versus Clinical Feature #2: 'YEARS_TO_BIRTH'
| nPatients | Mean (Std.Dev) | |
|---|---|---|
| ALL | 1084 | 50.8 (15.8) |
| AMP PEAK 19(11Q24.1) MUTATED | 112 | 46.0 (14.0) |
| AMP PEAK 19(11Q24.1) WILD-TYPE | 972 | 51.4 (15.9) |
Figure S110. Get High-res Image Gene #19: 'amp_11q24.1' versus Clinical Feature #2: 'YEARS_TO_BIRTH'
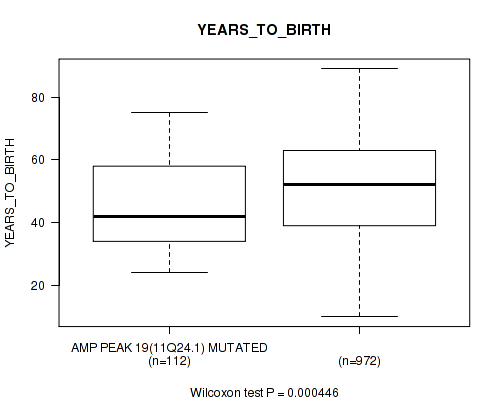
P value = 5.41e-12 (Fisher's exact test), Q value = 4.7e-11
Table S111. Gene #19: 'amp_11q24.1' versus Clinical Feature #3: 'TUMOR_TISSUE_SITE'
| nPatients | BRAIN | CENTRAL NERVOUS SYSTEM |
|---|---|---|
| ALL | 573 | 512 |
| AMP PEAK 19(11Q24.1) MUTATED | 25 | 87 |
| AMP PEAK 19(11Q24.1) WILD-TYPE | 548 | 425 |
Figure S111. Get High-res Image Gene #19: 'amp_11q24.1' versus Clinical Feature #3: 'TUMOR_TISSUE_SITE'
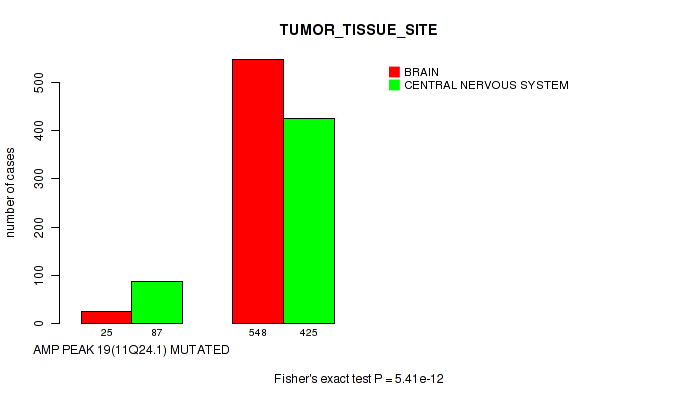
P value = 0.0109 (Wilcoxon-test), Q value = 0.026
Table S112. Gene #19: 'amp_11q24.1' versus Clinical Feature #6: 'KARNOFSKY_PERFORMANCE_SCORE'
| nPatients | Mean (Std.Dev) | |
|---|---|---|
| ALL | 732 | 81.1 (15.3) |
| AMP PEAK 19(11Q24.1) MUTATED | 74 | 85.0 (13.3) |
| AMP PEAK 19(11Q24.1) WILD-TYPE | 658 | 80.6 (15.4) |
Figure S112. Get High-res Image Gene #19: 'amp_11q24.1' versus Clinical Feature #6: 'KARNOFSKY_PERFORMANCE_SCORE'
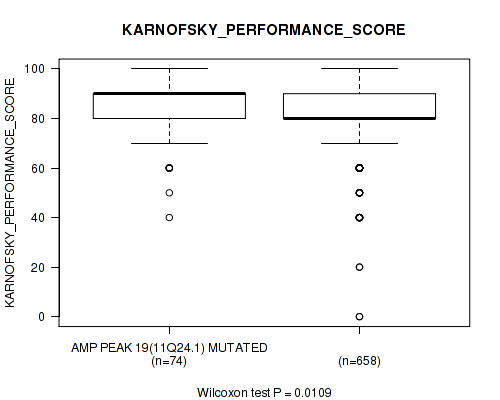
P value = 1e-05 (Fisher's exact test), Q value = 3.9e-05
Table S113. Gene #19: 'amp_11q24.1' versus Clinical Feature #7: 'HISTOLOGICAL_TYPE'
| nPatients | ASTROCYTOMA | GLIOBLASTOMA MULTIFORME (GBM) | OLIGOASTROCYTOMA | OLIGODENDROGLIOMA | TREATED PRIMARY GBM | UNTREATED PRIMARY (DE NOVO) GBM |
|---|---|---|---|---|---|---|
| ALL | 194 | 30 | 129 | 189 | 18 | 525 |
| AMP PEAK 19(11Q24.1) MUTATED | 33 | 0 | 18 | 36 | 1 | 24 |
| AMP PEAK 19(11Q24.1) WILD-TYPE | 161 | 30 | 111 | 153 | 17 | 501 |
Figure S113. Get High-res Image Gene #19: 'amp_11q24.1' versus Clinical Feature #7: 'HISTOLOGICAL_TYPE'
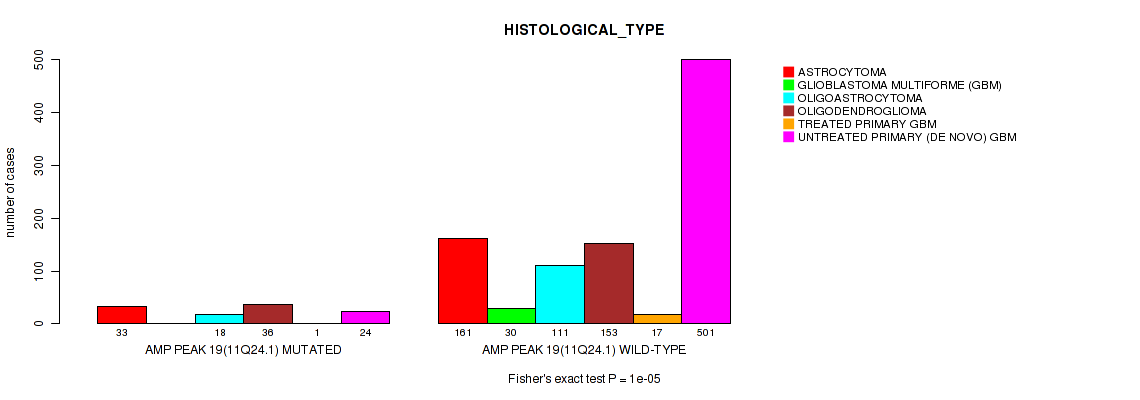
P value = 0.0268 (Wilcoxon-test), Q value = 0.057
Table S114. Gene #20: 'amp_12p13.32' versus Clinical Feature #2: 'YEARS_TO_BIRTH'
| nPatients | Mean (Std.Dev) | |
|---|---|---|
| ALL | 1084 | 50.8 (15.8) |
| AMP PEAK 20(12P13.32) MUTATED | 152 | 48.1 (16.5) |
| AMP PEAK 20(12P13.32) WILD-TYPE | 932 | 51.3 (15.6) |
Figure S114. Get High-res Image Gene #20: 'amp_12p13.32' versus Clinical Feature #2: 'YEARS_TO_BIRTH'
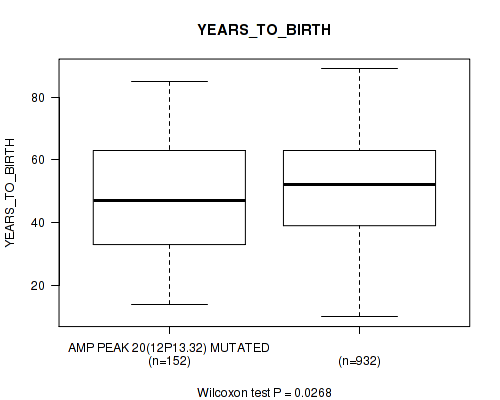
P value = 0.00973 (Fisher's exact test), Q value = 0.024
Table S115. Gene #20: 'amp_12p13.32' versus Clinical Feature #5: 'RADIATION_THERAPY'
| nPatients | NO | YES |
|---|---|---|
| ALL | 258 | 770 |
| AMP PEAK 20(12P13.32) MUTATED | 24 | 122 |
| AMP PEAK 20(12P13.32) WILD-TYPE | 234 | 648 |
Figure S115. Get High-res Image Gene #20: 'amp_12p13.32' versus Clinical Feature #5: 'RADIATION_THERAPY'

P value = 5.66e-15 (logrank test), Q value = 6.5e-14
Table S116. Gene #21: 'amp_12q14.1' versus Clinical Feature #1: 'Time to Death'
| nPatients | nDeath | Duration Range (Median), Month | |
|---|---|---|---|
| ALL | 1078 | 598 | 0.0 - 211.2 (16.0) |
| AMP PEAK 21(12Q14.1) MUTATED | 169 | 133 | 0.1 - 84.3 (14.3) |
| AMP PEAK 21(12Q14.1) WILD-TYPE | 909 | 465 | 0.0 - 211.2 (16.6) |
Figure S116. Get High-res Image Gene #21: 'amp_12q14.1' versus Clinical Feature #1: 'Time to Death'
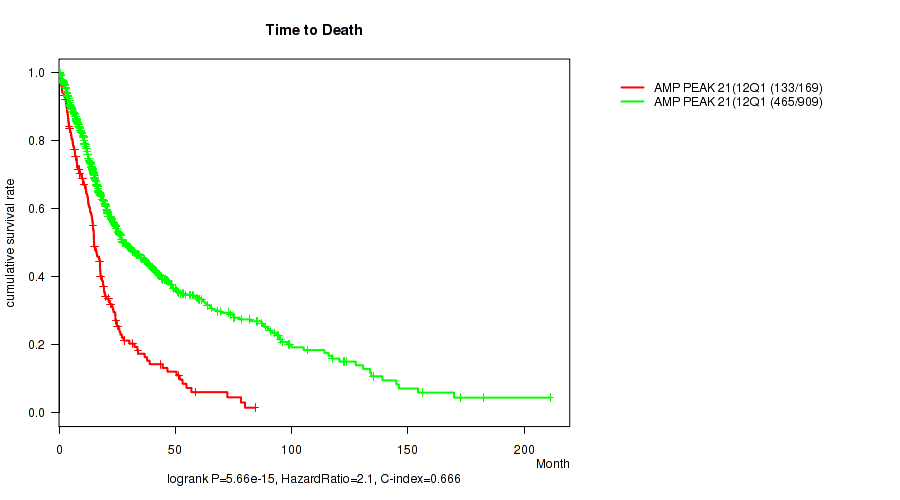
P value = 9.7e-06 (Wilcoxon-test), Q value = 3.9e-05
Table S117. Gene #21: 'amp_12q14.1' versus Clinical Feature #2: 'YEARS_TO_BIRTH'
| nPatients | Mean (Std.Dev) | |
|---|---|---|
| ALL | 1084 | 50.8 (15.8) |
| AMP PEAK 21(12Q14.1) MUTATED | 171 | 55.7 (15.3) |
| AMP PEAK 21(12Q14.1) WILD-TYPE | 913 | 49.9 (15.7) |
Figure S117. Get High-res Image Gene #21: 'amp_12q14.1' versus Clinical Feature #2: 'YEARS_TO_BIRTH'
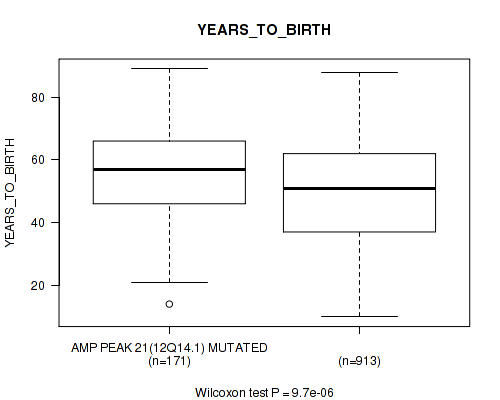
P value = 7.86e-14 (Fisher's exact test), Q value = 8e-13
Table S118. Gene #21: 'amp_12q14.1' versus Clinical Feature #3: 'TUMOR_TISSUE_SITE'
| nPatients | BRAIN | CENTRAL NERVOUS SYSTEM |
|---|---|---|
| ALL | 573 | 512 |
| AMP PEAK 21(12Q14.1) MUTATED | 134 | 37 |
| AMP PEAK 21(12Q14.1) WILD-TYPE | 439 | 475 |
Figure S118. Get High-res Image Gene #21: 'amp_12q14.1' versus Clinical Feature #3: 'TUMOR_TISSUE_SITE'

P value = 0.0104 (Fisher's exact test), Q value = 0.025
Table S119. Gene #21: 'amp_12q14.1' versus Clinical Feature #5: 'RADIATION_THERAPY'
| nPatients | NO | YES |
|---|---|---|
| ALL | 258 | 770 |
| AMP PEAK 21(12Q14.1) MUTATED | 28 | 136 |
| AMP PEAK 21(12Q14.1) WILD-TYPE | 230 | 634 |
Figure S119. Get High-res Image Gene #21: 'amp_12q14.1' versus Clinical Feature #5: 'RADIATION_THERAPY'
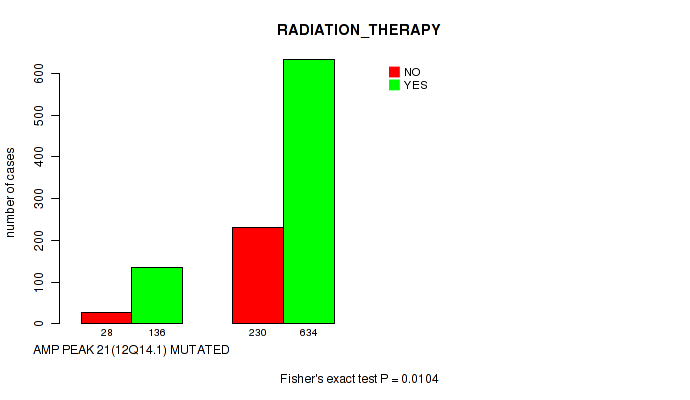
P value = 0.13 (Wilcoxon-test), Q value = 0.22
Table S120. Gene #21: 'amp_12q14.1' versus Clinical Feature #6: 'KARNOFSKY_PERFORMANCE_SCORE'
| nPatients | Mean (Std.Dev) | |
|---|---|---|
| ALL | 732 | 81.1 (15.3) |
| AMP PEAK 21(12Q14.1) MUTATED | 119 | 79.2 (15.5) |
| AMP PEAK 21(12Q14.1) WILD-TYPE | 613 | 81.5 (15.2) |
Figure S120. Get High-res Image Gene #21: 'amp_12q14.1' versus Clinical Feature #6: 'KARNOFSKY_PERFORMANCE_SCORE'
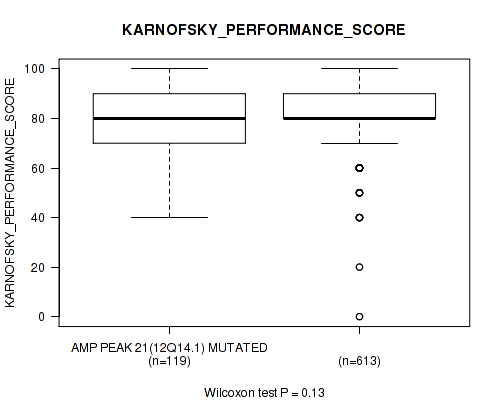
P value = 1e-05 (Fisher's exact test), Q value = 3.9e-05
Table S121. Gene #21: 'amp_12q14.1' versus Clinical Feature #7: 'HISTOLOGICAL_TYPE'
| nPatients | ASTROCYTOMA | GLIOBLASTOMA MULTIFORME (GBM) | OLIGOASTROCYTOMA | OLIGODENDROGLIOMA | TREATED PRIMARY GBM | UNTREATED PRIMARY (DE NOVO) GBM |
|---|---|---|---|---|---|---|
| ALL | 194 | 30 | 129 | 189 | 18 | 525 |
| AMP PEAK 21(12Q14.1) MUTATED | 22 | 5 | 5 | 10 | 3 | 126 |
| AMP PEAK 21(12Q14.1) WILD-TYPE | 172 | 25 | 124 | 179 | 15 | 399 |
Figure S121. Get High-res Image Gene #21: 'amp_12q14.1' versus Clinical Feature #7: 'HISTOLOGICAL_TYPE'
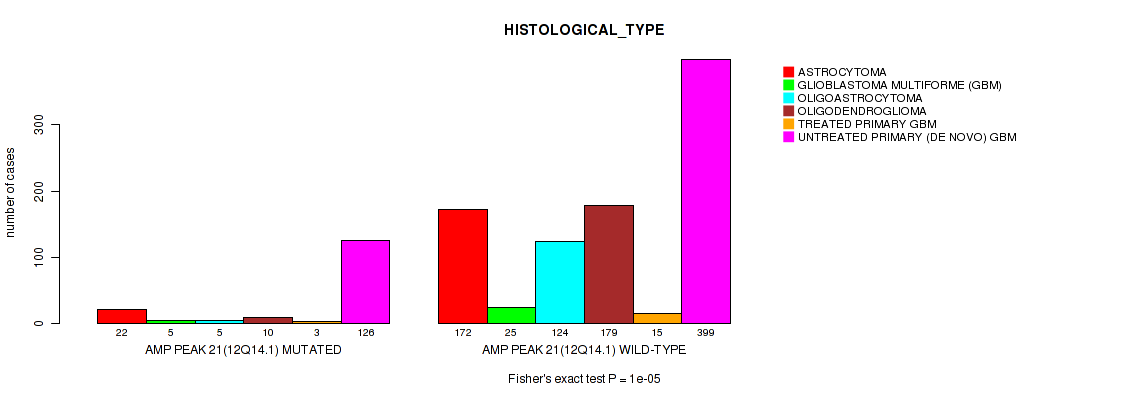
P value = 0.0337 (Fisher's exact test), Q value = 0.07
Table S122. Gene #21: 'amp_12q14.1' versus Clinical Feature #9: 'ETHNICITY'
| nPatients | HISPANIC OR LATINO | NOT HISPANIC OR LATINO |
|---|---|---|
| ALL | 44 | 921 |
| AMP PEAK 21(12Q14.1) MUTATED | 2 | 150 |
| AMP PEAK 21(12Q14.1) WILD-TYPE | 42 | 771 |
Figure S122. Get High-res Image Gene #21: 'amp_12q14.1' versus Clinical Feature #9: 'ETHNICITY'
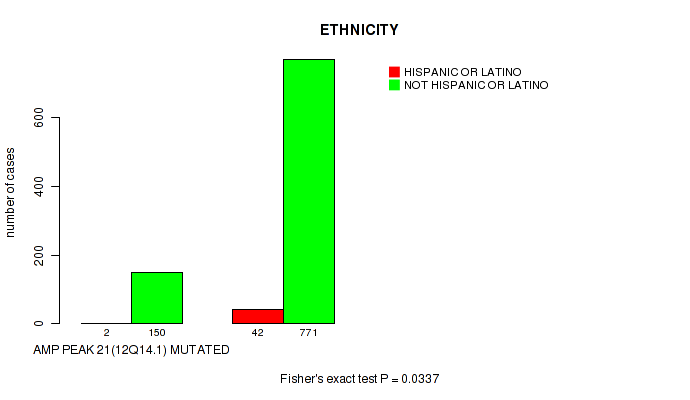
P value = 1.7e-10 (logrank test), Q value = 1.3e-09
Table S123. Gene #22: 'amp_12q15' versus Clinical Feature #1: 'Time to Death'
| nPatients | nDeath | Duration Range (Median), Month | |
|---|---|---|---|
| ALL | 1078 | 598 | 0.0 - 211.2 (16.0) |
| AMP PEAK 22(12Q15) MUTATED | 110 | 89 | 0.2 - 84.3 (14.0) |
| AMP PEAK 22(12Q15) WILD-TYPE | 968 | 509 | 0.0 - 211.2 (16.4) |
Figure S123. Get High-res Image Gene #22: 'amp_12q15' versus Clinical Feature #1: 'Time to Death'
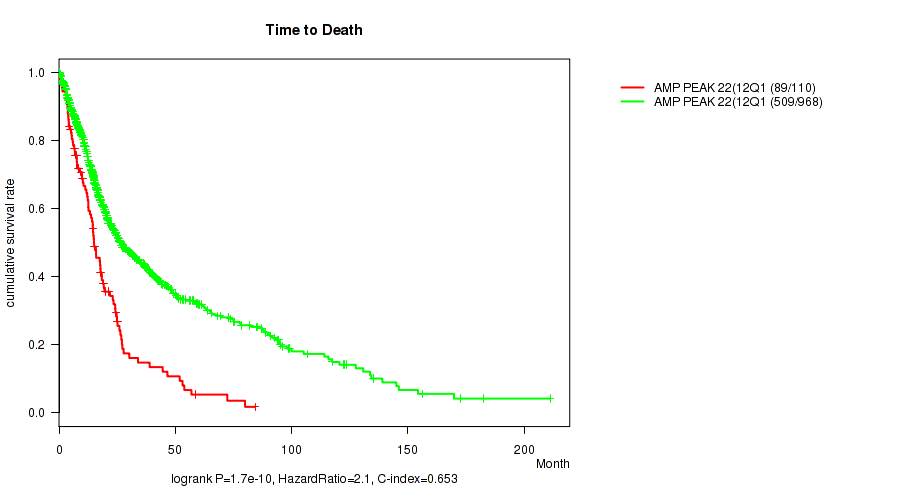
P value = 3.2e-05 (Wilcoxon-test), Q value = 0.00012
Table S124. Gene #22: 'amp_12q15' versus Clinical Feature #2: 'YEARS_TO_BIRTH'
| nPatients | Mean (Std.Dev) | |
|---|---|---|
| ALL | 1084 | 50.8 (15.8) |
| AMP PEAK 22(12Q15) MUTATED | 111 | 56.8 (14.3) |
| AMP PEAK 22(12Q15) WILD-TYPE | 973 | 50.1 (15.8) |
Figure S124. Get High-res Image Gene #22: 'amp_12q15' versus Clinical Feature #2: 'YEARS_TO_BIRTH'
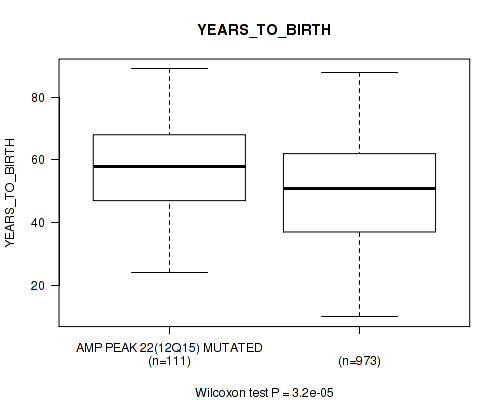
P value = 8.88e-13 (Fisher's exact test), Q value = 8.2e-12
Table S125. Gene #22: 'amp_12q15' versus Clinical Feature #3: 'TUMOR_TISSUE_SITE'
| nPatients | BRAIN | CENTRAL NERVOUS SYSTEM |
|---|---|---|
| ALL | 573 | 512 |
| AMP PEAK 22(12Q15) MUTATED | 93 | 18 |
| AMP PEAK 22(12Q15) WILD-TYPE | 480 | 494 |
Figure S125. Get High-res Image Gene #22: 'amp_12q15' versus Clinical Feature #3: 'TUMOR_TISSUE_SITE'

P value = 0.0443 (Fisher's exact test), Q value = 0.089
Table S126. Gene #22: 'amp_12q15' versus Clinical Feature #5: 'RADIATION_THERAPY'
| nPatients | NO | YES |
|---|---|---|
| ALL | 258 | 770 |
| AMP PEAK 22(12Q15) MUTATED | 18 | 88 |
| AMP PEAK 22(12Q15) WILD-TYPE | 240 | 682 |
Figure S126. Get High-res Image Gene #22: 'amp_12q15' versus Clinical Feature #5: 'RADIATION_THERAPY'
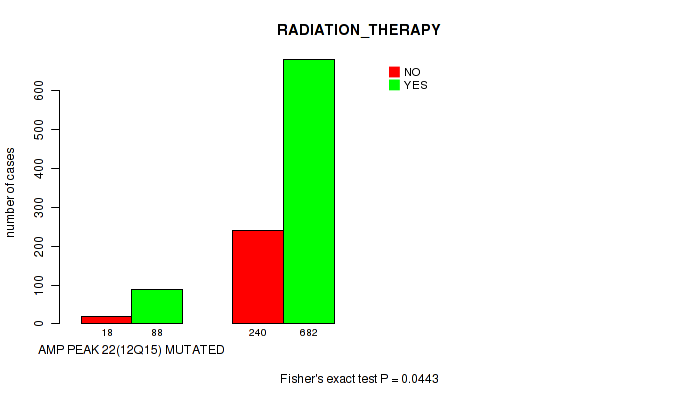
P value = 0.0251 (Wilcoxon-test), Q value = 0.055
Table S127. Gene #22: 'amp_12q15' versus Clinical Feature #6: 'KARNOFSKY_PERFORMANCE_SCORE'
| nPatients | Mean (Std.Dev) | |
|---|---|---|
| ALL | 732 | 81.1 (15.3) |
| AMP PEAK 22(12Q15) MUTATED | 87 | 77.6 (16.7) |
| AMP PEAK 22(12Q15) WILD-TYPE | 645 | 81.6 (15.0) |
Figure S127. Get High-res Image Gene #22: 'amp_12q15' versus Clinical Feature #6: 'KARNOFSKY_PERFORMANCE_SCORE'
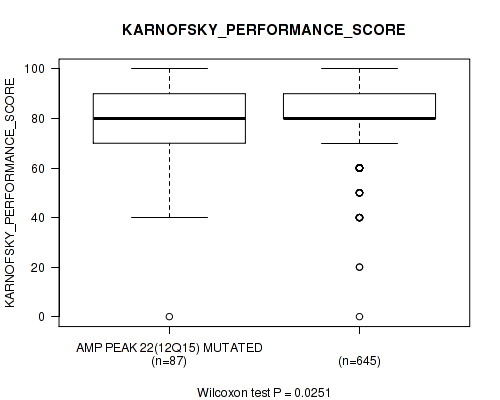
P value = 1e-05 (Fisher's exact test), Q value = 3.9e-05
Table S128. Gene #22: 'amp_12q15' versus Clinical Feature #7: 'HISTOLOGICAL_TYPE'
| nPatients | ASTROCYTOMA | GLIOBLASTOMA MULTIFORME (GBM) | OLIGOASTROCYTOMA | OLIGODENDROGLIOMA | TREATED PRIMARY GBM | UNTREATED PRIMARY (DE NOVO) GBM |
|---|---|---|---|---|---|---|
| ALL | 194 | 30 | 129 | 189 | 18 | 525 |
| AMP PEAK 22(12Q15) MUTATED | 8 | 4 | 2 | 8 | 2 | 87 |
| AMP PEAK 22(12Q15) WILD-TYPE | 186 | 26 | 127 | 181 | 16 | 438 |
Figure S128. Get High-res Image Gene #22: 'amp_12q15' versus Clinical Feature #7: 'HISTOLOGICAL_TYPE'
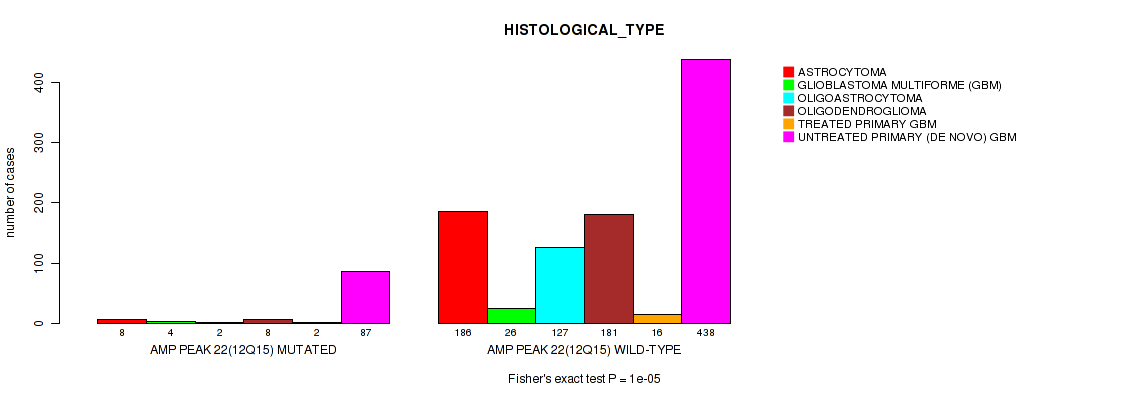
P value = 0.0174 (Fisher's exact test), Q value = 0.04
Table S129. Gene #22: 'amp_12q15' versus Clinical Feature #9: 'ETHNICITY'
| nPatients | HISPANIC OR LATINO | NOT HISPANIC OR LATINO |
|---|---|---|
| ALL | 44 | 921 |
| AMP PEAK 22(12Q15) MUTATED | 0 | 97 |
| AMP PEAK 22(12Q15) WILD-TYPE | 44 | 824 |
Figure S129. Get High-res Image Gene #22: 'amp_12q15' versus Clinical Feature #9: 'ETHNICITY'

P value = 0.0856 (Wilcoxon-test), Q value = 0.16
Table S130. Gene #23: 'amp_13q34' versus Clinical Feature #6: 'KARNOFSKY_PERFORMANCE_SCORE'
| nPatients | Mean (Std.Dev) | |
|---|---|---|
| ALL | 732 | 81.1 (15.3) |
| AMP PEAK 23(13Q34) MUTATED | 36 | 76.9 (15.8) |
| AMP PEAK 23(13Q34) WILD-TYPE | 696 | 81.3 (15.2) |
Figure S130. Get High-res Image Gene #23: 'amp_13q34' versus Clinical Feature #6: 'KARNOFSKY_PERFORMANCE_SCORE'
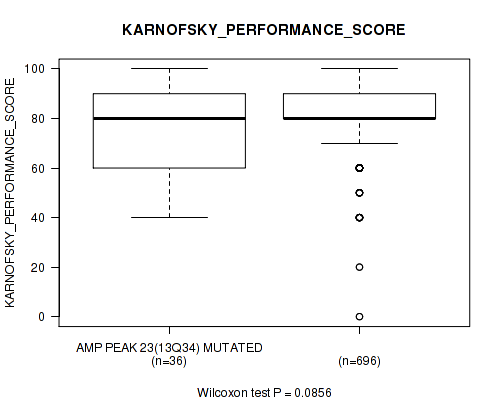
P value = 0.00179 (logrank test), Q value = 0.0053
Table S131. Gene #24: 'amp_14q32.33' versus Clinical Feature #1: 'Time to Death'
| nPatients | nDeath | Duration Range (Median), Month | |
|---|---|---|---|
| ALL | 1078 | 598 | 0.0 - 211.2 (16.0) |
| AMP PEAK 24(14Q32.33) MUTATED | 44 | 34 | 0.4 - 72.9 (13.8) |
| AMP PEAK 24(14Q32.33) WILD-TYPE | 1034 | 564 | 0.0 - 211.2 (16.1) |
Figure S131. Get High-res Image Gene #24: 'amp_14q32.33' versus Clinical Feature #1: 'Time to Death'
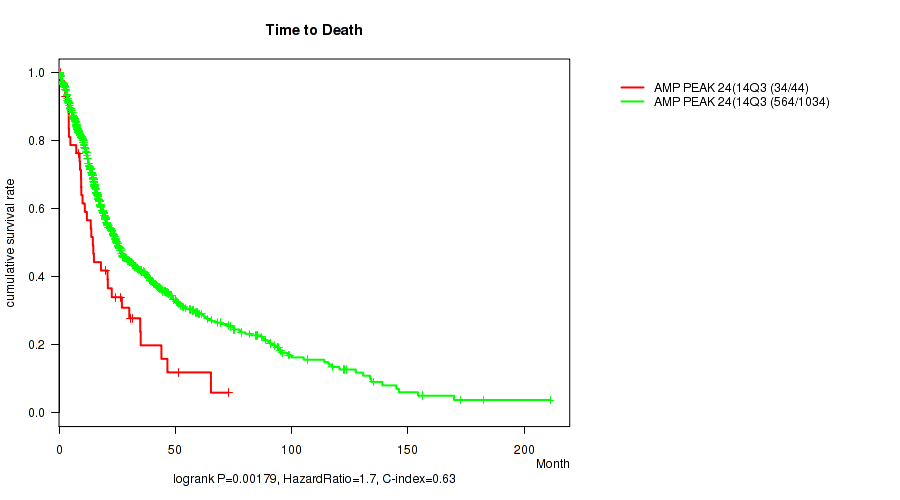
P value = 9.57e-06 (Wilcoxon-test), Q value = 3.9e-05
Table S132. Gene #24: 'amp_14q32.33' versus Clinical Feature #2: 'YEARS_TO_BIRTH'
| nPatients | Mean (Std.Dev) | |
|---|---|---|
| ALL | 1084 | 50.8 (15.8) |
| AMP PEAK 24(14Q32.33) MUTATED | 44 | 61.0 (14.9) |
| AMP PEAK 24(14Q32.33) WILD-TYPE | 1040 | 50.4 (15.7) |
Figure S132. Get High-res Image Gene #24: 'amp_14q32.33' versus Clinical Feature #2: 'YEARS_TO_BIRTH'
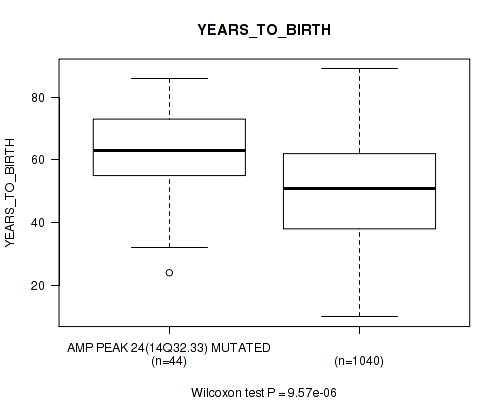
P value = 7.59e-05 (Fisher's exact test), Q value = 0.00026
Table S133. Gene #24: 'amp_14q32.33' versus Clinical Feature #3: 'TUMOR_TISSUE_SITE'
| nPatients | BRAIN | CENTRAL NERVOUS SYSTEM |
|---|---|---|
| ALL | 573 | 512 |
| AMP PEAK 24(14Q32.33) MUTATED | 36 | 8 |
| AMP PEAK 24(14Q32.33) WILD-TYPE | 537 | 504 |
Figure S133. Get High-res Image Gene #24: 'amp_14q32.33' versus Clinical Feature #3: 'TUMOR_TISSUE_SITE'
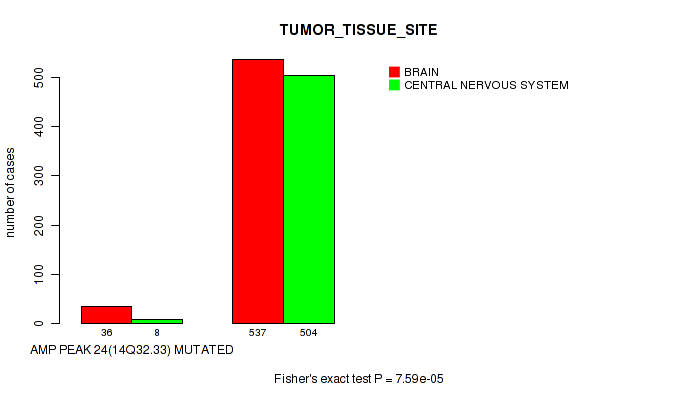
P value = 0.0643 (Fisher's exact test), Q value = 0.12
Table S134. Gene #24: 'amp_14q32.33' versus Clinical Feature #5: 'RADIATION_THERAPY'
| nPatients | NO | YES |
|---|---|---|
| ALL | 258 | 770 |
| AMP PEAK 24(14Q32.33) MUTATED | 5 | 36 |
| AMP PEAK 24(14Q32.33) WILD-TYPE | 253 | 734 |
Figure S134. Get High-res Image Gene #24: 'amp_14q32.33' versus Clinical Feature #5: 'RADIATION_THERAPY'
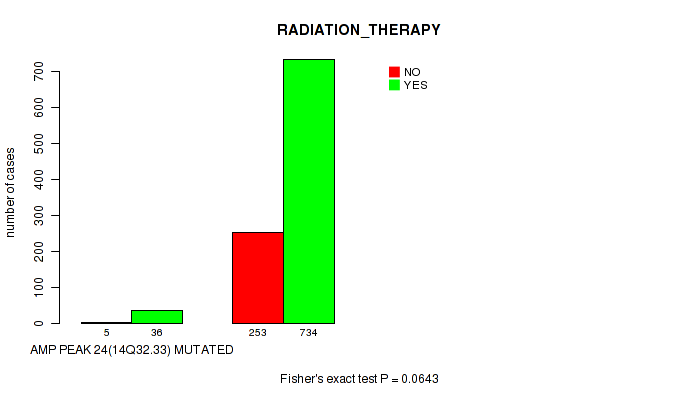
P value = 0.09 (Wilcoxon-test), Q value = 0.16
Table S135. Gene #24: 'amp_14q32.33' versus Clinical Feature #6: 'KARNOFSKY_PERFORMANCE_SCORE'
| nPatients | Mean (Std.Dev) | |
|---|---|---|
| ALL | 732 | 81.1 (15.3) |
| AMP PEAK 24(14Q32.33) MUTATED | 33 | 76.7 (16.7) |
| AMP PEAK 24(14Q32.33) WILD-TYPE | 699 | 81.3 (15.2) |
Figure S135. Get High-res Image Gene #24: 'amp_14q32.33' versus Clinical Feature #6: 'KARNOFSKY_PERFORMANCE_SCORE'

P value = 0.00226 (Fisher's exact test), Q value = 0.0065
Table S136. Gene #24: 'amp_14q32.33' versus Clinical Feature #7: 'HISTOLOGICAL_TYPE'
| nPatients | ASTROCYTOMA | GLIOBLASTOMA MULTIFORME (GBM) | OLIGOASTROCYTOMA | OLIGODENDROGLIOMA | TREATED PRIMARY GBM | UNTREATED PRIMARY (DE NOVO) GBM |
|---|---|---|---|---|---|---|
| ALL | 194 | 30 | 129 | 189 | 18 | 525 |
| AMP PEAK 24(14Q32.33) MUTATED | 2 | 2 | 3 | 3 | 2 | 32 |
| AMP PEAK 24(14Q32.33) WILD-TYPE | 192 | 28 | 126 | 186 | 16 | 493 |
Figure S136. Get High-res Image Gene #24: 'amp_14q32.33' versus Clinical Feature #7: 'HISTOLOGICAL_TYPE'
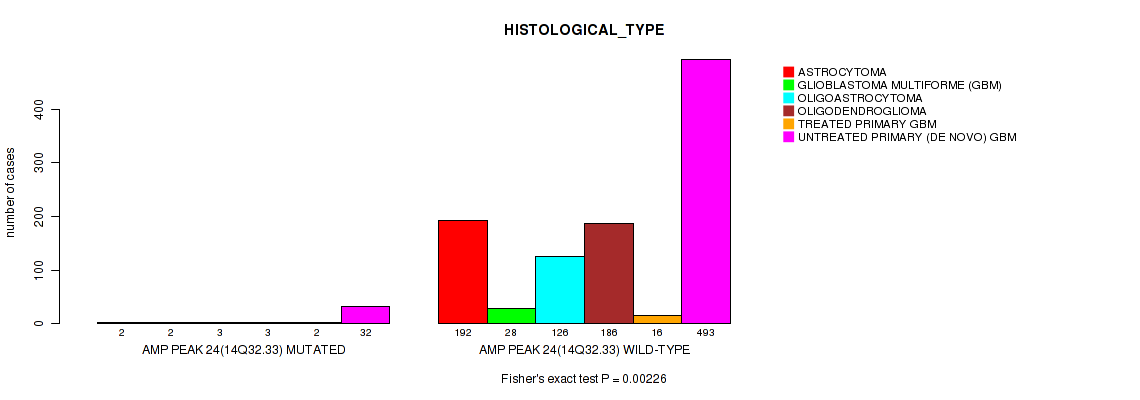
P value = 0.00293 (logrank test), Q value = 0.0082
Table S137. Gene #25: 'amp_17p13.2' versus Clinical Feature #1: 'Time to Death'
| nPatients | nDeath | Duration Range (Median), Month | |
|---|---|---|---|
| ALL | 1078 | 598 | 0.0 - 211.2 (16.0) |
| AMP PEAK 25(17P13.2) MUTATED | 74 | 54 | 0.2 - 72.4 (15.3) |
| AMP PEAK 25(17P13.2) WILD-TYPE | 1004 | 544 | 0.0 - 211.2 (16.0) |
Figure S137. Get High-res Image Gene #25: 'amp_17p13.2' versus Clinical Feature #1: 'Time to Death'
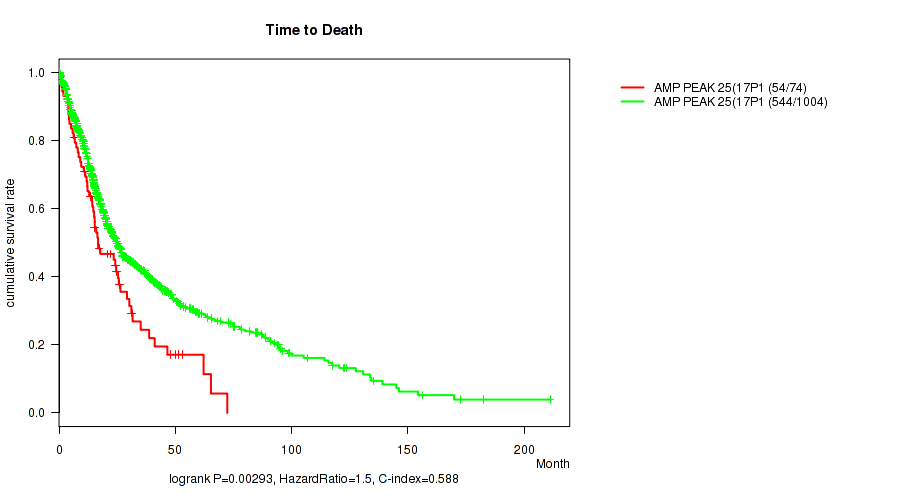
P value = 0.0115 (Wilcoxon-test), Q value = 0.027
Table S138. Gene #25: 'amp_17p13.2' versus Clinical Feature #2: 'YEARS_TO_BIRTH'
| nPatients | Mean (Std.Dev) | |
|---|---|---|
| ALL | 1084 | 50.8 (15.8) |
| AMP PEAK 25(17P13.2) MUTATED | 74 | 55.0 (16.1) |
| AMP PEAK 25(17P13.2) WILD-TYPE | 1010 | 50.5 (15.7) |
Figure S138. Get High-res Image Gene #25: 'amp_17p13.2' versus Clinical Feature #2: 'YEARS_TO_BIRTH'
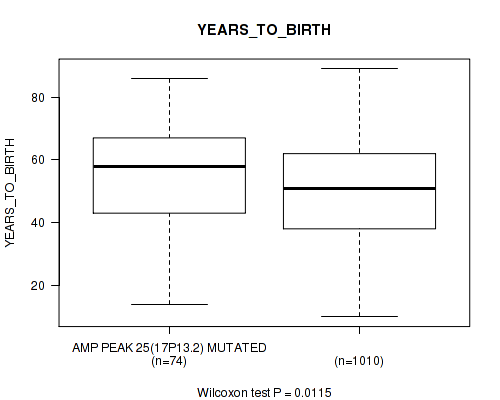
P value = 0.00522 (Fisher's exact test), Q value = 0.014
Table S139. Gene #25: 'amp_17p13.2' versus Clinical Feature #3: 'TUMOR_TISSUE_SITE'
| nPatients | BRAIN | CENTRAL NERVOUS SYSTEM |
|---|---|---|
| ALL | 573 | 512 |
| AMP PEAK 25(17P13.2) MUTATED | 51 | 23 |
| AMP PEAK 25(17P13.2) WILD-TYPE | 522 | 489 |
Figure S139. Get High-res Image Gene #25: 'amp_17p13.2' versus Clinical Feature #3: 'TUMOR_TISSUE_SITE'
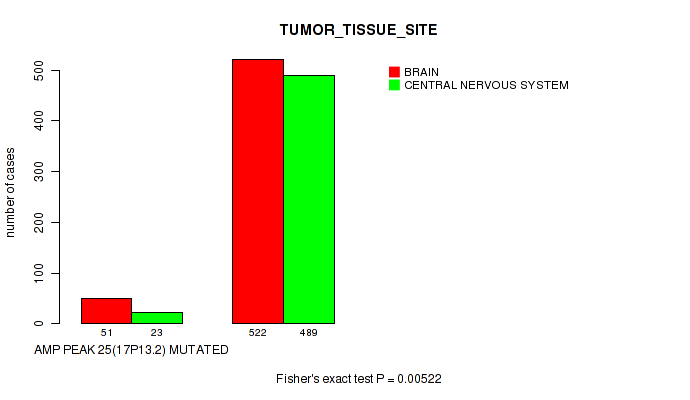
P value = 0.0664 (Fisher's exact test), Q value = 0.13
Table S140. Gene #25: 'amp_17p13.2' versus Clinical Feature #4: 'GENDER'
| nPatients | FEMALE | MALE |
|---|---|---|
| ALL | 453 | 632 |
| AMP PEAK 25(17P13.2) MUTATED | 23 | 51 |
| AMP PEAK 25(17P13.2) WILD-TYPE | 430 | 581 |
Figure S140. Get High-res Image Gene #25: 'amp_17p13.2' versus Clinical Feature #4: 'GENDER'
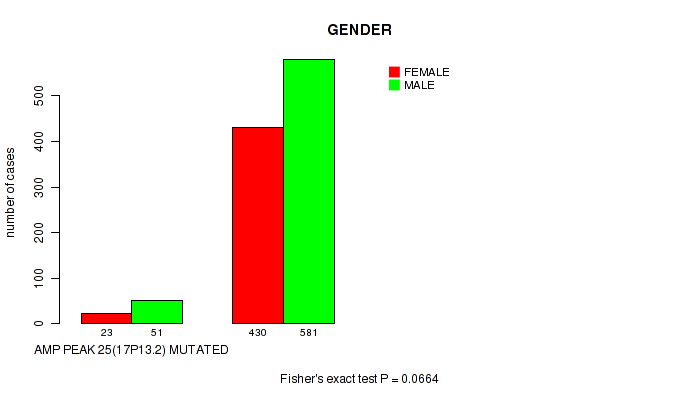
P value = 0.0051 (Fisher's exact test), Q value = 0.013
Table S141. Gene #25: 'amp_17p13.2' versus Clinical Feature #7: 'HISTOLOGICAL_TYPE'
| nPatients | ASTROCYTOMA | GLIOBLASTOMA MULTIFORME (GBM) | OLIGOASTROCYTOMA | OLIGODENDROGLIOMA | TREATED PRIMARY GBM | UNTREATED PRIMARY (DE NOVO) GBM |
|---|---|---|---|---|---|---|
| ALL | 194 | 30 | 129 | 189 | 18 | 525 |
| AMP PEAK 25(17P13.2) MUTATED | 10 | 4 | 1 | 12 | 1 | 46 |
| AMP PEAK 25(17P13.2) WILD-TYPE | 184 | 26 | 128 | 177 | 17 | 479 |
Figure S141. Get High-res Image Gene #25: 'amp_17p13.2' versus Clinical Feature #7: 'HISTOLOGICAL_TYPE'
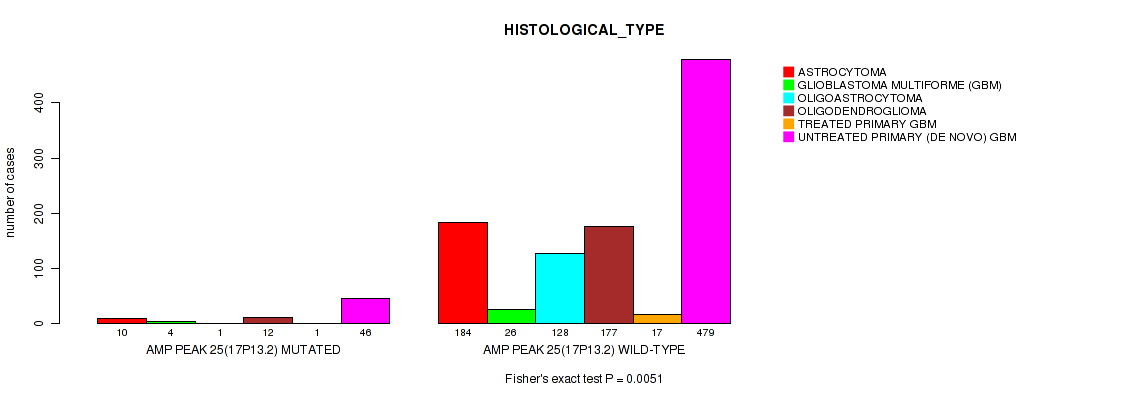
P value = 5.13e-06 (logrank test), Q value = 2.6e-05
Table S142. Gene #26: 'amp_17q25.1' versus Clinical Feature #1: 'Time to Death'
| nPatients | nDeath | Duration Range (Median), Month | |
|---|---|---|---|
| ALL | 1078 | 598 | 0.0 - 211.2 (16.0) |
| AMP PEAK 26(17Q25.1) MUTATED | 127 | 91 | 0.1 - 91.8 (14.0) |
| AMP PEAK 26(17Q25.1) WILD-TYPE | 951 | 507 | 0.0 - 211.2 (16.3) |
Figure S142. Get High-res Image Gene #26: 'amp_17q25.1' versus Clinical Feature #1: 'Time to Death'
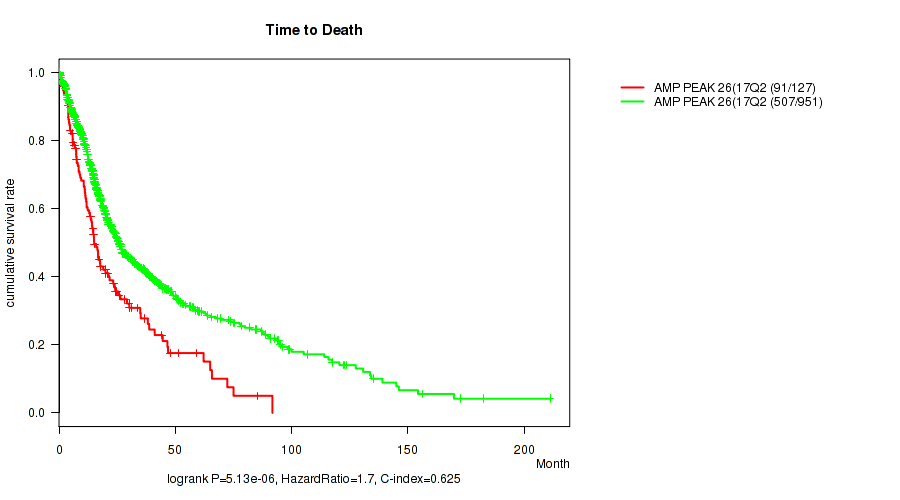
P value = 1.31e-05 (Wilcoxon-test), Q value = 4.9e-05
Table S143. Gene #26: 'amp_17q25.1' versus Clinical Feature #2: 'YEARS_TO_BIRTH'
| nPatients | Mean (Std.Dev) | |
|---|---|---|
| ALL | 1084 | 50.8 (15.8) |
| AMP PEAK 26(17Q25.1) MUTATED | 127 | 56.4 (14.9) |
| AMP PEAK 26(17Q25.1) WILD-TYPE | 957 | 50.1 (15.8) |
Figure S143. Get High-res Image Gene #26: 'amp_17q25.1' versus Clinical Feature #2: 'YEARS_TO_BIRTH'

P value = 0.00171 (Fisher's exact test), Q value = 0.0051
Table S144. Gene #26: 'amp_17q25.1' versus Clinical Feature #3: 'TUMOR_TISSUE_SITE'
| nPatients | BRAIN | CENTRAL NERVOUS SYSTEM |
|---|---|---|
| ALL | 573 | 512 |
| AMP PEAK 26(17Q25.1) MUTATED | 84 | 43 |
| AMP PEAK 26(17Q25.1) WILD-TYPE | 489 | 469 |
Figure S144. Get High-res Image Gene #26: 'amp_17q25.1' versus Clinical Feature #3: 'TUMOR_TISSUE_SITE'
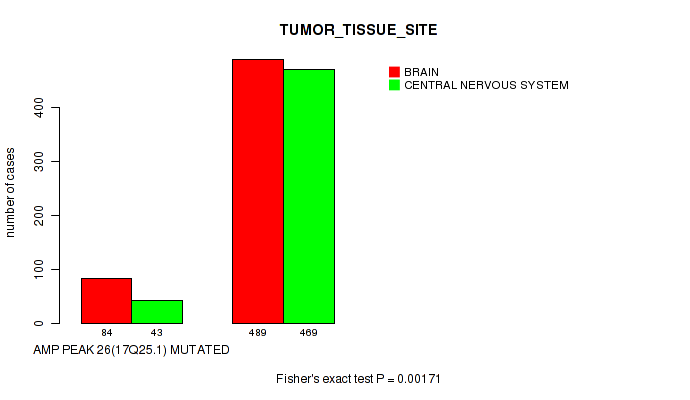
P value = 0.0858 (Fisher's exact test), Q value = 0.16
Table S145. Gene #26: 'amp_17q25.1' versus Clinical Feature #4: 'GENDER'
| nPatients | FEMALE | MALE |
|---|---|---|
| ALL | 453 | 632 |
| AMP PEAK 26(17Q25.1) MUTATED | 44 | 83 |
| AMP PEAK 26(17Q25.1) WILD-TYPE | 409 | 549 |
Figure S145. Get High-res Image Gene #26: 'amp_17q25.1' versus Clinical Feature #4: 'GENDER'
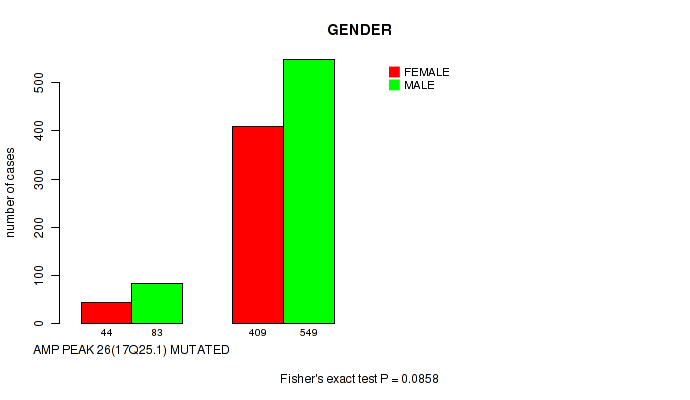
P value = 0.0154 (Fisher's exact test), Q value = 0.036
Table S146. Gene #26: 'amp_17q25.1' versus Clinical Feature #7: 'HISTOLOGICAL_TYPE'
| nPatients | ASTROCYTOMA | GLIOBLASTOMA MULTIFORME (GBM) | OLIGOASTROCYTOMA | OLIGODENDROGLIOMA | TREATED PRIMARY GBM | UNTREATED PRIMARY (DE NOVO) GBM |
|---|---|---|---|---|---|---|
| ALL | 194 | 30 | 129 | 189 | 18 | 525 |
| AMP PEAK 26(17Q25.1) MUTATED | 21 | 6 | 8 | 14 | 2 | 76 |
| AMP PEAK 26(17Q25.1) WILD-TYPE | 173 | 24 | 121 | 175 | 16 | 449 |
Figure S146. Get High-res Image Gene #26: 'amp_17q25.1' versus Clinical Feature #7: 'HISTOLOGICAL_TYPE'

P value = 0.0104 (logrank test), Q value = 0.025
Table S147. Gene #27: 'amp_19p13.3' versus Clinical Feature #1: 'Time to Death'
| nPatients | nDeath | Duration Range (Median), Month | |
|---|---|---|---|
| ALL | 1078 | 598 | 0.0 - 211.2 (16.0) |
| AMP PEAK 27(19P13.3) MUTATED | 369 | 231 | 0.0 - 172.8 (16.2) |
| AMP PEAK 27(19P13.3) WILD-TYPE | 709 | 367 | 0.1 - 211.2 (15.9) |
Figure S147. Get High-res Image Gene #27: 'amp_19p13.3' versus Clinical Feature #1: 'Time to Death'
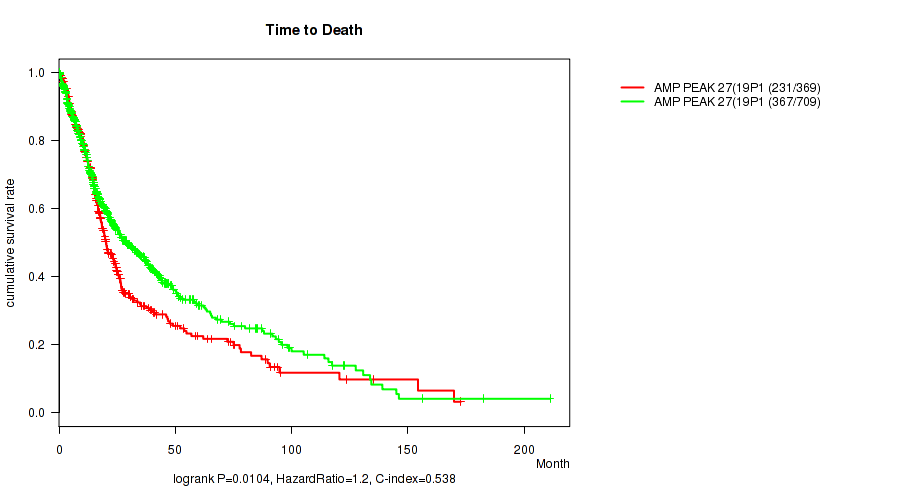
P value = 4.65e-05 (Wilcoxon-test), Q value = 0.00017
Table S148. Gene #27: 'amp_19p13.3' versus Clinical Feature #2: 'YEARS_TO_BIRTH'
| nPatients | Mean (Std.Dev) | |
|---|---|---|
| ALL | 1084 | 50.8 (15.8) |
| AMP PEAK 27(19P13.3) MUTATED | 372 | 53.5 (14.7) |
| AMP PEAK 27(19P13.3) WILD-TYPE | 712 | 49.4 (16.2) |
Figure S148. Get High-res Image Gene #27: 'amp_19p13.3' versus Clinical Feature #2: 'YEARS_TO_BIRTH'

P value = 1.6e-09 (Fisher's exact test), Q value = 1.1e-08
Table S149. Gene #27: 'amp_19p13.3' versus Clinical Feature #3: 'TUMOR_TISSUE_SITE'
| nPatients | BRAIN | CENTRAL NERVOUS SYSTEM |
|---|---|---|
| ALL | 573 | 512 |
| AMP PEAK 27(19P13.3) MUTATED | 244 | 129 |
| AMP PEAK 27(19P13.3) WILD-TYPE | 329 | 383 |
Figure S149. Get High-res Image Gene #27: 'amp_19p13.3' versus Clinical Feature #3: 'TUMOR_TISSUE_SITE'
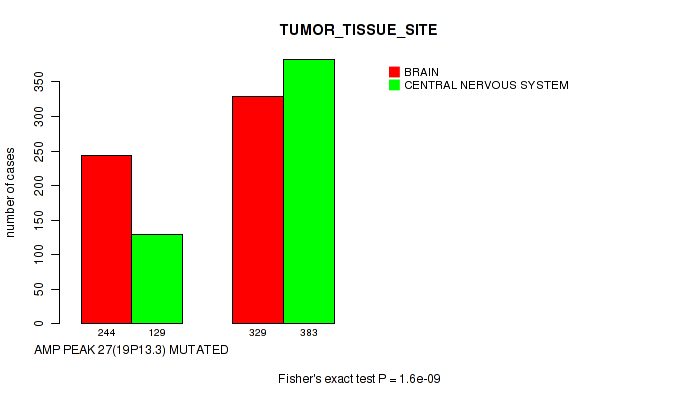
P value = 1e-05 (Fisher's exact test), Q value = 3.9e-05
Table S150. Gene #27: 'amp_19p13.3' versus Clinical Feature #7: 'HISTOLOGICAL_TYPE'
| nPatients | ASTROCYTOMA | GLIOBLASTOMA MULTIFORME (GBM) | OLIGOASTROCYTOMA | OLIGODENDROGLIOMA | TREATED PRIMARY GBM | UNTREATED PRIMARY (DE NOVO) GBM |
|---|---|---|---|---|---|---|
| ALL | 194 | 30 | 129 | 189 | 18 | 525 |
| AMP PEAK 27(19P13.3) MUTATED | 26 | 13 | 29 | 74 | 10 | 221 |
| AMP PEAK 27(19P13.3) WILD-TYPE | 168 | 17 | 100 | 115 | 8 | 304 |
Figure S150. Get High-res Image Gene #27: 'amp_19p13.3' versus Clinical Feature #7: 'HISTOLOGICAL_TYPE'
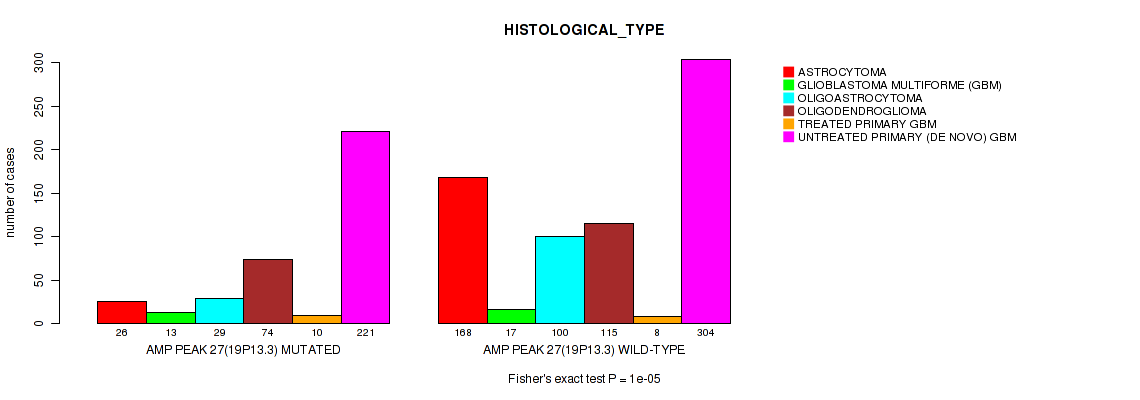
P value = 0 (logrank test), Q value = 0
Table S151. Gene #28: 'amp_19q12' versus Clinical Feature #1: 'Time to Death'
| nPatients | nDeath | Duration Range (Median), Month | |
|---|---|---|---|
| ALL | 1078 | 598 | 0.0 - 211.2 (16.0) |
| AMP PEAK 28(19Q12) MUTATED | 244 | 192 | 0.0 - 92.7 (14.5) |
| AMP PEAK 28(19Q12) WILD-TYPE | 834 | 406 | 0.1 - 211.2 (16.8) |
Figure S151. Get High-res Image Gene #28: 'amp_19q12' versus Clinical Feature #1: 'Time to Death'
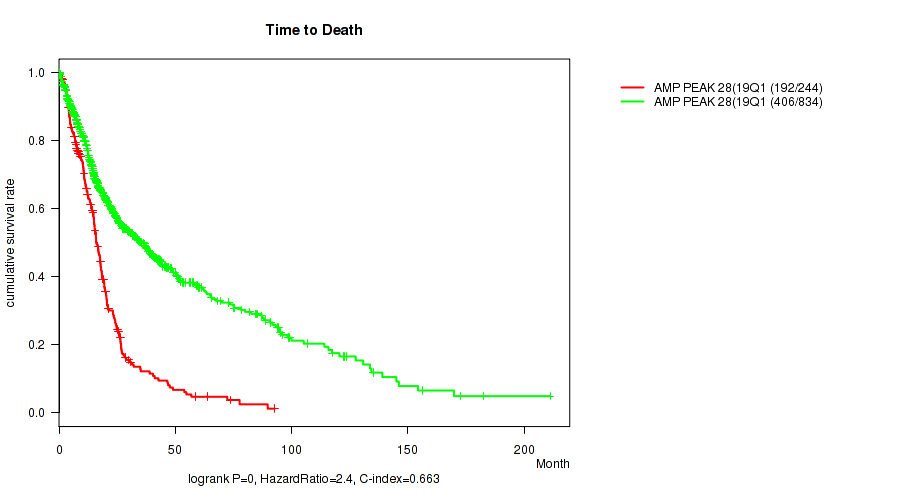
P value = 3.68e-16 (Wilcoxon-test), Q value = 4.8e-15
Table S152. Gene #28: 'amp_19q12' versus Clinical Feature #2: 'YEARS_TO_BIRTH'
| nPatients | Mean (Std.Dev) | |
|---|---|---|
| ALL | 1084 | 50.8 (15.8) |
| AMP PEAK 28(19Q12) MUTATED | 246 | 58.0 (12.9) |
| AMP PEAK 28(19Q12) WILD-TYPE | 838 | 48.7 (16.0) |
Figure S152. Get High-res Image Gene #28: 'amp_19q12' versus Clinical Feature #2: 'YEARS_TO_BIRTH'

P value = 1.93e-38 (Fisher's exact test), Q value = 3.6e-37
Table S153. Gene #28: 'amp_19q12' versus Clinical Feature #3: 'TUMOR_TISSUE_SITE'
| nPatients | BRAIN | CENTRAL NERVOUS SYSTEM |
|---|---|---|
| ALL | 573 | 512 |
| AMP PEAK 28(19Q12) MUTATED | 215 | 31 |
| AMP PEAK 28(19Q12) WILD-TYPE | 358 | 481 |
Figure S153. Get High-res Image Gene #28: 'amp_19q12' versus Clinical Feature #3: 'TUMOR_TISSUE_SITE'
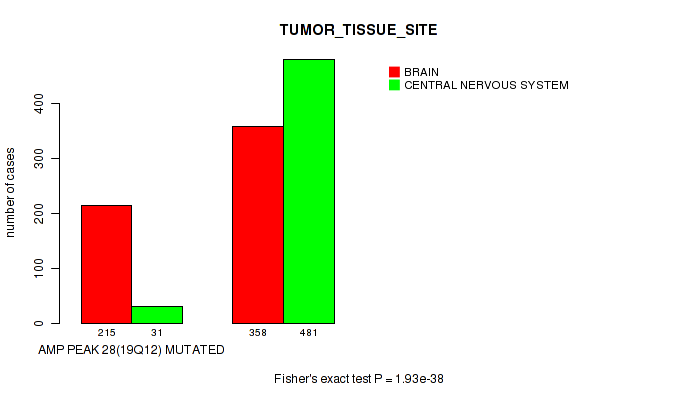
P value = 1.04e-07 (Fisher's exact test), Q value = 6.2e-07
Table S154. Gene #28: 'amp_19q12' versus Clinical Feature #5: 'RADIATION_THERAPY'
| nPatients | NO | YES |
|---|---|---|
| ALL | 258 | 770 |
| AMP PEAK 28(19Q12) MUTATED | 28 | 202 |
| AMP PEAK 28(19Q12) WILD-TYPE | 230 | 568 |
Figure S154. Get High-res Image Gene #28: 'amp_19q12' versus Clinical Feature #5: 'RADIATION_THERAPY'
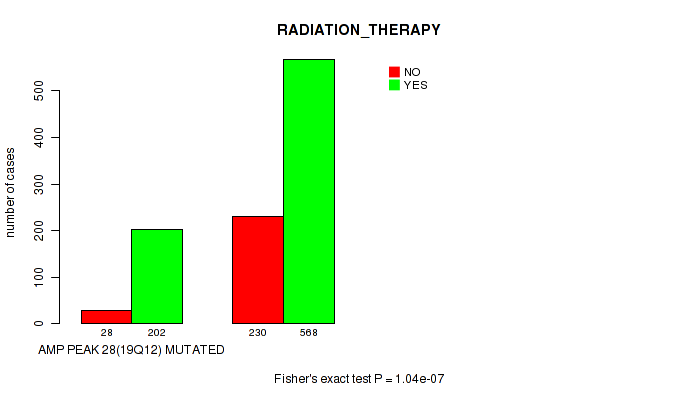
P value = 7.05e-05 (Wilcoxon-test), Q value = 0.00025
Table S155. Gene #28: 'amp_19q12' versus Clinical Feature #6: 'KARNOFSKY_PERFORMANCE_SCORE'
| nPatients | Mean (Std.Dev) | |
|---|---|---|
| ALL | 732 | 81.1 (15.3) |
| AMP PEAK 28(19Q12) MUTATED | 167 | 77.4 (15.8) |
| AMP PEAK 28(19Q12) WILD-TYPE | 565 | 82.2 (15.0) |
Figure S155. Get High-res Image Gene #28: 'amp_19q12' versus Clinical Feature #6: 'KARNOFSKY_PERFORMANCE_SCORE'
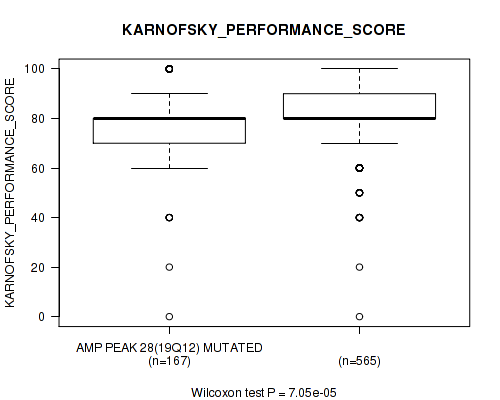
P value = 1e-05 (Fisher's exact test), Q value = 3.9e-05
Table S156. Gene #28: 'amp_19q12' versus Clinical Feature #7: 'HISTOLOGICAL_TYPE'
| nPatients | ASTROCYTOMA | GLIOBLASTOMA MULTIFORME (GBM) | OLIGOASTROCYTOMA | OLIGODENDROGLIOMA | TREATED PRIMARY GBM | UNTREATED PRIMARY (DE NOVO) GBM |
|---|---|---|---|---|---|---|
| ALL | 194 | 30 | 129 | 189 | 18 | 525 |
| AMP PEAK 28(19Q12) MUTATED | 16 | 14 | 9 | 6 | 8 | 193 |
| AMP PEAK 28(19Q12) WILD-TYPE | 178 | 16 | 120 | 183 | 10 | 332 |
Figure S156. Get High-res Image Gene #28: 'amp_19q12' versus Clinical Feature #7: 'HISTOLOGICAL_TYPE'
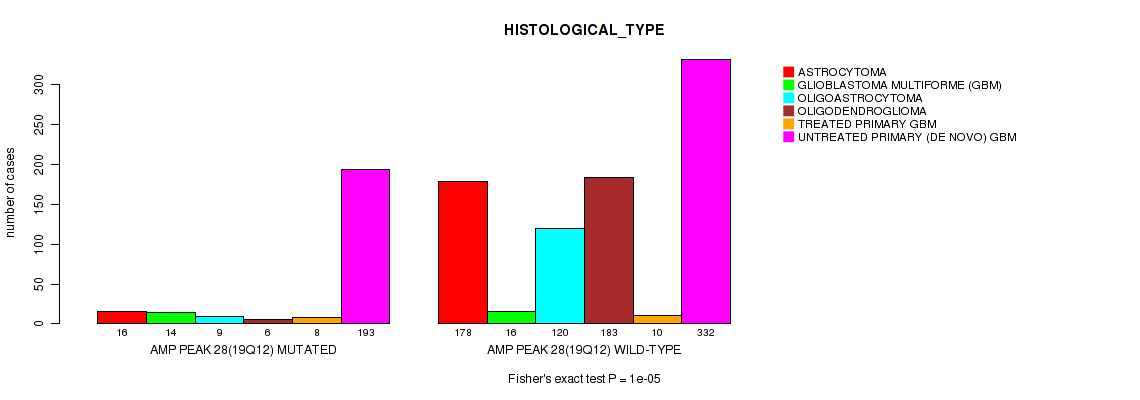
P value = 0.0404 (Fisher's exact test), Q value = 0.082
Table S157. Gene #28: 'amp_19q12' versus Clinical Feature #8: 'RACE'
| nPatients | AMERICAN INDIAN OR ALASKA NATIVE | ASIAN | BLACK OR AFRICAN AMERICAN | WHITE |
|---|---|---|---|---|
| ALL | 1 | 21 | 71 | 959 |
| AMP PEAK 28(19Q12) MUTATED | 0 | 8 | 23 | 207 |
| AMP PEAK 28(19Q12) WILD-TYPE | 1 | 13 | 48 | 752 |
Figure S157. Get High-res Image Gene #28: 'amp_19q12' versus Clinical Feature #8: 'RACE'

P value = 0 (logrank test), Q value = 0
Table S158. Gene #29: 'amp_19q13.2' versus Clinical Feature #1: 'Time to Death'
| nPatients | nDeath | Duration Range (Median), Month | |
|---|---|---|---|
| ALL | 1078 | 598 | 0.0 - 211.2 (16.0) |
| AMP PEAK 29(19Q13.2) MUTATED | 228 | 176 | 0.1 - 92.7 (14.5) |
| AMP PEAK 29(19Q13.2) WILD-TYPE | 850 | 422 | 0.0 - 211.2 (16.6) |
Figure S158. Get High-res Image Gene #29: 'amp_19q13.2' versus Clinical Feature #1: 'Time to Death'
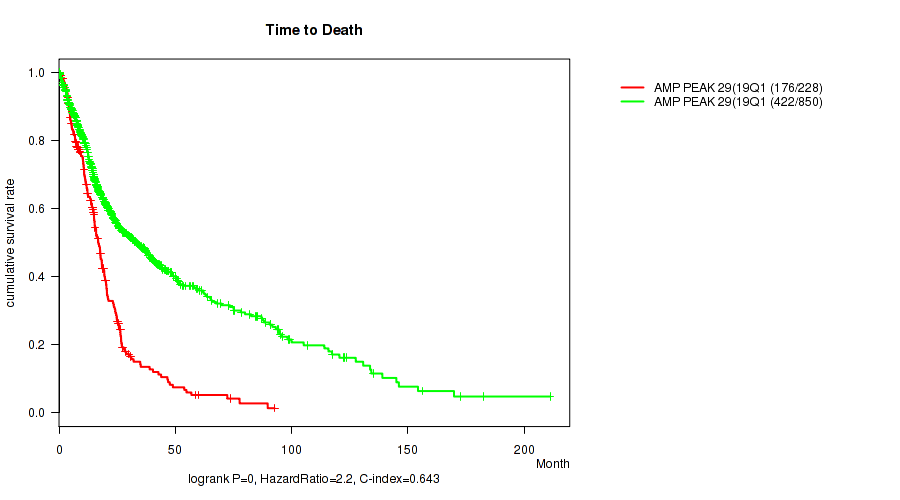
P value = 2.86e-15 (Wilcoxon-test), Q value = 3.4e-14
Table S159. Gene #29: 'amp_19q13.2' versus Clinical Feature #2: 'YEARS_TO_BIRTH'
| nPatients | Mean (Std.Dev) | |
|---|---|---|
| ALL | 1084 | 50.8 (15.8) |
| AMP PEAK 29(19Q13.2) MUTATED | 230 | 58.0 (12.4) |
| AMP PEAK 29(19Q13.2) WILD-TYPE | 854 | 48.9 (16.1) |
Figure S159. Get High-res Image Gene #29: 'amp_19q13.2' versus Clinical Feature #2: 'YEARS_TO_BIRTH'
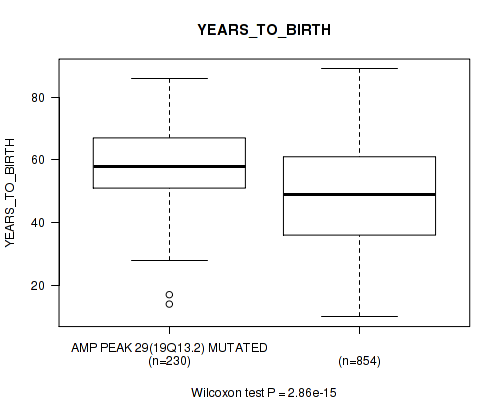
P value = 2.11e-33 (Fisher's exact test), Q value = 3.7e-32
Table S160. Gene #29: 'amp_19q13.2' versus Clinical Feature #3: 'TUMOR_TISSUE_SITE'
| nPatients | BRAIN | CENTRAL NERVOUS SYSTEM |
|---|---|---|
| ALL | 573 | 512 |
| AMP PEAK 29(19Q13.2) MUTATED | 199 | 31 |
| AMP PEAK 29(19Q13.2) WILD-TYPE | 374 | 481 |
Figure S160. Get High-res Image Gene #29: 'amp_19q13.2' versus Clinical Feature #3: 'TUMOR_TISSUE_SITE'
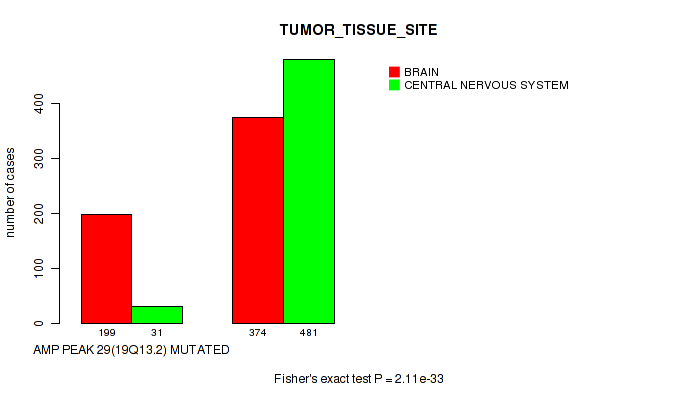
P value = 6.05e-07 (Fisher's exact test), Q value = 3.3e-06
Table S161. Gene #29: 'amp_19q13.2' versus Clinical Feature #5: 'RADIATION_THERAPY'
| nPatients | NO | YES |
|---|---|---|
| ALL | 258 | 770 |
| AMP PEAK 29(19Q13.2) MUTATED | 27 | 189 |
| AMP PEAK 29(19Q13.2) WILD-TYPE | 231 | 581 |
Figure S161. Get High-res Image Gene #29: 'amp_19q13.2' versus Clinical Feature #5: 'RADIATION_THERAPY'

P value = 0.000511 (Wilcoxon-test), Q value = 0.0016
Table S162. Gene #29: 'amp_19q13.2' versus Clinical Feature #6: 'KARNOFSKY_PERFORMANCE_SCORE'
| nPatients | Mean (Std.Dev) | |
|---|---|---|
| ALL | 732 | 81.1 (15.3) |
| AMP PEAK 29(19Q13.2) MUTATED | 160 | 78.2 (14.7) |
| AMP PEAK 29(19Q13.2) WILD-TYPE | 572 | 81.9 (15.4) |
Figure S162. Get High-res Image Gene #29: 'amp_19q13.2' versus Clinical Feature #6: 'KARNOFSKY_PERFORMANCE_SCORE'
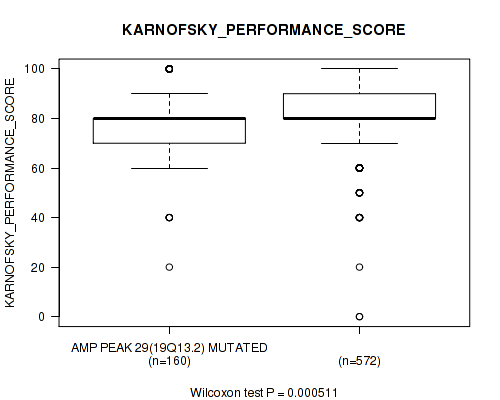
P value = 1e-05 (Fisher's exact test), Q value = 3.9e-05
Table S163. Gene #29: 'amp_19q13.2' versus Clinical Feature #7: 'HISTOLOGICAL_TYPE'
| nPatients | ASTROCYTOMA | GLIOBLASTOMA MULTIFORME (GBM) | OLIGOASTROCYTOMA | OLIGODENDROGLIOMA | TREATED PRIMARY GBM | UNTREATED PRIMARY (DE NOVO) GBM |
|---|---|---|---|---|---|---|
| ALL | 194 | 30 | 129 | 189 | 18 | 525 |
| AMP PEAK 29(19Q13.2) MUTATED | 18 | 12 | 7 | 6 | 6 | 181 |
| AMP PEAK 29(19Q13.2) WILD-TYPE | 176 | 18 | 122 | 183 | 12 | 344 |
Figure S163. Get High-res Image Gene #29: 'amp_19q13.2' versus Clinical Feature #7: 'HISTOLOGICAL_TYPE'
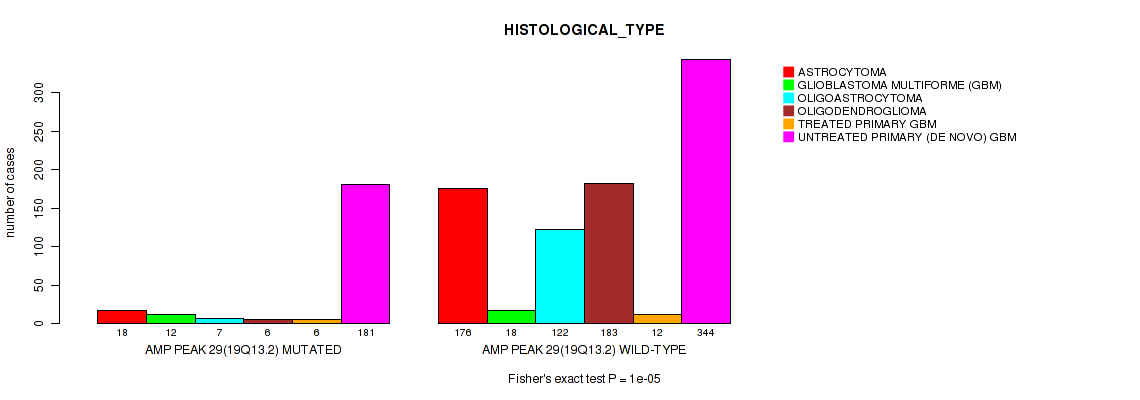
P value = 0.0336 (Fisher's exact test), Q value = 0.07
Table S164. Gene #29: 'amp_19q13.2' versus Clinical Feature #8: 'RACE'
| nPatients | AMERICAN INDIAN OR ALASKA NATIVE | ASIAN | BLACK OR AFRICAN AMERICAN | WHITE |
|---|---|---|---|---|
| ALL | 1 | 21 | 71 | 959 |
| AMP PEAK 29(19Q13.2) MUTATED | 0 | 7 | 23 | 193 |
| AMP PEAK 29(19Q13.2) WILD-TYPE | 1 | 14 | 48 | 766 |
Figure S164. Get High-res Image Gene #29: 'amp_19q13.2' versus Clinical Feature #8: 'RACE'

P value = 9.97e-05 (logrank test), Q value = 0.00034
Table S165. Gene #30: 'amp_xp11.21' versus Clinical Feature #1: 'Time to Death'
| nPatients | nDeath | Duration Range (Median), Month | |
|---|---|---|---|
| ALL | 1078 | 598 | 0.0 - 211.2 (16.0) |
| AMP PEAK 30(XP11.21) MUTATED | 104 | 41 | 0.1 - 145.1 (20.2) |
| AMP PEAK 30(XP11.21) WILD-TYPE | 974 | 557 | 0.0 - 211.2 (15.7) |
Figure S165. Get High-res Image Gene #30: 'amp_xp11.21' versus Clinical Feature #1: 'Time to Death'
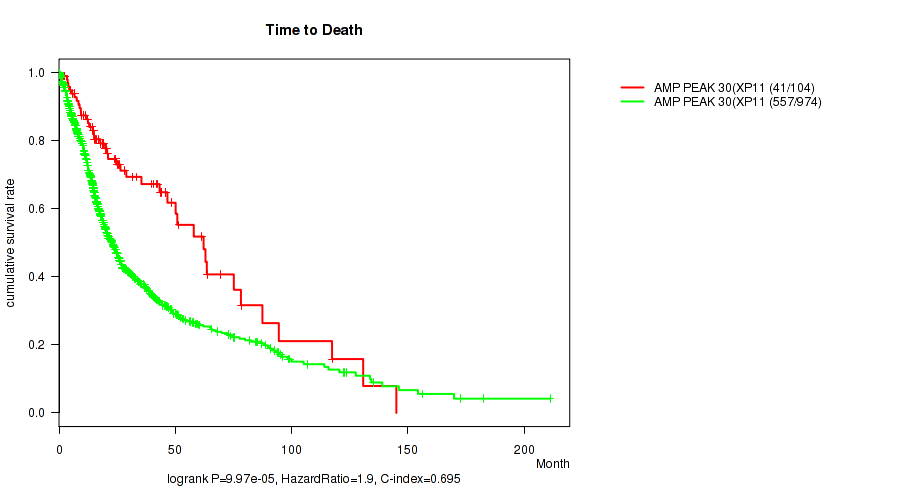
P value = 2.91e-06 (Wilcoxon-test), Q value = 1.5e-05
Table S166. Gene #30: 'amp_xp11.21' versus Clinical Feature #2: 'YEARS_TO_BIRTH'
| nPatients | Mean (Std.Dev) | |
|---|---|---|
| ALL | 1084 | 50.8 (15.8) |
| AMP PEAK 30(XP11.21) MUTATED | 104 | 43.9 (15.7) |
| AMP PEAK 30(XP11.21) WILD-TYPE | 980 | 51.5 (15.6) |
Figure S166. Get High-res Image Gene #30: 'amp_xp11.21' versus Clinical Feature #2: 'YEARS_TO_BIRTH'
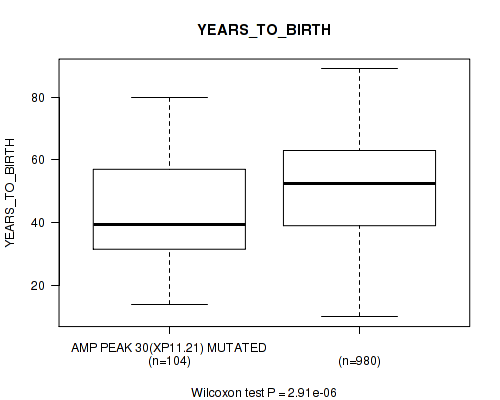
P value = 1.86e-05 (Fisher's exact test), Q value = 6.9e-05
Table S167. Gene #30: 'amp_xp11.21' versus Clinical Feature #3: 'TUMOR_TISSUE_SITE'
| nPatients | BRAIN | CENTRAL NERVOUS SYSTEM |
|---|---|---|
| ALL | 573 | 512 |
| AMP PEAK 30(XP11.21) MUTATED | 34 | 70 |
| AMP PEAK 30(XP11.21) WILD-TYPE | 539 | 442 |
Figure S167. Get High-res Image Gene #30: 'amp_xp11.21' versus Clinical Feature #3: 'TUMOR_TISSUE_SITE'
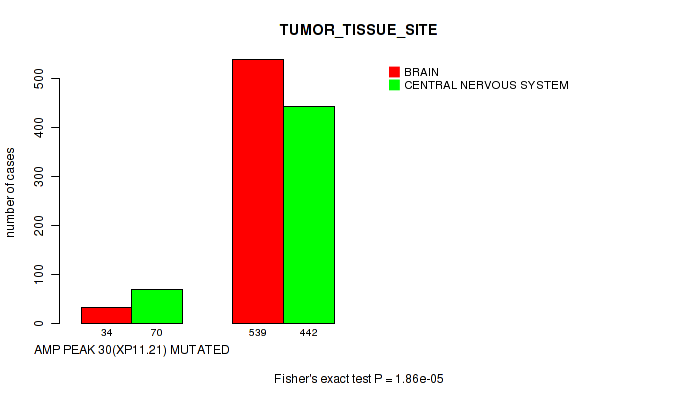
P value = 0.0284 (Fisher's exact test), Q value = 0.06
Table S168. Gene #30: 'amp_xp11.21' versus Clinical Feature #4: 'GENDER'
| nPatients | FEMALE | MALE |
|---|---|---|
| ALL | 453 | 632 |
| AMP PEAK 30(XP11.21) MUTATED | 54 | 50 |
| AMP PEAK 30(XP11.21) WILD-TYPE | 399 | 582 |
Figure S168. Get High-res Image Gene #30: 'amp_xp11.21' versus Clinical Feature #4: 'GENDER'
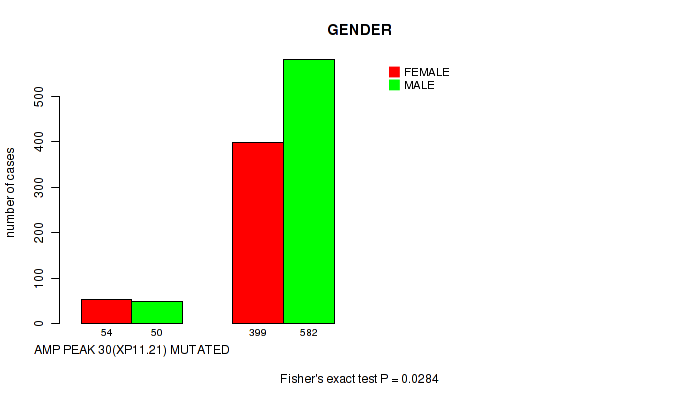
P value = 0.00966 (Fisher's exact test), Q value = 0.024
Table S169. Gene #30: 'amp_xp11.21' versus Clinical Feature #5: 'RADIATION_THERAPY'
| nPatients | NO | YES |
|---|---|---|
| ALL | 258 | 770 |
| AMP PEAK 30(XP11.21) MUTATED | 14 | 83 |
| AMP PEAK 30(XP11.21) WILD-TYPE | 244 | 687 |
Figure S169. Get High-res Image Gene #30: 'amp_xp11.21' versus Clinical Feature #5: 'RADIATION_THERAPY'

P value = 0.0239 (Wilcoxon-test), Q value = 0.053
Table S170. Gene #30: 'amp_xp11.21' versus Clinical Feature #6: 'KARNOFSKY_PERFORMANCE_SCORE'
| nPatients | Mean (Std.Dev) | |
|---|---|---|
| ALL | 732 | 81.1 (15.3) |
| AMP PEAK 30(XP11.21) MUTATED | 67 | 84.3 (15.1) |
| AMP PEAK 30(XP11.21) WILD-TYPE | 665 | 80.8 (15.3) |
Figure S170. Get High-res Image Gene #30: 'amp_xp11.21' versus Clinical Feature #6: 'KARNOFSKY_PERFORMANCE_SCORE'
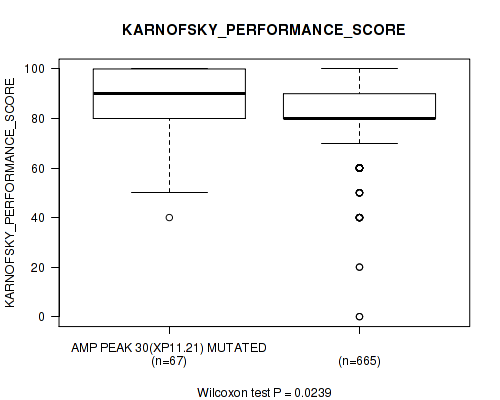
P value = 1e-05 (Fisher's exact test), Q value = 3.9e-05
Table S171. Gene #30: 'amp_xp11.21' versus Clinical Feature #7: 'HISTOLOGICAL_TYPE'
| nPatients | ASTROCYTOMA | GLIOBLASTOMA MULTIFORME (GBM) | OLIGOASTROCYTOMA | OLIGODENDROGLIOMA | TREATED PRIMARY GBM | UNTREATED PRIMARY (DE NOVO) GBM |
|---|---|---|---|---|---|---|
| ALL | 194 | 30 | 129 | 189 | 18 | 525 |
| AMP PEAK 30(XP11.21) MUTATED | 44 | 3 | 17 | 9 | 2 | 29 |
| AMP PEAK 30(XP11.21) WILD-TYPE | 150 | 27 | 112 | 180 | 16 | 496 |
Figure S171. Get High-res Image Gene #30: 'amp_xp11.21' versus Clinical Feature #7: 'HISTOLOGICAL_TYPE'
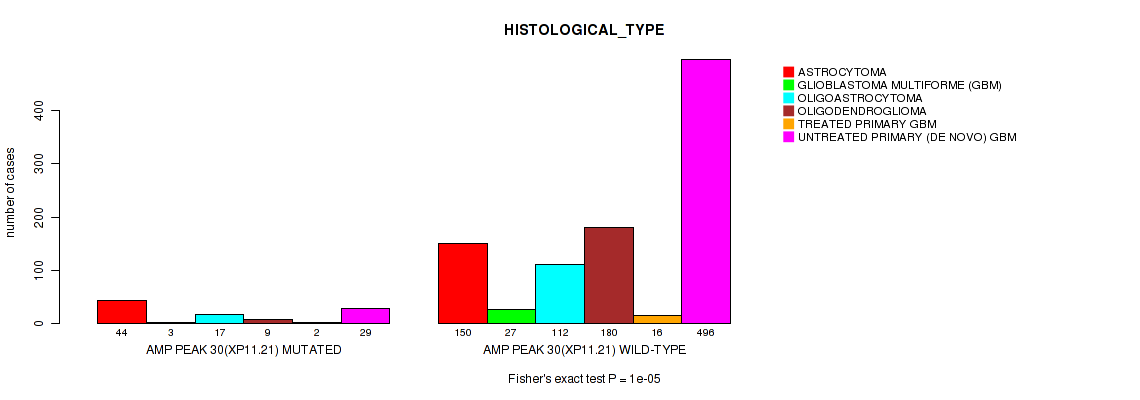
P value = 0.0303 (Fisher's exact test), Q value = 0.064
Table S172. Gene #30: 'amp_xp11.21' versus Clinical Feature #9: 'ETHNICITY'
| nPatients | HISPANIC OR LATINO | NOT HISPANIC OR LATINO |
|---|---|---|
| ALL | 44 | 921 |
| AMP PEAK 30(XP11.21) MUTATED | 9 | 84 |
| AMP PEAK 30(XP11.21) WILD-TYPE | 35 | 837 |
Figure S172. Get High-res Image Gene #30: 'amp_xp11.21' versus Clinical Feature #9: 'ETHNICITY'
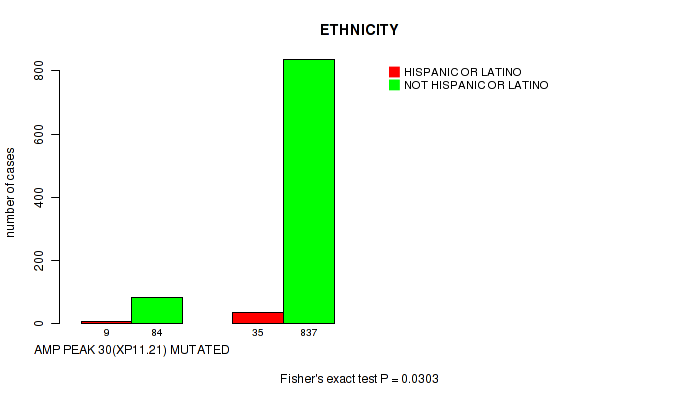
P value = 7.08e-09 (logrank test), Q value = 4.4e-08
Table S173. Gene #31: 'del_1p36.32' versus Clinical Feature #1: 'Time to Death'
| nPatients | nDeath | Duration Range (Median), Month | |
|---|---|---|---|
| ALL | 1078 | 598 | 0.0 - 211.2 (16.0) |
| DEL PEAK 1(1P36.32) MUTATED | 311 | 130 | 0.1 - 182.3 (18.0) |
| DEL PEAK 1(1P36.32) WILD-TYPE | 767 | 468 | 0.0 - 211.2 (15.0) |
Figure S173. Get High-res Image Gene #31: 'del_1p36.32' versus Clinical Feature #1: 'Time to Death'
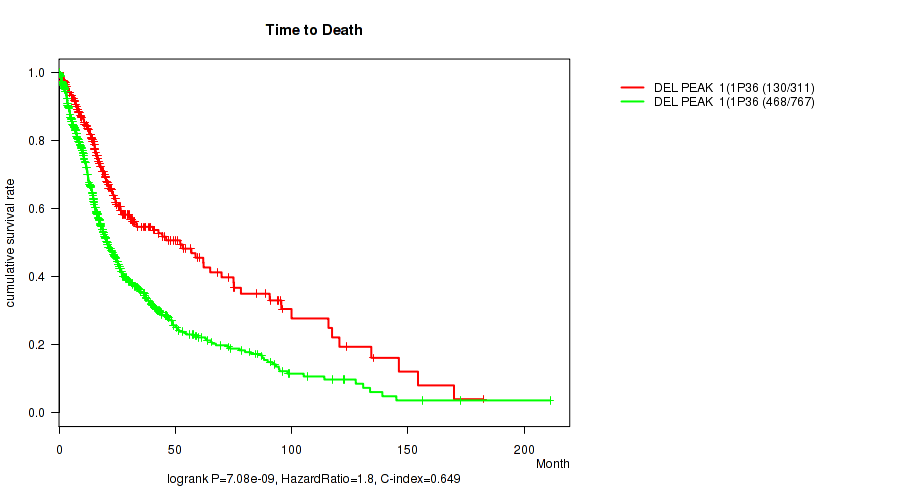
P value = 1.44e-14 (Fisher's exact test), Q value = 1.6e-13
Table S174. Gene #31: 'del_1p36.32' versus Clinical Feature #3: 'TUMOR_TISSUE_SITE'
| nPatients | BRAIN | CENTRAL NERVOUS SYSTEM |
|---|---|---|
| ALL | 573 | 512 |
| DEL PEAK 1(1P36.32) MUTATED | 109 | 206 |
| DEL PEAK 1(1P36.32) WILD-TYPE | 464 | 306 |
Figure S174. Get High-res Image Gene #31: 'del_1p36.32' versus Clinical Feature #3: 'TUMOR_TISSUE_SITE'
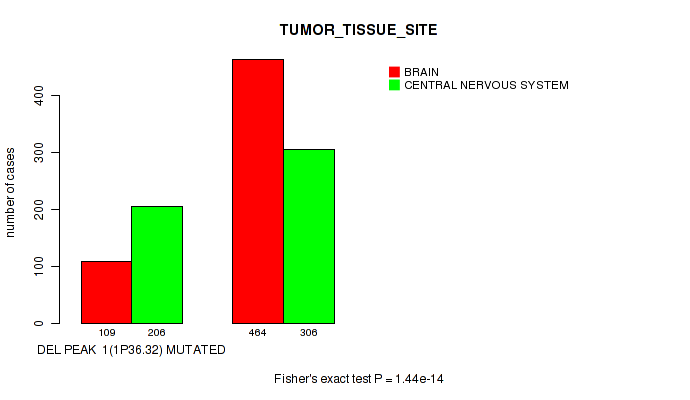
P value = 6.2e-08 (Fisher's exact test), Q value = 3.7e-07
Table S175. Gene #31: 'del_1p36.32' versus Clinical Feature #5: 'RADIATION_THERAPY'
| nPatients | NO | YES |
|---|---|---|
| ALL | 258 | 770 |
| DEL PEAK 1(1P36.32) MUTATED | 110 | 189 |
| DEL PEAK 1(1P36.32) WILD-TYPE | 148 | 581 |
Figure S175. Get High-res Image Gene #31: 'del_1p36.32' versus Clinical Feature #5: 'RADIATION_THERAPY'
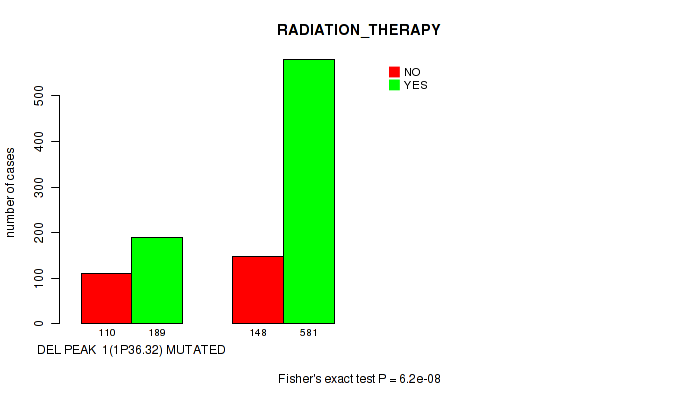
P value = 0.0272 (Wilcoxon-test), Q value = 0.058
Table S176. Gene #31: 'del_1p36.32' versus Clinical Feature #6: 'KARNOFSKY_PERFORMANCE_SCORE'
| nPatients | Mean (Std.Dev) | |
|---|---|---|
| ALL | 732 | 81.1 (15.3) |
| DEL PEAK 1(1P36.32) MUTATED | 216 | 82.3 (16.8) |
| DEL PEAK 1(1P36.32) WILD-TYPE | 516 | 80.6 (14.6) |
Figure S176. Get High-res Image Gene #31: 'del_1p36.32' versus Clinical Feature #6: 'KARNOFSKY_PERFORMANCE_SCORE'
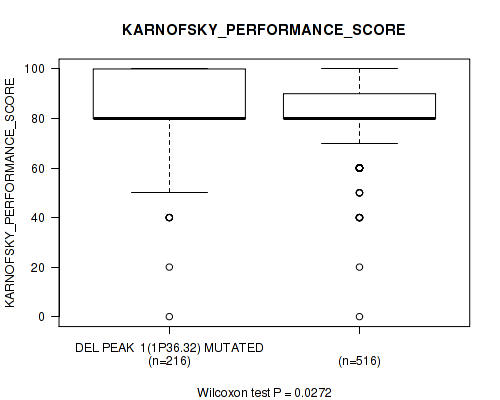
P value = 1e-05 (Fisher's exact test), Q value = 3.9e-05
Table S177. Gene #31: 'del_1p36.32' versus Clinical Feature #7: 'HISTOLOGICAL_TYPE'
| nPatients | ASTROCYTOMA | GLIOBLASTOMA MULTIFORME (GBM) | OLIGOASTROCYTOMA | OLIGODENDROGLIOMA | TREATED PRIMARY GBM | UNTREATED PRIMARY (DE NOVO) GBM |
|---|---|---|---|---|---|---|
| ALL | 194 | 30 | 129 | 189 | 18 | 525 |
| DEL PEAK 1(1P36.32) MUTATED | 22 | 2 | 46 | 138 | 4 | 103 |
| DEL PEAK 1(1P36.32) WILD-TYPE | 172 | 28 | 83 | 51 | 14 | 422 |
Figure S177. Get High-res Image Gene #31: 'del_1p36.32' versus Clinical Feature #7: 'HISTOLOGICAL_TYPE'
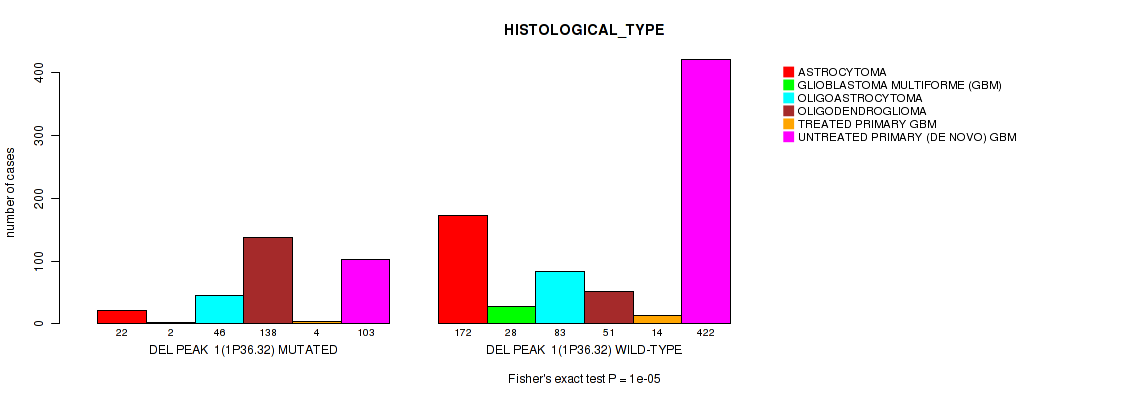
P value = 0.0217 (Fisher's exact test), Q value = 0.048
Table S178. Gene #31: 'del_1p36.32' versus Clinical Feature #8: 'RACE'
| nPatients | AMERICAN INDIAN OR ALASKA NATIVE | ASIAN | BLACK OR AFRICAN AMERICAN | WHITE |
|---|---|---|---|---|
| ALL | 1 | 21 | 71 | 959 |
| DEL PEAK 1(1P36.32) MUTATED | 1 | 10 | 14 | 282 |
| DEL PEAK 1(1P36.32) WILD-TYPE | 0 | 11 | 57 | 677 |
Figure S178. Get High-res Image Gene #31: 'del_1p36.32' versus Clinical Feature #8: 'RACE'
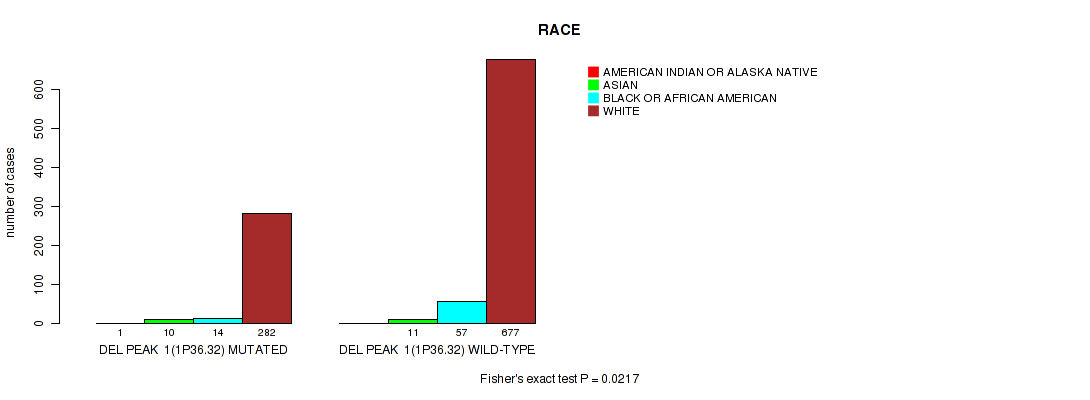
P value = 1.29e-05 (logrank test), Q value = 4.9e-05
Table S179. Gene #32: 'del_1p36.23' versus Clinical Feature #1: 'Time to Death'
| nPatients | nDeath | Duration Range (Median), Month | |
|---|---|---|---|
| ALL | 1078 | 598 | 0.0 - 211.2 (16.0) |
| DEL PEAK 2(1P36.23) MUTATED | 340 | 156 | 0.1 - 182.3 (17.1) |
| DEL PEAK 2(1P36.23) WILD-TYPE | 738 | 442 | 0.0 - 211.2 (15.2) |
Figure S179. Get High-res Image Gene #32: 'del_1p36.23' versus Clinical Feature #1: 'Time to Death'
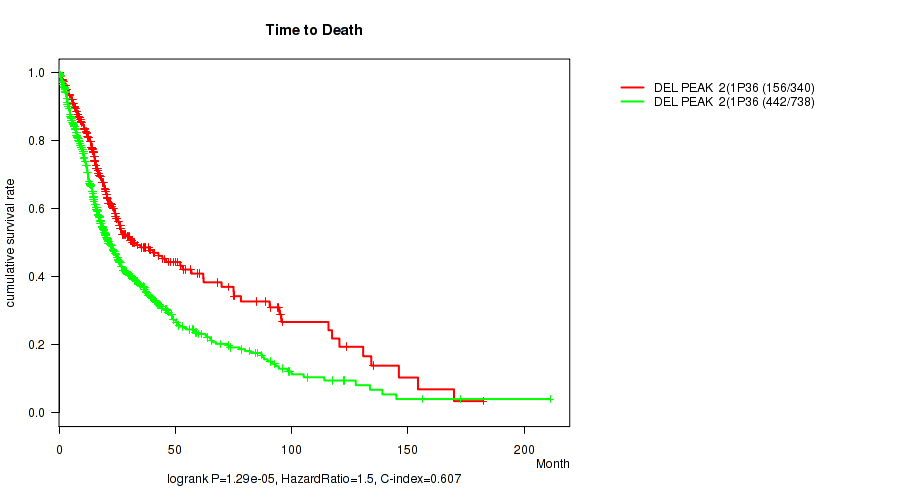
P value = 8.52e-11 (Fisher's exact test), Q value = 6.8e-10
Table S180. Gene #32: 'del_1p36.23' versus Clinical Feature #3: 'TUMOR_TISSUE_SITE'
| nPatients | BRAIN | CENTRAL NERVOUS SYSTEM |
|---|---|---|
| ALL | 573 | 512 |
| DEL PEAK 2(1P36.23) MUTATED | 132 | 212 |
| DEL PEAK 2(1P36.23) WILD-TYPE | 441 | 300 |
Figure S180. Get High-res Image Gene #32: 'del_1p36.23' versus Clinical Feature #3: 'TUMOR_TISSUE_SITE'
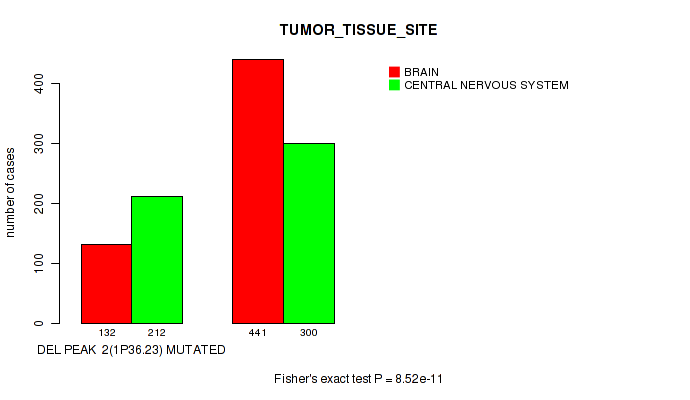
P value = 2.97e-07 (Fisher's exact test), Q value = 1.7e-06
Table S181. Gene #32: 'del_1p36.23' versus Clinical Feature #5: 'RADIATION_THERAPY'
| nPatients | NO | YES |
|---|---|---|
| ALL | 258 | 770 |
| DEL PEAK 2(1P36.23) MUTATED | 116 | 211 |
| DEL PEAK 2(1P36.23) WILD-TYPE | 142 | 559 |
Figure S181. Get High-res Image Gene #32: 'del_1p36.23' versus Clinical Feature #5: 'RADIATION_THERAPY'
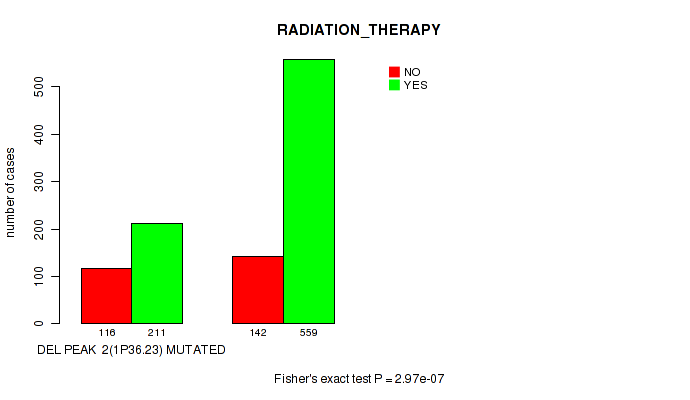
P value = 0.00252 (Wilcoxon-test), Q value = 0.0072
Table S182. Gene #32: 'del_1p36.23' versus Clinical Feature #6: 'KARNOFSKY_PERFORMANCE_SCORE'
| nPatients | Mean (Std.Dev) | |
|---|---|---|
| ALL | 732 | 81.1 (15.3) |
| DEL PEAK 2(1P36.23) MUTATED | 234 | 82.8 (16.9) |
| DEL PEAK 2(1P36.23) WILD-TYPE | 498 | 80.3 (14.4) |
Figure S182. Get High-res Image Gene #32: 'del_1p36.23' versus Clinical Feature #6: 'KARNOFSKY_PERFORMANCE_SCORE'
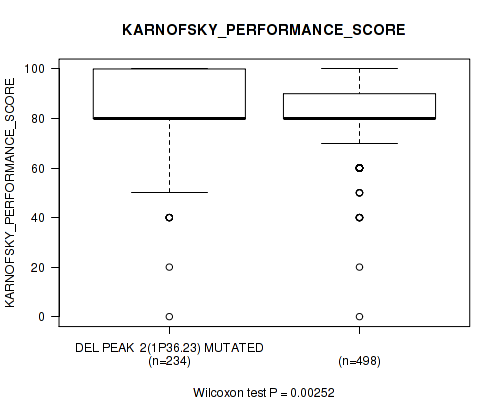
P value = 1e-05 (Fisher's exact test), Q value = 3.9e-05
Table S183. Gene #32: 'del_1p36.23' versus Clinical Feature #7: 'HISTOLOGICAL_TYPE'
| nPatients | ASTROCYTOMA | GLIOBLASTOMA MULTIFORME (GBM) | OLIGOASTROCYTOMA | OLIGODENDROGLIOMA | TREATED PRIMARY GBM | UNTREATED PRIMARY (DE NOVO) GBM |
|---|---|---|---|---|---|---|
| ALL | 194 | 30 | 129 | 189 | 18 | 525 |
| DEL PEAK 2(1P36.23) MUTATED | 24 | 5 | 48 | 140 | 3 | 124 |
| DEL PEAK 2(1P36.23) WILD-TYPE | 170 | 25 | 81 | 49 | 15 | 401 |
Figure S183. Get High-res Image Gene #32: 'del_1p36.23' versus Clinical Feature #7: 'HISTOLOGICAL_TYPE'
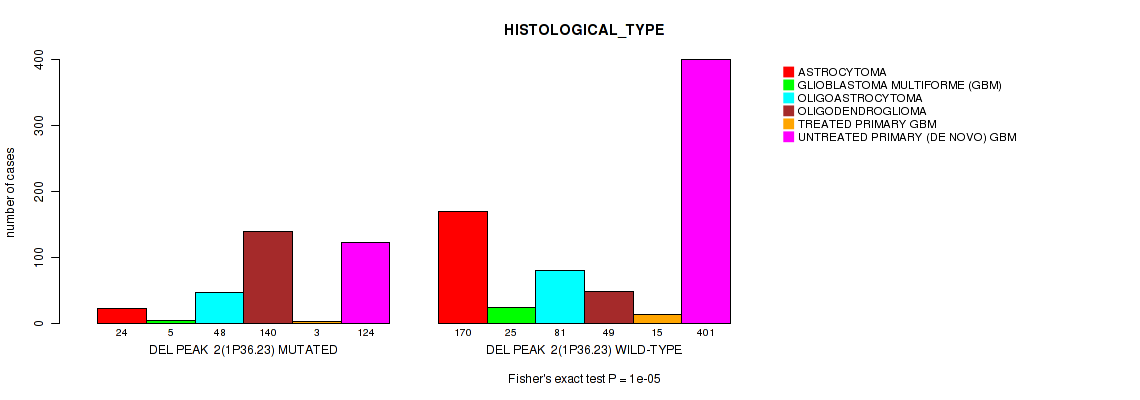
P value = 0.0996 (Fisher's exact test), Q value = 0.18
Table S184. Gene #32: 'del_1p36.23' versus Clinical Feature #8: 'RACE'
| nPatients | AMERICAN INDIAN OR ALASKA NATIVE | ASIAN | BLACK OR AFRICAN AMERICAN | WHITE |
|---|---|---|---|---|
| ALL | 1 | 21 | 71 | 959 |
| DEL PEAK 2(1P36.23) MUTATED | 1 | 10 | 18 | 305 |
| DEL PEAK 2(1P36.23) WILD-TYPE | 0 | 11 | 53 | 654 |
Figure S184. Get High-res Image Gene #32: 'del_1p36.23' versus Clinical Feature #8: 'RACE'
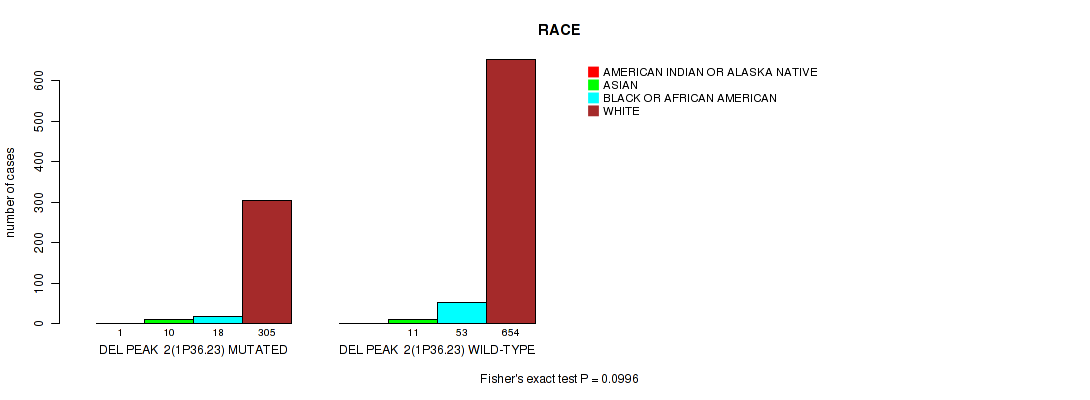
P value = 3.19e-13 (logrank test), Q value = 3.1e-12
Table S185. Gene #33: 'del_1p32.3' versus Clinical Feature #1: 'Time to Death'
| nPatients | nDeath | Duration Range (Median), Month | |
|---|---|---|---|
| ALL | 1078 | 598 | 0.0 - 211.2 (16.0) |
| DEL PEAK 3(1P32.3) MUTATED | 254 | 85 | 0.1 - 182.3 (18.2) |
| DEL PEAK 3(1P32.3) WILD-TYPE | 824 | 513 | 0.0 - 211.2 (15.3) |
Figure S185. Get High-res Image Gene #33: 'del_1p32.3' versus Clinical Feature #1: 'Time to Death'
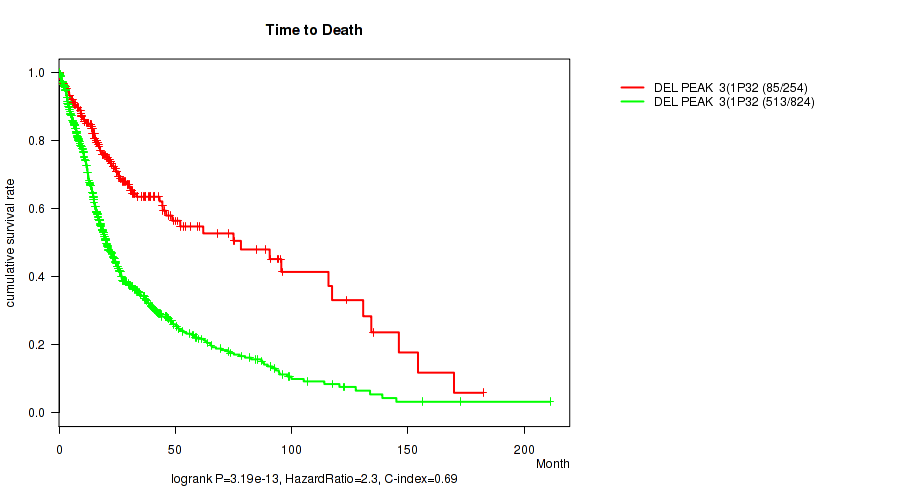
P value = 2.5e-27 (Fisher's exact test), Q value = 4.1e-26
Table S186. Gene #33: 'del_1p32.3' versus Clinical Feature #3: 'TUMOR_TISSUE_SITE'
| nPatients | BRAIN | CENTRAL NERVOUS SYSTEM |
|---|---|---|
| ALL | 573 | 512 |
| DEL PEAK 3(1P32.3) MUTATED | 61 | 196 |
| DEL PEAK 3(1P32.3) WILD-TYPE | 512 | 316 |
Figure S186. Get High-res Image Gene #33: 'del_1p32.3' versus Clinical Feature #3: 'TUMOR_TISSUE_SITE'
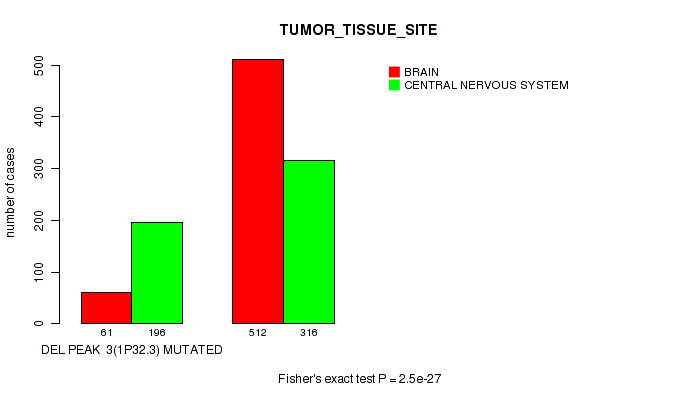
P value = 3.31e-13 (Fisher's exact test), Q value = 3.1e-12
Table S187. Gene #33: 'del_1p32.3' versus Clinical Feature #5: 'RADIATION_THERAPY'
| nPatients | NO | YES |
|---|---|---|
| ALL | 258 | 770 |
| DEL PEAK 3(1P32.3) MUTATED | 105 | 135 |
| DEL PEAK 3(1P32.3) WILD-TYPE | 153 | 635 |
Figure S187. Get High-res Image Gene #33: 'del_1p32.3' versus Clinical Feature #5: 'RADIATION_THERAPY'

P value = 0.00217 (Wilcoxon-test), Q value = 0.0063
Table S188. Gene #33: 'del_1p32.3' versus Clinical Feature #6: 'KARNOFSKY_PERFORMANCE_SCORE'
| nPatients | Mean (Std.Dev) | |
|---|---|---|
| ALL | 732 | 81.1 (15.3) |
| DEL PEAK 3(1P32.3) MUTATED | 162 | 84.0 (14.9) |
| DEL PEAK 3(1P32.3) WILD-TYPE | 570 | 80.3 (15.3) |
Figure S188. Get High-res Image Gene #33: 'del_1p32.3' versus Clinical Feature #6: 'KARNOFSKY_PERFORMANCE_SCORE'
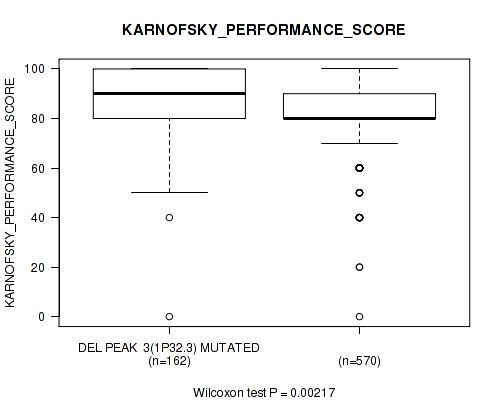
P value = 1e-05 (Fisher's exact test), Q value = 3.9e-05
Table S189. Gene #33: 'del_1p32.3' versus Clinical Feature #7: 'HISTOLOGICAL_TYPE'
| nPatients | ASTROCYTOMA | GLIOBLASTOMA MULTIFORME (GBM) | OLIGOASTROCYTOMA | OLIGODENDROGLIOMA | TREATED PRIMARY GBM | UNTREATED PRIMARY (DE NOVO) GBM |
|---|---|---|---|---|---|---|
| ALL | 194 | 30 | 129 | 189 | 18 | 525 |
| DEL PEAK 3(1P32.3) MUTATED | 16 | 2 | 42 | 138 | 2 | 57 |
| DEL PEAK 3(1P32.3) WILD-TYPE | 178 | 28 | 87 | 51 | 16 | 468 |
Figure S189. Get High-res Image Gene #33: 'del_1p32.3' versus Clinical Feature #7: 'HISTOLOGICAL_TYPE'
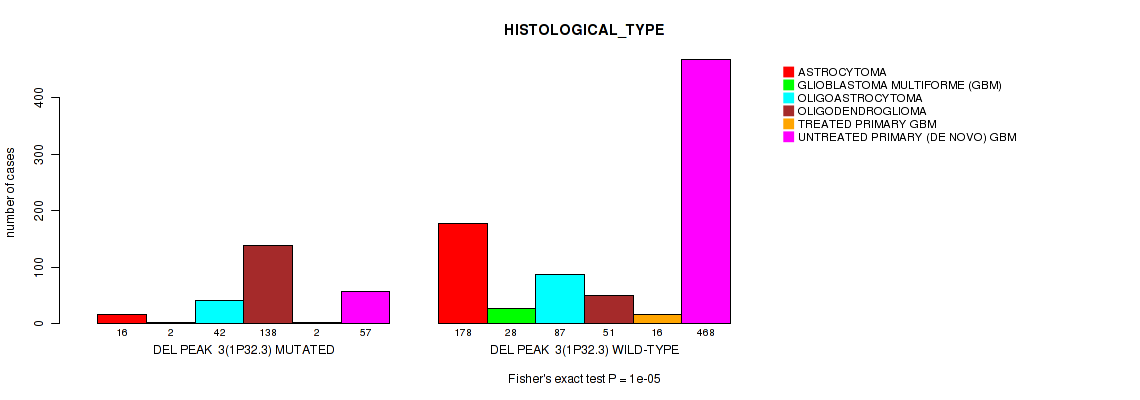
P value = 0.036 (Fisher's exact test), Q value = 0.074
Table S190. Gene #33: 'del_1p32.3' versus Clinical Feature #8: 'RACE'
| nPatients | AMERICAN INDIAN OR ALASKA NATIVE | ASIAN | BLACK OR AFRICAN AMERICAN | WHITE |
|---|---|---|---|---|
| ALL | 1 | 21 | 71 | 959 |
| DEL PEAK 3(1P32.3) MUTATED | 1 | 7 | 10 | 231 |
| DEL PEAK 3(1P32.3) WILD-TYPE | 0 | 14 | 61 | 728 |
Figure S190. Get High-res Image Gene #33: 'del_1p32.3' versus Clinical Feature #8: 'RACE'
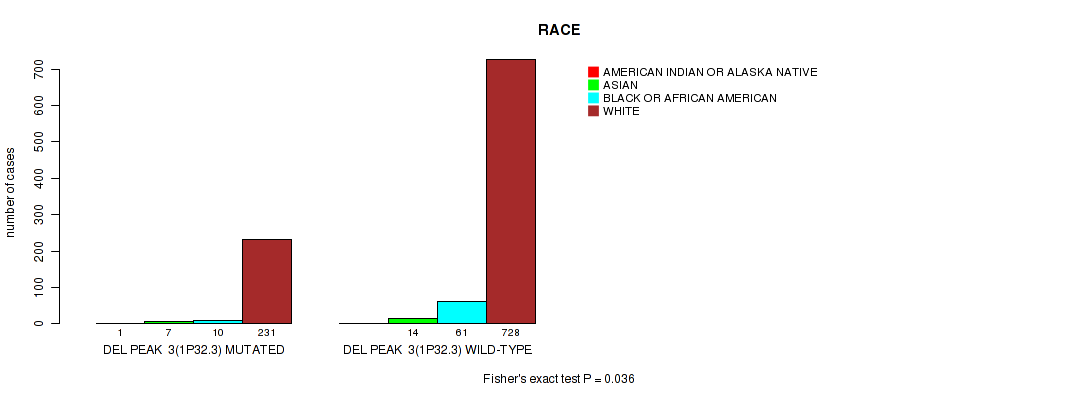
P value = 0 (logrank test), Q value = 0
Table S191. Gene #34: 'del_1p22.1' versus Clinical Feature #1: 'Time to Death'
| nPatients | nDeath | Duration Range (Median), Month | |
|---|---|---|---|
| ALL | 1078 | 598 | 0.0 - 211.2 (16.0) |
| DEL PEAK 4(1P22.1) MUTATED | 231 | 68 | 0.1 - 182.3 (20.9) |
| DEL PEAK 4(1P22.1) WILD-TYPE | 847 | 530 | 0.0 - 211.2 (15.0) |
Figure S191. Get High-res Image Gene #34: 'del_1p22.1' versus Clinical Feature #1: 'Time to Death'
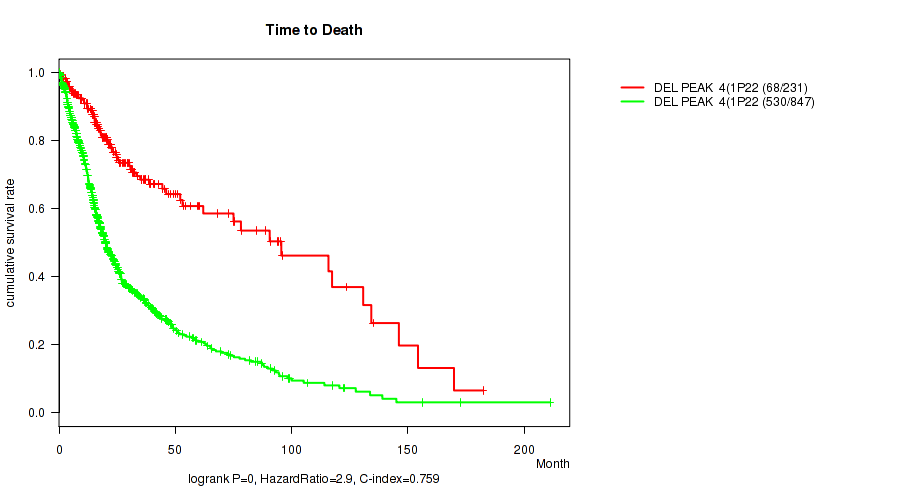
P value = 0.00479 (Wilcoxon-test), Q value = 0.013
Table S192. Gene #34: 'del_1p22.1' versus Clinical Feature #2: 'YEARS_TO_BIRTH'
| nPatients | Mean (Std.Dev) | |
|---|---|---|
| ALL | 1084 | 50.8 (15.8) |
| DEL PEAK 4(1P22.1) MUTATED | 233 | 48.4 (14.0) |
| DEL PEAK 4(1P22.1) WILD-TYPE | 851 | 51.5 (16.2) |
Figure S192. Get High-res Image Gene #34: 'del_1p22.1' versus Clinical Feature #2: 'YEARS_TO_BIRTH'
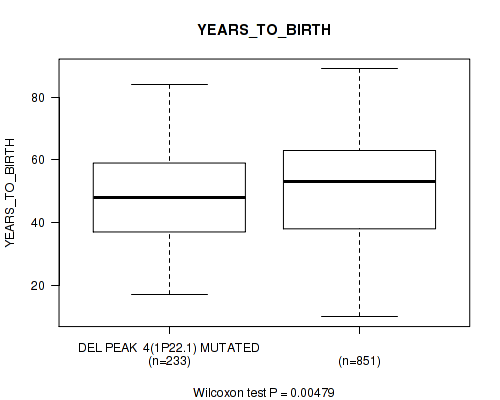
P value = 6.19e-30 (Fisher's exact test), Q value = 1e-28
Table S193. Gene #34: 'del_1p22.1' versus Clinical Feature #3: 'TUMOR_TISSUE_SITE'
| nPatients | BRAIN | CENTRAL NERVOUS SYSTEM |
|---|---|---|
| ALL | 573 | 512 |
| DEL PEAK 4(1P22.1) MUTATED | 48 | 186 |
| DEL PEAK 4(1P22.1) WILD-TYPE | 525 | 326 |
Figure S193. Get High-res Image Gene #34: 'del_1p22.1' versus Clinical Feature #3: 'TUMOR_TISSUE_SITE'

P value = 4.4e-14 (Fisher's exact test), Q value = 4.7e-13
Table S194. Gene #34: 'del_1p22.1' versus Clinical Feature #5: 'RADIATION_THERAPY'
| nPatients | NO | YES |
|---|---|---|
| ALL | 258 | 770 |
| DEL PEAK 4(1P22.1) MUTATED | 100 | 119 |
| DEL PEAK 4(1P22.1) WILD-TYPE | 158 | 651 |
Figure S194. Get High-res Image Gene #34: 'del_1p22.1' versus Clinical Feature #5: 'RADIATION_THERAPY'
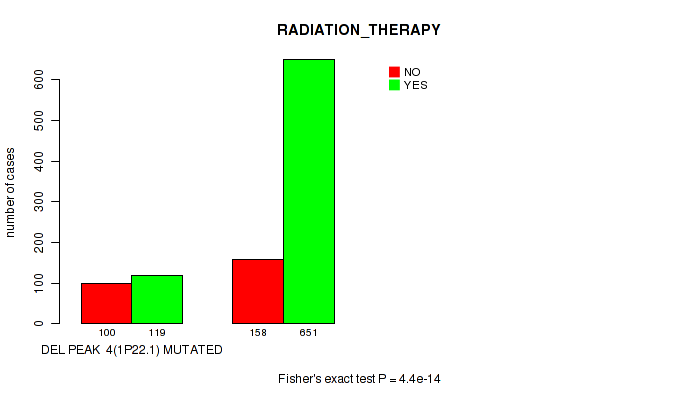
P value = 0.000183 (Wilcoxon-test), Q value = 0.00061
Table S195. Gene #34: 'del_1p22.1' versus Clinical Feature #6: 'KARNOFSKY_PERFORMANCE_SCORE'
| nPatients | Mean (Std.Dev) | |
|---|---|---|
| ALL | 732 | 81.1 (15.3) |
| DEL PEAK 4(1P22.1) MUTATED | 149 | 84.4 (16.1) |
| DEL PEAK 4(1P22.1) WILD-TYPE | 583 | 80.2 (15.0) |
Figure S195. Get High-res Image Gene #34: 'del_1p22.1' versus Clinical Feature #6: 'KARNOFSKY_PERFORMANCE_SCORE'
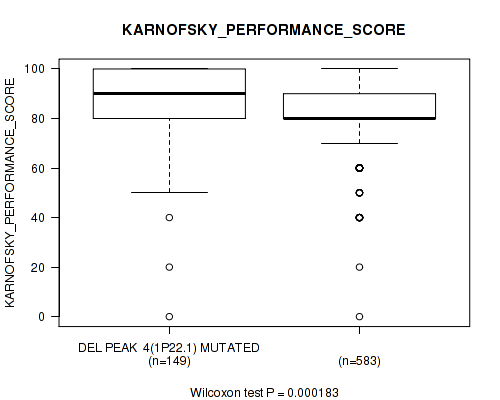
P value = 1e-05 (Fisher's exact test), Q value = 3.9e-05
Table S196. Gene #34: 'del_1p22.1' versus Clinical Feature #7: 'HISTOLOGICAL_TYPE'
| nPatients | ASTROCYTOMA | GLIOBLASTOMA MULTIFORME (GBM) | OLIGOASTROCYTOMA | OLIGODENDROGLIOMA | TREATED PRIMARY GBM | UNTREATED PRIMARY (DE NOVO) GBM |
|---|---|---|---|---|---|---|
| ALL | 194 | 30 | 129 | 189 | 18 | 525 |
| DEL PEAK 4(1P22.1) MUTATED | 11 | 2 | 39 | 136 | 4 | 42 |
| DEL PEAK 4(1P22.1) WILD-TYPE | 183 | 28 | 90 | 53 | 14 | 483 |
Figure S196. Get High-res Image Gene #34: 'del_1p22.1' versus Clinical Feature #7: 'HISTOLOGICAL_TYPE'
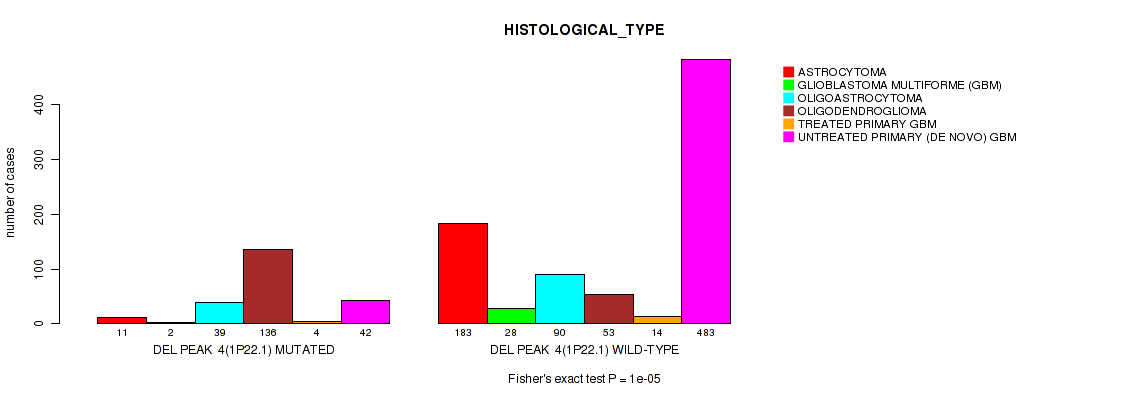
P value = 0.14 (Fisher's exact test), Q value = 0.24
Table S197. Gene #34: 'del_1p22.1' versus Clinical Feature #9: 'ETHNICITY'
| nPatients | HISPANIC OR LATINO | NOT HISPANIC OR LATINO |
|---|---|---|
| ALL | 44 | 921 |
| DEL PEAK 4(1P22.1) MUTATED | 14 | 203 |
| DEL PEAK 4(1P22.1) WILD-TYPE | 30 | 718 |
Figure S197. Get High-res Image Gene #34: 'del_1p22.1' versus Clinical Feature #9: 'ETHNICITY'
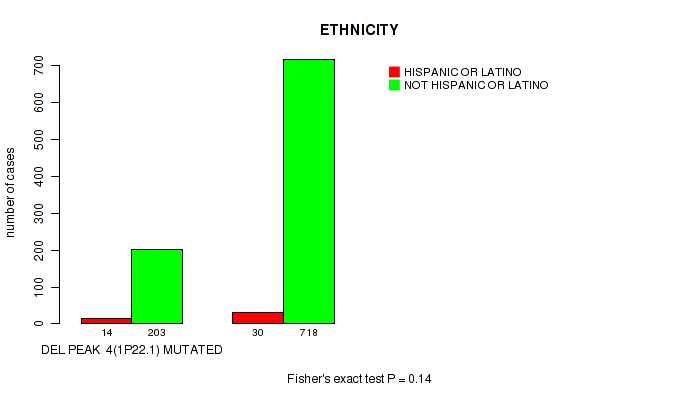
P value = 0.0181 (logrank test), Q value = 0.041
Table S198. Gene #35: 'del_1q42.11' versus Clinical Feature #1: 'Time to Death'
| nPatients | nDeath | Duration Range (Median), Month | |
|---|---|---|---|
| ALL | 1078 | 598 | 0.0 - 211.2 (16.0) |
| DEL PEAK 5(1Q42.11) MUTATED | 78 | 51 | 0.1 - 146.1 (12.6) |
| DEL PEAK 5(1Q42.11) WILD-TYPE | 1000 | 547 | 0.0 - 211.2 (16.3) |
Figure S198. Get High-res Image Gene #35: 'del_1q42.11' versus Clinical Feature #1: 'Time to Death'
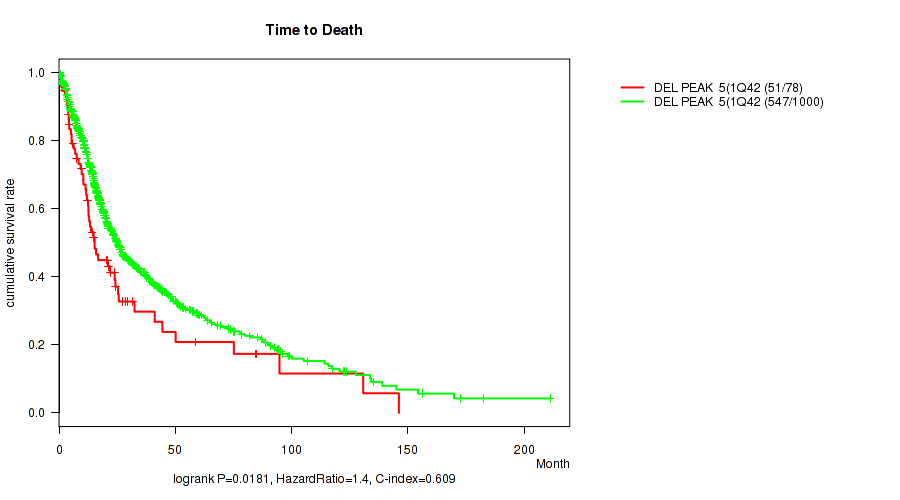
P value = 0.024 (Wilcoxon-test), Q value = 0.053
Table S199. Gene #35: 'del_1q42.11' versus Clinical Feature #2: 'YEARS_TO_BIRTH'
| nPatients | Mean (Std.Dev) | |
|---|---|---|
| ALL | 1084 | 50.8 (15.8) |
| DEL PEAK 5(1Q42.11) MUTATED | 78 | 54.9 (15.0) |
| DEL PEAK 5(1Q42.11) WILD-TYPE | 1006 | 50.5 (15.8) |
Figure S199. Get High-res Image Gene #35: 'del_1q42.11' versus Clinical Feature #2: 'YEARS_TO_BIRTH'

P value = 0.045 (Fisher's exact test), Q value = 0.09
Table S200. Gene #35: 'del_1q42.11' versus Clinical Feature #3: 'TUMOR_TISSUE_SITE'
| nPatients | BRAIN | CENTRAL NERVOUS SYSTEM |
|---|---|---|
| ALL | 573 | 512 |
| DEL PEAK 5(1Q42.11) MUTATED | 50 | 28 |
| DEL PEAK 5(1Q42.11) WILD-TYPE | 523 | 484 |
Figure S200. Get High-res Image Gene #35: 'del_1q42.11' versus Clinical Feature #3: 'TUMOR_TISSUE_SITE'

P value = 0.00912 (Wilcoxon-test), Q value = 0.022
Table S201. Gene #35: 'del_1q42.11' versus Clinical Feature #6: 'KARNOFSKY_PERFORMANCE_SCORE'
| nPatients | Mean (Std.Dev) | |
|---|---|---|
| ALL | 732 | 81.1 (15.3) |
| DEL PEAK 5(1Q42.11) MUTATED | 62 | 74.7 (20.3) |
| DEL PEAK 5(1Q42.11) WILD-TYPE | 670 | 81.7 (14.6) |
Figure S201. Get High-res Image Gene #35: 'del_1q42.11' versus Clinical Feature #6: 'KARNOFSKY_PERFORMANCE_SCORE'
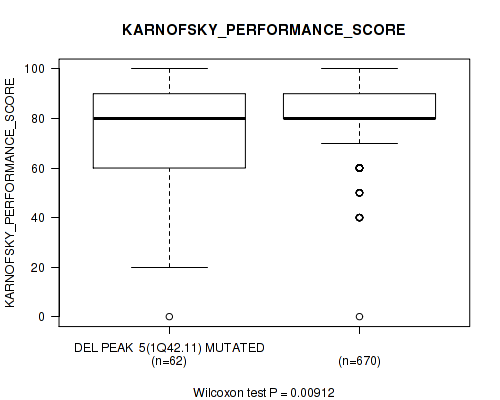
P value = 0.00355 (logrank test), Q value = 0.0097
Table S202. Gene #37: 'del_2q22.1' versus Clinical Feature #1: 'Time to Death'
| nPatients | nDeath | Duration Range (Median), Month | |
|---|---|---|---|
| ALL | 1078 | 598 | 0.0 - 211.2 (16.0) |
| DEL PEAK 7(2Q22.1) MUTATED | 68 | 51 | 1.3 - 117.4 (15.2) |
| DEL PEAK 7(2Q22.1) WILD-TYPE | 1010 | 547 | 0.0 - 211.2 (16.1) |
Figure S202. Get High-res Image Gene #37: 'del_2q22.1' versus Clinical Feature #1: 'Time to Death'
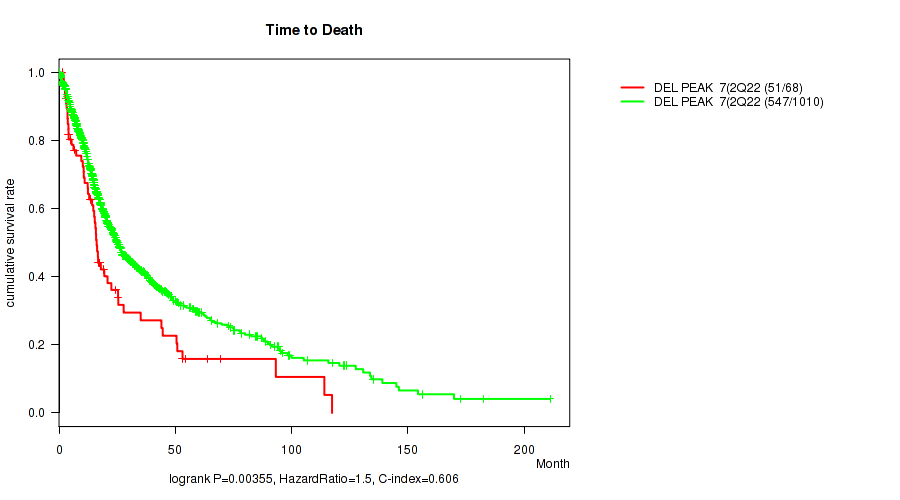
P value = 0.0179 (Wilcoxon-test), Q value = 0.04
Table S203. Gene #37: 'del_2q22.1' versus Clinical Feature #2: 'YEARS_TO_BIRTH'
| nPatients | Mean (Std.Dev) | |
|---|---|---|
| ALL | 1084 | 50.8 (15.8) |
| DEL PEAK 7(2Q22.1) MUTATED | 68 | 55.0 (16.8) |
| DEL PEAK 7(2Q22.1) WILD-TYPE | 1016 | 50.5 (15.7) |
Figure S203. Get High-res Image Gene #37: 'del_2q22.1' versus Clinical Feature #2: 'YEARS_TO_BIRTH'
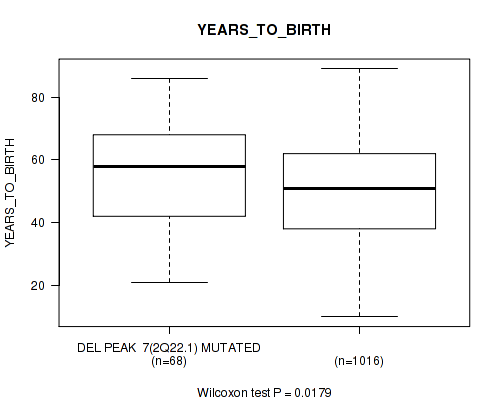
P value = 0.00564 (Fisher's exact test), Q value = 0.015
Table S204. Gene #37: 'del_2q22.1' versus Clinical Feature #3: 'TUMOR_TISSUE_SITE'
| nPatients | BRAIN | CENTRAL NERVOUS SYSTEM |
|---|---|---|
| ALL | 573 | 512 |
| DEL PEAK 7(2Q22.1) MUTATED | 47 | 21 |
| DEL PEAK 7(2Q22.1) WILD-TYPE | 526 | 491 |
Figure S204. Get High-res Image Gene #37: 'del_2q22.1' versus Clinical Feature #3: 'TUMOR_TISSUE_SITE'
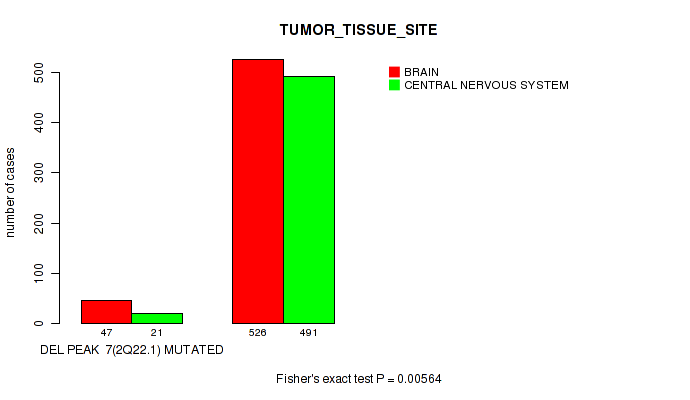
P value = 0.0834 (Wilcoxon-test), Q value = 0.15
Table S205. Gene #37: 'del_2q22.1' versus Clinical Feature #6: 'KARNOFSKY_PERFORMANCE_SCORE'
| nPatients | Mean (Std.Dev) | |
|---|---|---|
| ALL | 732 | 81.1 (15.3) |
| DEL PEAK 7(2Q22.1) MUTATED | 48 | 78.3 (13.1) |
| DEL PEAK 7(2Q22.1) WILD-TYPE | 684 | 81.3 (15.4) |
Figure S205. Get High-res Image Gene #37: 'del_2q22.1' versus Clinical Feature #6: 'KARNOFSKY_PERFORMANCE_SCORE'
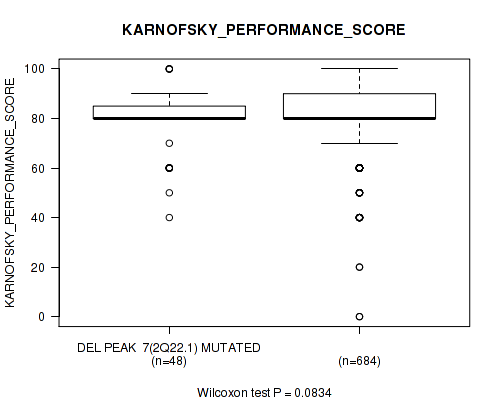
P value = 0.00489 (Fisher's exact test), Q value = 0.013
Table S206. Gene #37: 'del_2q22.1' versus Clinical Feature #7: 'HISTOLOGICAL_TYPE'
| nPatients | ASTROCYTOMA | GLIOBLASTOMA MULTIFORME (GBM) | OLIGOASTROCYTOMA | OLIGODENDROGLIOMA | TREATED PRIMARY GBM | UNTREATED PRIMARY (DE NOVO) GBM |
|---|---|---|---|---|---|---|
| ALL | 194 | 30 | 129 | 189 | 18 | 525 |
| DEL PEAK 7(2Q22.1) MUTATED | 13 | 5 | 3 | 5 | 2 | 40 |
| DEL PEAK 7(2Q22.1) WILD-TYPE | 181 | 25 | 126 | 184 | 16 | 485 |
Figure S206. Get High-res Image Gene #37: 'del_2q22.1' versus Clinical Feature #7: 'HISTOLOGICAL_TYPE'

P value = 0.105 (Fisher's exact test), Q value = 0.18
Table S207. Gene #37: 'del_2q22.1' versus Clinical Feature #9: 'ETHNICITY'
| nPatients | HISPANIC OR LATINO | NOT HISPANIC OR LATINO |
|---|---|---|
| ALL | 44 | 921 |
| DEL PEAK 7(2Q22.1) MUTATED | 0 | 60 |
| DEL PEAK 7(2Q22.1) WILD-TYPE | 44 | 861 |
Figure S207. Get High-res Image Gene #37: 'del_2q22.1' versus Clinical Feature #9: 'ETHNICITY'
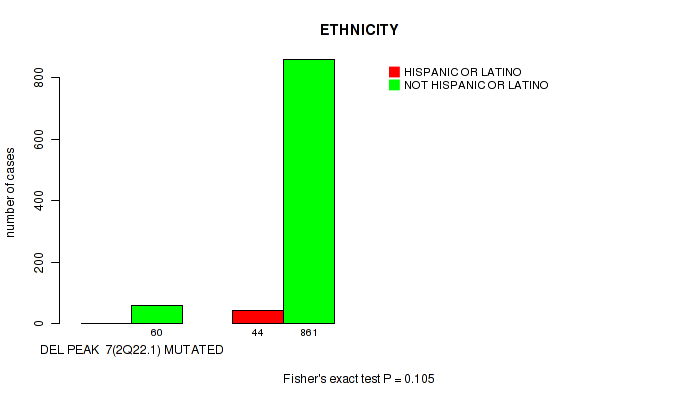
P value = 0.0265 (Wilcoxon-test), Q value = 0.057
Table S208. Gene #38: 'del_2q37.1' versus Clinical Feature #2: 'YEARS_TO_BIRTH'
| nPatients | Mean (Std.Dev) | |
|---|---|---|
| ALL | 1084 | 50.8 (15.8) |
| DEL PEAK 8(2Q37.1) MUTATED | 121 | 47.9 (17.0) |
| DEL PEAK 8(2Q37.1) WILD-TYPE | 963 | 51.2 (15.6) |
Figure S208. Get High-res Image Gene #38: 'del_2q37.1' versus Clinical Feature #2: 'YEARS_TO_BIRTH'
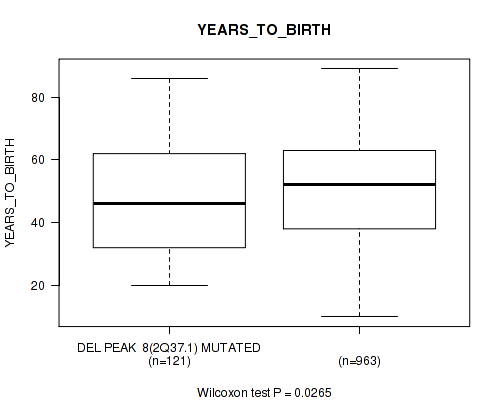
P value = 0.1 (Fisher's exact test), Q value = 0.18
Table S209. Gene #38: 'del_2q37.1' versus Clinical Feature #3: 'TUMOR_TISSUE_SITE'
| nPatients | BRAIN | CENTRAL NERVOUS SYSTEM |
|---|---|---|
| ALL | 573 | 512 |
| DEL PEAK 8(2Q37.1) MUTATED | 55 | 66 |
| DEL PEAK 8(2Q37.1) WILD-TYPE | 518 | 446 |
Figure S209. Get High-res Image Gene #38: 'del_2q37.1' versus Clinical Feature #3: 'TUMOR_TISSUE_SITE'
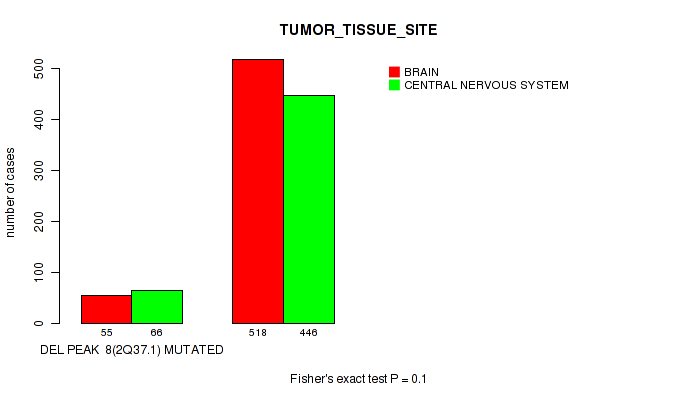
P value = 0.00601 (Fisher's exact test), Q value = 0.015
Table S210. Gene #38: 'del_2q37.1' versus Clinical Feature #7: 'HISTOLOGICAL_TYPE'
| nPatients | ASTROCYTOMA | GLIOBLASTOMA MULTIFORME (GBM) | OLIGOASTROCYTOMA | OLIGODENDROGLIOMA | TREATED PRIMARY GBM | UNTREATED PRIMARY (DE NOVO) GBM |
|---|---|---|---|---|---|---|
| ALL | 194 | 30 | 129 | 189 | 18 | 525 |
| DEL PEAK 8(2Q37.1) MUTATED | 34 | 3 | 20 | 12 | 1 | 51 |
| DEL PEAK 8(2Q37.1) WILD-TYPE | 160 | 27 | 109 | 177 | 17 | 474 |
Figure S210. Get High-res Image Gene #38: 'del_2q37.1' versus Clinical Feature #7: 'HISTOLOGICAL_TYPE'
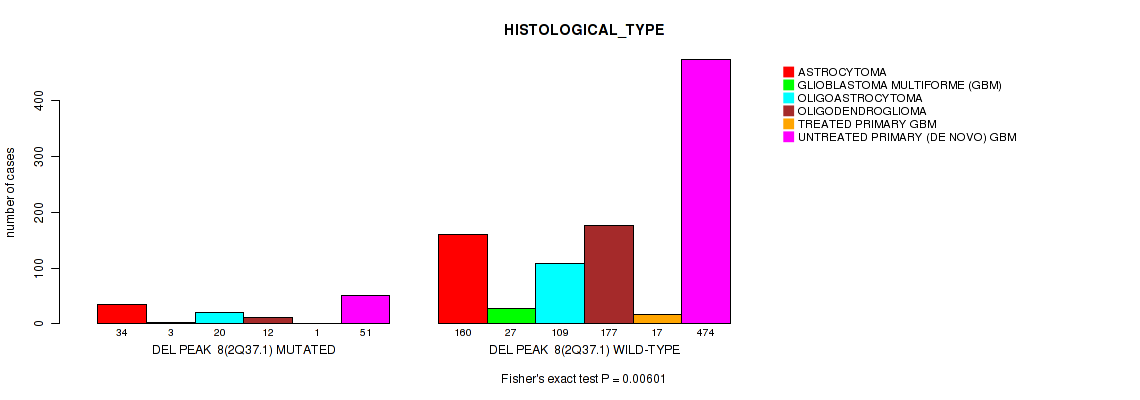
P value = 0.00121 (Fisher's exact test), Q value = 0.0037
Table S211. Gene #39: 'del_3p21.31' versus Clinical Feature #5: 'RADIATION_THERAPY'
| nPatients | NO | YES |
|---|---|---|
| ALL | 258 | 770 |
| DEL PEAK 9(3P21.31) MUTATED | 13 | 91 |
| DEL PEAK 9(3P21.31) WILD-TYPE | 245 | 679 |
Figure S211. Get High-res Image Gene #39: 'del_3p21.31' versus Clinical Feature #5: 'RADIATION_THERAPY'

P value = 0.0798 (logrank test), Q value = 0.15
Table S212. Gene #40: 'del_3q13.31' versus Clinical Feature #1: 'Time to Death'
| nPatients | nDeath | Duration Range (Median), Month | |
|---|---|---|---|
| ALL | 1078 | 598 | 0.0 - 211.2 (16.0) |
| DEL PEAK 10(3Q13.31) MUTATED | 95 | 64 | 0.1 - 117.4 (15.9) |
| DEL PEAK 10(3Q13.31) WILD-TYPE | 983 | 534 | 0.0 - 211.2 (16.0) |
Figure S212. Get High-res Image Gene #40: 'del_3q13.31' versus Clinical Feature #1: 'Time to Death'
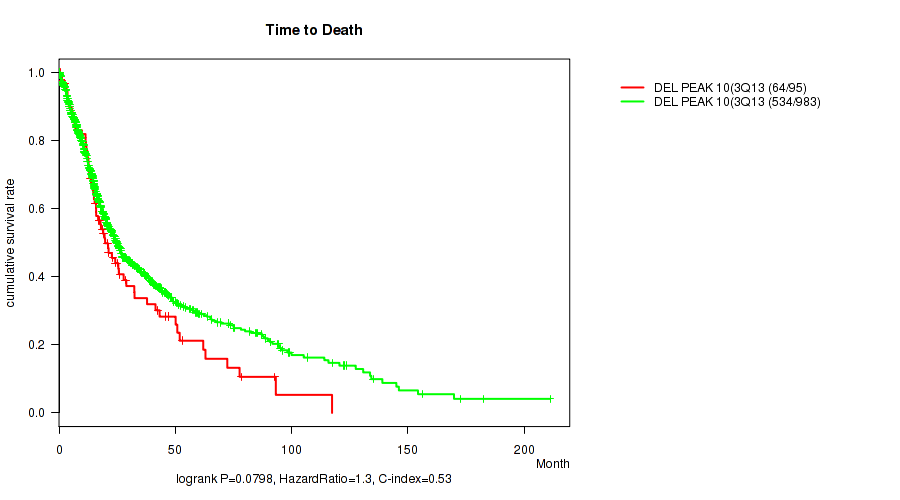
P value = 0.0724 (Fisher's exact test), Q value = 0.14
Table S213. Gene #40: 'del_3q13.31' versus Clinical Feature #5: 'RADIATION_THERAPY'
| nPatients | NO | YES |
|---|---|---|
| ALL | 258 | 770 |
| DEL PEAK 10(3Q13.31) MUTATED | 15 | 73 |
| DEL PEAK 10(3Q13.31) WILD-TYPE | 243 | 697 |
Figure S213. Get High-res Image Gene #40: 'del_3q13.31' versus Clinical Feature #5: 'RADIATION_THERAPY'

P value = 0.000118 (logrank test), Q value = 4e-04
Table S214. Gene #42: 'del_4q34.3' versus Clinical Feature #1: 'Time to Death'
| nPatients | nDeath | Duration Range (Median), Month | |
|---|---|---|---|
| ALL | 1078 | 598 | 0.0 - 211.2 (16.0) |
| DEL PEAK 12(4Q34.3) MUTATED | 229 | 104 | 0.1 - 156.2 (20.0) |
| DEL PEAK 12(4Q34.3) WILD-TYPE | 849 | 494 | 0.0 - 211.2 (15.0) |
Figure S214. Get High-res Image Gene #42: 'del_4q34.3' versus Clinical Feature #1: 'Time to Death'
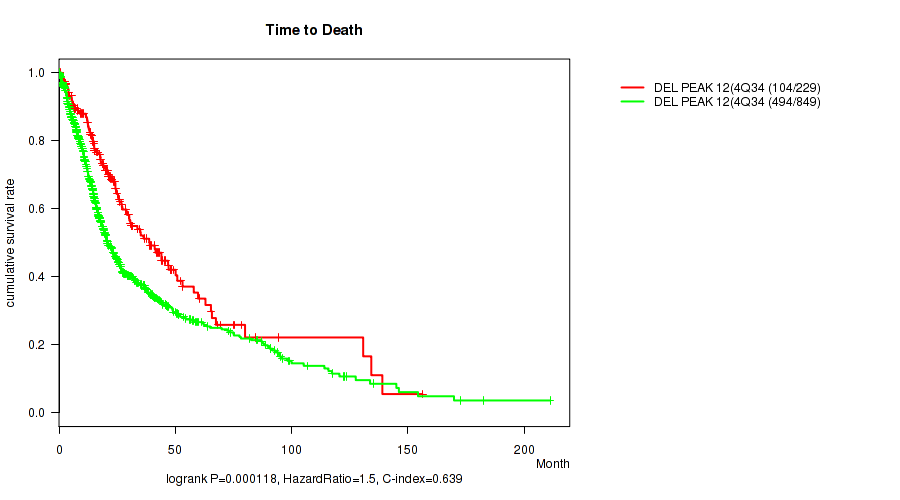
P value = 0.0175 (Wilcoxon-test), Q value = 0.04
Table S215. Gene #42: 'del_4q34.3' versus Clinical Feature #2: 'YEARS_TO_BIRTH'
| nPatients | Mean (Std.Dev) | |
|---|---|---|
| ALL | 1084 | 50.8 (15.8) |
| DEL PEAK 12(4Q34.3) MUTATED | 230 | 48.7 (14.6) |
| DEL PEAK 12(4Q34.3) WILD-TYPE | 854 | 51.4 (16.1) |
Figure S215. Get High-res Image Gene #42: 'del_4q34.3' versus Clinical Feature #2: 'YEARS_TO_BIRTH'
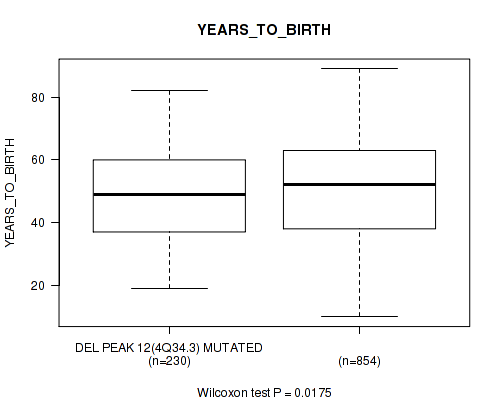
P value = 2.89e-05 (Fisher's exact test), Q value = 0.00011
Table S216. Gene #42: 'del_4q34.3' versus Clinical Feature #3: 'TUMOR_TISSUE_SITE'
| nPatients | BRAIN | CENTRAL NERVOUS SYSTEM |
|---|---|---|
| ALL | 573 | 512 |
| DEL PEAK 12(4Q34.3) MUTATED | 93 | 137 |
| DEL PEAK 12(4Q34.3) WILD-TYPE | 480 | 375 |
Figure S216. Get High-res Image Gene #42: 'del_4q34.3' versus Clinical Feature #3: 'TUMOR_TISSUE_SITE'
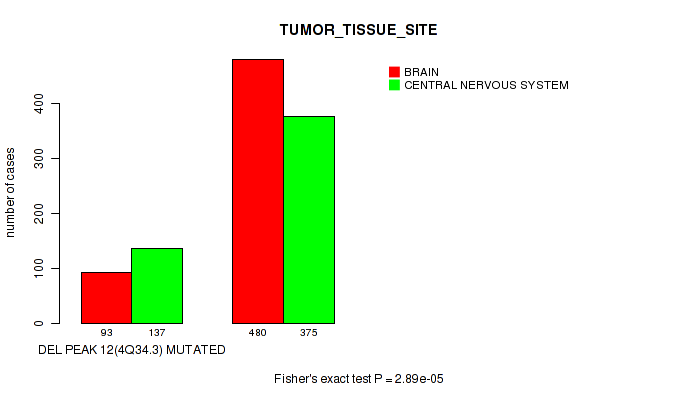
P value = 0.0983 (Fisher's exact test), Q value = 0.18
Table S217. Gene #42: 'del_4q34.3' versus Clinical Feature #4: 'GENDER'
| nPatients | FEMALE | MALE |
|---|---|---|
| ALL | 453 | 632 |
| DEL PEAK 12(4Q34.3) MUTATED | 85 | 145 |
| DEL PEAK 12(4Q34.3) WILD-TYPE | 368 | 487 |
Figure S217. Get High-res Image Gene #42: 'del_4q34.3' versus Clinical Feature #4: 'GENDER'
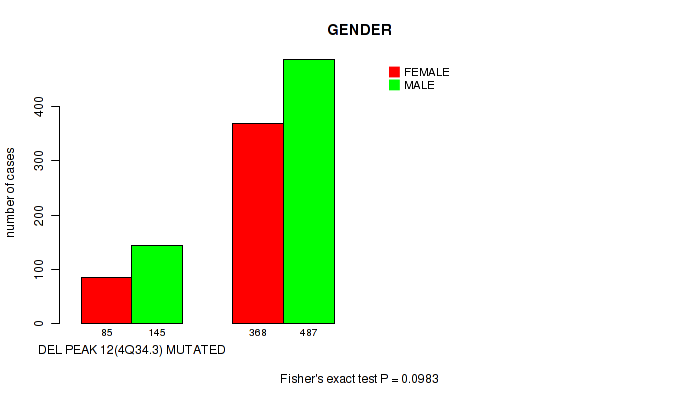
P value = 0.00164 (Fisher's exact test), Q value = 0.0049
Table S218. Gene #42: 'del_4q34.3' versus Clinical Feature #7: 'HISTOLOGICAL_TYPE'
| nPatients | ASTROCYTOMA | GLIOBLASTOMA MULTIFORME (GBM) | OLIGOASTROCYTOMA | OLIGODENDROGLIOMA | TREATED PRIMARY GBM | UNTREATED PRIMARY (DE NOVO) GBM |
|---|---|---|---|---|---|---|
| ALL | 194 | 30 | 129 | 189 | 18 | 525 |
| DEL PEAK 12(4Q34.3) MUTATED | 48 | 6 | 36 | 53 | 2 | 85 |
| DEL PEAK 12(4Q34.3) WILD-TYPE | 146 | 24 | 93 | 136 | 16 | 440 |
Figure S218. Get High-res Image Gene #42: 'del_4q34.3' versus Clinical Feature #7: 'HISTOLOGICAL_TYPE'
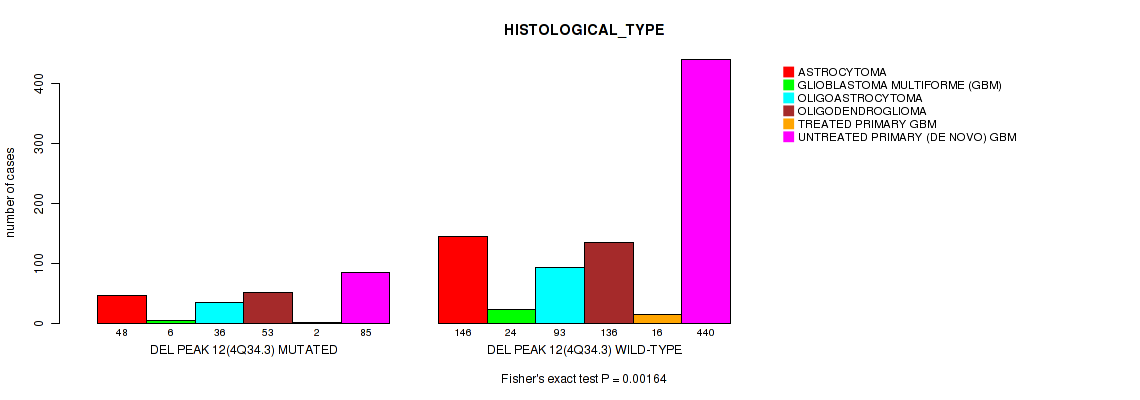
P value = 0.000381 (Fisher's exact test), Q value = 0.0012
Table S219. Gene #43: 'del_5p15.33' versus Clinical Feature #5: 'RADIATION_THERAPY'
| nPatients | NO | YES |
|---|---|---|
| ALL | 258 | 770 |
| DEL PEAK 13(5P15.33) MUTATED | 11 | 88 |
| DEL PEAK 13(5P15.33) WILD-TYPE | 247 | 682 |
Figure S219. Get High-res Image Gene #43: 'del_5p15.33' versus Clinical Feature #5: 'RADIATION_THERAPY'
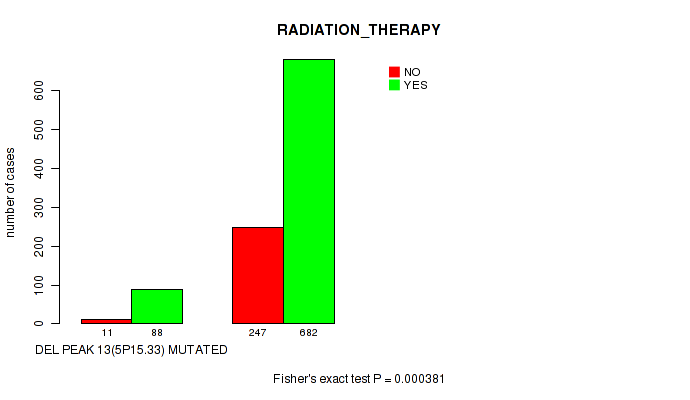
P value = 0.0259 (Fisher's exact test), Q value = 0.056
Table S220. Gene #43: 'del_5p15.33' versus Clinical Feature #7: 'HISTOLOGICAL_TYPE'
| nPatients | ASTROCYTOMA | GLIOBLASTOMA MULTIFORME (GBM) | OLIGOASTROCYTOMA | OLIGODENDROGLIOMA | TREATED PRIMARY GBM | UNTREATED PRIMARY (DE NOVO) GBM |
|---|---|---|---|---|---|---|
| ALL | 194 | 30 | 129 | 189 | 18 | 525 |
| DEL PEAK 13(5P15.33) MUTATED | 23 | 3 | 19 | 8 | 1 | 52 |
| DEL PEAK 13(5P15.33) WILD-TYPE | 171 | 27 | 110 | 181 | 17 | 473 |
Figure S220. Get High-res Image Gene #43: 'del_5p15.33' versus Clinical Feature #7: 'HISTOLOGICAL_TYPE'
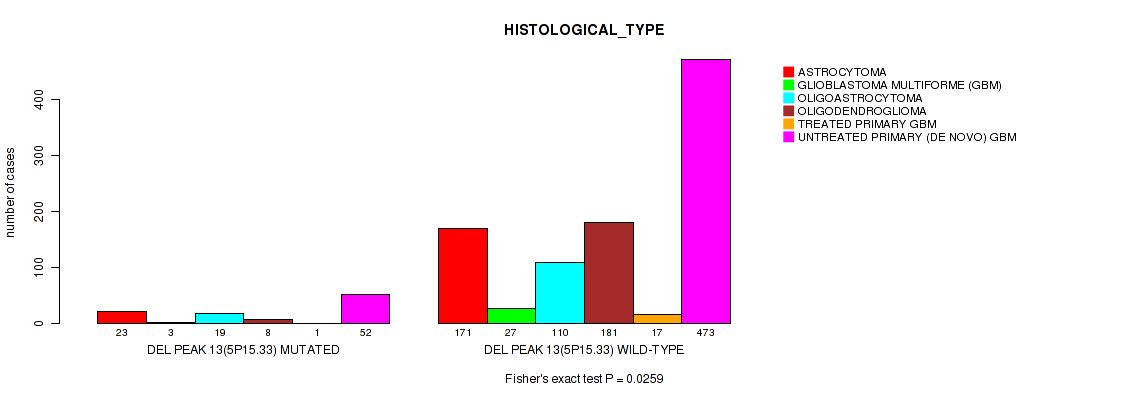
P value = 0.0878 (Wilcoxon-test), Q value = 0.16
Table S221. Gene #44: 'del_5q34' versus Clinical Feature #2: 'YEARS_TO_BIRTH'
| nPatients | Mean (Std.Dev) | |
|---|---|---|
| ALL | 1084 | 50.8 (15.8) |
| DEL PEAK 14(5Q34) MUTATED | 132 | 48.5 (17.7) |
| DEL PEAK 14(5Q34) WILD-TYPE | 952 | 51.1 (15.5) |
Figure S221. Get High-res Image Gene #44: 'del_5q34' versus Clinical Feature #2: 'YEARS_TO_BIRTH'
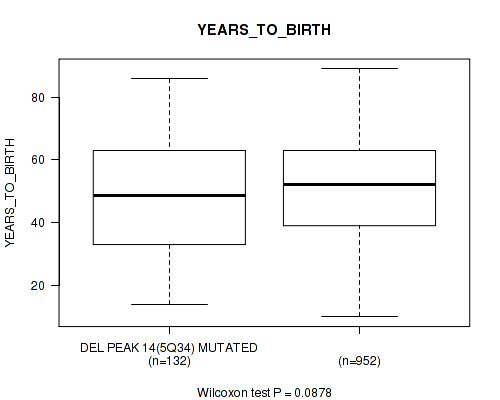
P value = 0.00179 (Fisher's exact test), Q value = 0.0053
Table S222. Gene #44: 'del_5q34' versus Clinical Feature #5: 'RADIATION_THERAPY'
| nPatients | NO | YES |
|---|---|---|
| ALL | 258 | 770 |
| DEL PEAK 14(5Q34) MUTATED | 17 | 106 |
| DEL PEAK 14(5Q34) WILD-TYPE | 241 | 664 |
Figure S222. Get High-res Image Gene #44: 'del_5q34' versus Clinical Feature #5: 'RADIATION_THERAPY'

P value = 0.00021 (Fisher's exact test), Q value = 0.00069
Table S223. Gene #44: 'del_5q34' versus Clinical Feature #7: 'HISTOLOGICAL_TYPE'
| nPatients | ASTROCYTOMA | GLIOBLASTOMA MULTIFORME (GBM) | OLIGOASTROCYTOMA | OLIGODENDROGLIOMA | TREATED PRIMARY GBM | UNTREATED PRIMARY (DE NOVO) GBM |
|---|---|---|---|---|---|---|
| ALL | 194 | 30 | 129 | 189 | 18 | 525 |
| DEL PEAK 14(5Q34) MUTATED | 40 | 6 | 13 | 10 | 1 | 62 |
| DEL PEAK 14(5Q34) WILD-TYPE | 154 | 24 | 116 | 179 | 17 | 463 |
Figure S223. Get High-res Image Gene #44: 'del_5q34' versus Clinical Feature #7: 'HISTOLOGICAL_TYPE'
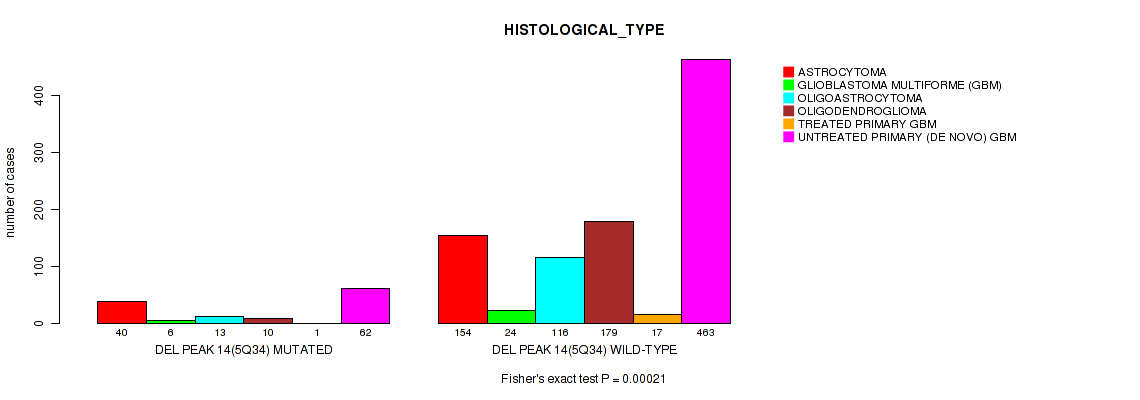
P value = 7.99e-08 (logrank test), Q value = 4.8e-07
Table S224. Gene #45: 'del_6p25.3' versus Clinical Feature #1: 'Time to Death'
| nPatients | nDeath | Duration Range (Median), Month | |
|---|---|---|---|
| ALL | 1078 | 598 | 0.0 - 211.2 (16.0) |
| DEL PEAK 15(6P25.3) MUTATED | 137 | 97 | 0.1 - 145.1 (12.1) |
| DEL PEAK 15(6P25.3) WILD-TYPE | 941 | 501 | 0.0 - 211.2 (16.7) |
Figure S224. Get High-res Image Gene #45: 'del_6p25.3' versus Clinical Feature #1: 'Time to Death'
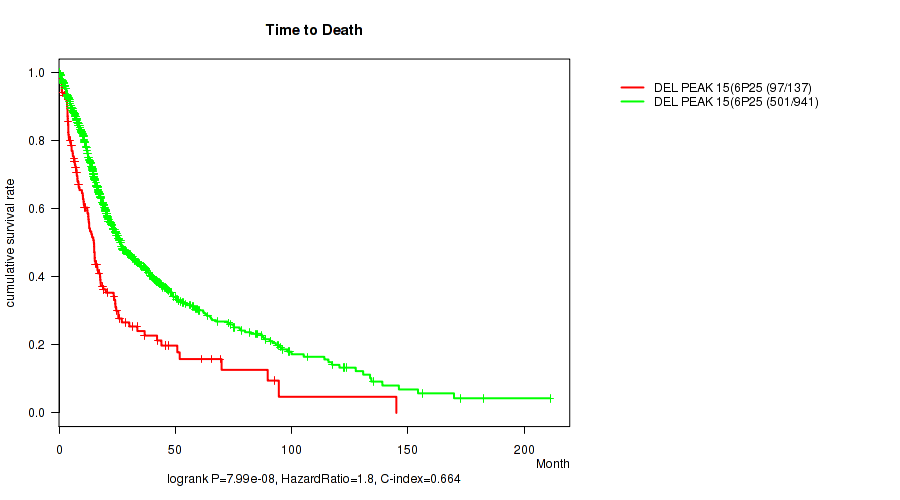
P value = 0.0376 (Wilcoxon-test), Q value = 0.077
Table S225. Gene #45: 'del_6p25.3' versus Clinical Feature #2: 'YEARS_TO_BIRTH'
| nPatients | Mean (Std.Dev) | |
|---|---|---|
| ALL | 1084 | 50.8 (15.8) |
| DEL PEAK 15(6P25.3) MUTATED | 138 | 53.3 (15.9) |
| DEL PEAK 15(6P25.3) WILD-TYPE | 946 | 50.4 (15.7) |
Figure S225. Get High-res Image Gene #45: 'del_6p25.3' versus Clinical Feature #2: 'YEARS_TO_BIRTH'

P value = 0.00613 (Fisher's exact test), Q value = 0.016
Table S226. Gene #45: 'del_6p25.3' versus Clinical Feature #3: 'TUMOR_TISSUE_SITE'
| nPatients | BRAIN | CENTRAL NERVOUS SYSTEM |
|---|---|---|
| ALL | 573 | 512 |
| DEL PEAK 15(6P25.3) MUTATED | 88 | 50 |
| DEL PEAK 15(6P25.3) WILD-TYPE | 485 | 462 |
Figure S226. Get High-res Image Gene #45: 'del_6p25.3' versus Clinical Feature #3: 'TUMOR_TISSUE_SITE'

P value = 0.144 (Wilcoxon-test), Q value = 0.24
Table S227. Gene #45: 'del_6p25.3' versus Clinical Feature #6: 'KARNOFSKY_PERFORMANCE_SCORE'
| nPatients | Mean (Std.Dev) | |
|---|---|---|
| ALL | 732 | 81.1 (15.3) |
| DEL PEAK 15(6P25.3) MUTATED | 99 | 79.7 (13.9) |
| DEL PEAK 15(6P25.3) WILD-TYPE | 633 | 81.3 (15.5) |
Figure S227. Get High-res Image Gene #45: 'del_6p25.3' versus Clinical Feature #6: 'KARNOFSKY_PERFORMANCE_SCORE'
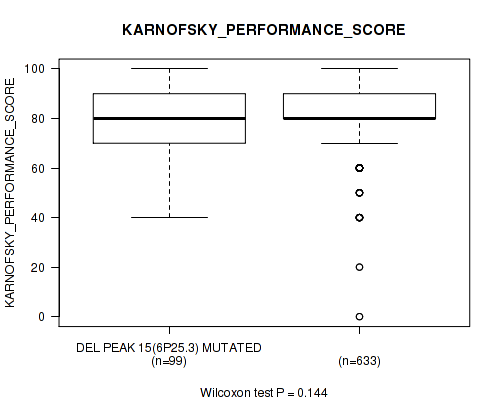
P value = 0.057 (Fisher's exact test), Q value = 0.11
Table S228. Gene #45: 'del_6p25.3' versus Clinical Feature #7: 'HISTOLOGICAL_TYPE'
| nPatients | ASTROCYTOMA | GLIOBLASTOMA MULTIFORME (GBM) | OLIGOASTROCYTOMA | OLIGODENDROGLIOMA | TREATED PRIMARY GBM | UNTREATED PRIMARY (DE NOVO) GBM |
|---|---|---|---|---|---|---|
| ALL | 194 | 30 | 129 | 189 | 18 | 525 |
| DEL PEAK 15(6P25.3) MUTATED | 24 | 3 | 10 | 16 | 2 | 83 |
| DEL PEAK 15(6P25.3) WILD-TYPE | 170 | 27 | 119 | 173 | 16 | 442 |
Figure S228. Get High-res Image Gene #45: 'del_6p25.3' versus Clinical Feature #7: 'HISTOLOGICAL_TYPE'
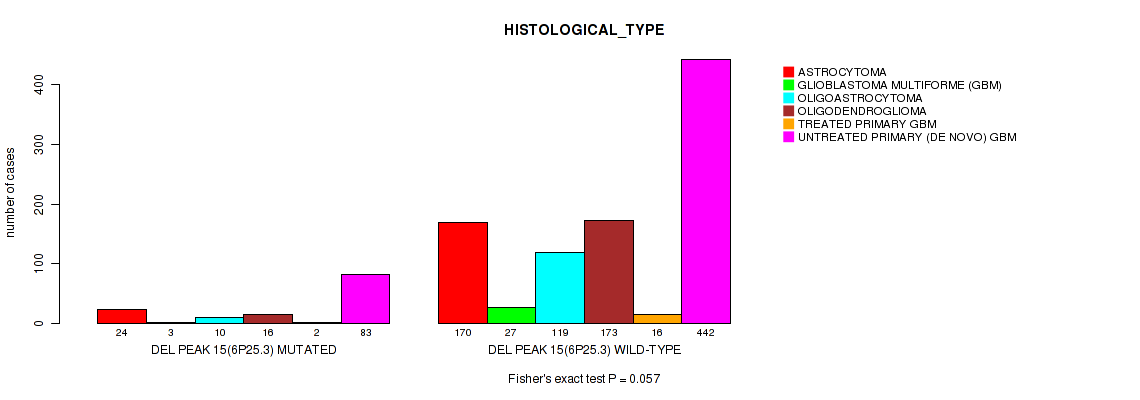
P value = 2.97e-12 (logrank test), Q value = 2.7e-11
Table S229. Gene #46: 'del_6q22.31' versus Clinical Feature #1: 'Time to Death'
| nPatients | nDeath | Duration Range (Median), Month | |
|---|---|---|---|
| ALL | 1078 | 598 | 0.0 - 211.2 (16.0) |
| DEL PEAK 16(6Q22.31) MUTATED | 237 | 167 | 0.1 - 117.4 (13.0) |
| DEL PEAK 16(6Q22.31) WILD-TYPE | 841 | 431 | 0.0 - 211.2 (17.2) |
Figure S229. Get High-res Image Gene #46: 'del_6q22.31' versus Clinical Feature #1: 'Time to Death'
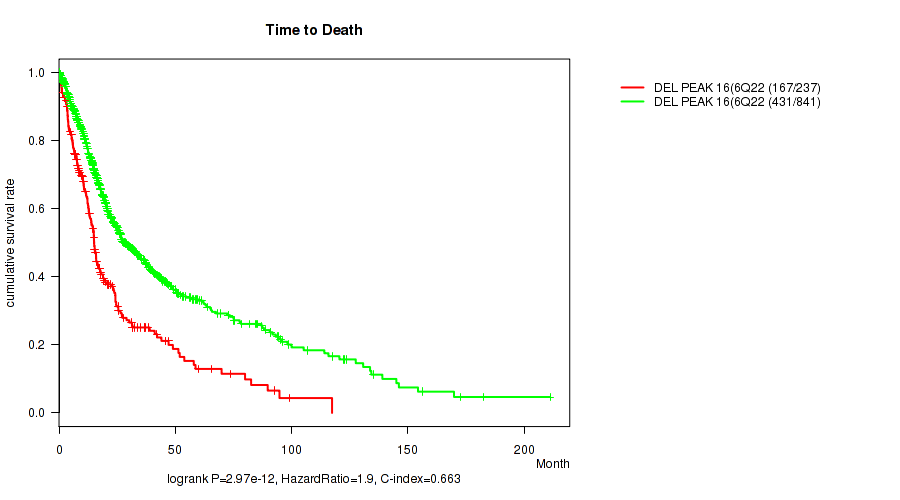
P value = 1.22e-05 (Wilcoxon-test), Q value = 4.7e-05
Table S230. Gene #46: 'del_6q22.31' versus Clinical Feature #2: 'YEARS_TO_BIRTH'
| nPatients | Mean (Std.Dev) | |
|---|---|---|
| ALL | 1084 | 50.8 (15.8) |
| DEL PEAK 16(6Q22.31) MUTATED | 239 | 54.8 (15.3) |
| DEL PEAK 16(6Q22.31) WILD-TYPE | 845 | 49.7 (15.7) |
Figure S230. Get High-res Image Gene #46: 'del_6q22.31' versus Clinical Feature #2: 'YEARS_TO_BIRTH'

P value = 1.61e-07 (Fisher's exact test), Q value = 9.4e-07
Table S231. Gene #46: 'del_6q22.31' versus Clinical Feature #3: 'TUMOR_TISSUE_SITE'
| nPatients | BRAIN | CENTRAL NERVOUS SYSTEM |
|---|---|---|
| ALL | 573 | 512 |
| DEL PEAK 16(6Q22.31) MUTATED | 162 | 77 |
| DEL PEAK 16(6Q22.31) WILD-TYPE | 411 | 435 |
Figure S231. Get High-res Image Gene #46: 'del_6q22.31' versus Clinical Feature #3: 'TUMOR_TISSUE_SITE'
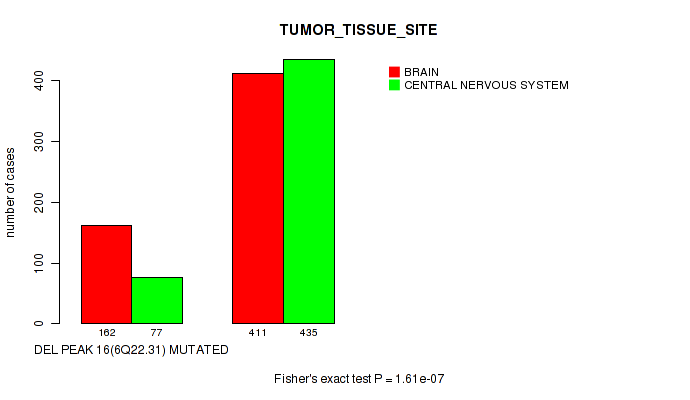
P value = 0.138 (Fisher's exact test), Q value = 0.24
Table S232. Gene #46: 'del_6q22.31' versus Clinical Feature #4: 'GENDER'
| nPatients | FEMALE | MALE |
|---|---|---|
| ALL | 453 | 632 |
| DEL PEAK 16(6Q22.31) MUTATED | 110 | 129 |
| DEL PEAK 16(6Q22.31) WILD-TYPE | 343 | 503 |
Figure S232. Get High-res Image Gene #46: 'del_6q22.31' versus Clinical Feature #4: 'GENDER'

P value = 0.0233 (Fisher's exact test), Q value = 0.052
Table S233. Gene #46: 'del_6q22.31' versus Clinical Feature #5: 'RADIATION_THERAPY'
| nPatients | NO | YES |
|---|---|---|
| ALL | 258 | 770 |
| DEL PEAK 16(6Q22.31) MUTATED | 43 | 181 |
| DEL PEAK 16(6Q22.31) WILD-TYPE | 215 | 589 |
Figure S233. Get High-res Image Gene #46: 'del_6q22.31' versus Clinical Feature #5: 'RADIATION_THERAPY'

P value = 0.00855 (Wilcoxon-test), Q value = 0.021
Table S234. Gene #46: 'del_6q22.31' versus Clinical Feature #6: 'KARNOFSKY_PERFORMANCE_SCORE'
| nPatients | Mean (Std.Dev) | |
|---|---|---|
| ALL | 732 | 81.1 (15.3) |
| DEL PEAK 16(6Q22.31) MUTATED | 173 | 78.7 (15.9) |
| DEL PEAK 16(6Q22.31) WILD-TYPE | 559 | 81.8 (15.0) |
Figure S234. Get High-res Image Gene #46: 'del_6q22.31' versus Clinical Feature #6: 'KARNOFSKY_PERFORMANCE_SCORE'
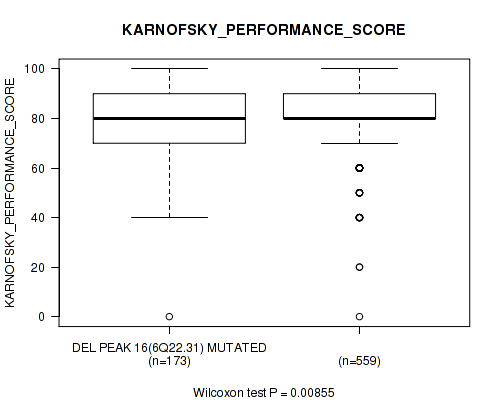
P value = 1e-05 (Fisher's exact test), Q value = 3.9e-05
Table S235. Gene #46: 'del_6q22.31' versus Clinical Feature #7: 'HISTOLOGICAL_TYPE'
| nPatients | ASTROCYTOMA | GLIOBLASTOMA MULTIFORME (GBM) | OLIGOASTROCYTOMA | OLIGODENDROGLIOMA | TREATED PRIMARY GBM | UNTREATED PRIMARY (DE NOVO) GBM |
|---|---|---|---|---|---|---|
| ALL | 194 | 30 | 129 | 189 | 18 | 525 |
| DEL PEAK 16(6Q22.31) MUTATED | 47 | 7 | 11 | 19 | 7 | 148 |
| DEL PEAK 16(6Q22.31) WILD-TYPE | 147 | 23 | 118 | 170 | 11 | 377 |
Figure S235. Get High-res Image Gene #46: 'del_6q22.31' versus Clinical Feature #7: 'HISTOLOGICAL_TYPE'
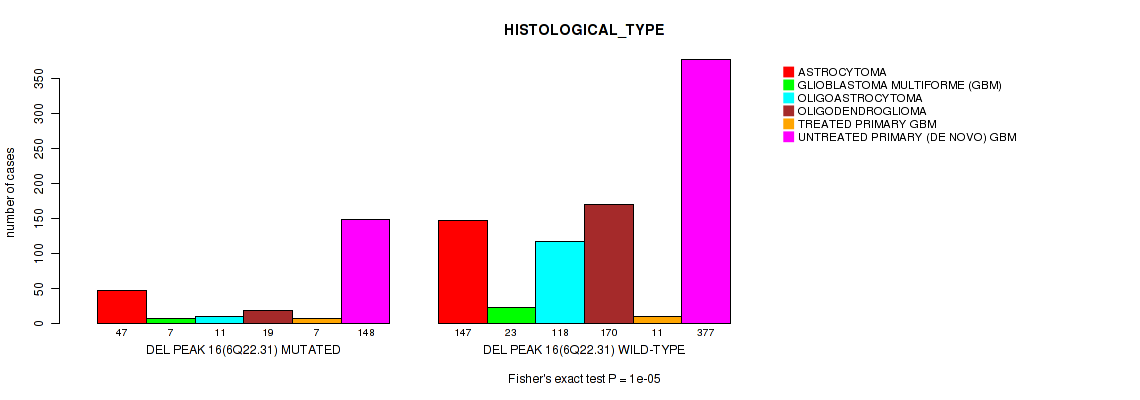
P value = 0.116 (Fisher's exact test), Q value = 0.2
Table S236. Gene #46: 'del_6q22.31' versus Clinical Feature #8: 'RACE'
| nPatients | AMERICAN INDIAN OR ALASKA NATIVE | ASIAN | BLACK OR AFRICAN AMERICAN | WHITE |
|---|---|---|---|---|
| ALL | 1 | 21 | 71 | 959 |
| DEL PEAK 16(6Q22.31) MUTATED | 1 | 6 | 20 | 205 |
| DEL PEAK 16(6Q22.31) WILD-TYPE | 0 | 15 | 51 | 754 |
Figure S236. Get High-res Image Gene #46: 'del_6q22.31' versus Clinical Feature #8: 'RACE'

P value = 0.0947 (Fisher's exact test), Q value = 0.17
Table S237. Gene #46: 'del_6q22.31' versus Clinical Feature #9: 'ETHNICITY'
| nPatients | HISPANIC OR LATINO | NOT HISPANIC OR LATINO |
|---|---|---|
| ALL | 44 | 921 |
| DEL PEAK 16(6Q22.31) MUTATED | 5 | 204 |
| DEL PEAK 16(6Q22.31) WILD-TYPE | 39 | 717 |
Figure S237. Get High-res Image Gene #46: 'del_6q22.31' versus Clinical Feature #9: 'ETHNICITY'
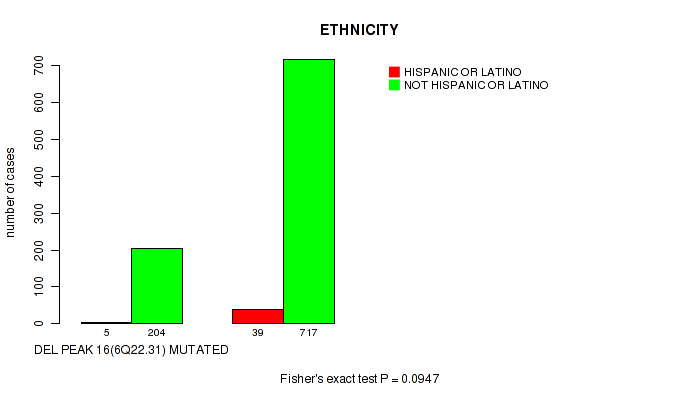
P value = 5.75e-12 (logrank test), Q value = 4.9e-11
Table S238. Gene #47: 'del_6q26' versus Clinical Feature #1: 'Time to Death'
| nPatients | nDeath | Duration Range (Median), Month | |
|---|---|---|---|
| ALL | 1078 | 598 | 0.0 - 211.2 (16.0) |
| DEL PEAK 17(6Q26) MUTATED | 258 | 181 | 0.0 - 145.1 (13.9) |
| DEL PEAK 17(6Q26) WILD-TYPE | 820 | 417 | 0.1 - 211.2 (17.2) |
Figure S238. Get High-res Image Gene #47: 'del_6q26' versus Clinical Feature #1: 'Time to Death'

P value = 0.00012 (Wilcoxon-test), Q value = 4e-04
Table S239. Gene #47: 'del_6q26' versus Clinical Feature #2: 'YEARS_TO_BIRTH'
| nPatients | Mean (Std.Dev) | |
|---|---|---|
| ALL | 1084 | 50.8 (15.8) |
| DEL PEAK 17(6Q26) MUTATED | 260 | 54.0 (14.9) |
| DEL PEAK 17(6Q26) WILD-TYPE | 824 | 49.8 (15.9) |
Figure S239. Get High-res Image Gene #47: 'del_6q26' versus Clinical Feature #2: 'YEARS_TO_BIRTH'
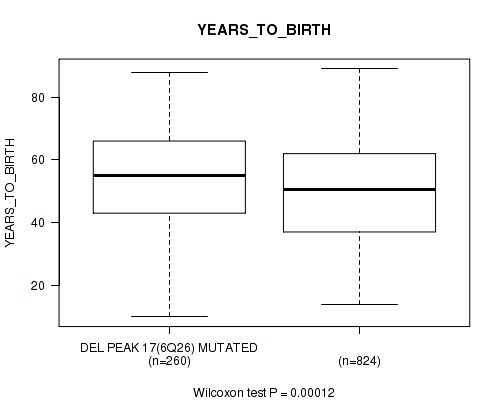
P value = 2.66e-09 (Fisher's exact test), Q value = 1.7e-08
Table S240. Gene #47: 'del_6q26' versus Clinical Feature #3: 'TUMOR_TISSUE_SITE'
| nPatients | BRAIN | CENTRAL NERVOUS SYSTEM |
|---|---|---|
| ALL | 573 | 512 |
| DEL PEAK 17(6Q26) MUTATED | 179 | 81 |
| DEL PEAK 17(6Q26) WILD-TYPE | 394 | 431 |
Figure S240. Get High-res Image Gene #47: 'del_6q26' versus Clinical Feature #3: 'TUMOR_TISSUE_SITE'
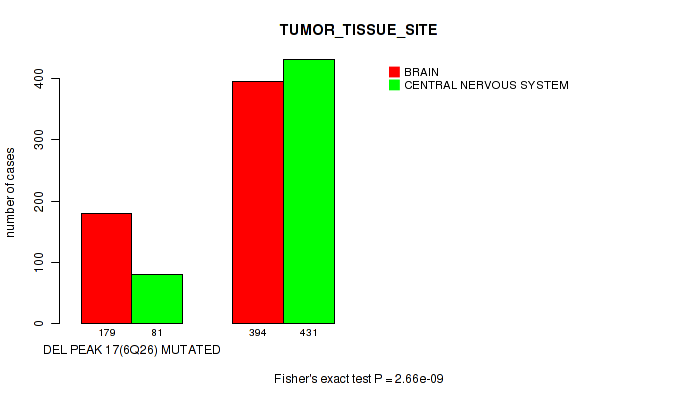
P value = 0.00228 (Fisher's exact test), Q value = 0.0065
Table S241. Gene #47: 'del_6q26' versus Clinical Feature #5: 'RADIATION_THERAPY'
| nPatients | NO | YES |
|---|---|---|
| ALL | 258 | 770 |
| DEL PEAK 17(6Q26) MUTATED | 43 | 199 |
| DEL PEAK 17(6Q26) WILD-TYPE | 215 | 571 |
Figure S241. Get High-res Image Gene #47: 'del_6q26' versus Clinical Feature #5: 'RADIATION_THERAPY'

P value = 0.00302 (Wilcoxon-test), Q value = 0.0084
Table S242. Gene #47: 'del_6q26' versus Clinical Feature #6: 'KARNOFSKY_PERFORMANCE_SCORE'
| nPatients | Mean (Std.Dev) | |
|---|---|---|
| ALL | 732 | 81.1 (15.3) |
| DEL PEAK 17(6Q26) MUTATED | 187 | 78.7 (15.5) |
| DEL PEAK 17(6Q26) WILD-TYPE | 545 | 81.9 (15.1) |
Figure S242. Get High-res Image Gene #47: 'del_6q26' versus Clinical Feature #6: 'KARNOFSKY_PERFORMANCE_SCORE'
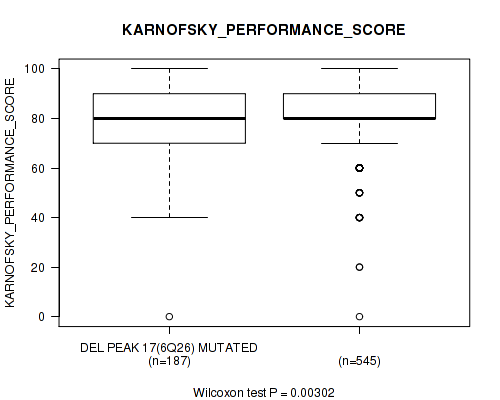
P value = 1e-05 (Fisher's exact test), Q value = 3.9e-05
Table S243. Gene #47: 'del_6q26' versus Clinical Feature #7: 'HISTOLOGICAL_TYPE'
| nPatients | ASTROCYTOMA | GLIOBLASTOMA MULTIFORME (GBM) | OLIGOASTROCYTOMA | OLIGODENDROGLIOMA | TREATED PRIMARY GBM | UNTREATED PRIMARY (DE NOVO) GBM |
|---|---|---|---|---|---|---|
| ALL | 194 | 30 | 129 | 189 | 18 | 525 |
| DEL PEAK 17(6Q26) MUTATED | 48 | 8 | 12 | 21 | 9 | 162 |
| DEL PEAK 17(6Q26) WILD-TYPE | 146 | 22 | 117 | 168 | 9 | 363 |
Figure S243. Get High-res Image Gene #47: 'del_6q26' versus Clinical Feature #7: 'HISTOLOGICAL_TYPE'
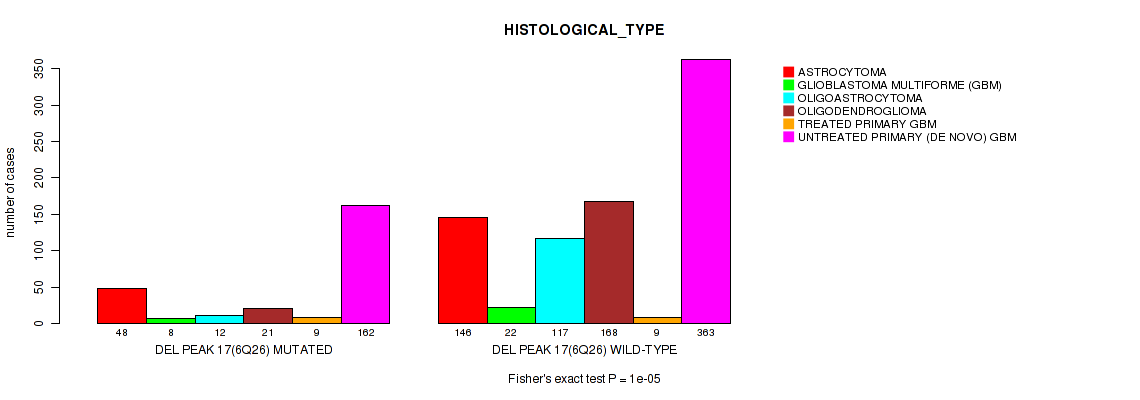
P value = 5.96e-05 (logrank test), Q value = 0.00021
Table S244. Gene #48: 'del_8p23.2' versus Clinical Feature #1: 'Time to Death'
| nPatients | nDeath | Duration Range (Median), Month | |
|---|---|---|---|
| ALL | 1078 | 598 | 0.0 - 211.2 (16.0) |
| DEL PEAK 18(8P23.2) MUTATED | 87 | 61 | 0.1 - 120.6 (13.1) |
| DEL PEAK 18(8P23.2) WILD-TYPE | 991 | 537 | 0.0 - 211.2 (16.4) |
Figure S244. Get High-res Image Gene #48: 'del_8p23.2' versus Clinical Feature #1: 'Time to Death'
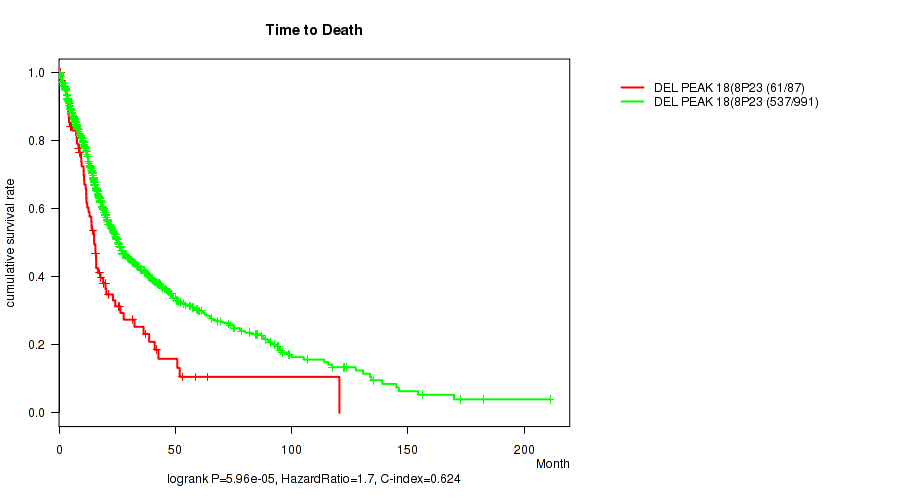
P value = 6.92e-05 (Wilcoxon-test), Q value = 0.00024
Table S245. Gene #48: 'del_8p23.2' versus Clinical Feature #2: 'YEARS_TO_BIRTH'
| nPatients | Mean (Std.Dev) | |
|---|---|---|
| ALL | 1084 | 50.8 (15.8) |
| DEL PEAK 18(8P23.2) MUTATED | 88 | 57.1 (14.5) |
| DEL PEAK 18(8P23.2) WILD-TYPE | 996 | 50.3 (15.8) |
Figure S245. Get High-res Image Gene #48: 'del_8p23.2' versus Clinical Feature #2: 'YEARS_TO_BIRTH'
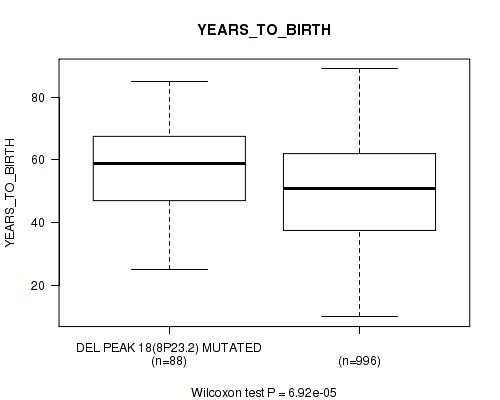
P value = 1.09e-05 (Fisher's exact test), Q value = 4.2e-05
Table S246. Gene #48: 'del_8p23.2' versus Clinical Feature #3: 'TUMOR_TISSUE_SITE'
| nPatients | BRAIN | CENTRAL NERVOUS SYSTEM |
|---|---|---|
| ALL | 573 | 512 |
| DEL PEAK 18(8P23.2) MUTATED | 66 | 22 |
| DEL PEAK 18(8P23.2) WILD-TYPE | 507 | 490 |
Figure S246. Get High-res Image Gene #48: 'del_8p23.2' versus Clinical Feature #3: 'TUMOR_TISSUE_SITE'
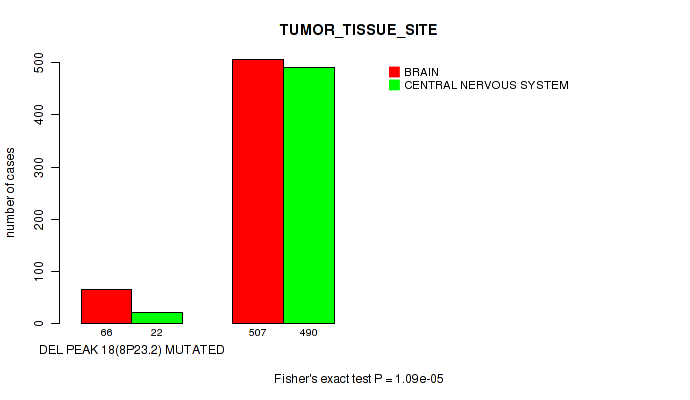
P value = 0.0111 (Fisher's exact test), Q value = 0.026
Table S247. Gene #48: 'del_8p23.2' versus Clinical Feature #5: 'RADIATION_THERAPY'
| nPatients | NO | YES |
|---|---|---|
| ALL | 258 | 770 |
| DEL PEAK 18(8P23.2) MUTATED | 11 | 71 |
| DEL PEAK 18(8P23.2) WILD-TYPE | 247 | 699 |
Figure S247. Get High-res Image Gene #48: 'del_8p23.2' versus Clinical Feature #5: 'RADIATION_THERAPY'
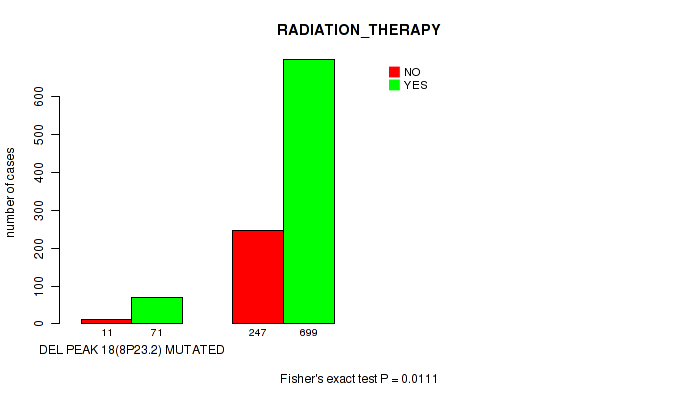
P value = 0.00014 (Fisher's exact test), Q value = 0.00047
Table S248. Gene #48: 'del_8p23.2' versus Clinical Feature #7: 'HISTOLOGICAL_TYPE'
| nPatients | ASTROCYTOMA | GLIOBLASTOMA MULTIFORME (GBM) | OLIGOASTROCYTOMA | OLIGODENDROGLIOMA | TREATED PRIMARY GBM | UNTREATED PRIMARY (DE NOVO) GBM |
|---|---|---|---|---|---|---|
| ALL | 194 | 30 | 129 | 189 | 18 | 525 |
| DEL PEAK 18(8P23.2) MUTATED | 13 | 3 | 5 | 4 | 1 | 62 |
| DEL PEAK 18(8P23.2) WILD-TYPE | 181 | 27 | 124 | 185 | 17 | 463 |
Figure S248. Get High-res Image Gene #48: 'del_8p23.2' versus Clinical Feature #7: 'HISTOLOGICAL_TYPE'

P value = 0.0146 (Fisher's exact test), Q value = 0.034
Table S249. Gene #48: 'del_8p23.2' versus Clinical Feature #8: 'RACE'
| nPatients | AMERICAN INDIAN OR ALASKA NATIVE | ASIAN | BLACK OR AFRICAN AMERICAN | WHITE |
|---|---|---|---|---|
| ALL | 1 | 21 | 71 | 959 |
| DEL PEAK 18(8P23.2) MUTATED | 0 | 6 | 6 | 72 |
| DEL PEAK 18(8P23.2) WILD-TYPE | 1 | 15 | 65 | 887 |
Figure S249. Get High-res Image Gene #48: 'del_8p23.2' versus Clinical Feature #8: 'RACE'

P value = 0.0117 (logrank test), Q value = 0.028
Table S250. Gene #49: 'del_8q24.3' versus Clinical Feature #1: 'Time to Death'
| nPatients | nDeath | Duration Range (Median), Month | |
|---|---|---|---|
| ALL | 1078 | 598 | 0.0 - 211.2 (16.0) |
| DEL PEAK 19(8Q24.3) MUTATED | 78 | 49 | 0.2 - 82.6 (14.3) |
| DEL PEAK 19(8Q24.3) WILD-TYPE | 1000 | 549 | 0.0 - 211.2 (16.2) |
Figure S250. Get High-res Image Gene #49: 'del_8q24.3' versus Clinical Feature #1: 'Time to Death'
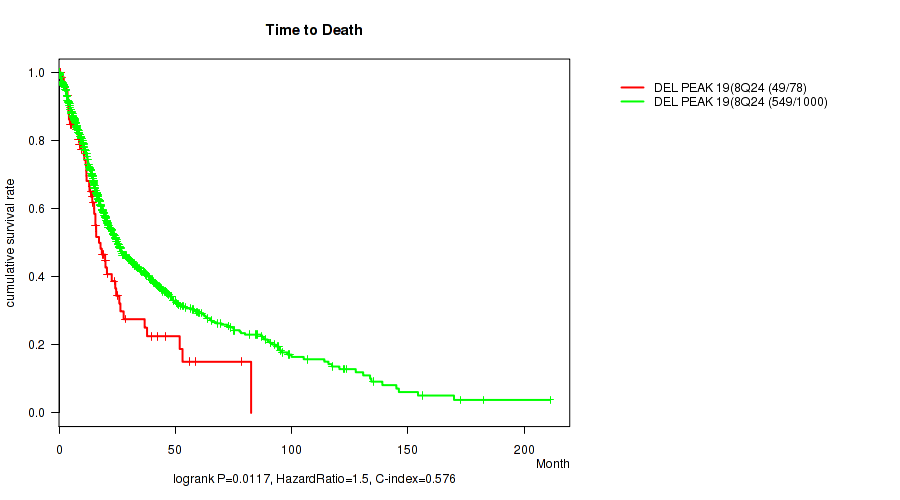
P value = 0.0249 (Fisher's exact test), Q value = 0.054
Table S251. Gene #49: 'del_8q24.3' versus Clinical Feature #3: 'TUMOR_TISSUE_SITE'
| nPatients | BRAIN | CENTRAL NERVOUS SYSTEM |
|---|---|---|
| ALL | 573 | 512 |
| DEL PEAK 19(8Q24.3) MUTATED | 51 | 27 |
| DEL PEAK 19(8Q24.3) WILD-TYPE | 522 | 485 |
Figure S251. Get High-res Image Gene #49: 'del_8q24.3' versus Clinical Feature #3: 'TUMOR_TISSUE_SITE'
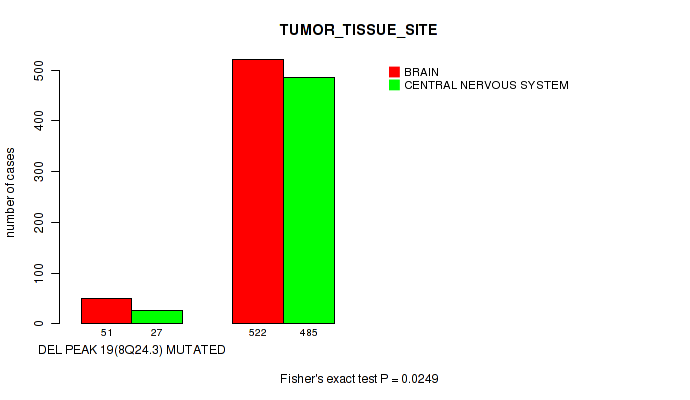
P value = 0.0128 (Fisher's exact test), Q value = 0.03
Table S252. Gene #49: 'del_8q24.3' versus Clinical Feature #5: 'RADIATION_THERAPY'
| nPatients | NO | YES |
|---|---|---|
| ALL | 258 | 770 |
| DEL PEAK 19(8Q24.3) MUTATED | 10 | 65 |
| DEL PEAK 19(8Q24.3) WILD-TYPE | 248 | 705 |
Figure S252. Get High-res Image Gene #49: 'del_8q24.3' versus Clinical Feature #5: 'RADIATION_THERAPY'
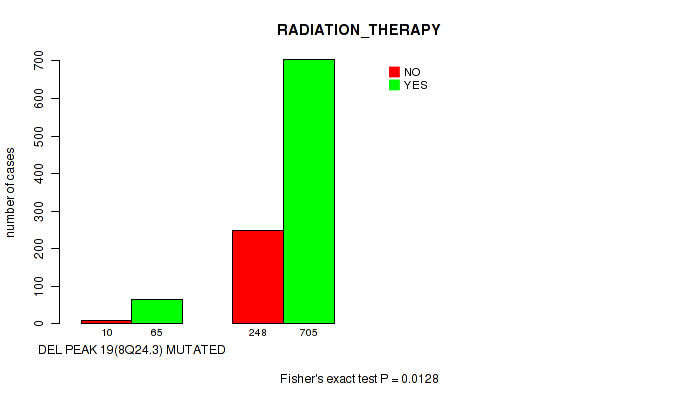
P value = 0.082 (Fisher's exact test), Q value = 0.15
Table S253. Gene #49: 'del_8q24.3' versus Clinical Feature #7: 'HISTOLOGICAL_TYPE'
| nPatients | ASTROCYTOMA | GLIOBLASTOMA MULTIFORME (GBM) | OLIGOASTROCYTOMA | OLIGODENDROGLIOMA | TREATED PRIMARY GBM | UNTREATED PRIMARY (DE NOVO) GBM |
|---|---|---|---|---|---|---|
| ALL | 194 | 30 | 129 | 189 | 18 | 525 |
| DEL PEAK 19(8Q24.3) MUTATED | 12 | 1 | 9 | 6 | 2 | 48 |
| DEL PEAK 19(8Q24.3) WILD-TYPE | 182 | 29 | 120 | 183 | 16 | 477 |
Figure S253. Get High-res Image Gene #49: 'del_8q24.3' versus Clinical Feature #7: 'HISTOLOGICAL_TYPE'

P value = 0 (logrank test), Q value = 0
Table S254. Gene #50: 'del_9p21.3' versus Clinical Feature #1: 'Time to Death'
| nPatients | nDeath | Duration Range (Median), Month | |
|---|---|---|---|
| ALL | 1078 | 598 | 0.0 - 211.2 (16.0) |
| DEL PEAK 20(9P21.3) MUTATED | 588 | 415 | 0.1 - 169.8 (13.8) |
| DEL PEAK 20(9P21.3) WILD-TYPE | 490 | 183 | 0.0 - 211.2 (19.3) |
Figure S254. Get High-res Image Gene #50: 'del_9p21.3' versus Clinical Feature #1: 'Time to Death'
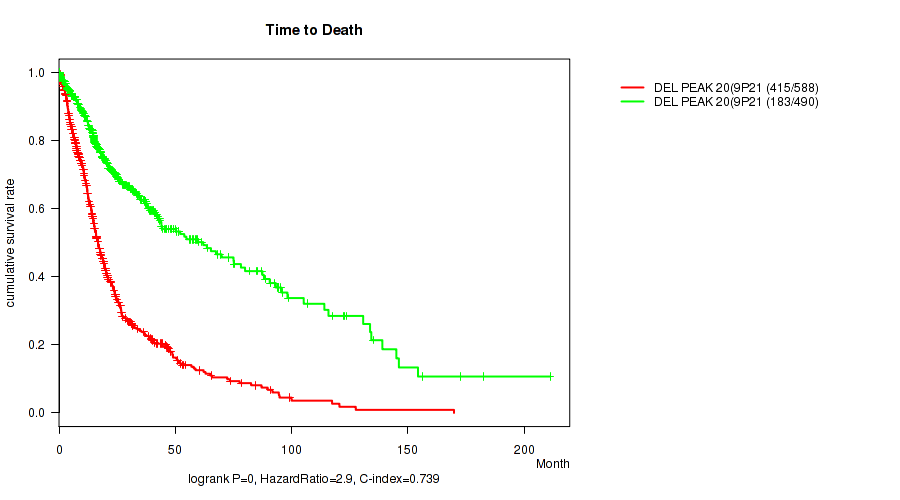
P value = 1.65e-30 (Wilcoxon-test), Q value = 2.9e-29
Table S255. Gene #50: 'del_9p21.3' versus Clinical Feature #2: 'YEARS_TO_BIRTH'
| nPatients | Mean (Std.Dev) | |
|---|---|---|
| ALL | 1084 | 50.8 (15.8) |
| DEL PEAK 20(9P21.3) MUTATED | 591 | 55.7 (14.8) |
| DEL PEAK 20(9P21.3) WILD-TYPE | 493 | 45.0 (14.9) |
Figure S255. Get High-res Image Gene #50: 'del_9p21.3' versus Clinical Feature #2: 'YEARS_TO_BIRTH'
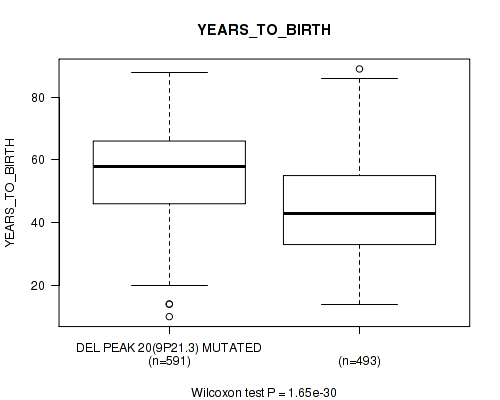
P value = 1.31e-38 (Fisher's exact test), Q value = 2.5e-37
Table S256. Gene #50: 'del_9p21.3' versus Clinical Feature #3: 'TUMOR_TISSUE_SITE'
| nPatients | BRAIN | CENTRAL NERVOUS SYSTEM |
|---|---|---|
| ALL | 573 | 512 |
| DEL PEAK 20(9P21.3) MUTATED | 418 | 174 |
| DEL PEAK 20(9P21.3) WILD-TYPE | 155 | 338 |
Figure S256. Get High-res Image Gene #50: 'del_9p21.3' versus Clinical Feature #3: 'TUMOR_TISSUE_SITE'
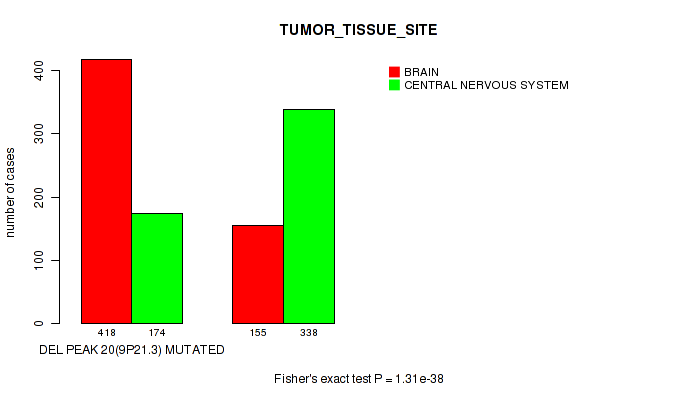
P value = 4.09e-10 (Fisher's exact test), Q value = 3e-09
Table S257. Gene #50: 'del_9p21.3' versus Clinical Feature #5: 'RADIATION_THERAPY'
| nPatients | NO | YES |
|---|---|---|
| ALL | 258 | 770 |
| DEL PEAK 20(9P21.3) MUTATED | 96 | 460 |
| DEL PEAK 20(9P21.3) WILD-TYPE | 162 | 310 |
Figure S257. Get High-res Image Gene #50: 'del_9p21.3' versus Clinical Feature #5: 'RADIATION_THERAPY'
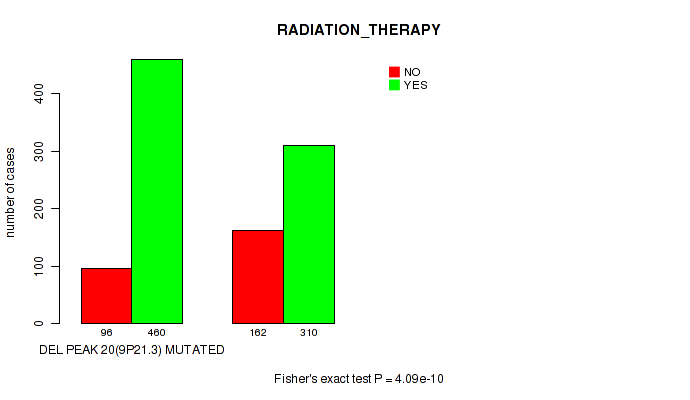
P value = 2.15e-13 (Wilcoxon-test), Q value = 2.1e-12
Table S258. Gene #50: 'del_9p21.3' versus Clinical Feature #6: 'KARNOFSKY_PERFORMANCE_SCORE'
| nPatients | Mean (Std.Dev) | |
|---|---|---|
| ALL | 732 | 81.1 (15.3) |
| DEL PEAK 20(9P21.3) MUTATED | 412 | 77.7 (15.9) |
| DEL PEAK 20(9P21.3) WILD-TYPE | 320 | 85.4 (13.3) |
Figure S258. Get High-res Image Gene #50: 'del_9p21.3' versus Clinical Feature #6: 'KARNOFSKY_PERFORMANCE_SCORE'
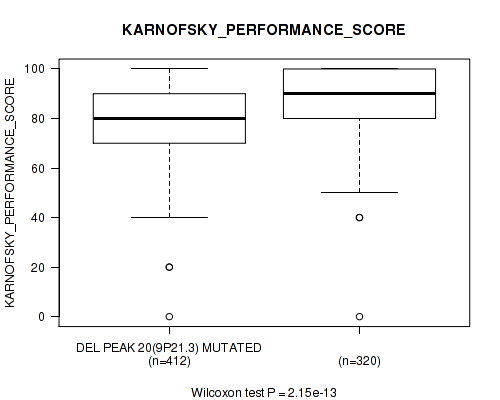
P value = 1e-05 (Fisher's exact test), Q value = 3.9e-05
Table S259. Gene #50: 'del_9p21.3' versus Clinical Feature #7: 'HISTOLOGICAL_TYPE'
| nPatients | ASTROCYTOMA | GLIOBLASTOMA MULTIFORME (GBM) | OLIGOASTROCYTOMA | OLIGODENDROGLIOMA | TREATED PRIMARY GBM | UNTREATED PRIMARY (DE NOVO) GBM |
|---|---|---|---|---|---|---|
| ALL | 194 | 30 | 129 | 189 | 18 | 525 |
| DEL PEAK 20(9P21.3) MUTATED | 85 | 22 | 36 | 53 | 15 | 381 |
| DEL PEAK 20(9P21.3) WILD-TYPE | 109 | 8 | 93 | 136 | 3 | 144 |
Figure S259. Get High-res Image Gene #50: 'del_9p21.3' versus Clinical Feature #7: 'HISTOLOGICAL_TYPE'
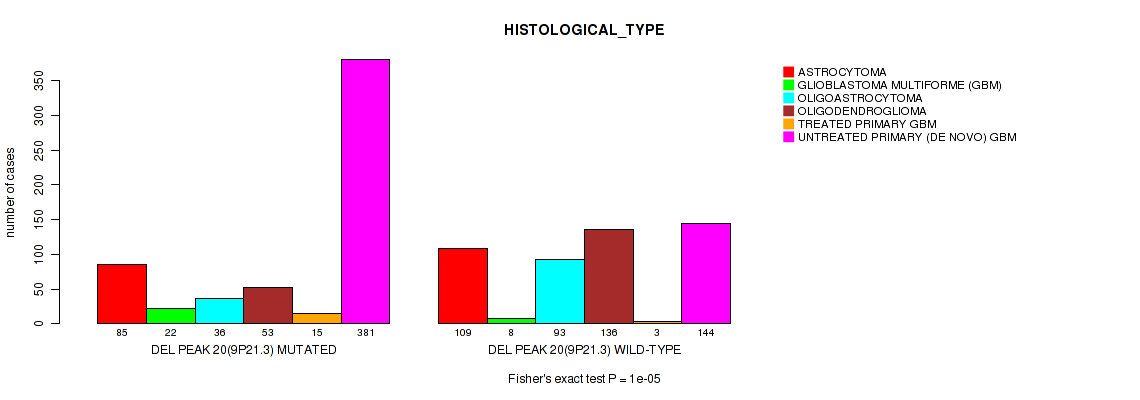
P value = 0.0155 (Fisher's exact test), Q value = 0.036
Table S260. Gene #50: 'del_9p21.3' versus Clinical Feature #8: 'RACE'
| nPatients | AMERICAN INDIAN OR ALASKA NATIVE | ASIAN | BLACK OR AFRICAN AMERICAN | WHITE |
|---|---|---|---|---|
| ALL | 1 | 21 | 71 | 959 |
| DEL PEAK 20(9P21.3) MUTATED | 0 | 12 | 50 | 511 |
| DEL PEAK 20(9P21.3) WILD-TYPE | 1 | 9 | 21 | 448 |
Figure S260. Get High-res Image Gene #50: 'del_9p21.3' versus Clinical Feature #8: 'RACE'
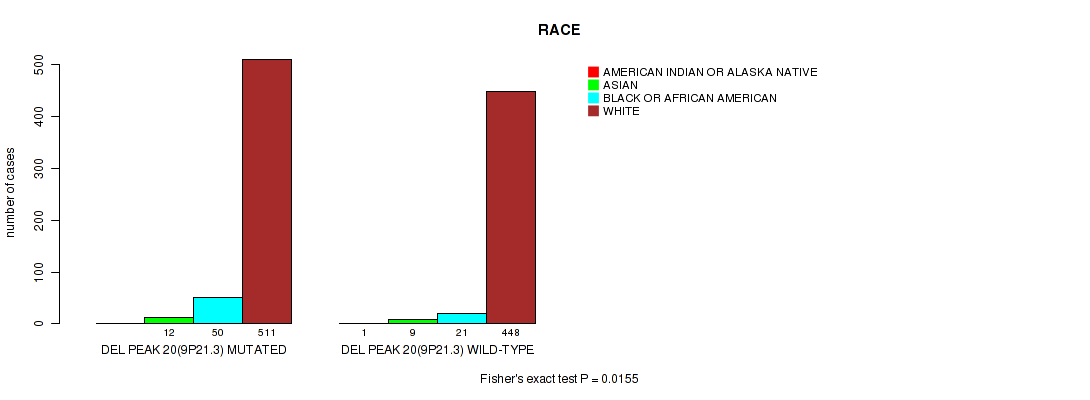
P value = 0.063 (Fisher's exact test), Q value = 0.12
Table S261. Gene #50: 'del_9p21.3' versus Clinical Feature #9: 'ETHNICITY'
| nPatients | HISPANIC OR LATINO | NOT HISPANIC OR LATINO |
|---|---|---|
| ALL | 44 | 921 |
| DEL PEAK 20(9P21.3) MUTATED | 17 | 494 |
| DEL PEAK 20(9P21.3) WILD-TYPE | 27 | 427 |
Figure S261. Get High-res Image Gene #50: 'del_9p21.3' versus Clinical Feature #9: 'ETHNICITY'
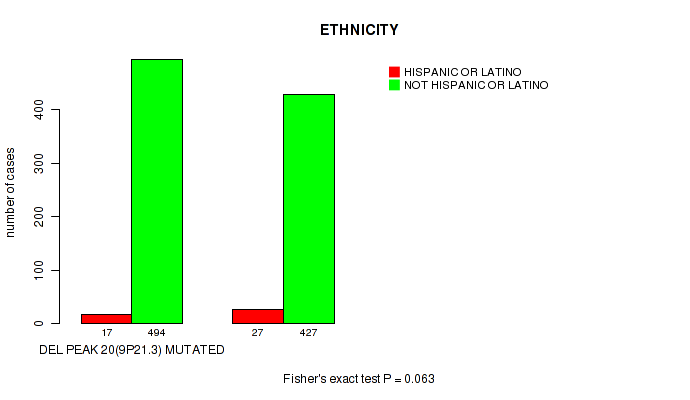
P value = 0 (logrank test), Q value = 0
Table S262. Gene #51: 'del_10p15.3' versus Clinical Feature #1: 'Time to Death'
| nPatients | nDeath | Duration Range (Median), Month | |
|---|---|---|---|
| ALL | 1078 | 598 | 0.0 - 211.2 (16.0) |
| DEL PEAK 21(10P15.3) MUTATED | 547 | 440 | 0.1 - 134.3 (12.4) |
| DEL PEAK 21(10P15.3) WILD-TYPE | 531 | 158 | 0.0 - 211.2 (22.5) |
Figure S262. Get High-res Image Gene #51: 'del_10p15.3' versus Clinical Feature #1: 'Time to Death'
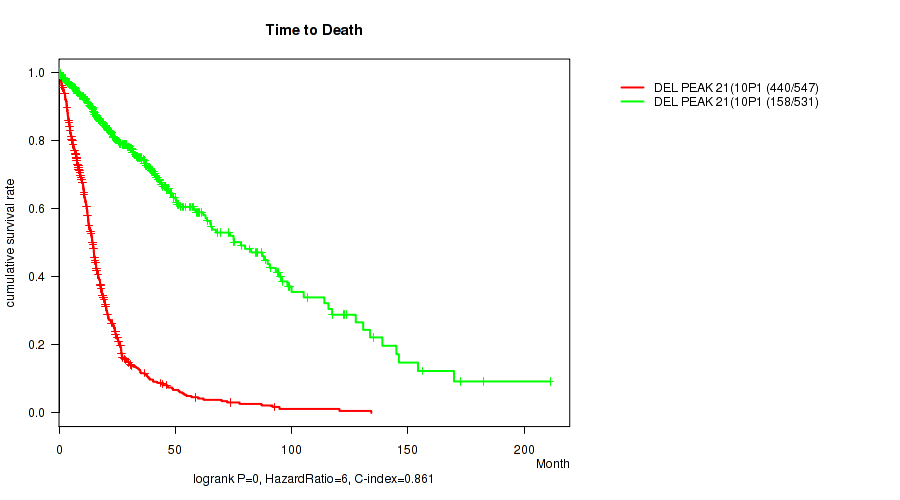
P value = 9.83e-72 (Wilcoxon-test), Q value = 2.8e-70
Table S263. Gene #51: 'del_10p15.3' versus Clinical Feature #2: 'YEARS_TO_BIRTH'
| nPatients | Mean (Std.Dev) | |
|---|---|---|
| ALL | 1084 | 50.8 (15.8) |
| DEL PEAK 21(10P15.3) MUTATED | 549 | 59.2 (12.4) |
| DEL PEAK 21(10P15.3) WILD-TYPE | 535 | 42.2 (14.2) |
Figure S263. Get High-res Image Gene #51: 'del_10p15.3' versus Clinical Feature #2: 'YEARS_TO_BIRTH'
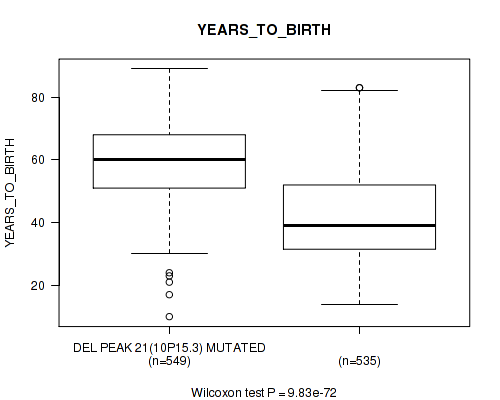
P value = 9.83e-110 (Fisher's exact test), Q value = 3.7e-108
Table S264. Gene #51: 'del_10p15.3' versus Clinical Feature #3: 'TUMOR_TISSUE_SITE'
| nPatients | BRAIN | CENTRAL NERVOUS SYSTEM |
|---|---|---|
| ALL | 573 | 512 |
| DEL PEAK 21(10P15.3) MUTATED | 466 | 83 |
| DEL PEAK 21(10P15.3) WILD-TYPE | 107 | 429 |
Figure S264. Get High-res Image Gene #51: 'del_10p15.3' versus Clinical Feature #3: 'TUMOR_TISSUE_SITE'
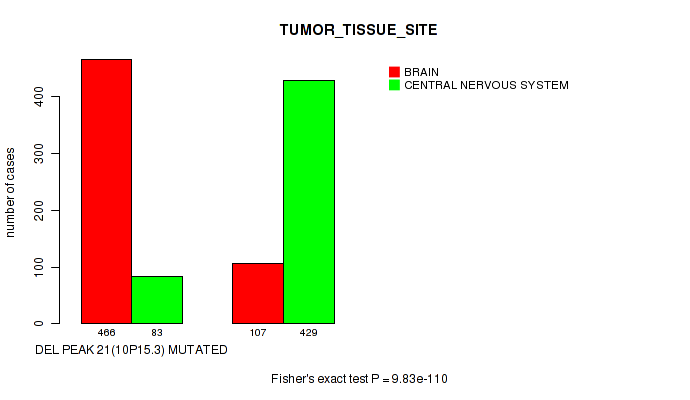
P value = 0.0649 (Fisher's exact test), Q value = 0.12
Table S265. Gene #51: 'del_10p15.3' versus Clinical Feature #4: 'GENDER'
| nPatients | FEMALE | MALE |
|---|---|---|
| ALL | 453 | 632 |
| DEL PEAK 21(10P15.3) MUTATED | 214 | 335 |
| DEL PEAK 21(10P15.3) WILD-TYPE | 239 | 297 |
Figure S265. Get High-res Image Gene #51: 'del_10p15.3' versus Clinical Feature #4: 'GENDER'
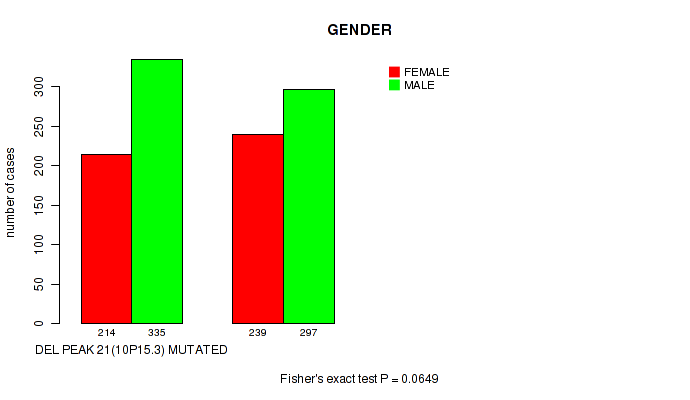
P value = 1.13e-15 (Fisher's exact test), Q value = 1.4e-14
Table S266. Gene #51: 'del_10p15.3' versus Clinical Feature #5: 'RADIATION_THERAPY'
| nPatients | NO | YES |
|---|---|---|
| ALL | 258 | 770 |
| DEL PEAK 21(10P15.3) MUTATED | 75 | 445 |
| DEL PEAK 21(10P15.3) WILD-TYPE | 183 | 325 |
Figure S266. Get High-res Image Gene #51: 'del_10p15.3' versus Clinical Feature #5: 'RADIATION_THERAPY'

P value = 2.81e-18 (Wilcoxon-test), Q value = 4.2e-17
Table S267. Gene #51: 'del_10p15.3' versus Clinical Feature #6: 'KARNOFSKY_PERFORMANCE_SCORE'
| nPatients | Mean (Std.Dev) | |
|---|---|---|
| ALL | 732 | 81.1 (15.3) |
| DEL PEAK 21(10P15.3) MUTATED | 400 | 77.0 (16.2) |
| DEL PEAK 21(10P15.3) WILD-TYPE | 332 | 86.0 (12.5) |
Figure S267. Get High-res Image Gene #51: 'del_10p15.3' versus Clinical Feature #6: 'KARNOFSKY_PERFORMANCE_SCORE'

P value = 1e-05 (Fisher's exact test), Q value = 3.9e-05
Table S268. Gene #51: 'del_10p15.3' versus Clinical Feature #7: 'HISTOLOGICAL_TYPE'
| nPatients | ASTROCYTOMA | GLIOBLASTOMA MULTIFORME (GBM) | OLIGOASTROCYTOMA | OLIGODENDROGLIOMA | TREATED PRIMARY GBM | UNTREATED PRIMARY (DE NOVO) GBM |
|---|---|---|---|---|---|---|
| ALL | 194 | 30 | 129 | 189 | 18 | 525 |
| DEL PEAK 21(10P15.3) MUTATED | 50 | 22 | 15 | 18 | 11 | 433 |
| DEL PEAK 21(10P15.3) WILD-TYPE | 144 | 8 | 114 | 171 | 7 | 92 |
Figure S268. Get High-res Image Gene #51: 'del_10p15.3' versus Clinical Feature #7: 'HISTOLOGICAL_TYPE'
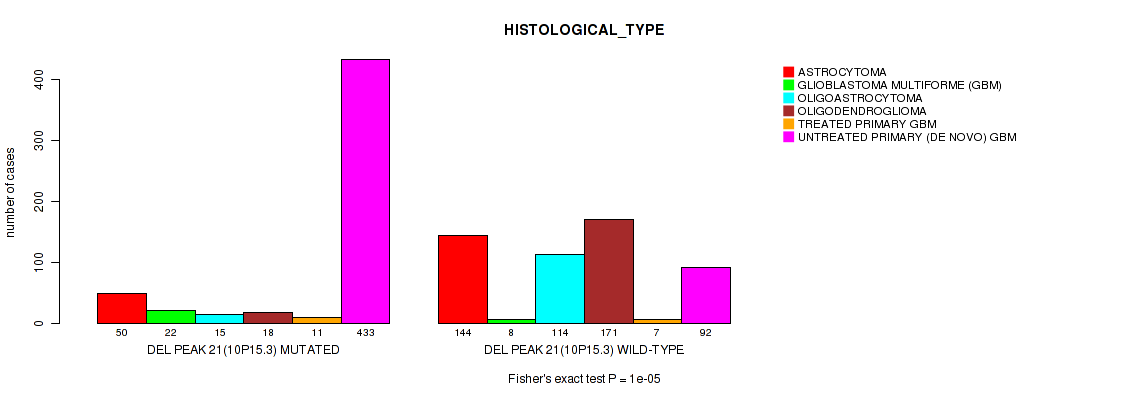
P value = 0.00725 (Fisher's exact test), Q value = 0.018
Table S269. Gene #51: 'del_10p15.3' versus Clinical Feature #8: 'RACE'
| nPatients | AMERICAN INDIAN OR ALASKA NATIVE | ASIAN | BLACK OR AFRICAN AMERICAN | WHITE |
|---|---|---|---|---|
| ALL | 1 | 21 | 71 | 959 |
| DEL PEAK 21(10P15.3) MUTATED | 1 | 9 | 48 | 470 |
| DEL PEAK 21(10P15.3) WILD-TYPE | 0 | 12 | 23 | 489 |
Figure S269. Get High-res Image Gene #51: 'del_10p15.3' versus Clinical Feature #8: 'RACE'

P value = 0.00497 (Fisher's exact test), Q value = 0.013
Table S270. Gene #51: 'del_10p15.3' versus Clinical Feature #9: 'ETHNICITY'
| nPatients | HISPANIC OR LATINO | NOT HISPANIC OR LATINO |
|---|---|---|
| ALL | 44 | 921 |
| DEL PEAK 21(10P15.3) MUTATED | 12 | 455 |
| DEL PEAK 21(10P15.3) WILD-TYPE | 32 | 466 |
Figure S270. Get High-res Image Gene #51: 'del_10p15.3' versus Clinical Feature #9: 'ETHNICITY'
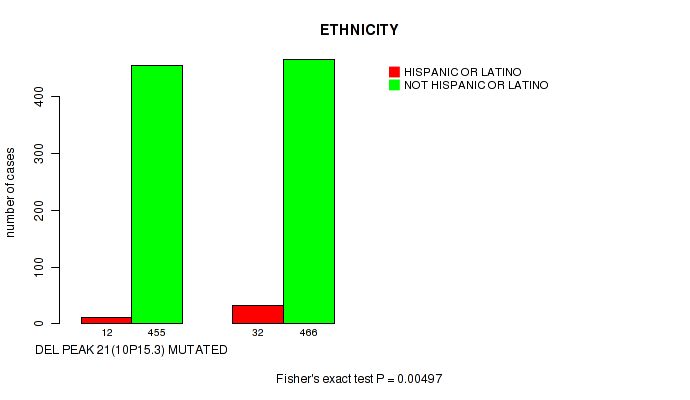
P value = 0 (logrank test), Q value = 0
Table S271. Gene #52: 'del_10p13' versus Clinical Feature #1: 'Time to Death'
| nPatients | nDeath | Duration Range (Median), Month | |
|---|---|---|---|
| ALL | 1078 | 598 | 0.0 - 211.2 (16.0) |
| DEL PEAK 22(10P13) MUTATED | 547 | 443 | 0.1 - 134.3 (12.5) |
| DEL PEAK 22(10P13) WILD-TYPE | 531 | 155 | 0.0 - 211.2 (22.6) |
Figure S271. Get High-res Image Gene #52: 'del_10p13' versus Clinical Feature #1: 'Time to Death'
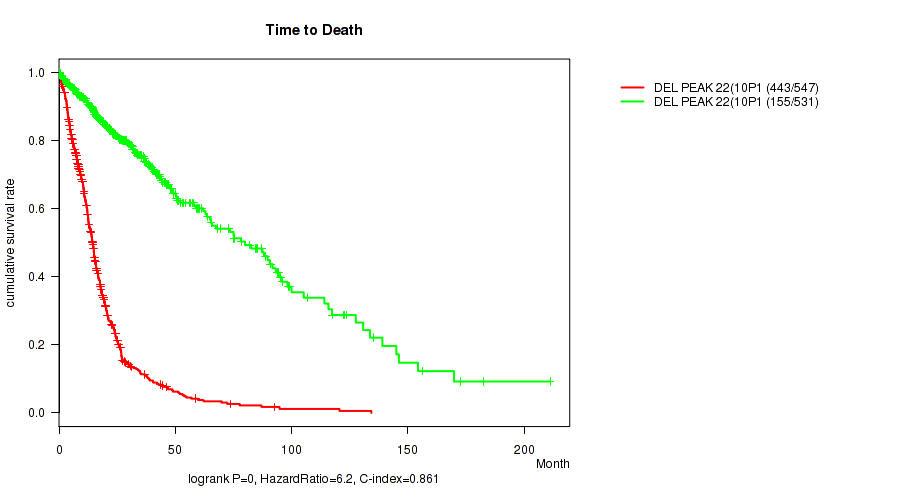
P value = 6.25e-72 (Wilcoxon-test), Q value = 1.8e-70
Table S272. Gene #52: 'del_10p13' versus Clinical Feature #2: 'YEARS_TO_BIRTH'
| nPatients | Mean (Std.Dev) | |
|---|---|---|
| ALL | 1084 | 50.8 (15.8) |
| DEL PEAK 22(10P13) MUTATED | 549 | 59.2 (12.3) |
| DEL PEAK 22(10P13) WILD-TYPE | 535 | 42.2 (14.4) |
Figure S272. Get High-res Image Gene #52: 'del_10p13' versus Clinical Feature #2: 'YEARS_TO_BIRTH'
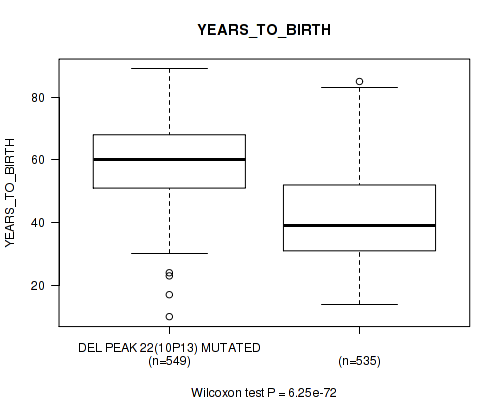
P value = 4.32e-111 (Fisher's exact test), Q value = 1.7e-109
Table S273. Gene #52: 'del_10p13' versus Clinical Feature #3: 'TUMOR_TISSUE_SITE'
| nPatients | BRAIN | CENTRAL NERVOUS SYSTEM |
|---|---|---|
| ALL | 573 | 512 |
| DEL PEAK 22(10P13) MUTATED | 467 | 82 |
| DEL PEAK 22(10P13) WILD-TYPE | 106 | 430 |
Figure S273. Get High-res Image Gene #52: 'del_10p13' versus Clinical Feature #3: 'TUMOR_TISSUE_SITE'

P value = 0.0267 (Fisher's exact test), Q value = 0.057
Table S274. Gene #52: 'del_10p13' versus Clinical Feature #4: 'GENDER'
| nPatients | FEMALE | MALE |
|---|---|---|
| ALL | 453 | 632 |
| DEL PEAK 22(10P13) MUTATED | 211 | 338 |
| DEL PEAK 22(10P13) WILD-TYPE | 242 | 294 |
Figure S274. Get High-res Image Gene #52: 'del_10p13' versus Clinical Feature #4: 'GENDER'
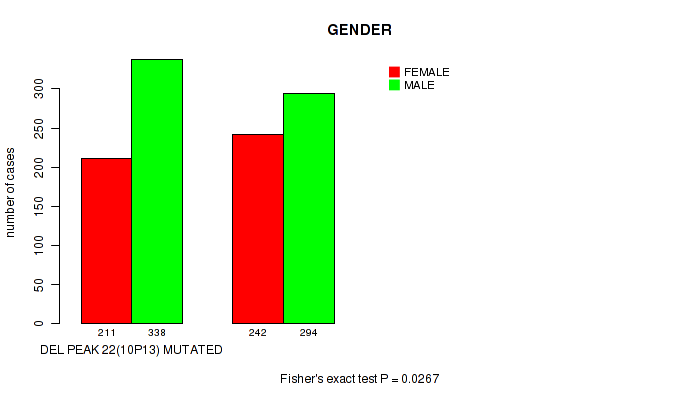
P value = 9.5e-17 (Fisher's exact test), Q value = 1.4e-15
Table S275. Gene #52: 'del_10p13' versus Clinical Feature #5: 'RADIATION_THERAPY'
| nPatients | NO | YES |
|---|---|---|
| ALL | 258 | 770 |
| DEL PEAK 22(10P13) MUTATED | 73 | 447 |
| DEL PEAK 22(10P13) WILD-TYPE | 185 | 323 |
Figure S275. Get High-res Image Gene #52: 'del_10p13' versus Clinical Feature #5: 'RADIATION_THERAPY'
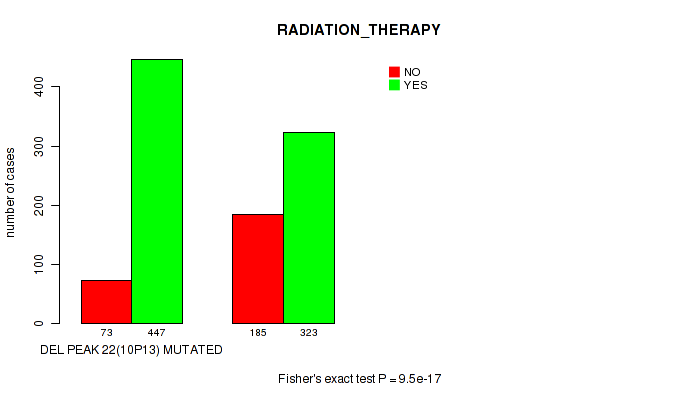
P value = 1.11e-16 (Wilcoxon-test), Q value = 1.6e-15
Table S276. Gene #52: 'del_10p13' versus Clinical Feature #6: 'KARNOFSKY_PERFORMANCE_SCORE'
| nPatients | Mean (Std.Dev) | |
|---|---|---|
| ALL | 732 | 81.1 (15.3) |
| DEL PEAK 22(10P13) MUTATED | 401 | 77.2 (16.2) |
| DEL PEAK 22(10P13) WILD-TYPE | 331 | 85.8 (12.6) |
Figure S276. Get High-res Image Gene #52: 'del_10p13' versus Clinical Feature #6: 'KARNOFSKY_PERFORMANCE_SCORE'
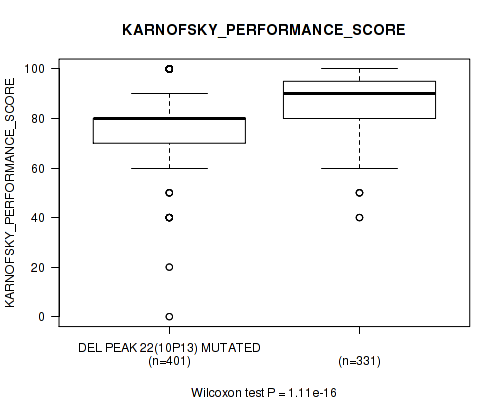
P value = 1e-05 (Fisher's exact test), Q value = 3.9e-05
Table S277. Gene #52: 'del_10p13' versus Clinical Feature #7: 'HISTOLOGICAL_TYPE'
| nPatients | ASTROCYTOMA | GLIOBLASTOMA MULTIFORME (GBM) | OLIGOASTROCYTOMA | OLIGODENDROGLIOMA | TREATED PRIMARY GBM | UNTREATED PRIMARY (DE NOVO) GBM |
|---|---|---|---|---|---|---|
| ALL | 194 | 30 | 129 | 189 | 18 | 525 |
| DEL PEAK 22(10P13) MUTATED | 50 | 21 | 15 | 17 | 11 | 435 |
| DEL PEAK 22(10P13) WILD-TYPE | 144 | 9 | 114 | 172 | 7 | 90 |
Figure S277. Get High-res Image Gene #52: 'del_10p13' versus Clinical Feature #7: 'HISTOLOGICAL_TYPE'
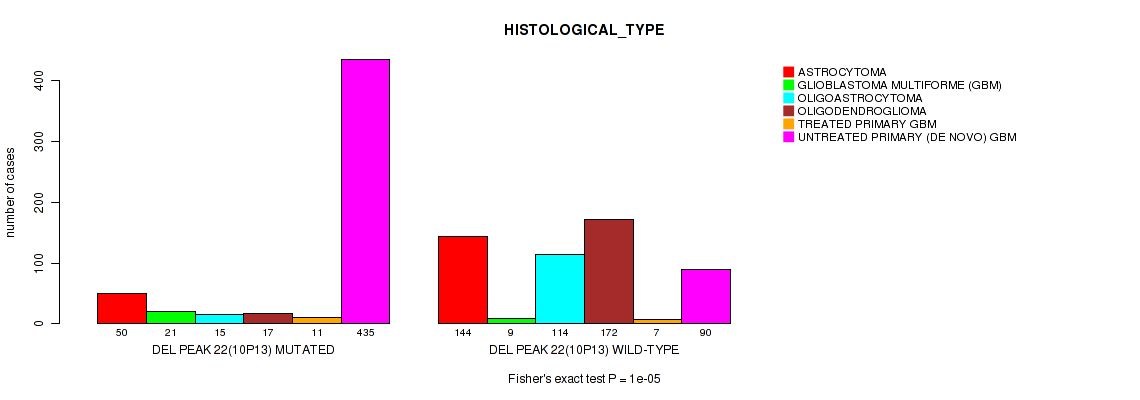
P value = 0.0168 (Fisher's exact test), Q value = 0.039
Table S278. Gene #52: 'del_10p13' versus Clinical Feature #8: 'RACE'
| nPatients | AMERICAN INDIAN OR ALASKA NATIVE | ASIAN | BLACK OR AFRICAN AMERICAN | WHITE |
|---|---|---|---|---|
| ALL | 1 | 21 | 71 | 959 |
| DEL PEAK 22(10P13) MUTATED | 1 | 9 | 47 | 471 |
| DEL PEAK 22(10P13) WILD-TYPE | 0 | 12 | 24 | 488 |
Figure S278. Get High-res Image Gene #52: 'del_10p13' versus Clinical Feature #8: 'RACE'
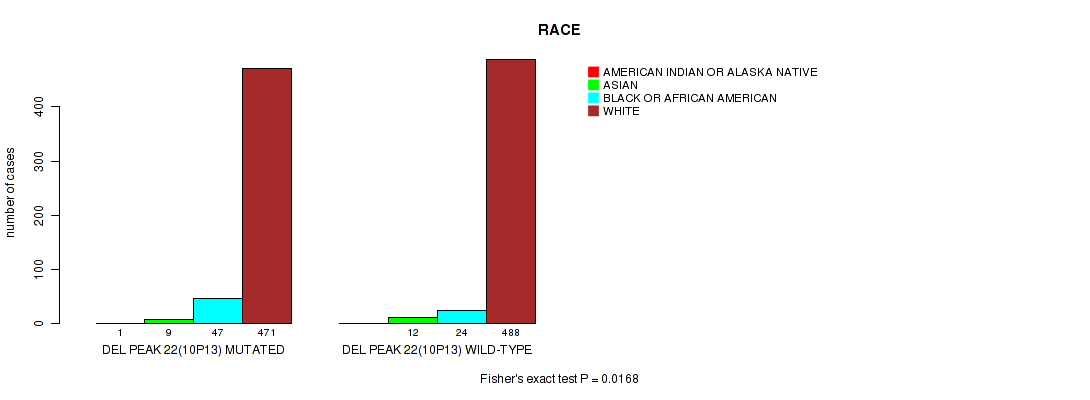
P value = 0.00497 (Fisher's exact test), Q value = 0.013
Table S279. Gene #52: 'del_10p13' versus Clinical Feature #9: 'ETHNICITY'
| nPatients | HISPANIC OR LATINO | NOT HISPANIC OR LATINO |
|---|---|---|
| ALL | 44 | 921 |
| DEL PEAK 22(10P13) MUTATED | 12 | 455 |
| DEL PEAK 22(10P13) WILD-TYPE | 32 | 466 |
Figure S279. Get High-res Image Gene #52: 'del_10p13' versus Clinical Feature #9: 'ETHNICITY'

P value = 0 (logrank test), Q value = 0
Table S280. Gene #53: 'del_10q23.31' versus Clinical Feature #1: 'Time to Death'
| nPatients | nDeath | Duration Range (Median), Month | |
|---|---|---|---|
| ALL | 1078 | 598 | 0.0 - 211.2 (16.0) |
| DEL PEAK 23(10Q23.31) MUTATED | 621 | 488 | 0.1 - 156.2 (12.7) |
| DEL PEAK 23(10Q23.31) WILD-TYPE | 457 | 110 | 0.0 - 211.2 (24.6) |
Figure S280. Get High-res Image Gene #53: 'del_10q23.31' versus Clinical Feature #1: 'Time to Death'
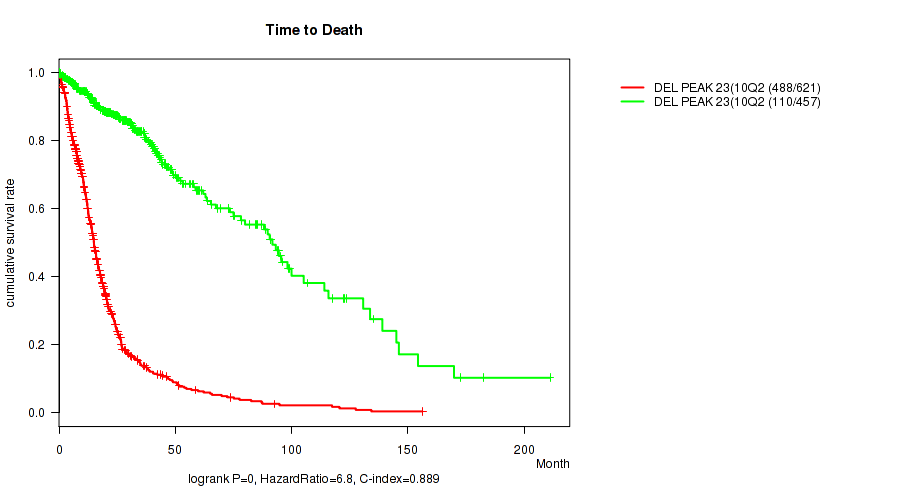
P value = 4.02e-64 (Wilcoxon-test), Q value = 1e-62
Table S281. Gene #53: 'del_10q23.31' versus Clinical Feature #2: 'YEARS_TO_BIRTH'
| nPatients | Mean (Std.Dev) | |
|---|---|---|
| ALL | 1084 | 50.8 (15.8) |
| DEL PEAK 23(10Q23.31) MUTATED | 624 | 57.7 (13.6) |
| DEL PEAK 23(10Q23.31) WILD-TYPE | 460 | 41.5 (13.7) |
Figure S281. Get High-res Image Gene #53: 'del_10q23.31' versus Clinical Feature #2: 'YEARS_TO_BIRTH'

P value = 7.82e-119 (Fisher's exact test), Q value = 3.3e-117
Table S282. Gene #53: 'del_10q23.31' versus Clinical Feature #3: 'TUMOR_TISSUE_SITE'
| nPatients | BRAIN | CENTRAL NERVOUS SYSTEM |
|---|---|---|
| ALL | 573 | 512 |
| DEL PEAK 23(10Q23.31) MUTATED | 510 | 114 |
| DEL PEAK 23(10Q23.31) WILD-TYPE | 63 | 398 |
Figure S282. Get High-res Image Gene #53: 'del_10q23.31' versus Clinical Feature #3: 'TUMOR_TISSUE_SITE'
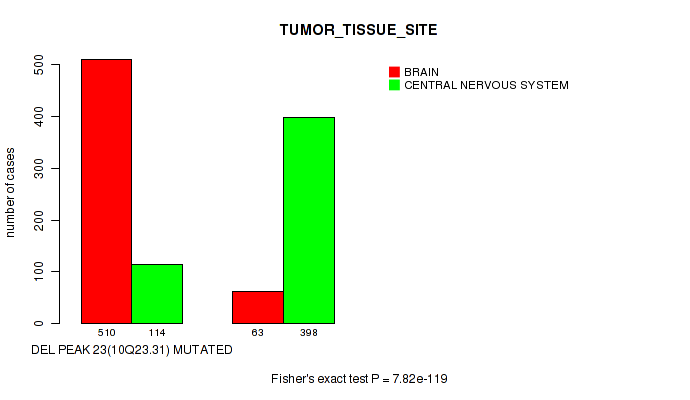
P value = 3.56e-19 (Fisher's exact test), Q value = 5.6e-18
Table S283. Gene #53: 'del_10q23.31' versus Clinical Feature #5: 'RADIATION_THERAPY'
| nPatients | NO | YES |
|---|---|---|
| ALL | 258 | 770 |
| DEL PEAK 23(10Q23.31) MUTATED | 87 | 506 |
| DEL PEAK 23(10Q23.31) WILD-TYPE | 171 | 264 |
Figure S283. Get High-res Image Gene #53: 'del_10q23.31' versus Clinical Feature #5: 'RADIATION_THERAPY'
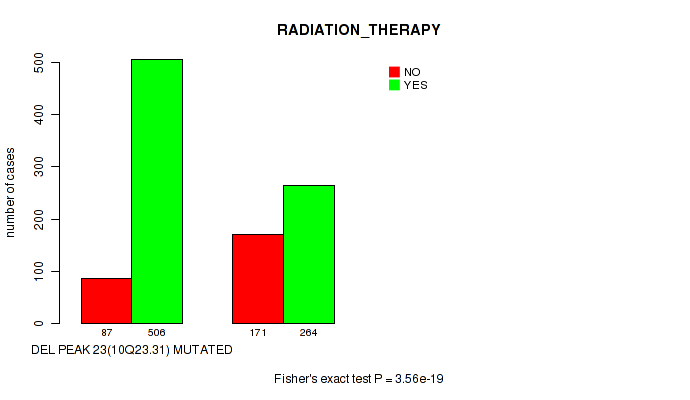
P value = 9.71e-19 (Wilcoxon-test), Q value = 1.5e-17
Table S284. Gene #53: 'del_10q23.31' versus Clinical Feature #6: 'KARNOFSKY_PERFORMANCE_SCORE'
| nPatients | Mean (Std.Dev) | |
|---|---|---|
| ALL | 732 | 81.1 (15.3) |
| DEL PEAK 23(10Q23.31) MUTATED | 446 | 77.4 (16.1) |
| DEL PEAK 23(10Q23.31) WILD-TYPE | 286 | 86.8 (11.9) |
Figure S284. Get High-res Image Gene #53: 'del_10q23.31' versus Clinical Feature #6: 'KARNOFSKY_PERFORMANCE_SCORE'
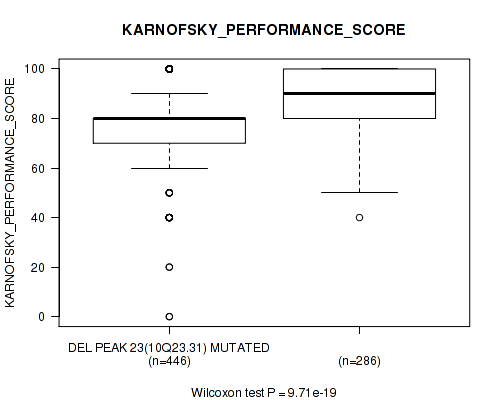
P value = 1e-05 (Fisher's exact test), Q value = 3.9e-05
Table S285. Gene #53: 'del_10q23.31' versus Clinical Feature #7: 'HISTOLOGICAL_TYPE'
| nPatients | ASTROCYTOMA | GLIOBLASTOMA MULTIFORME (GBM) | OLIGOASTROCYTOMA | OLIGODENDROGLIOMA | TREATED PRIMARY GBM | UNTREATED PRIMARY (DE NOVO) GBM |
|---|---|---|---|---|---|---|
| ALL | 194 | 30 | 129 | 189 | 18 | 525 |
| DEL PEAK 23(10Q23.31) MUTATED | 68 | 25 | 19 | 27 | 13 | 472 |
| DEL PEAK 23(10Q23.31) WILD-TYPE | 126 | 5 | 110 | 162 | 5 | 53 |
Figure S285. Get High-res Image Gene #53: 'del_10q23.31' versus Clinical Feature #7: 'HISTOLOGICAL_TYPE'
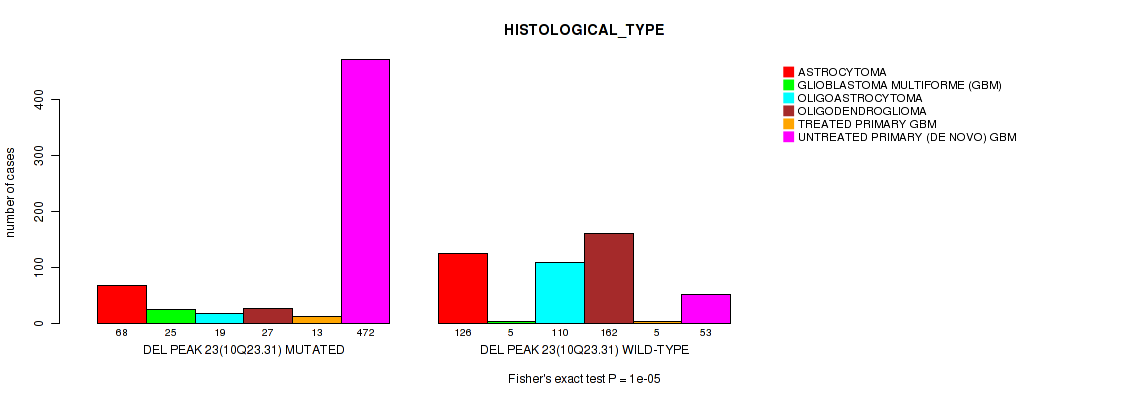
P value = 0.00814 (Fisher's exact test), Q value = 0.02
Table S286. Gene #53: 'del_10q23.31' versus Clinical Feature #8: 'RACE'
| nPatients | AMERICAN INDIAN OR ALASKA NATIVE | ASIAN | BLACK OR AFRICAN AMERICAN | WHITE |
|---|---|---|---|---|
| ALL | 1 | 21 | 71 | 959 |
| DEL PEAK 23(10Q23.31) MUTATED | 1 | 11 | 53 | 537 |
| DEL PEAK 23(10Q23.31) WILD-TYPE | 0 | 10 | 18 | 422 |
Figure S286. Get High-res Image Gene #53: 'del_10q23.31' versus Clinical Feature #8: 'RACE'
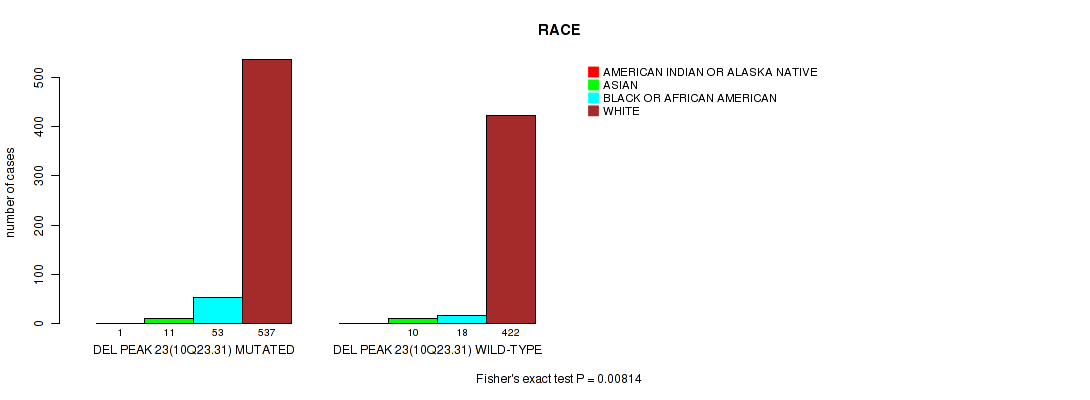
P value = 0.00819 (Fisher's exact test), Q value = 0.02
Table S287. Gene #53: 'del_10q23.31' versus Clinical Feature #9: 'ETHNICITY'
| nPatients | HISPANIC OR LATINO | NOT HISPANIC OR LATINO |
|---|---|---|
| ALL | 44 | 921 |
| DEL PEAK 23(10Q23.31) MUTATED | 16 | 524 |
| DEL PEAK 23(10Q23.31) WILD-TYPE | 28 | 397 |
Figure S287. Get High-res Image Gene #53: 'del_10q23.31' versus Clinical Feature #9: 'ETHNICITY'

P value = 0 (logrank test), Q value = 0
Table S288. Gene #54: 'del_10q26.3' versus Clinical Feature #1: 'Time to Death'
| nPatients | nDeath | Duration Range (Median), Month | |
|---|---|---|---|
| ALL | 1078 | 598 | 0.0 - 211.2 (16.0) |
| DEL PEAK 24(10Q26.3) MUTATED | 657 | 494 | 0.1 - 172.8 (13.6) |
| DEL PEAK 24(10Q26.3) WILD-TYPE | 421 | 104 | 0.0 - 211.2 (23.7) |
Figure S288. Get High-res Image Gene #54: 'del_10q26.3' versus Clinical Feature #1: 'Time to Death'
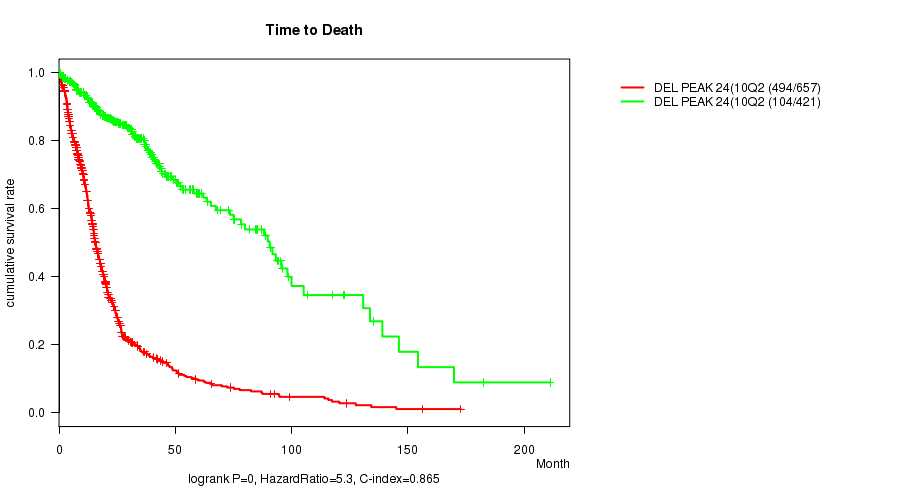
P value = 2.56e-50 (Wilcoxon-test), Q value = 5.6e-49
Table S289. Gene #54: 'del_10q26.3' versus Clinical Feature #2: 'YEARS_TO_BIRTH'
| nPatients | Mean (Std.Dev) | |
|---|---|---|
| ALL | 1084 | 50.8 (15.8) |
| DEL PEAK 24(10Q26.3) MUTATED | 661 | 56.5 (14.3) |
| DEL PEAK 24(10Q26.3) WILD-TYPE | 423 | 42.0 (13.9) |
Figure S289. Get High-res Image Gene #54: 'del_10q26.3' versus Clinical Feature #2: 'YEARS_TO_BIRTH'

P value = 2.98e-97 (Fisher's exact test), Q value = 1e-95
Table S290. Gene #54: 'del_10q26.3' versus Clinical Feature #3: 'TUMOR_TISSUE_SITE'
| nPatients | BRAIN | CENTRAL NERVOUS SYSTEM |
|---|---|---|
| ALL | 573 | 512 |
| DEL PEAK 24(10Q26.3) MUTATED | 511 | 150 |
| DEL PEAK 24(10Q26.3) WILD-TYPE | 62 | 362 |
Figure S290. Get High-res Image Gene #54: 'del_10q26.3' versus Clinical Feature #3: 'TUMOR_TISSUE_SITE'
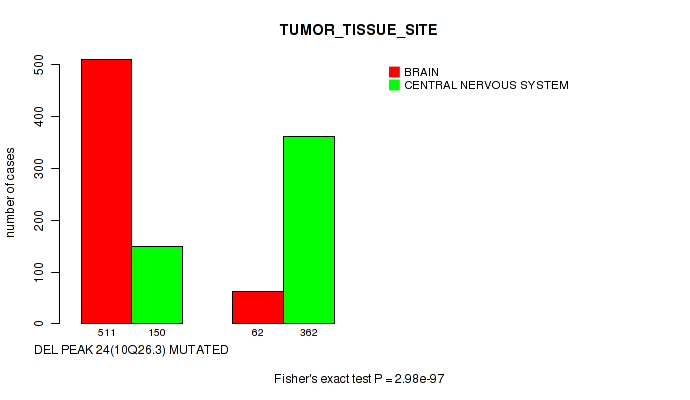
P value = 5.32e-17 (Fisher's exact test), Q value = 7.8e-16
Table S291. Gene #54: 'del_10q26.3' versus Clinical Feature #5: 'RADIATION_THERAPY'
| nPatients | NO | YES |
|---|---|---|
| ALL | 258 | 770 |
| DEL PEAK 24(10Q26.3) MUTATED | 101 | 530 |
| DEL PEAK 24(10Q26.3) WILD-TYPE | 157 | 240 |
Figure S291. Get High-res Image Gene #54: 'del_10q26.3' versus Clinical Feature #5: 'RADIATION_THERAPY'
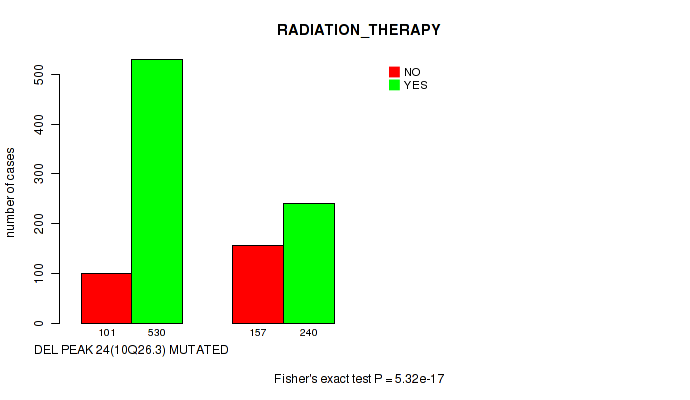
P value = 1.5e-16 (Wilcoxon-test), Q value = 2e-15
Table S292. Gene #54: 'del_10q26.3' versus Clinical Feature #6: 'KARNOFSKY_PERFORMANCE_SCORE'
| nPatients | Mean (Std.Dev) | |
|---|---|---|
| ALL | 732 | 81.1 (15.3) |
| DEL PEAK 24(10Q26.3) MUTATED | 471 | 77.8 (16.2) |
| DEL PEAK 24(10Q26.3) WILD-TYPE | 261 | 87.0 (11.4) |
Figure S292. Get High-res Image Gene #54: 'del_10q26.3' versus Clinical Feature #6: 'KARNOFSKY_PERFORMANCE_SCORE'
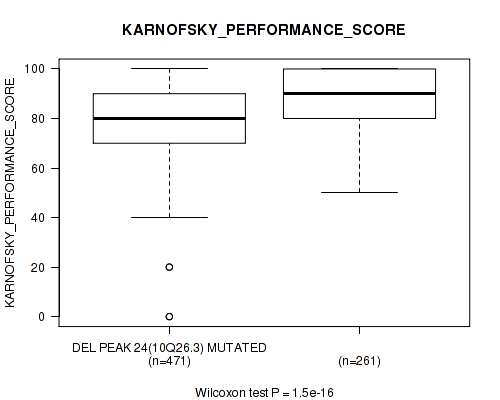
P value = 1e-05 (Fisher's exact test), Q value = 3.9e-05
Table S293. Gene #54: 'del_10q26.3' versus Clinical Feature #7: 'HISTOLOGICAL_TYPE'
| nPatients | ASTROCYTOMA | GLIOBLASTOMA MULTIFORME (GBM) | OLIGOASTROCYTOMA | OLIGODENDROGLIOMA | TREATED PRIMARY GBM | UNTREATED PRIMARY (DE NOVO) GBM |
|---|---|---|---|---|---|---|
| ALL | 194 | 30 | 129 | 189 | 18 | 525 |
| DEL PEAK 24(10Q26.3) MUTATED | 81 | 25 | 32 | 37 | 14 | 472 |
| DEL PEAK 24(10Q26.3) WILD-TYPE | 113 | 5 | 97 | 152 | 4 | 53 |
Figure S293. Get High-res Image Gene #54: 'del_10q26.3' versus Clinical Feature #7: 'HISTOLOGICAL_TYPE'
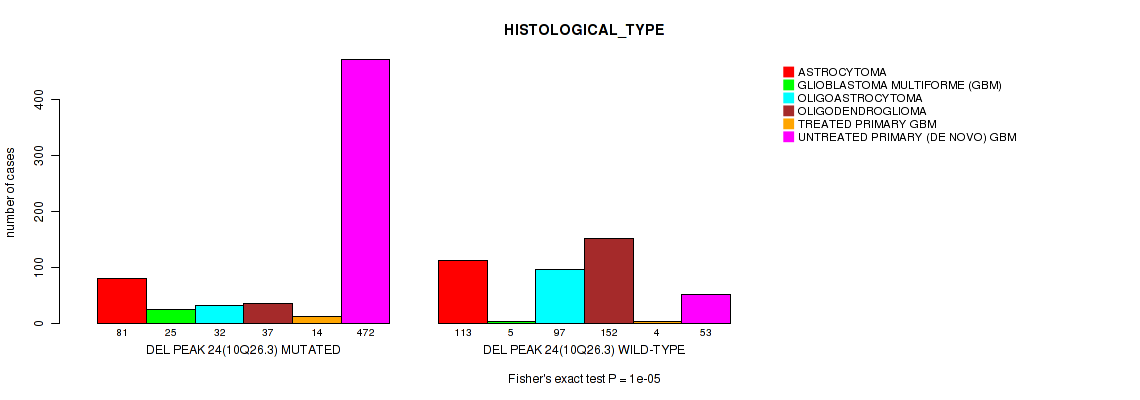
P value = 0.00919 (Fisher's exact test), Q value = 0.022
Table S294. Gene #54: 'del_10q26.3' versus Clinical Feature #8: 'RACE'
| nPatients | AMERICAN INDIAN OR ALASKA NATIVE | ASIAN | BLACK OR AFRICAN AMERICAN | WHITE |
|---|---|---|---|---|
| ALL | 1 | 21 | 71 | 959 |
| DEL PEAK 24(10Q26.3) MUTATED | 1 | 11 | 55 | 572 |
| DEL PEAK 24(10Q26.3) WILD-TYPE | 0 | 10 | 16 | 387 |
Figure S294. Get High-res Image Gene #54: 'del_10q26.3' versus Clinical Feature #8: 'RACE'
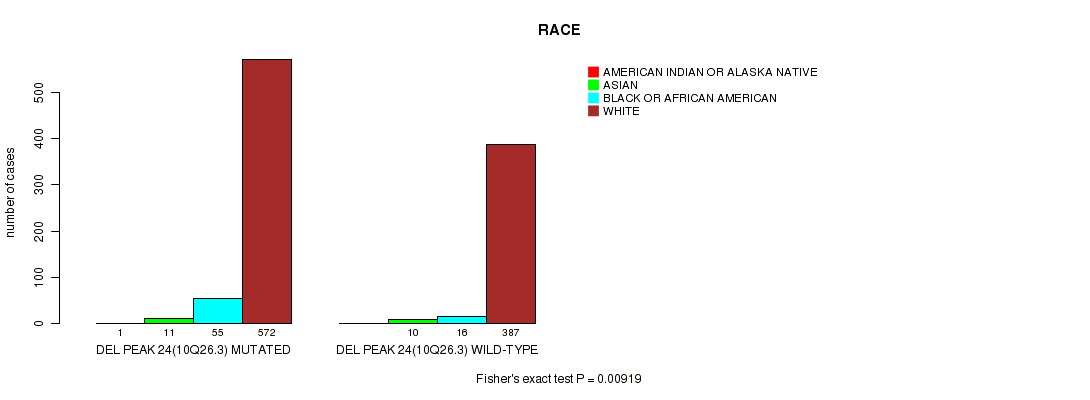
P value = 0.0269 (Fisher's exact test), Q value = 0.057
Table S295. Gene #54: 'del_10q26.3' versus Clinical Feature #9: 'ETHNICITY'
| nPatients | HISPANIC OR LATINO | NOT HISPANIC OR LATINO |
|---|---|---|
| ALL | 44 | 921 |
| DEL PEAK 24(10Q26.3) MUTATED | 19 | 558 |
| DEL PEAK 24(10Q26.3) WILD-TYPE | 25 | 363 |
Figure S295. Get High-res Image Gene #54: 'del_10q26.3' versus Clinical Feature #9: 'ETHNICITY'
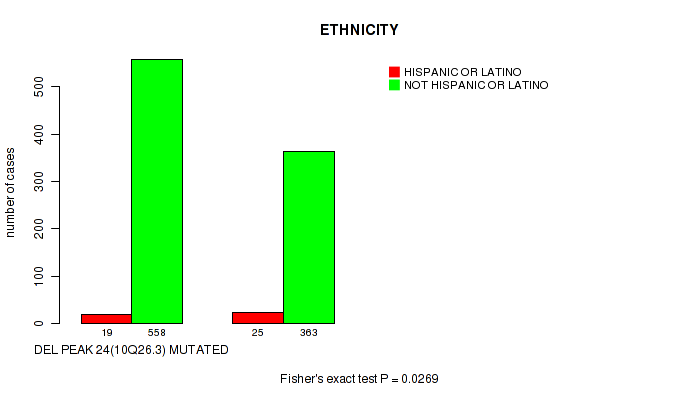
P value = 0.000556 (Wilcoxon-test), Q value = 0.0018
Table S296. Gene #55: 'del_11p15.5' versus Clinical Feature #2: 'YEARS_TO_BIRTH'
| nPatients | Mean (Std.Dev) | |
|---|---|---|
| ALL | 1084 | 50.8 (15.8) |
| DEL PEAK 25(11P15.5) MUTATED | 234 | 47.8 (15.9) |
| DEL PEAK 25(11P15.5) WILD-TYPE | 850 | 51.7 (15.7) |
Figure S296. Get High-res Image Gene #55: 'del_11p15.5' versus Clinical Feature #2: 'YEARS_TO_BIRTH'
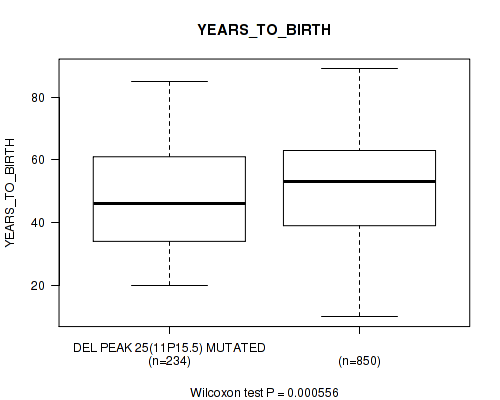
P value = 0.0516 (Fisher's exact test), Q value = 0.1
Table S297. Gene #55: 'del_11p15.5' versus Clinical Feature #4: 'GENDER'
| nPatients | FEMALE | MALE |
|---|---|---|
| ALL | 453 | 632 |
| DEL PEAK 25(11P15.5) MUTATED | 111 | 123 |
| DEL PEAK 25(11P15.5) WILD-TYPE | 342 | 509 |
Figure S297. Get High-res Image Gene #55: 'del_11p15.5' versus Clinical Feature #4: 'GENDER'
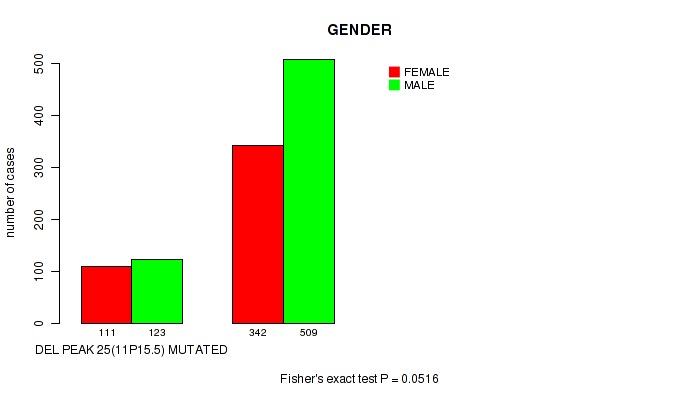
P value = 0.0111 (Fisher's exact test), Q value = 0.026
Table S298. Gene #55: 'del_11p15.5' versus Clinical Feature #5: 'RADIATION_THERAPY'
| nPatients | NO | YES |
|---|---|---|
| ALL | 258 | 770 |
| DEL PEAK 25(11P15.5) MUTATED | 41 | 180 |
| DEL PEAK 25(11P15.5) WILD-TYPE | 217 | 590 |
Figure S298. Get High-res Image Gene #55: 'del_11p15.5' versus Clinical Feature #5: 'RADIATION_THERAPY'
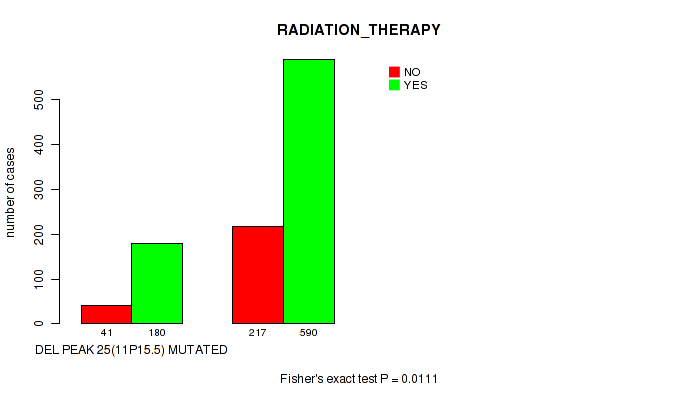
P value = 2e-05 (Fisher's exact test), Q value = 7.4e-05
Table S299. Gene #55: 'del_11p15.5' versus Clinical Feature #7: 'HISTOLOGICAL_TYPE'
| nPatients | ASTROCYTOMA | GLIOBLASTOMA MULTIFORME (GBM) | OLIGOASTROCYTOMA | OLIGODENDROGLIOMA | TREATED PRIMARY GBM | UNTREATED PRIMARY (DE NOVO) GBM |
|---|---|---|---|---|---|---|
| ALL | 194 | 30 | 129 | 189 | 18 | 525 |
| DEL PEAK 25(11P15.5) MUTATED | 59 | 6 | 29 | 17 | 6 | 117 |
| DEL PEAK 25(11P15.5) WILD-TYPE | 135 | 24 | 100 | 172 | 12 | 408 |
Figure S299. Get High-res Image Gene #55: 'del_11p15.5' versus Clinical Feature #7: 'HISTOLOGICAL_TYPE'
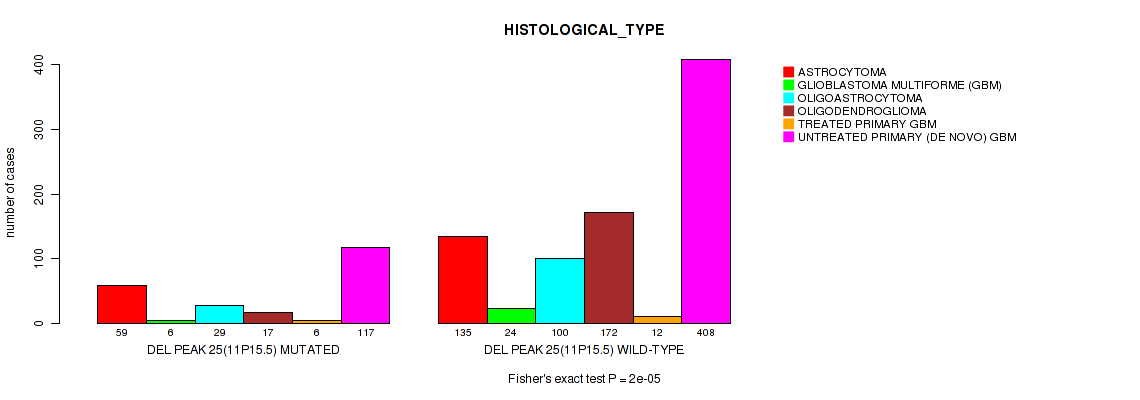
P value = 0.0967 (logrank test), Q value = 0.17
Table S300. Gene #56: 'del_11p15.1' versus Clinical Feature #1: 'Time to Death'
| nPatients | nDeath | Duration Range (Median), Month | |
|---|---|---|---|
| ALL | 1078 | 598 | 0.0 - 211.2 (16.0) |
| DEL PEAK 26(11P15.1) MUTATED | 175 | 112 | 0.2 - 156.2 (16.8) |
| DEL PEAK 26(11P15.1) WILD-TYPE | 903 | 486 | 0.0 - 211.2 (15.9) |
Figure S300. Get High-res Image Gene #56: 'del_11p15.1' versus Clinical Feature #1: 'Time to Death'
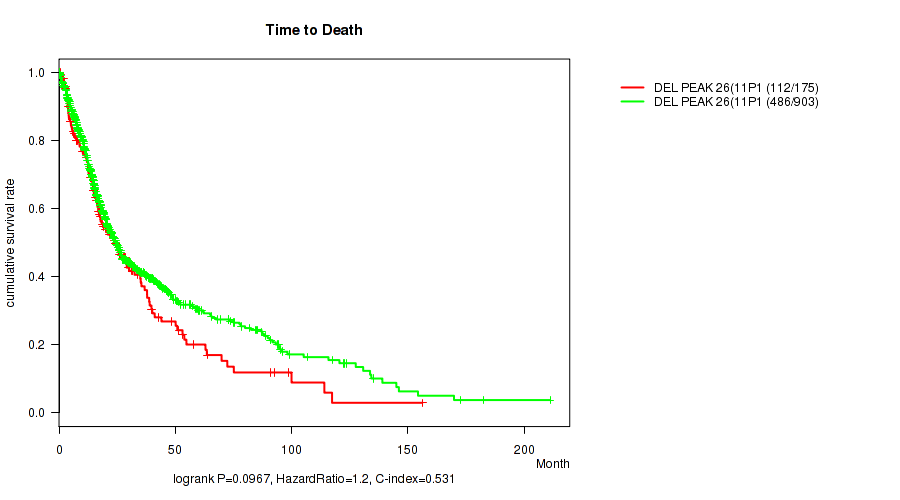
P value = 0.0701 (Fisher's exact test), Q value = 0.13
Table S301. Gene #56: 'del_11p15.1' versus Clinical Feature #3: 'TUMOR_TISSUE_SITE'
| nPatients | BRAIN | CENTRAL NERVOUS SYSTEM |
|---|---|---|
| ALL | 573 | 512 |
| DEL PEAK 26(11P15.1) MUTATED | 104 | 72 |
| DEL PEAK 26(11P15.1) WILD-TYPE | 469 | 440 |
Figure S301. Get High-res Image Gene #56: 'del_11p15.1' versus Clinical Feature #3: 'TUMOR_TISSUE_SITE'

P value = 0.0448 (Fisher's exact test), Q value = 0.09
Table S302. Gene #56: 'del_11p15.1' versus Clinical Feature #4: 'GENDER'
| nPatients | FEMALE | MALE |
|---|---|---|
| ALL | 453 | 632 |
| DEL PEAK 26(11P15.1) MUTATED | 86 | 90 |
| DEL PEAK 26(11P15.1) WILD-TYPE | 367 | 542 |
Figure S302. Get High-res Image Gene #56: 'del_11p15.1' versus Clinical Feature #4: 'GENDER'
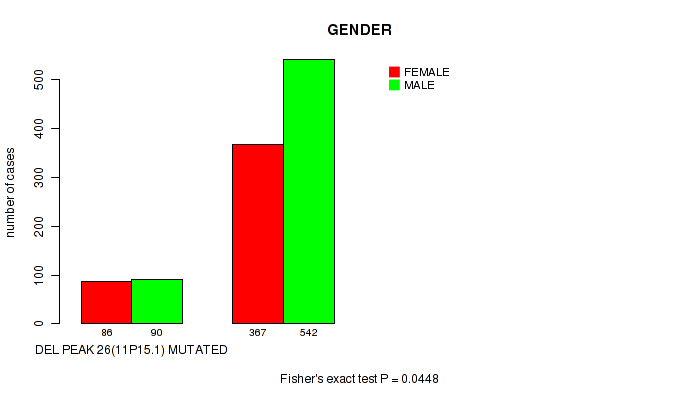
P value = 0.0243 (Fisher's exact test), Q value = 0.053
Table S303. Gene #56: 'del_11p15.1' versus Clinical Feature #5: 'RADIATION_THERAPY'
| nPatients | NO | YES |
|---|---|---|
| ALL | 258 | 770 |
| DEL PEAK 26(11P15.1) MUTATED | 30 | 136 |
| DEL PEAK 26(11P15.1) WILD-TYPE | 228 | 634 |
Figure S303. Get High-res Image Gene #56: 'del_11p15.1' versus Clinical Feature #5: 'RADIATION_THERAPY'

P value = 0.00036 (Fisher's exact test), Q value = 0.0012
Table S304. Gene #56: 'del_11p15.1' versus Clinical Feature #7: 'HISTOLOGICAL_TYPE'
| nPatients | ASTROCYTOMA | GLIOBLASTOMA MULTIFORME (GBM) | OLIGOASTROCYTOMA | OLIGODENDROGLIOMA | TREATED PRIMARY GBM | UNTREATED PRIMARY (DE NOVO) GBM |
|---|---|---|---|---|---|---|
| ALL | 194 | 30 | 129 | 189 | 18 | 525 |
| DEL PEAK 26(11P15.1) MUTATED | 43 | 5 | 15 | 14 | 5 | 94 |
| DEL PEAK 26(11P15.1) WILD-TYPE | 151 | 25 | 114 | 175 | 13 | 431 |
Figure S304. Get High-res Image Gene #56: 'del_11p15.1' versus Clinical Feature #7: 'HISTOLOGICAL_TYPE'

P value = 0.00242 (logrank test), Q value = 0.0069
Table S305. Gene #57: 'del_11p11.2' versus Clinical Feature #1: 'Time to Death'
| nPatients | nDeath | Duration Range (Median), Month | |
|---|---|---|---|
| ALL | 1078 | 598 | 0.0 - 211.2 (16.0) |
| DEL PEAK 27(11P11.2) MUTATED | 158 | 112 | 0.2 - 117.4 (16.4) |
| DEL PEAK 27(11P11.2) WILD-TYPE | 920 | 486 | 0.0 - 211.2 (16.0) |
Figure S305. Get High-res Image Gene #57: 'del_11p11.2' versus Clinical Feature #1: 'Time to Death'
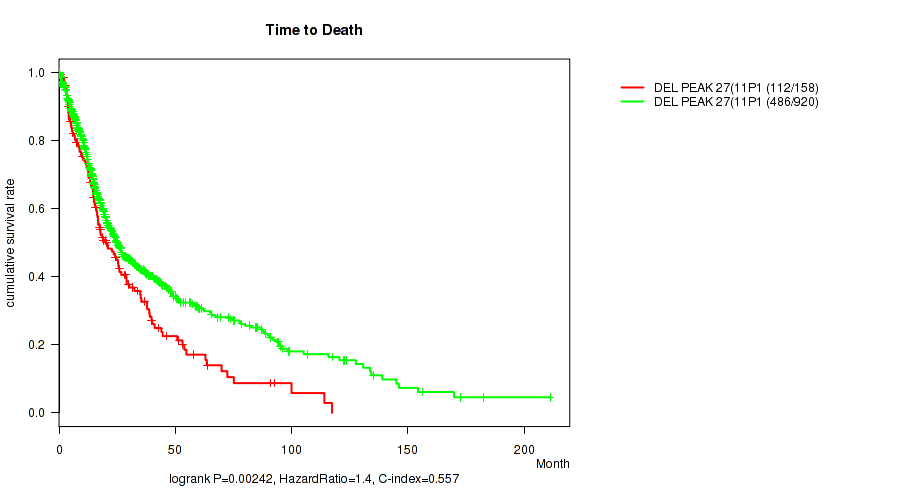
P value = 0.000295 (Fisher's exact test), Q value = 0.00096
Table S306. Gene #57: 'del_11p11.2' versus Clinical Feature #3: 'TUMOR_TISSUE_SITE'
| nPatients | BRAIN | CENTRAL NERVOUS SYSTEM |
|---|---|---|
| ALL | 573 | 512 |
| DEL PEAK 27(11P11.2) MUTATED | 105 | 54 |
| DEL PEAK 27(11P11.2) WILD-TYPE | 468 | 458 |
Figure S306. Get High-res Image Gene #57: 'del_11p11.2' versus Clinical Feature #3: 'TUMOR_TISSUE_SITE'
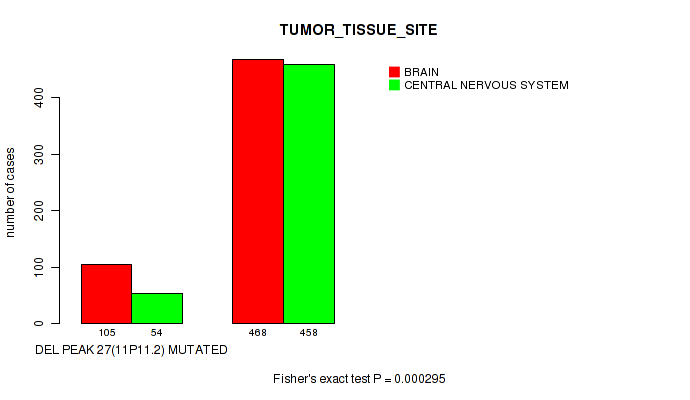
P value = 0.00294 (Fisher's exact test), Q value = 0.0082
Table S307. Gene #57: 'del_11p11.2' versus Clinical Feature #5: 'RADIATION_THERAPY'
| nPatients | NO | YES |
|---|---|---|
| ALL | 258 | 770 |
| DEL PEAK 27(11P11.2) MUTATED | 23 | 126 |
| DEL PEAK 27(11P11.2) WILD-TYPE | 235 | 644 |
Figure S307. Get High-res Image Gene #57: 'del_11p11.2' versus Clinical Feature #5: 'RADIATION_THERAPY'
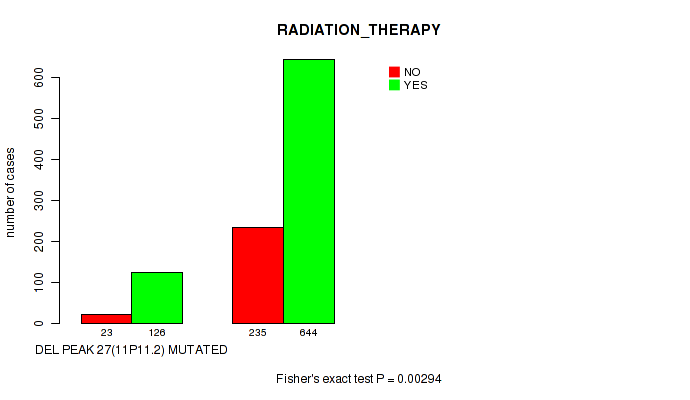
P value = 9e-05 (Fisher's exact test), Q value = 0.00031
Table S308. Gene #57: 'del_11p11.2' versus Clinical Feature #7: 'HISTOLOGICAL_TYPE'
| nPatients | ASTROCYTOMA | GLIOBLASTOMA MULTIFORME (GBM) | OLIGOASTROCYTOMA | OLIGODENDROGLIOMA | TREATED PRIMARY GBM | UNTREATED PRIMARY (DE NOVO) GBM |
|---|---|---|---|---|---|---|
| ALL | 194 | 30 | 129 | 189 | 18 | 525 |
| DEL PEAK 27(11P11.2) MUTATED | 30 | 5 | 13 | 11 | 6 | 94 |
| DEL PEAK 27(11P11.2) WILD-TYPE | 164 | 25 | 116 | 178 | 12 | 431 |
Figure S308. Get High-res Image Gene #57: 'del_11p11.2' versus Clinical Feature #7: 'HISTOLOGICAL_TYPE'
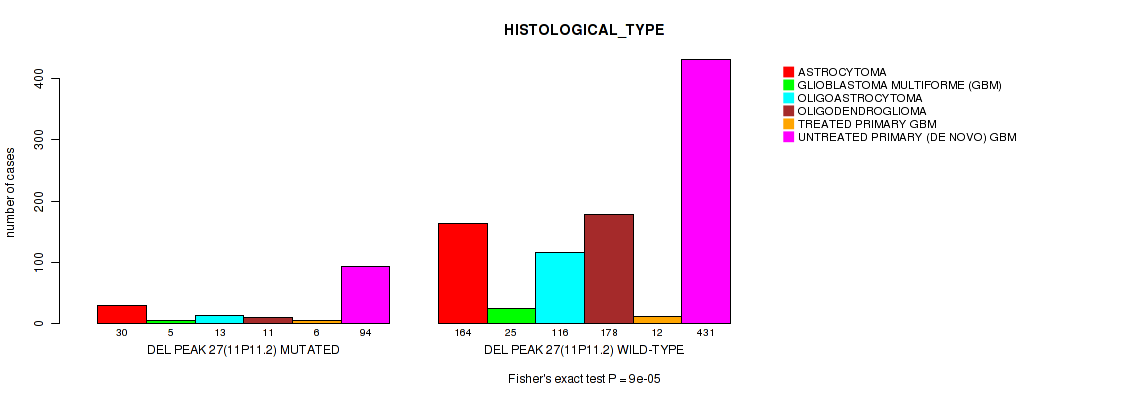
P value = 0.0432 (logrank test), Q value = 0.087
Table S309. Gene #58: 'del_12p13.1' versus Clinical Feature #1: 'Time to Death'
| nPatients | nDeath | Duration Range (Median), Month | |
|---|---|---|---|
| ALL | 1078 | 598 | 0.0 - 211.2 (16.0) |
| DEL PEAK 28(12P13.1) MUTATED | 108 | 70 | 0.1 - 95.1 (15.8) |
| DEL PEAK 28(12P13.1) WILD-TYPE | 970 | 528 | 0.0 - 211.2 (16.0) |
Figure S309. Get High-res Image Gene #58: 'del_12p13.1' versus Clinical Feature #1: 'Time to Death'
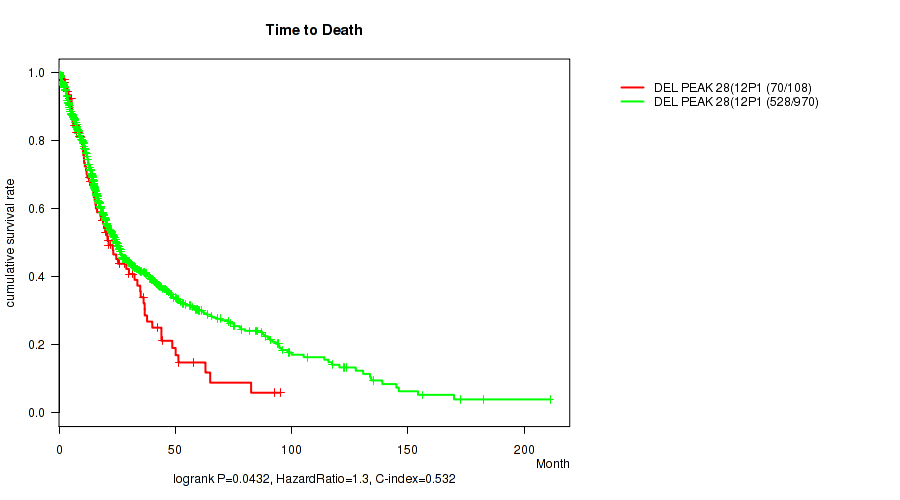
P value = 0.00632 (Fisher's exact test), Q value = 0.016
Table S310. Gene #58: 'del_12p13.1' versus Clinical Feature #3: 'TUMOR_TISSUE_SITE'
| nPatients | BRAIN | CENTRAL NERVOUS SYSTEM |
|---|---|---|
| ALL | 573 | 512 |
| DEL PEAK 28(12P13.1) MUTATED | 72 | 38 |
| DEL PEAK 28(12P13.1) WILD-TYPE | 501 | 474 |
Figure S310. Get High-res Image Gene #58: 'del_12p13.1' versus Clinical Feature #3: 'TUMOR_TISSUE_SITE'
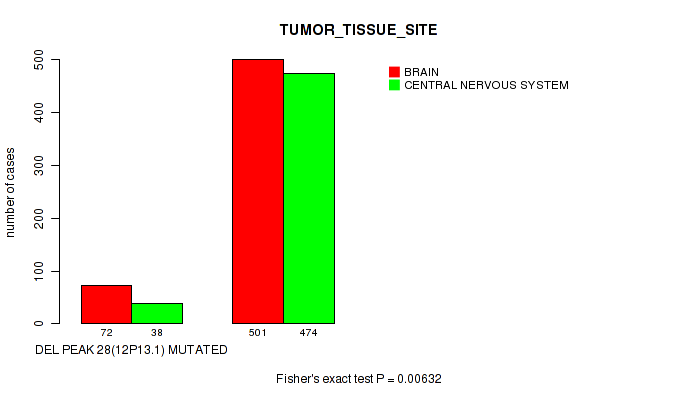
P value = 0.0171 (Fisher's exact test), Q value = 0.039
Table S311. Gene #58: 'del_12p13.1' versus Clinical Feature #7: 'HISTOLOGICAL_TYPE'
| nPatients | ASTROCYTOMA | GLIOBLASTOMA MULTIFORME (GBM) | OLIGOASTROCYTOMA | OLIGODENDROGLIOMA | TREATED PRIMARY GBM | UNTREATED PRIMARY (DE NOVO) GBM |
|---|---|---|---|---|---|---|
| ALL | 194 | 30 | 129 | 189 | 18 | 525 |
| DEL PEAK 28(12P13.1) MUTATED | 20 | 2 | 9 | 9 | 1 | 69 |
| DEL PEAK 28(12P13.1) WILD-TYPE | 174 | 28 | 120 | 180 | 17 | 456 |
Figure S311. Get High-res Image Gene #58: 'del_12p13.1' versus Clinical Feature #7: 'HISTOLOGICAL_TYPE'
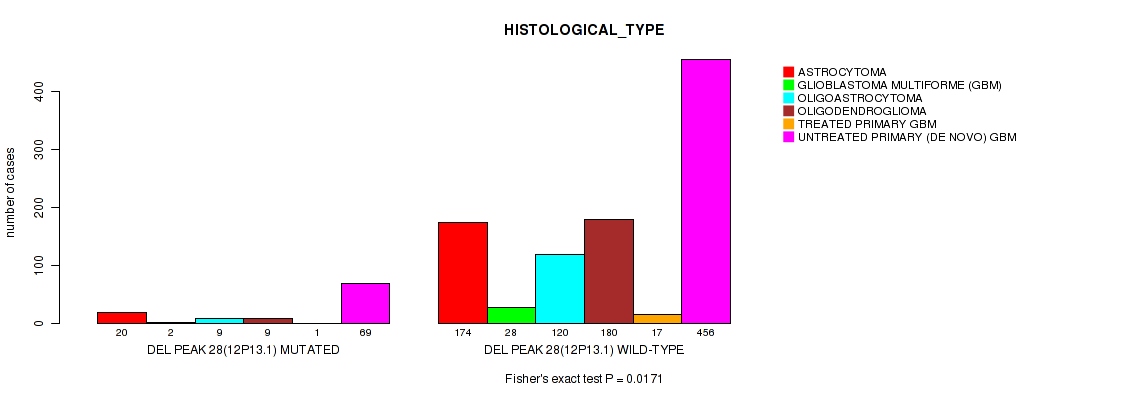
P value = 0.116 (Fisher's exact test), Q value = 0.2
Table S312. Gene #58: 'del_12p13.1' versus Clinical Feature #9: 'ETHNICITY'
| nPatients | HISPANIC OR LATINO | NOT HISPANIC OR LATINO |
|---|---|---|
| ALL | 44 | 921 |
| DEL PEAK 28(12P13.1) MUTATED | 1 | 95 |
| DEL PEAK 28(12P13.1) WILD-TYPE | 43 | 826 |
Figure S312. Get High-res Image Gene #58: 'del_12p13.1' versus Clinical Feature #9: 'ETHNICITY'

P value = 0.00123 (Fisher's exact test), Q value = 0.0037
Table S313. Gene #59: 'del_12q12' versus Clinical Feature #7: 'HISTOLOGICAL_TYPE'
| nPatients | ASTROCYTOMA | GLIOBLASTOMA MULTIFORME (GBM) | OLIGOASTROCYTOMA | OLIGODENDROGLIOMA | TREATED PRIMARY GBM | UNTREATED PRIMARY (DE NOVO) GBM |
|---|---|---|---|---|---|---|
| ALL | 194 | 30 | 129 | 189 | 18 | 525 |
| DEL PEAK 29(12Q12) MUTATED | 42 | 4 | 16 | 12 | 2 | 71 |
| DEL PEAK 29(12Q12) WILD-TYPE | 152 | 26 | 113 | 177 | 16 | 454 |
Figure S313. Get High-res Image Gene #59: 'del_12q12' versus Clinical Feature #7: 'HISTOLOGICAL_TYPE'
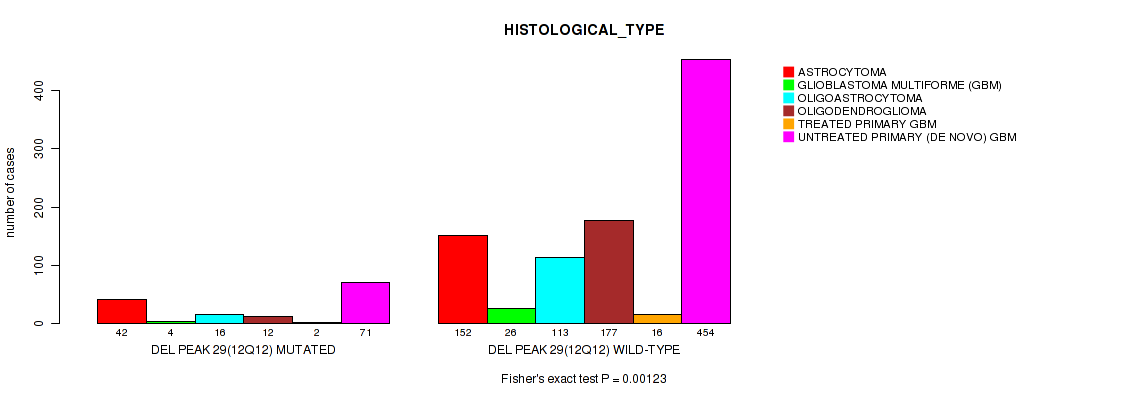
P value = 0.00575 (Fisher's exact test), Q value = 0.015
Table S314. Gene #60: 'del_12q15' versus Clinical Feature #7: 'HISTOLOGICAL_TYPE'
| nPatients | ASTROCYTOMA | GLIOBLASTOMA MULTIFORME (GBM) | OLIGOASTROCYTOMA | OLIGODENDROGLIOMA | TREATED PRIMARY GBM | UNTREATED PRIMARY (DE NOVO) GBM |
|---|---|---|---|---|---|---|
| ALL | 194 | 30 | 129 | 189 | 18 | 525 |
| DEL PEAK 30(12Q15) MUTATED | 37 | 5 | 14 | 12 | 3 | 71 |
| DEL PEAK 30(12Q15) WILD-TYPE | 157 | 25 | 115 | 177 | 15 | 454 |
Figure S314. Get High-res Image Gene #60: 'del_12q15' versus Clinical Feature #7: 'HISTOLOGICAL_TYPE'

P value = 1.29e-05 (logrank test), Q value = 4.9e-05
Table S315. Gene #61: 'del_13q14.2' versus Clinical Feature #1: 'Time to Death'
| nPatients | nDeath | Duration Range (Median), Month | |
|---|---|---|---|
| ALL | 1078 | 598 | 0.0 - 211.2 (16.0) |
| DEL PEAK 31(13Q14.2) MUTATED | 381 | 251 | 0.1 - 211.2 (15.1) |
| DEL PEAK 31(13Q14.2) WILD-TYPE | 697 | 347 | 0.0 - 182.3 (16.7) |
Figure S315. Get High-res Image Gene #61: 'del_13q14.2' versus Clinical Feature #1: 'Time to Death'
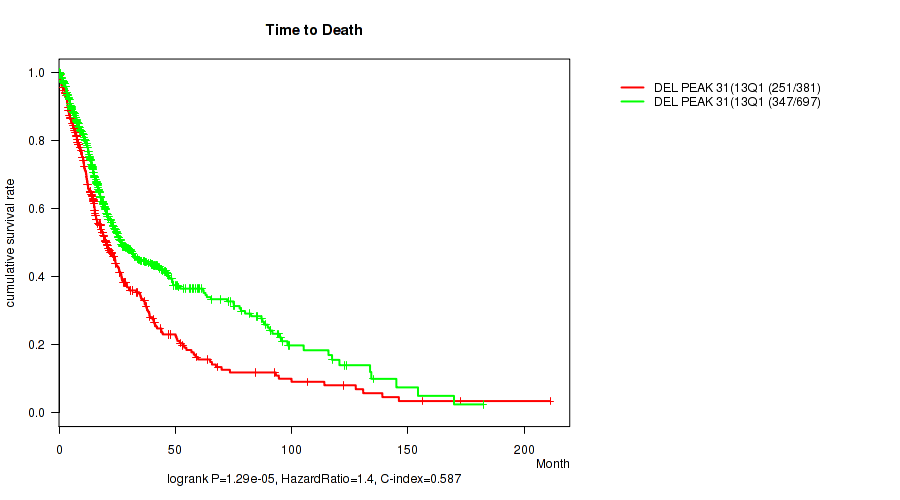
P value = 0.0577 (Wilcoxon-test), Q value = 0.11
Table S316. Gene #61: 'del_13q14.2' versus Clinical Feature #2: 'YEARS_TO_BIRTH'
| nPatients | Mean (Std.Dev) | |
|---|---|---|
| ALL | 1084 | 50.8 (15.8) |
| DEL PEAK 31(13Q14.2) MUTATED | 382 | 52.0 (16.2) |
| DEL PEAK 31(13Q14.2) WILD-TYPE | 702 | 50.2 (15.6) |
Figure S316. Get High-res Image Gene #61: 'del_13q14.2' versus Clinical Feature #2: 'YEARS_TO_BIRTH'
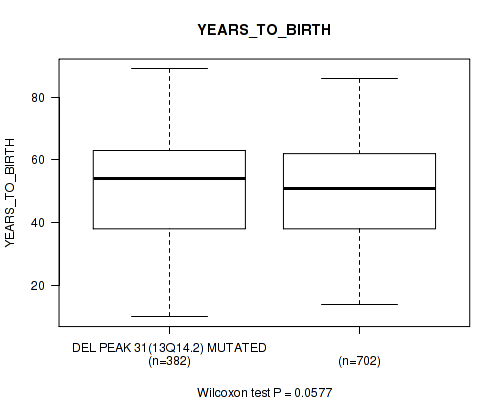
P value = 1.24e-06 (Fisher's exact test), Q value = 6.8e-06
Table S317. Gene #61: 'del_13q14.2' versus Clinical Feature #3: 'TUMOR_TISSUE_SITE'
| nPatients | BRAIN | CENTRAL NERVOUS SYSTEM |
|---|---|---|
| ALL | 573 | 512 |
| DEL PEAK 31(13Q14.2) MUTATED | 240 | 142 |
| DEL PEAK 31(13Q14.2) WILD-TYPE | 333 | 370 |
Figure S317. Get High-res Image Gene #61: 'del_13q14.2' versus Clinical Feature #3: 'TUMOR_TISSUE_SITE'
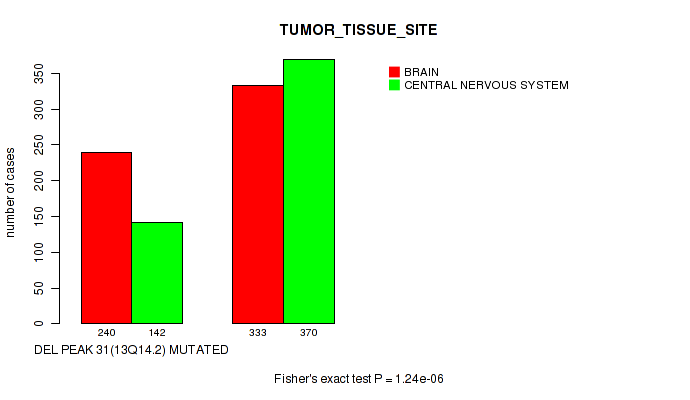
P value = 0.00206 (Fisher's exact test), Q value = 0.006
Table S318. Gene #61: 'del_13q14.2' versus Clinical Feature #5: 'RADIATION_THERAPY'
| nPatients | NO | YES |
|---|---|---|
| ALL | 258 | 770 |
| DEL PEAK 31(13Q14.2) MUTATED | 71 | 293 |
| DEL PEAK 31(13Q14.2) WILD-TYPE | 187 | 477 |
Figure S318. Get High-res Image Gene #61: 'del_13q14.2' versus Clinical Feature #5: 'RADIATION_THERAPY'

P value = 0.00413 (Wilcoxon-test), Q value = 0.011
Table S319. Gene #61: 'del_13q14.2' versus Clinical Feature #6: 'KARNOFSKY_PERFORMANCE_SCORE'
| nPatients | Mean (Std.Dev) | |
|---|---|---|
| ALL | 732 | 81.1 (15.3) |
| DEL PEAK 31(13Q14.2) MUTATED | 270 | 79.1 (15.5) |
| DEL PEAK 31(13Q14.2) WILD-TYPE | 462 | 82.2 (15.1) |
Figure S319. Get High-res Image Gene #61: 'del_13q14.2' versus Clinical Feature #6: 'KARNOFSKY_PERFORMANCE_SCORE'

P value = 1e-05 (Fisher's exact test), Q value = 3.9e-05
Table S320. Gene #61: 'del_13q14.2' versus Clinical Feature #7: 'HISTOLOGICAL_TYPE'
| nPatients | ASTROCYTOMA | GLIOBLASTOMA MULTIFORME (GBM) | OLIGOASTROCYTOMA | OLIGODENDROGLIOMA | TREATED PRIMARY GBM | UNTREATED PRIMARY (DE NOVO) GBM |
|---|---|---|---|---|---|---|
| ALL | 194 | 30 | 129 | 189 | 18 | 525 |
| DEL PEAK 31(13Q14.2) MUTATED | 63 | 10 | 36 | 43 | 6 | 224 |
| DEL PEAK 31(13Q14.2) WILD-TYPE | 131 | 20 | 93 | 146 | 12 | 301 |
Figure S320. Get High-res Image Gene #61: 'del_13q14.2' versus Clinical Feature #7: 'HISTOLOGICAL_TYPE'
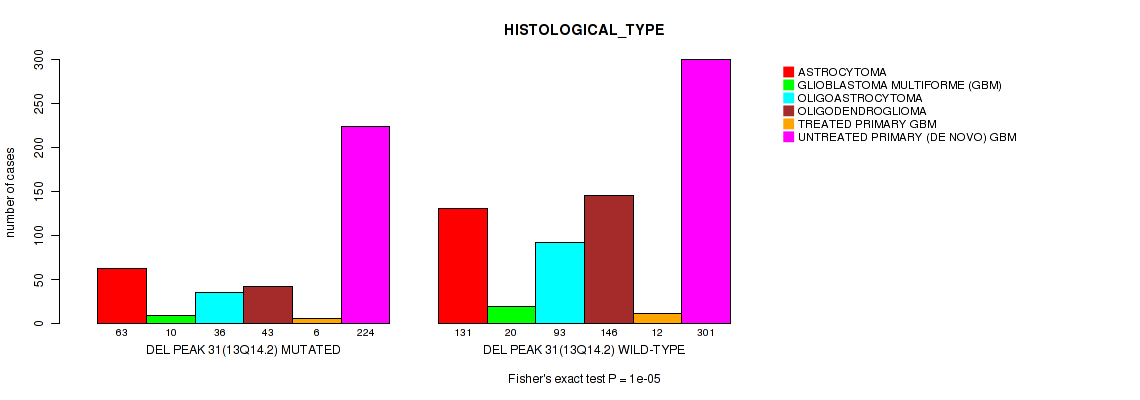
P value = 4.66e-06 (logrank test), Q value = 2.4e-05
Table S321. Gene #62: 'del_13q22.1' versus Clinical Feature #1: 'Time to Death'
| nPatients | nDeath | Duration Range (Median), Month | |
|---|---|---|---|
| ALL | 1078 | 598 | 0.0 - 211.2 (16.0) |
| DEL PEAK 32(13Q22.1) MUTATED | 364 | 240 | 0.1 - 211.2 (15.0) |
| DEL PEAK 32(13Q22.1) WILD-TYPE | 714 | 358 | 0.0 - 182.3 (16.8) |
Figure S321. Get High-res Image Gene #62: 'del_13q22.1' versus Clinical Feature #1: 'Time to Death'
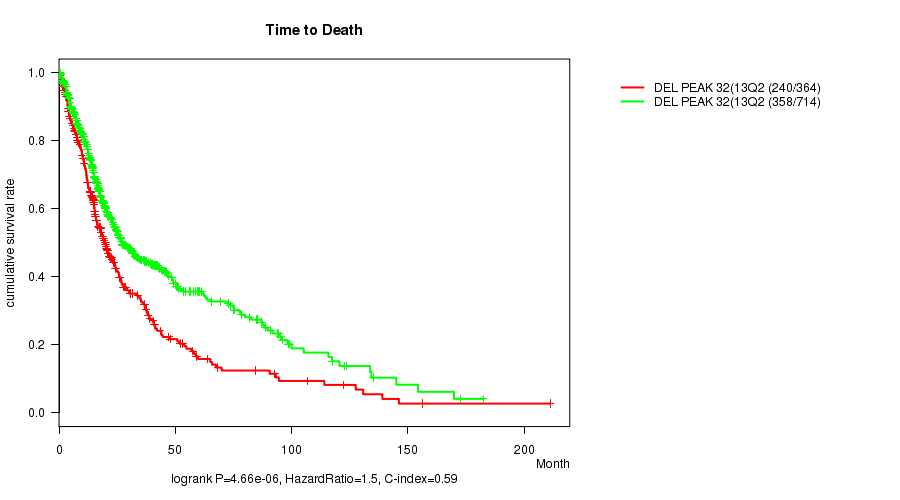
P value = 0.0122 (Wilcoxon-test), Q value = 0.029
Table S322. Gene #62: 'del_13q22.1' versus Clinical Feature #2: 'YEARS_TO_BIRTH'
| nPatients | Mean (Std.Dev) | |
|---|---|---|
| ALL | 1084 | 50.8 (15.8) |
| DEL PEAK 32(13Q22.1) MUTATED | 365 | 52.5 (15.6) |
| DEL PEAK 32(13Q22.1) WILD-TYPE | 719 | 50.0 (15.9) |
Figure S322. Get High-res Image Gene #62: 'del_13q22.1' versus Clinical Feature #2: 'YEARS_TO_BIRTH'

P value = 6.38e-06 (Fisher's exact test), Q value = 3.2e-05
Table S323. Gene #62: 'del_13q22.1' versus Clinical Feature #3: 'TUMOR_TISSUE_SITE'
| nPatients | BRAIN | CENTRAL NERVOUS SYSTEM |
|---|---|---|
| ALL | 573 | 512 |
| DEL PEAK 32(13Q22.1) MUTATED | 228 | 137 |
| DEL PEAK 32(13Q22.1) WILD-TYPE | 345 | 375 |
Figure S323. Get High-res Image Gene #62: 'del_13q22.1' versus Clinical Feature #3: 'TUMOR_TISSUE_SITE'
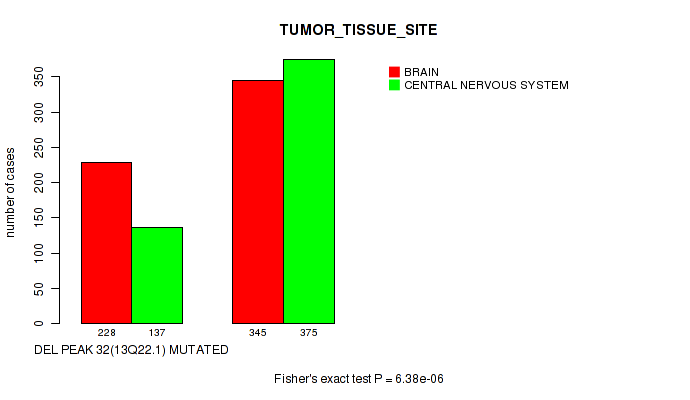
P value = 0.0122 (Fisher's exact test), Q value = 0.029
Table S324. Gene #62: 'del_13q22.1' versus Clinical Feature #5: 'RADIATION_THERAPY'
| nPatients | NO | YES |
|---|---|---|
| ALL | 258 | 770 |
| DEL PEAK 32(13Q22.1) MUTATED | 71 | 278 |
| DEL PEAK 32(13Q22.1) WILD-TYPE | 187 | 492 |
Figure S324. Get High-res Image Gene #62: 'del_13q22.1' versus Clinical Feature #5: 'RADIATION_THERAPY'
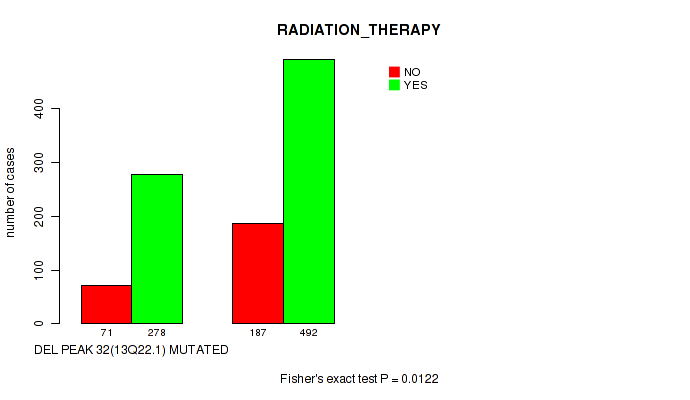
P value = 0.00181 (Wilcoxon-test), Q value = 0.0053
Table S325. Gene #62: 'del_13q22.1' versus Clinical Feature #6: 'KARNOFSKY_PERFORMANCE_SCORE'
| nPatients | Mean (Std.Dev) | |
|---|---|---|
| ALL | 732 | 81.1 (15.3) |
| DEL PEAK 32(13Q22.1) MUTATED | 256 | 78.9 (15.4) |
| DEL PEAK 32(13Q22.1) WILD-TYPE | 476 | 82.3 (15.1) |
Figure S325. Get High-res Image Gene #62: 'del_13q22.1' versus Clinical Feature #6: 'KARNOFSKY_PERFORMANCE_SCORE'
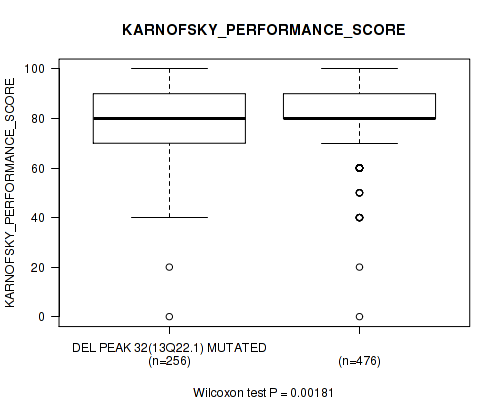
P value = 1e-04 (Fisher's exact test), Q value = 0.00034
Table S326. Gene #62: 'del_13q22.1' versus Clinical Feature #7: 'HISTOLOGICAL_TYPE'
| nPatients | ASTROCYTOMA | GLIOBLASTOMA MULTIFORME (GBM) | OLIGOASTROCYTOMA | OLIGODENDROGLIOMA | TREATED PRIMARY GBM | UNTREATED PRIMARY (DE NOVO) GBM |
|---|---|---|---|---|---|---|
| ALL | 194 | 30 | 129 | 189 | 18 | 525 |
| DEL PEAK 32(13Q22.1) MUTATED | 59 | 10 | 34 | 44 | 5 | 213 |
| DEL PEAK 32(13Q22.1) WILD-TYPE | 135 | 20 | 95 | 145 | 13 | 312 |
Figure S326. Get High-res Image Gene #62: 'del_13q22.1' versus Clinical Feature #7: 'HISTOLOGICAL_TYPE'
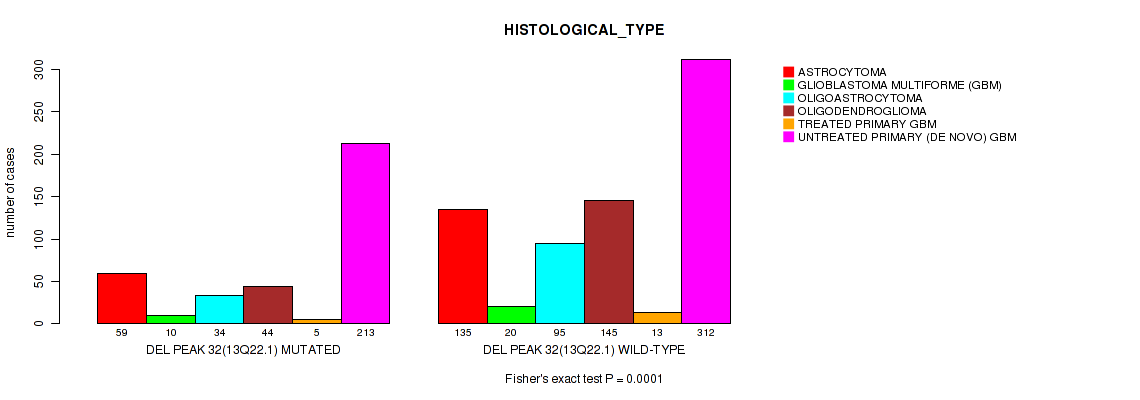
P value = 0.142 (Fisher's exact test), Q value = 0.24
Table S327. Gene #62: 'del_13q22.1' versus Clinical Feature #9: 'ETHNICITY'
| nPatients | HISPANIC OR LATINO | NOT HISPANIC OR LATINO |
|---|---|---|
| ALL | 44 | 921 |
| DEL PEAK 32(13Q22.1) MUTATED | 10 | 314 |
| DEL PEAK 32(13Q22.1) WILD-TYPE | 34 | 607 |
Figure S327. Get High-res Image Gene #62: 'del_13q22.1' versus Clinical Feature #9: 'ETHNICITY'
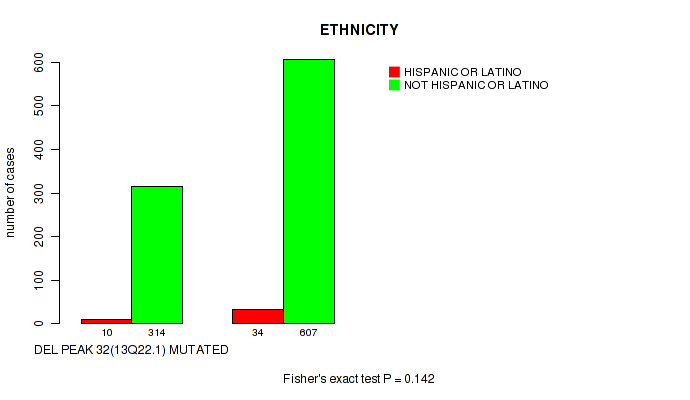
P value = 5.84e-11 (logrank test), Q value = 4.8e-10
Table S328. Gene #63: 'del_14q13.1' versus Clinical Feature #1: 'Time to Death'
| nPatients | nDeath | Duration Range (Median), Month | |
|---|---|---|---|
| ALL | 1078 | 598 | 0.0 - 211.2 (16.0) |
| DEL PEAK 33(14Q13.1) MUTATED | 243 | 170 | 0.1 - 130.8 (13.8) |
| DEL PEAK 33(14Q13.1) WILD-TYPE | 835 | 428 | 0.0 - 211.2 (16.9) |
Figure S328. Get High-res Image Gene #63: 'del_14q13.1' versus Clinical Feature #1: 'Time to Death'
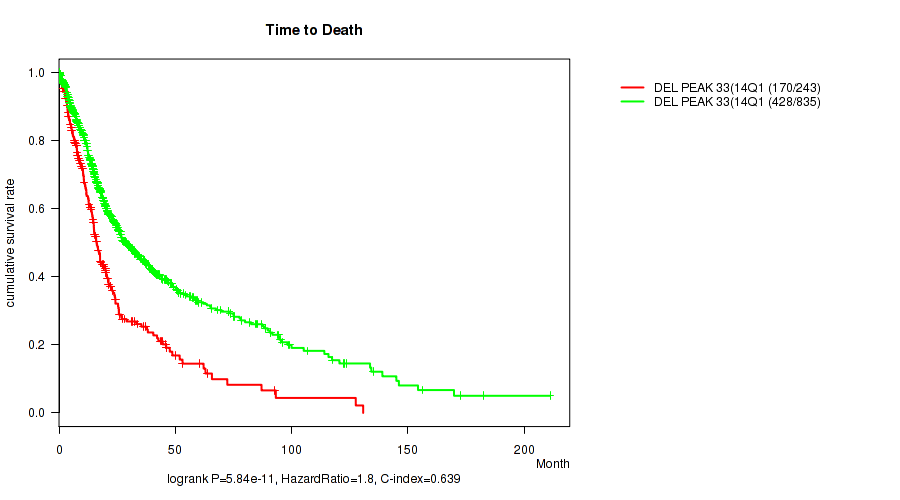
P value = 1.67e-09 (Wilcoxon-test), Q value = 1.1e-08
Table S329. Gene #63: 'del_14q13.1' versus Clinical Feature #2: 'YEARS_TO_BIRTH'
| nPatients | Mean (Std.Dev) | |
|---|---|---|
| ALL | 1084 | 50.8 (15.8) |
| DEL PEAK 33(14Q13.1) MUTATED | 244 | 56.1 (14.3) |
| DEL PEAK 33(14Q13.1) WILD-TYPE | 840 | 49.3 (15.9) |
Figure S329. Get High-res Image Gene #63: 'del_14q13.1' versus Clinical Feature #2: 'YEARS_TO_BIRTH'
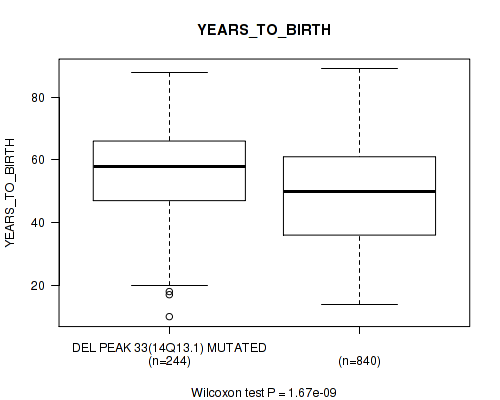
P value = 4.67e-12 (Fisher's exact test), Q value = 4.1e-11
Table S330. Gene #63: 'del_14q13.1' versus Clinical Feature #3: 'TUMOR_TISSUE_SITE'
| nPatients | BRAIN | CENTRAL NERVOUS SYSTEM |
|---|---|---|
| ALL | 573 | 512 |
| DEL PEAK 33(14Q13.1) MUTATED | 176 | 68 |
| DEL PEAK 33(14Q13.1) WILD-TYPE | 397 | 444 |
Figure S330. Get High-res Image Gene #63: 'del_14q13.1' versus Clinical Feature #3: 'TUMOR_TISSUE_SITE'
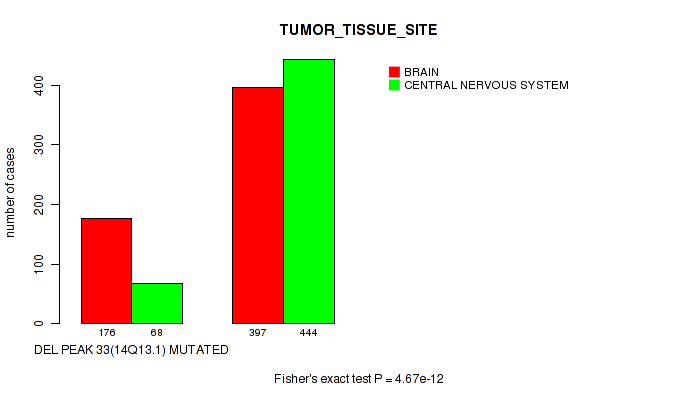
P value = 0.0205 (Fisher's exact test), Q value = 0.046
Table S331. Gene #63: 'del_14q13.1' versus Clinical Feature #5: 'RADIATION_THERAPY'
| nPatients | NO | YES |
|---|---|---|
| ALL | 258 | 770 |
| DEL PEAK 33(14Q13.1) MUTATED | 45 | 188 |
| DEL PEAK 33(14Q13.1) WILD-TYPE | 213 | 582 |
Figure S331. Get High-res Image Gene #63: 'del_14q13.1' versus Clinical Feature #5: 'RADIATION_THERAPY'
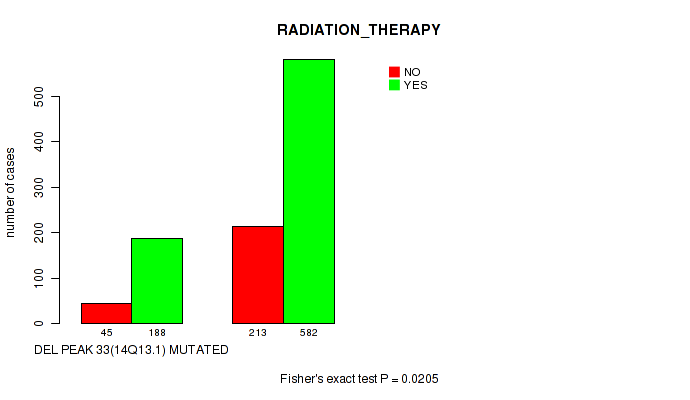
P value = 0.00749 (Wilcoxon-test), Q value = 0.019
Table S332. Gene #63: 'del_14q13.1' versus Clinical Feature #6: 'KARNOFSKY_PERFORMANCE_SCORE'
| nPatients | Mean (Std.Dev) | |
|---|---|---|
| ALL | 732 | 81.1 (15.3) |
| DEL PEAK 33(14Q13.1) MUTATED | 178 | 79.6 (13.1) |
| DEL PEAK 33(14Q13.1) WILD-TYPE | 554 | 81.6 (15.9) |
Figure S332. Get High-res Image Gene #63: 'del_14q13.1' versus Clinical Feature #6: 'KARNOFSKY_PERFORMANCE_SCORE'

P value = 1e-05 (Fisher's exact test), Q value = 3.9e-05
Table S333. Gene #63: 'del_14q13.1' versus Clinical Feature #7: 'HISTOLOGICAL_TYPE'
| nPatients | ASTROCYTOMA | GLIOBLASTOMA MULTIFORME (GBM) | OLIGOASTROCYTOMA | OLIGODENDROGLIOMA | TREATED PRIMARY GBM | UNTREATED PRIMARY (DE NOVO) GBM |
|---|---|---|---|---|---|---|
| ALL | 194 | 30 | 129 | 189 | 18 | 525 |
| DEL PEAK 33(14Q13.1) MUTATED | 31 | 6 | 15 | 22 | 6 | 164 |
| DEL PEAK 33(14Q13.1) WILD-TYPE | 163 | 24 | 114 | 167 | 12 | 361 |
Figure S333. Get High-res Image Gene #63: 'del_14q13.1' versus Clinical Feature #7: 'HISTOLOGICAL_TYPE'
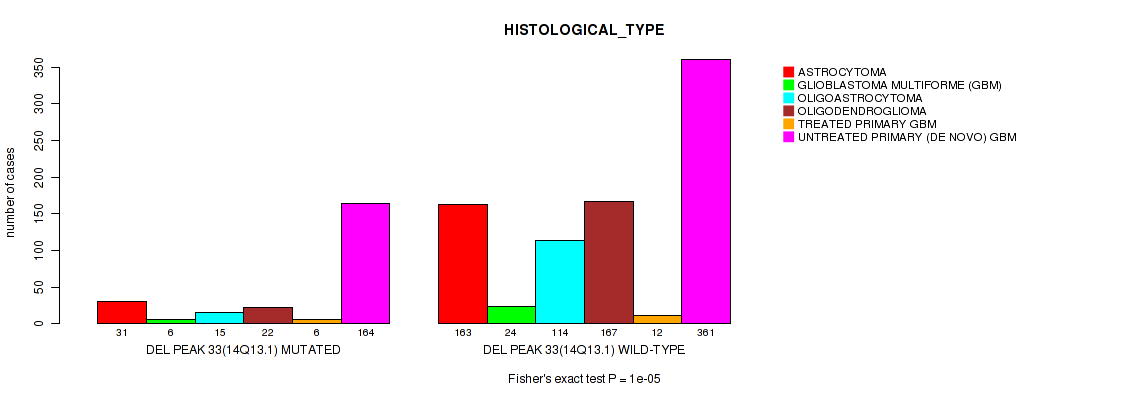
P value = 0.0442 (Fisher's exact test), Q value = 0.089
Table S334. Gene #63: 'del_14q13.1' versus Clinical Feature #8: 'RACE'
| nPatients | AMERICAN INDIAN OR ALASKA NATIVE | ASIAN | BLACK OR AFRICAN AMERICAN | WHITE |
|---|---|---|---|---|
| ALL | 1 | 21 | 71 | 959 |
| DEL PEAK 33(14Q13.1) MUTATED | 1 | 4 | 23 | 205 |
| DEL PEAK 33(14Q13.1) WILD-TYPE | 0 | 17 | 48 | 754 |
Figure S334. Get High-res Image Gene #63: 'del_14q13.1' versus Clinical Feature #8: 'RACE'
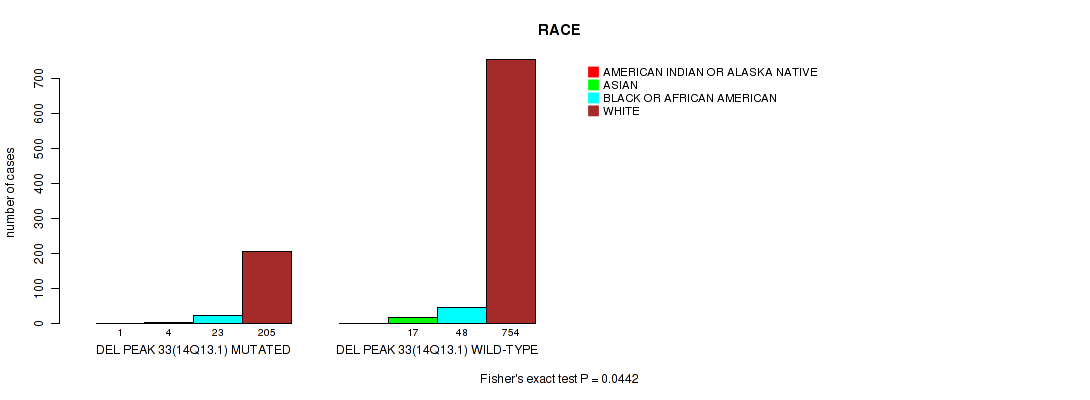
P value = 0.0568 (Fisher's exact test), Q value = 0.11
Table S335. Gene #63: 'del_14q13.1' versus Clinical Feature #9: 'ETHNICITY'
| nPatients | HISPANIC OR LATINO | NOT HISPANIC OR LATINO |
|---|---|---|
| ALL | 44 | 921 |
| DEL PEAK 33(14Q13.1) MUTATED | 4 | 201 |
| DEL PEAK 33(14Q13.1) WILD-TYPE | 40 | 720 |
Figure S335. Get High-res Image Gene #63: 'del_14q13.1' versus Clinical Feature #9: 'ETHNICITY'
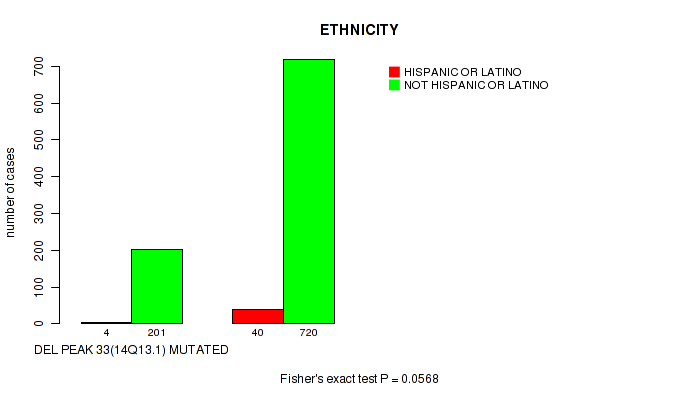
P value = 0.00327 (logrank test), Q value = 0.009
Table S336. Gene #64: 'del_14q24.2' versus Clinical Feature #1: 'Time to Death'
| nPatients | nDeath | Duration Range (Median), Month | |
|---|---|---|---|
| ALL | 1078 | 598 | 0.0 - 211.2 (16.0) |
| DEL PEAK 34(14Q24.2) MUTATED | 289 | 183 | 0.1 - 130.8 (15.3) |
| DEL PEAK 34(14Q24.2) WILD-TYPE | 789 | 415 | 0.0 - 211.2 (16.2) |
Figure S336. Get High-res Image Gene #64: 'del_14q24.2' versus Clinical Feature #1: 'Time to Death'
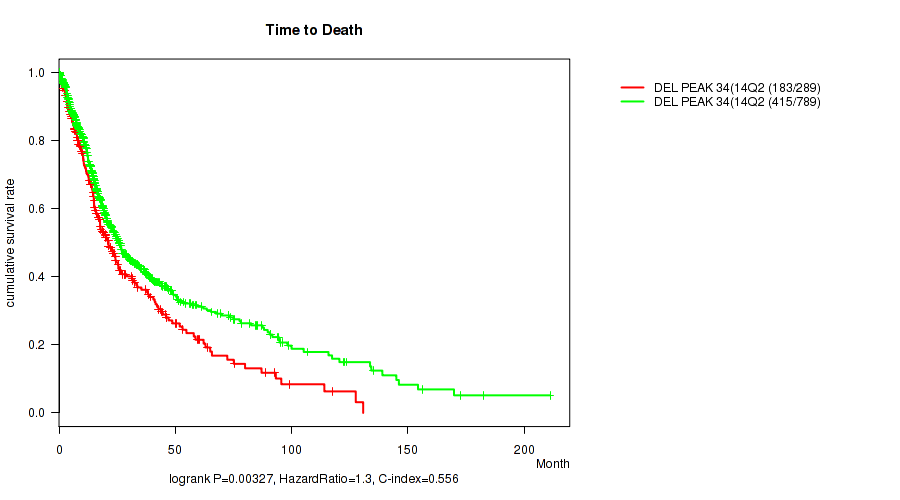
P value = 0.0938 (Wilcoxon-test), Q value = 0.17
Table S337. Gene #64: 'del_14q24.2' versus Clinical Feature #2: 'YEARS_TO_BIRTH'
| nPatients | Mean (Std.Dev) | |
|---|---|---|
| ALL | 1084 | 50.8 (15.8) |
| DEL PEAK 34(14Q24.2) MUTATED | 291 | 52.1 (15.7) |
| DEL PEAK 34(14Q24.2) WILD-TYPE | 793 | 50.3 (15.8) |
Figure S337. Get High-res Image Gene #64: 'del_14q24.2' versus Clinical Feature #2: 'YEARS_TO_BIRTH'

P value = 0.0196 (Fisher's exact test), Q value = 0.044
Table S338. Gene #64: 'del_14q24.2' versus Clinical Feature #3: 'TUMOR_TISSUE_SITE'
| nPatients | BRAIN | CENTRAL NERVOUS SYSTEM |
|---|---|---|
| ALL | 573 | 512 |
| DEL PEAK 34(14Q24.2) MUTATED | 171 | 120 |
| DEL PEAK 34(14Q24.2) WILD-TYPE | 402 | 392 |
Figure S338. Get High-res Image Gene #64: 'del_14q24.2' versus Clinical Feature #3: 'TUMOR_TISSUE_SITE'
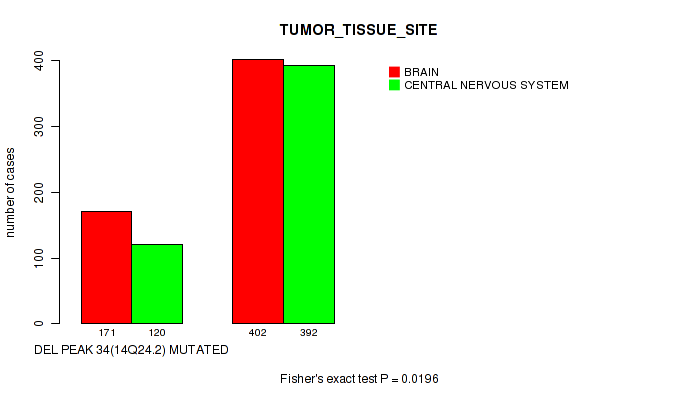
P value = 0.0516 (Fisher's exact test), Q value = 0.1
Table S339. Gene #64: 'del_14q24.2' versus Clinical Feature #4: 'GENDER'
| nPatients | FEMALE | MALE |
|---|---|---|
| ALL | 453 | 632 |
| DEL PEAK 34(14Q24.2) MUTATED | 136 | 155 |
| DEL PEAK 34(14Q24.2) WILD-TYPE | 317 | 477 |
Figure S339. Get High-res Image Gene #64: 'del_14q24.2' versus Clinical Feature #4: 'GENDER'
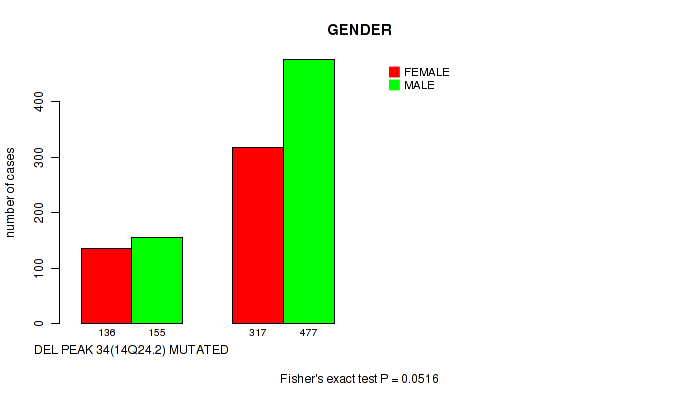
P value = 0.0405 (Fisher's exact test), Q value = 0.082
Table S340. Gene #64: 'del_14q24.2' versus Clinical Feature #7: 'HISTOLOGICAL_TYPE'
| nPatients | ASTROCYTOMA | GLIOBLASTOMA MULTIFORME (GBM) | OLIGOASTROCYTOMA | OLIGODENDROGLIOMA | TREATED PRIMARY GBM | UNTREATED PRIMARY (DE NOVO) GBM |
|---|---|---|---|---|---|---|
| ALL | 194 | 30 | 129 | 189 | 18 | 525 |
| DEL PEAK 34(14Q24.2) MUTATED | 53 | 5 | 28 | 39 | 7 | 159 |
| DEL PEAK 34(14Q24.2) WILD-TYPE | 141 | 25 | 101 | 150 | 11 | 366 |
Figure S340. Get High-res Image Gene #64: 'del_14q24.2' versus Clinical Feature #7: 'HISTOLOGICAL_TYPE'
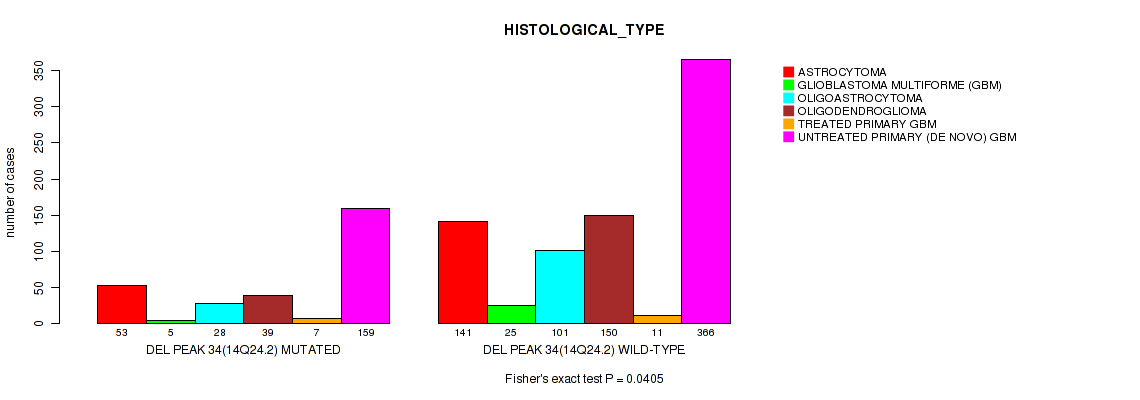
P value = 0.00451 (logrank test), Q value = 0.012
Table S341. Gene #65: 'del_14q31.3' versus Clinical Feature #1: 'Time to Death'
| nPatients | nDeath | Duration Range (Median), Month | |
|---|---|---|---|
| ALL | 1078 | 598 | 0.0 - 211.2 (16.0) |
| DEL PEAK 35(14Q31.3) MUTATED | 273 | 171 | 0.1 - 130.8 (15.7) |
| DEL PEAK 35(14Q31.3) WILD-TYPE | 805 | 427 | 0.0 - 211.2 (16.1) |
Figure S341. Get High-res Image Gene #65: 'del_14q31.3' versus Clinical Feature #1: 'Time to Death'
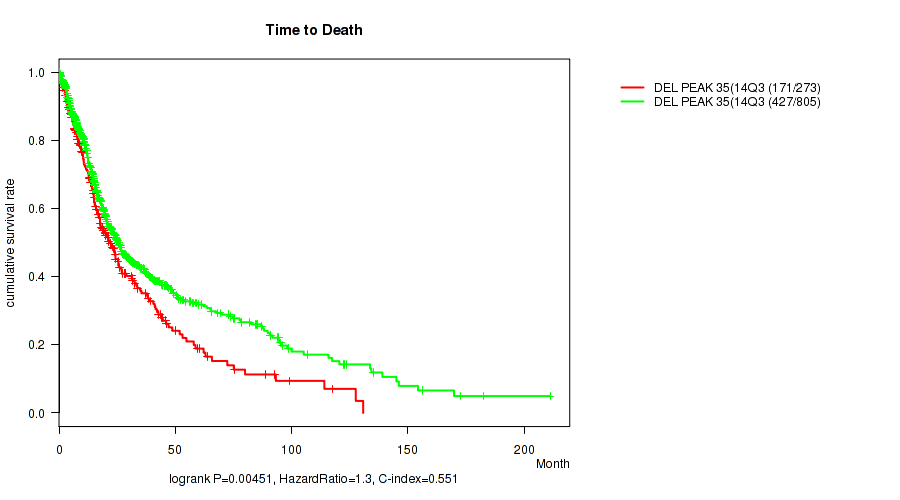
P value = 0.0999 (Wilcoxon-test), Q value = 0.18
Table S342. Gene #65: 'del_14q31.3' versus Clinical Feature #2: 'YEARS_TO_BIRTH'
| nPatients | Mean (Std.Dev) | |
|---|---|---|
| ALL | 1084 | 50.8 (15.8) |
| DEL PEAK 35(14Q31.3) MUTATED | 275 | 52.1 (15.6) |
| DEL PEAK 35(14Q31.3) WILD-TYPE | 809 | 50.4 (15.8) |
Figure S342. Get High-res Image Gene #65: 'del_14q31.3' versus Clinical Feature #2: 'YEARS_TO_BIRTH'
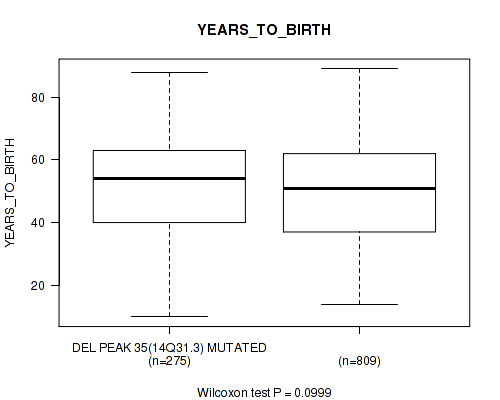
P value = 0.0591 (Fisher's exact test), Q value = 0.11
Table S343. Gene #65: 'del_14q31.3' versus Clinical Feature #3: 'TUMOR_TISSUE_SITE'
| nPatients | BRAIN | CENTRAL NERVOUS SYSTEM |
|---|---|---|
| ALL | 573 | 512 |
| DEL PEAK 35(14Q31.3) MUTATED | 159 | 116 |
| DEL PEAK 35(14Q31.3) WILD-TYPE | 414 | 396 |
Figure S343. Get High-res Image Gene #65: 'del_14q31.3' versus Clinical Feature #3: 'TUMOR_TISSUE_SITE'
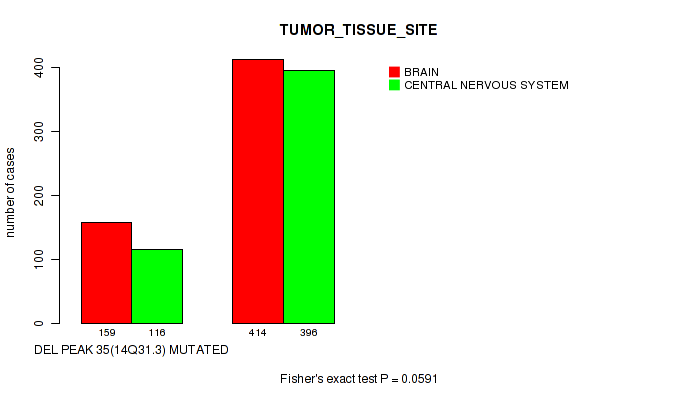
P value = 0.0477 (Fisher's exact test), Q value = 0.095
Table S344. Gene #65: 'del_14q31.3' versus Clinical Feature #4: 'GENDER'
| nPatients | FEMALE | MALE |
|---|---|---|
| ALL | 453 | 632 |
| DEL PEAK 35(14Q31.3) MUTATED | 129 | 146 |
| DEL PEAK 35(14Q31.3) WILD-TYPE | 324 | 486 |
Figure S344. Get High-res Image Gene #65: 'del_14q31.3' versus Clinical Feature #4: 'GENDER'
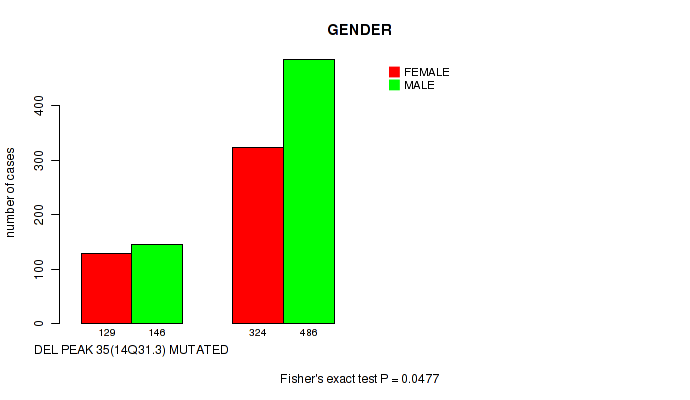
P value = 0.0768 (Fisher's exact test), Q value = 0.14
Table S345. Gene #65: 'del_14q31.3' versus Clinical Feature #7: 'HISTOLOGICAL_TYPE'
| nPatients | ASTROCYTOMA | GLIOBLASTOMA MULTIFORME (GBM) | OLIGOASTROCYTOMA | OLIGODENDROGLIOMA | TREATED PRIMARY GBM | UNTREATED PRIMARY (DE NOVO) GBM |
|---|---|---|---|---|---|---|
| ALL | 194 | 30 | 129 | 189 | 18 | 525 |
| DEL PEAK 35(14Q31.3) MUTATED | 51 | 6 | 29 | 36 | 8 | 145 |
| DEL PEAK 35(14Q31.3) WILD-TYPE | 143 | 24 | 100 | 153 | 10 | 380 |
Figure S345. Get High-res Image Gene #65: 'del_14q31.3' versus Clinical Feature #7: 'HISTOLOGICAL_TYPE'
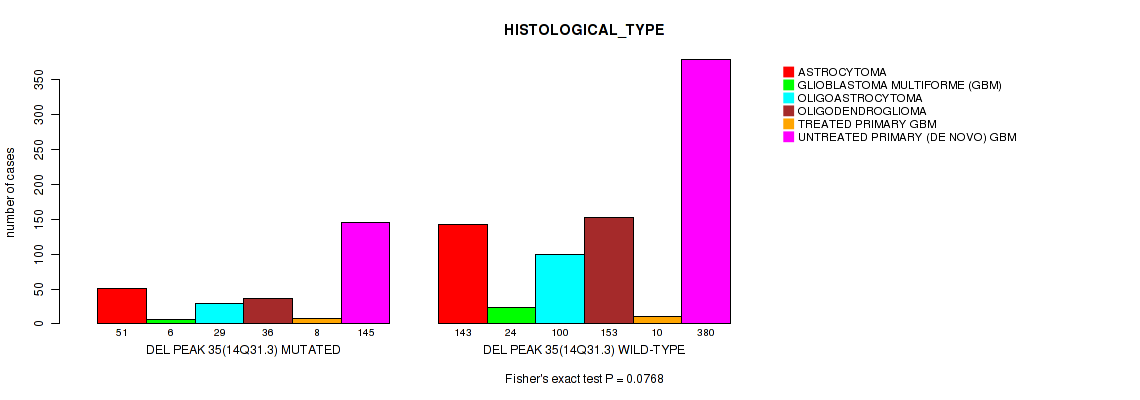
P value = 0.0962 (Fisher's exact test), Q value = 0.17
Table S346. Gene #65: 'del_14q31.3' versus Clinical Feature #8: 'RACE'
| nPatients | AMERICAN INDIAN OR ALASKA NATIVE | ASIAN | BLACK OR AFRICAN AMERICAN | WHITE |
|---|---|---|---|---|
| ALL | 1 | 21 | 71 | 959 |
| DEL PEAK 35(14Q31.3) MUTATED | 1 | 6 | 24 | 235 |
| DEL PEAK 35(14Q31.3) WILD-TYPE | 0 | 15 | 47 | 724 |
Figure S346. Get High-res Image Gene #65: 'del_14q31.3' versus Clinical Feature #8: 'RACE'
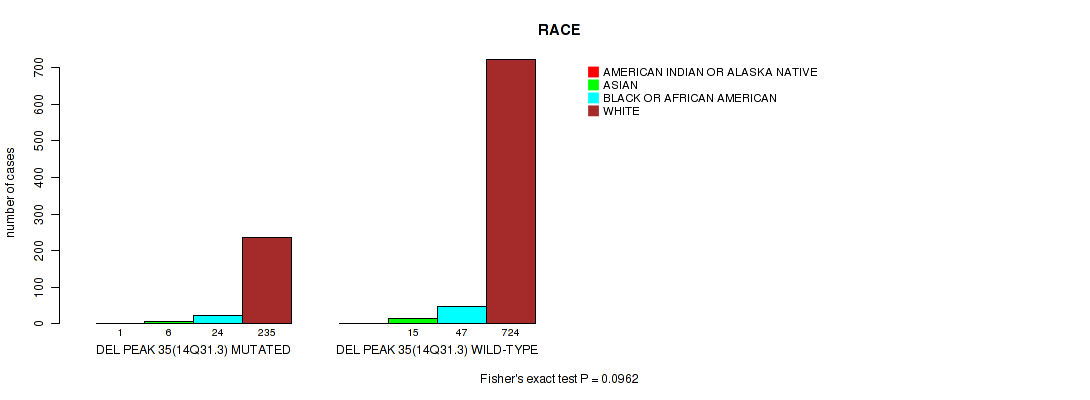
P value = 2.78e-08 (logrank test), Q value = 1.7e-07
Table S347. Gene #66: 'del_15q14' versus Clinical Feature #1: 'Time to Death'
| nPatients | nDeath | Duration Range (Median), Month | |
|---|---|---|---|
| ALL | 1078 | 598 | 0.0 - 211.2 (16.0) |
| DEL PEAK 36(15Q14) MUTATED | 213 | 150 | 0.2 - 134.3 (14.2) |
| DEL PEAK 36(15Q14) WILD-TYPE | 865 | 448 | 0.0 - 211.2 (16.8) |
Figure S347. Get High-res Image Gene #66: 'del_15q14' versus Clinical Feature #1: 'Time to Death'
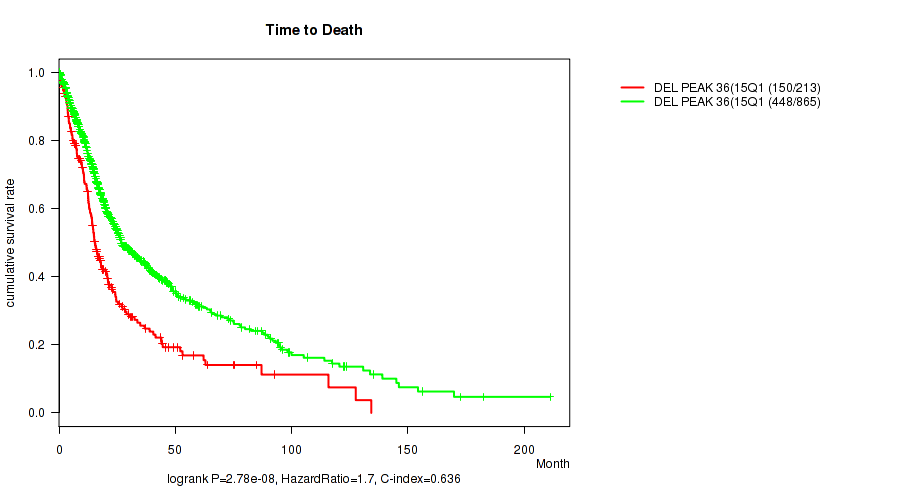
P value = 3.15e-07 (Wilcoxon-test), Q value = 1.8e-06
Table S348. Gene #66: 'del_15q14' versus Clinical Feature #2: 'YEARS_TO_BIRTH'
| nPatients | Mean (Std.Dev) | |
|---|---|---|
| ALL | 1084 | 50.8 (15.8) |
| DEL PEAK 36(15Q14) MUTATED | 214 | 55.9 (15.8) |
| DEL PEAK 36(15Q14) WILD-TYPE | 870 | 49.6 (15.5) |
Figure S348. Get High-res Image Gene #66: 'del_15q14' versus Clinical Feature #2: 'YEARS_TO_BIRTH'
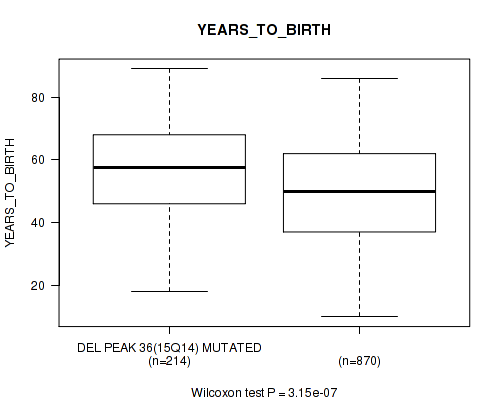
P value = 4.6e-10 (Fisher's exact test), Q value = 3.3e-09
Table S349. Gene #66: 'del_15q14' versus Clinical Feature #3: 'TUMOR_TISSUE_SITE'
| nPatients | BRAIN | CENTRAL NERVOUS SYSTEM |
|---|---|---|
| ALL | 573 | 512 |
| DEL PEAK 36(15Q14) MUTATED | 154 | 61 |
| DEL PEAK 36(15Q14) WILD-TYPE | 419 | 451 |
Figure S349. Get High-res Image Gene #66: 'del_15q14' versus Clinical Feature #3: 'TUMOR_TISSUE_SITE'
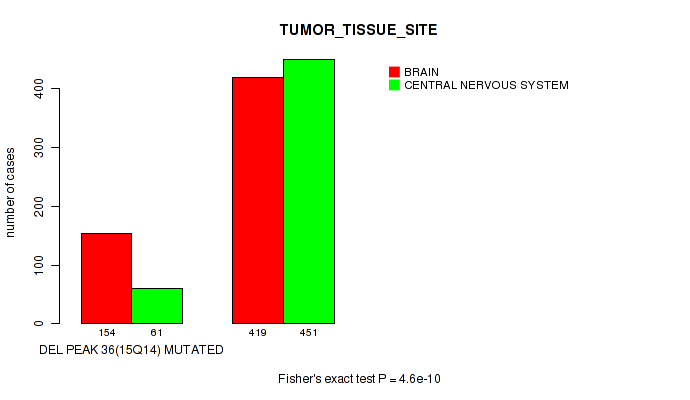
P value = 0.0244 (Wilcoxon-test), Q value = 0.053
Table S350. Gene #66: 'del_15q14' versus Clinical Feature #6: 'KARNOFSKY_PERFORMANCE_SCORE'
| nPatients | Mean (Std.Dev) | |
|---|---|---|
| ALL | 732 | 81.1 (15.3) |
| DEL PEAK 36(15Q14) MUTATED | 134 | 78.5 (16.8) |
| DEL PEAK 36(15Q14) WILD-TYPE | 598 | 81.7 (14.9) |
Figure S350. Get High-res Image Gene #66: 'del_15q14' versus Clinical Feature #6: 'KARNOFSKY_PERFORMANCE_SCORE'
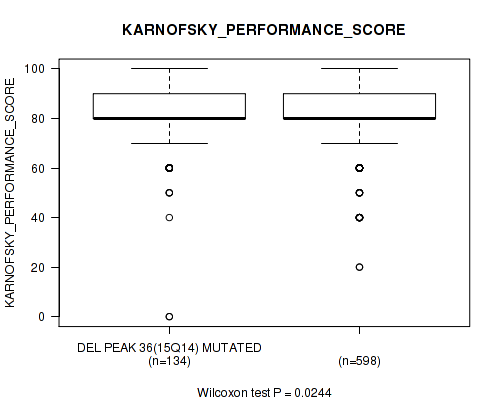
P value = 1e-05 (Fisher's exact test), Q value = 3.9e-05
Table S351. Gene #66: 'del_15q14' versus Clinical Feature #7: 'HISTOLOGICAL_TYPE'
| nPatients | ASTROCYTOMA | GLIOBLASTOMA MULTIFORME (GBM) | OLIGOASTROCYTOMA | OLIGODENDROGLIOMA | TREATED PRIMARY GBM | UNTREATED PRIMARY (DE NOVO) GBM |
|---|---|---|---|---|---|---|
| ALL | 194 | 30 | 129 | 189 | 18 | 525 |
| DEL PEAK 36(15Q14) MUTATED | 25 | 10 | 14 | 22 | 4 | 140 |
| DEL PEAK 36(15Q14) WILD-TYPE | 169 | 20 | 115 | 167 | 14 | 385 |
Figure S351. Get High-res Image Gene #66: 'del_15q14' versus Clinical Feature #7: 'HISTOLOGICAL_TYPE'
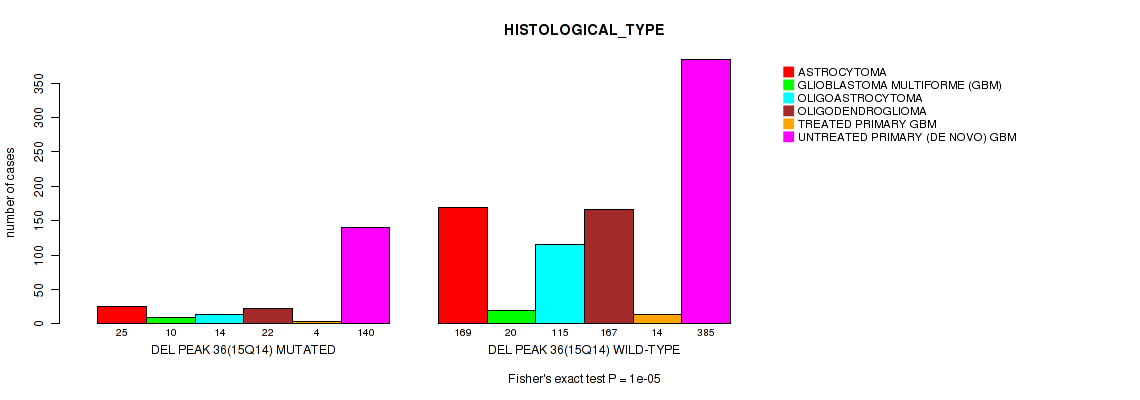
P value = 1.63e-10 (logrank test), Q value = 1.3e-09
Table S352. Gene #67: 'del_16p12.2' versus Clinical Feature #1: 'Time to Death'
| nPatients | nDeath | Duration Range (Median), Month | |
|---|---|---|---|
| ALL | 1078 | 598 | 0.0 - 211.2 (16.0) |
| DEL PEAK 37(16P12.2) MUTATED | 113 | 93 | 0.4 - 78.3 (15.0) |
| DEL PEAK 37(16P12.2) WILD-TYPE | 965 | 505 | 0.0 - 211.2 (16.2) |
Figure S352. Get High-res Image Gene #67: 'del_16p12.2' versus Clinical Feature #1: 'Time to Death'
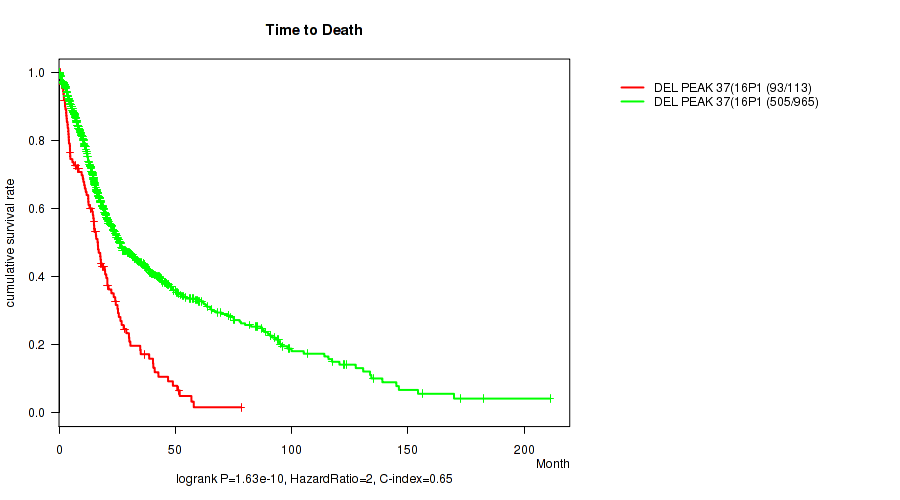
P value = 1.28e-07 (Wilcoxon-test), Q value = 7.5e-07
Table S353. Gene #67: 'del_16p12.2' versus Clinical Feature #2: 'YEARS_TO_BIRTH'
| nPatients | Mean (Std.Dev) | |
|---|---|---|
| ALL | 1084 | 50.8 (15.8) |
| DEL PEAK 37(16P12.2) MUTATED | 114 | 58.3 (14.3) |
| DEL PEAK 37(16P12.2) WILD-TYPE | 970 | 49.9 (15.7) |
Figure S353. Get High-res Image Gene #67: 'del_16p12.2' versus Clinical Feature #2: 'YEARS_TO_BIRTH'
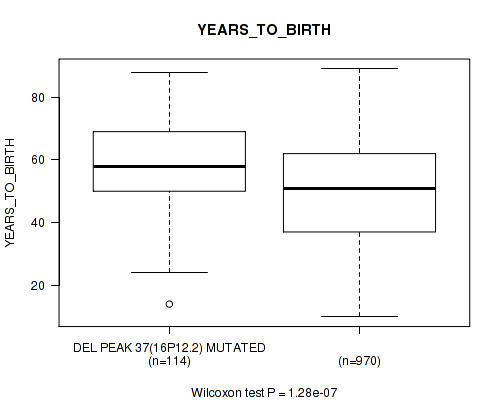
P value = 8.54e-11 (Fisher's exact test), Q value = 6.8e-10
Table S354. Gene #67: 'del_16p12.2' versus Clinical Feature #3: 'TUMOR_TISSUE_SITE'
| nPatients | BRAIN | CENTRAL NERVOUS SYSTEM |
|---|---|---|
| ALL | 573 | 512 |
| DEL PEAK 37(16P12.2) MUTATED | 92 | 22 |
| DEL PEAK 37(16P12.2) WILD-TYPE | 481 | 490 |
Figure S354. Get High-res Image Gene #67: 'del_16p12.2' versus Clinical Feature #3: 'TUMOR_TISSUE_SITE'
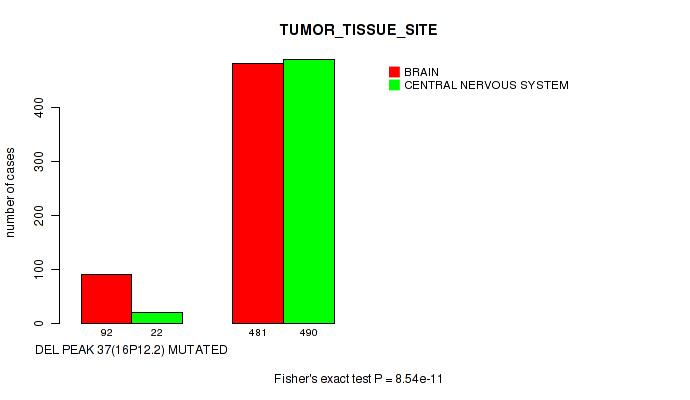
P value = 0.0609 (Fisher's exact test), Q value = 0.12
Table S355. Gene #67: 'del_16p12.2' versus Clinical Feature #5: 'RADIATION_THERAPY'
| nPatients | NO | YES |
|---|---|---|
| ALL | 258 | 770 |
| DEL PEAK 37(16P12.2) MUTATED | 19 | 90 |
| DEL PEAK 37(16P12.2) WILD-TYPE | 239 | 680 |
Figure S355. Get High-res Image Gene #67: 'del_16p12.2' versus Clinical Feature #5: 'RADIATION_THERAPY'

P value = 1e-05 (Fisher's exact test), Q value = 3.9e-05
Table S356. Gene #67: 'del_16p12.2' versus Clinical Feature #7: 'HISTOLOGICAL_TYPE'
| nPatients | ASTROCYTOMA | GLIOBLASTOMA MULTIFORME (GBM) | OLIGOASTROCYTOMA | OLIGODENDROGLIOMA | TREATED PRIMARY GBM | UNTREATED PRIMARY (DE NOVO) GBM |
|---|---|---|---|---|---|---|
| ALL | 194 | 30 | 129 | 189 | 18 | 525 |
| DEL PEAK 37(16P12.2) MUTATED | 14 | 3 | 3 | 5 | 1 | 88 |
| DEL PEAK 37(16P12.2) WILD-TYPE | 180 | 27 | 126 | 184 | 17 | 437 |
Figure S356. Get High-res Image Gene #67: 'del_16p12.2' versus Clinical Feature #7: 'HISTOLOGICAL_TYPE'

P value = 2.54e-10 (logrank test), Q value = 1.9e-09
Table S357. Gene #68: 'del_16q23.1' versus Clinical Feature #1: 'Time to Death'
| nPatients | nDeath | Duration Range (Median), Month | |
|---|---|---|---|
| ALL | 1078 | 598 | 0.0 - 211.2 (16.0) |
| DEL PEAK 38(16Q23.1) MUTATED | 128 | 102 | 0.1 - 127.6 (13.1) |
| DEL PEAK 38(16Q23.1) WILD-TYPE | 950 | 496 | 0.0 - 211.2 (16.6) |
Figure S357. Get High-res Image Gene #68: 'del_16q23.1' versus Clinical Feature #1: 'Time to Death'
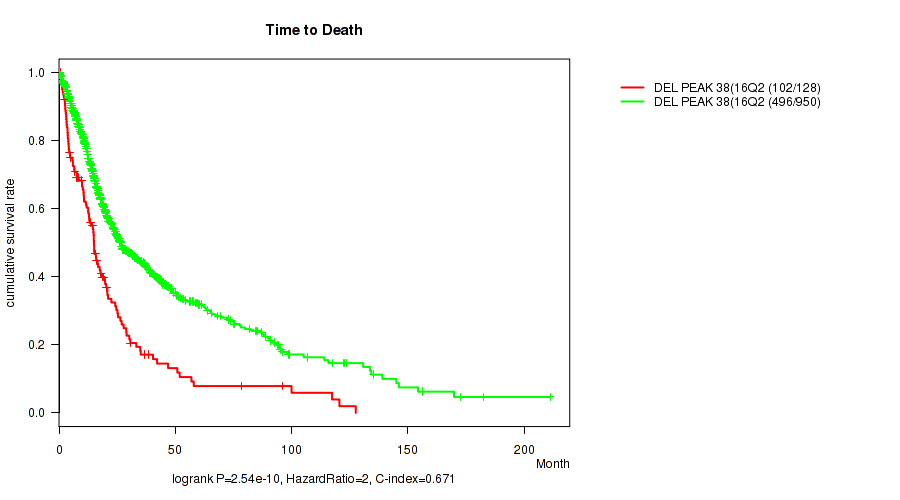
P value = 4.11e-05 (Wilcoxon-test), Q value = 0.00015
Table S358. Gene #68: 'del_16q23.1' versus Clinical Feature #2: 'YEARS_TO_BIRTH'
| nPatients | Mean (Std.Dev) | |
|---|---|---|
| ALL | 1084 | 50.8 (15.8) |
| DEL PEAK 38(16Q23.1) MUTATED | 128 | 56.0 (14.9) |
| DEL PEAK 38(16Q23.1) WILD-TYPE | 956 | 50.1 (15.8) |
Figure S358. Get High-res Image Gene #68: 'del_16q23.1' versus Clinical Feature #2: 'YEARS_TO_BIRTH'
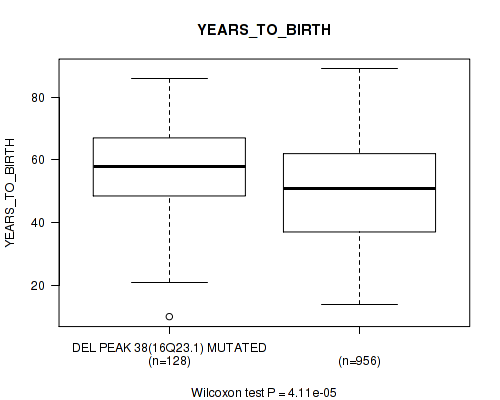
P value = 4.36e-10 (Fisher's exact test), Q value = 3.2e-09
Table S359. Gene #68: 'del_16q23.1' versus Clinical Feature #3: 'TUMOR_TISSUE_SITE'
| nPatients | BRAIN | CENTRAL NERVOUS SYSTEM |
|---|---|---|
| ALL | 573 | 512 |
| DEL PEAK 38(16Q23.1) MUTATED | 100 | 28 |
| DEL PEAK 38(16Q23.1) WILD-TYPE | 473 | 484 |
Figure S359. Get High-res Image Gene #68: 'del_16q23.1' versus Clinical Feature #3: 'TUMOR_TISSUE_SITE'

P value = 0.0911 (Fisher's exact test), Q value = 0.17
Table S360. Gene #68: 'del_16q23.1' versus Clinical Feature #5: 'RADIATION_THERAPY'
| nPatients | NO | YES |
|---|---|---|
| ALL | 258 | 770 |
| DEL PEAK 38(16Q23.1) MUTATED | 22 | 96 |
| DEL PEAK 38(16Q23.1) WILD-TYPE | 236 | 674 |
Figure S360. Get High-res Image Gene #68: 'del_16q23.1' versus Clinical Feature #5: 'RADIATION_THERAPY'
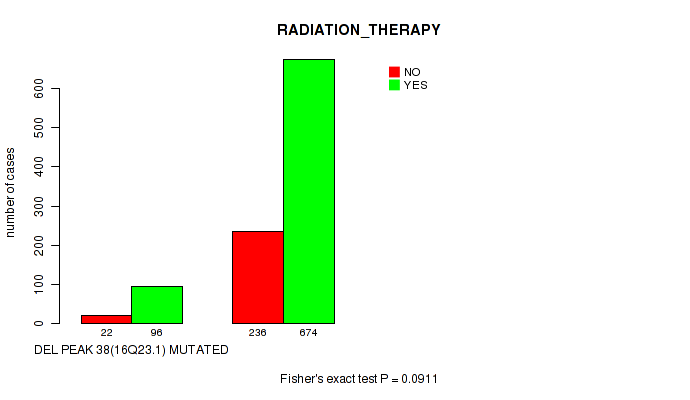
P value = 0.00745 (Wilcoxon-test), Q value = 0.019
Table S361. Gene #68: 'del_16q23.1' versus Clinical Feature #6: 'KARNOFSKY_PERFORMANCE_SCORE'
| nPatients | Mean (Std.Dev) | |
|---|---|---|
| ALL | 732 | 81.1 (15.3) |
| DEL PEAK 38(16Q23.1) MUTATED | 89 | 76.5 (18.3) |
| DEL PEAK 38(16Q23.1) WILD-TYPE | 643 | 81.7 (14.7) |
Figure S361. Get High-res Image Gene #68: 'del_16q23.1' versus Clinical Feature #6: 'KARNOFSKY_PERFORMANCE_SCORE'
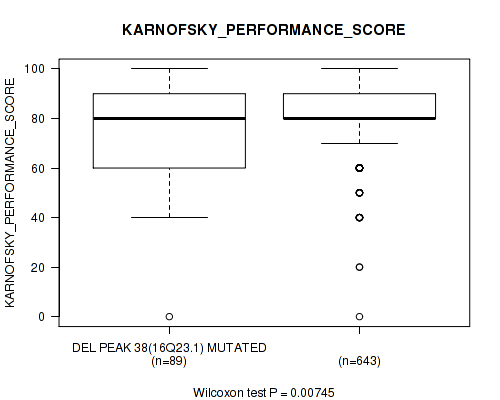
P value = 1e-05 (Fisher's exact test), Q value = 3.9e-05
Table S362. Gene #68: 'del_16q23.1' versus Clinical Feature #7: 'HISTOLOGICAL_TYPE'
| nPatients | ASTROCYTOMA | GLIOBLASTOMA MULTIFORME (GBM) | OLIGOASTROCYTOMA | OLIGODENDROGLIOMA | TREATED PRIMARY GBM | UNTREATED PRIMARY (DE NOVO) GBM |
|---|---|---|---|---|---|---|
| ALL | 194 | 30 | 129 | 189 | 18 | 525 |
| DEL PEAK 38(16Q23.1) MUTATED | 15 | 4 | 6 | 7 | 2 | 94 |
| DEL PEAK 38(16Q23.1) WILD-TYPE | 179 | 26 | 123 | 182 | 16 | 431 |
Figure S362. Get High-res Image Gene #68: 'del_16q23.1' versus Clinical Feature #7: 'HISTOLOGICAL_TYPE'

P value = 2.65e-10 (logrank test), Q value = 2e-09
Table S363. Gene #69: 'del_17p13.1' versus Clinical Feature #1: 'Time to Death'
| nPatients | nDeath | Duration Range (Median), Month | |
|---|---|---|---|
| ALL | 1078 | 598 | 0.0 - 211.2 (16.0) |
| DEL PEAK 39(17P13.1) MUTATED | 116 | 86 | 0.1 - 92.7 (11.7) |
| DEL PEAK 39(17P13.1) WILD-TYPE | 962 | 512 | 0.0 - 211.2 (16.8) |
Figure S363. Get High-res Image Gene #69: 'del_17p13.1' versus Clinical Feature #1: 'Time to Death'

P value = 1.71e-07 (Wilcoxon-test), Q value = 9.9e-07
Table S364. Gene #69: 'del_17p13.1' versus Clinical Feature #2: 'YEARS_TO_BIRTH'
| nPatients | Mean (Std.Dev) | |
|---|---|---|
| ALL | 1084 | 50.8 (15.8) |
| DEL PEAK 39(17P13.1) MUTATED | 116 | 58.0 (14.9) |
| DEL PEAK 39(17P13.1) WILD-TYPE | 968 | 50.0 (15.7) |
Figure S364. Get High-res Image Gene #69: 'del_17p13.1' versus Clinical Feature #2: 'YEARS_TO_BIRTH'
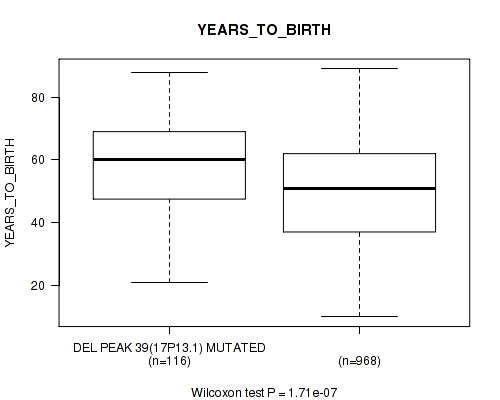
P value = 5.36e-14 (Fisher's exact test), Q value = 5.7e-13
Table S365. Gene #69: 'del_17p13.1' versus Clinical Feature #3: 'TUMOR_TISSUE_SITE'
| nPatients | BRAIN | CENTRAL NERVOUS SYSTEM |
|---|---|---|
| ALL | 573 | 512 |
| DEL PEAK 39(17P13.1) MUTATED | 98 | 18 |
| DEL PEAK 39(17P13.1) WILD-TYPE | 475 | 494 |
Figure S365. Get High-res Image Gene #69: 'del_17p13.1' versus Clinical Feature #3: 'TUMOR_TISSUE_SITE'
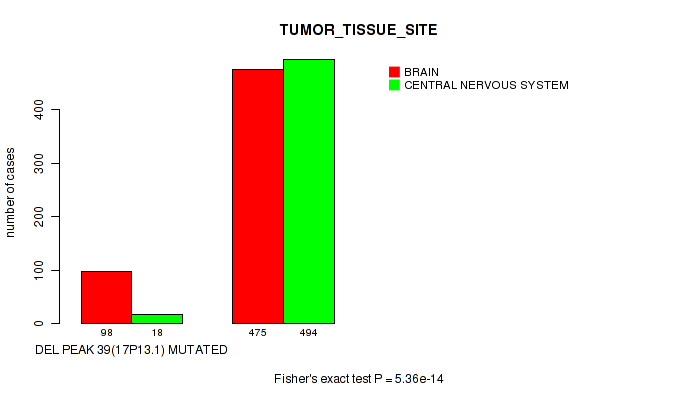
P value = 0.136 (Fisher's exact test), Q value = 0.23
Table S366. Gene #69: 'del_17p13.1' versus Clinical Feature #4: 'GENDER'
| nPatients | FEMALE | MALE |
|---|---|---|
| ALL | 453 | 632 |
| DEL PEAK 39(17P13.1) MUTATED | 56 | 60 |
| DEL PEAK 39(17P13.1) WILD-TYPE | 397 | 572 |
Figure S366. Get High-res Image Gene #69: 'del_17p13.1' versus Clinical Feature #4: 'GENDER'

P value = 0.0345 (Fisher's exact test), Q value = 0.071
Table S367. Gene #69: 'del_17p13.1' versus Clinical Feature #5: 'RADIATION_THERAPY'
| nPatients | NO | YES |
|---|---|---|
| ALL | 258 | 770 |
| DEL PEAK 39(17P13.1) MUTATED | 18 | 90 |
| DEL PEAK 39(17P13.1) WILD-TYPE | 240 | 680 |
Figure S367. Get High-res Image Gene #69: 'del_17p13.1' versus Clinical Feature #5: 'RADIATION_THERAPY'

P value = 0.00479 (Wilcoxon-test), Q value = 0.013
Table S368. Gene #69: 'del_17p13.1' versus Clinical Feature #6: 'KARNOFSKY_PERFORMANCE_SCORE'
| nPatients | Mean (Std.Dev) | |
|---|---|---|
| ALL | 732 | 81.1 (15.3) |
| DEL PEAK 39(17P13.1) MUTATED | 81 | 76.4 (17.9) |
| DEL PEAK 39(17P13.1) WILD-TYPE | 651 | 81.7 (14.8) |
Figure S368. Get High-res Image Gene #69: 'del_17p13.1' versus Clinical Feature #6: 'KARNOFSKY_PERFORMANCE_SCORE'
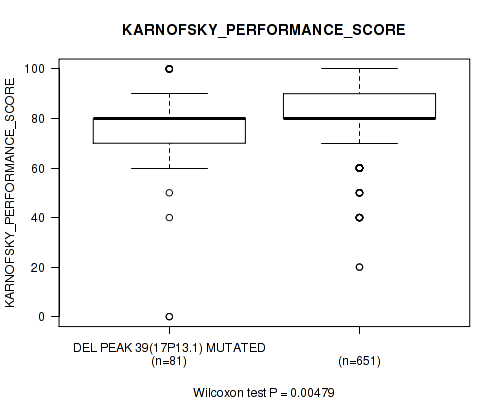
P value = 1e-05 (Fisher's exact test), Q value = 3.9e-05
Table S369. Gene #69: 'del_17p13.1' versus Clinical Feature #7: 'HISTOLOGICAL_TYPE'
| nPatients | ASTROCYTOMA | GLIOBLASTOMA MULTIFORME (GBM) | OLIGOASTROCYTOMA | OLIGODENDROGLIOMA | TREATED PRIMARY GBM | UNTREATED PRIMARY (DE NOVO) GBM |
|---|---|---|---|---|---|---|
| ALL | 194 | 30 | 129 | 189 | 18 | 525 |
| DEL PEAK 39(17P13.1) MUTATED | 6 | 6 | 4 | 8 | 3 | 89 |
| DEL PEAK 39(17P13.1) WILD-TYPE | 188 | 24 | 125 | 181 | 15 | 436 |
Figure S369. Get High-res Image Gene #69: 'del_17p13.1' versus Clinical Feature #7: 'HISTOLOGICAL_TYPE'

P value = 5.28e-09 (logrank test), Q value = 3.3e-08
Table S370. Gene #70: 'del_17q11.2' versus Clinical Feature #1: 'Time to Death'
| nPatients | nDeath | Duration Range (Median), Month | |
|---|---|---|---|
| ALL | 1078 | 598 | 0.0 - 211.2 (16.0) |
| DEL PEAK 40(17Q11.2) MUTATED | 93 | 68 | 0.1 - 92.7 (11.8) |
| DEL PEAK 40(17Q11.2) WILD-TYPE | 985 | 530 | 0.0 - 211.2 (16.6) |
Figure S370. Get High-res Image Gene #70: 'del_17q11.2' versus Clinical Feature #1: 'Time to Death'
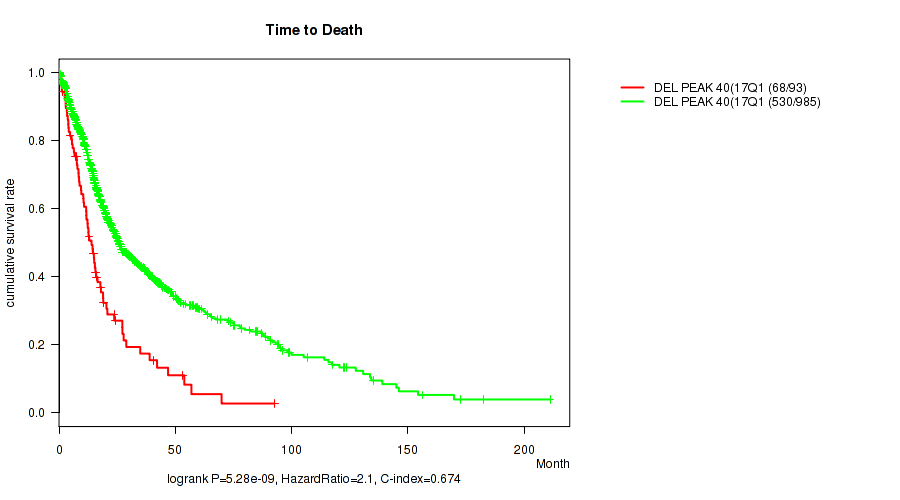
P value = 7.99e-05 (Wilcoxon-test), Q value = 0.00028
Table S371. Gene #70: 'del_17q11.2' versus Clinical Feature #2: 'YEARS_TO_BIRTH'
| nPatients | Mean (Std.Dev) | |
|---|---|---|
| ALL | 1084 | 50.8 (15.8) |
| DEL PEAK 40(17Q11.2) MUTATED | 93 | 56.8 (13.5) |
| DEL PEAK 40(17Q11.2) WILD-TYPE | 991 | 50.3 (15.9) |
Figure S371. Get High-res Image Gene #70: 'del_17q11.2' versus Clinical Feature #2: 'YEARS_TO_BIRTH'
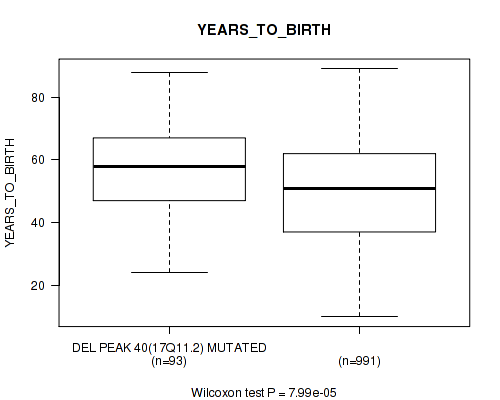
P value = 3.94e-07 (Fisher's exact test), Q value = 2.2e-06
Table S372. Gene #70: 'del_17q11.2' versus Clinical Feature #3: 'TUMOR_TISSUE_SITE'
| nPatients | BRAIN | CENTRAL NERVOUS SYSTEM |
|---|---|---|
| ALL | 573 | 512 |
| DEL PEAK 40(17Q11.2) MUTATED | 72 | 21 |
| DEL PEAK 40(17Q11.2) WILD-TYPE | 501 | 491 |
Figure S372. Get High-res Image Gene #70: 'del_17q11.2' versus Clinical Feature #3: 'TUMOR_TISSUE_SITE'

P value = 0.117 (Fisher's exact test), Q value = 0.2
Table S373. Gene #70: 'del_17q11.2' versus Clinical Feature #5: 'RADIATION_THERAPY'
| nPatients | NO | YES |
|---|---|---|
| ALL | 258 | 770 |
| DEL PEAK 40(17Q11.2) MUTATED | 15 | 69 |
| DEL PEAK 40(17Q11.2) WILD-TYPE | 243 | 701 |
Figure S373. Get High-res Image Gene #70: 'del_17q11.2' versus Clinical Feature #5: 'RADIATION_THERAPY'
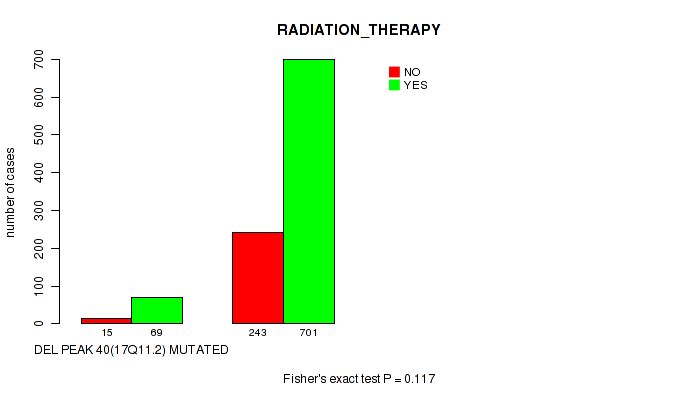
P value = 0.00354 (Wilcoxon-test), Q value = 0.0097
Table S374. Gene #70: 'del_17q11.2' versus Clinical Feature #6: 'KARNOFSKY_PERFORMANCE_SCORE'
| nPatients | Mean (Std.Dev) | |
|---|---|---|
| ALL | 732 | 81.1 (15.3) |
| DEL PEAK 40(17Q11.2) MUTATED | 69 | 74.1 (21.6) |
| DEL PEAK 40(17Q11.2) WILD-TYPE | 663 | 81.8 (14.3) |
Figure S374. Get High-res Image Gene #70: 'del_17q11.2' versus Clinical Feature #6: 'KARNOFSKY_PERFORMANCE_SCORE'
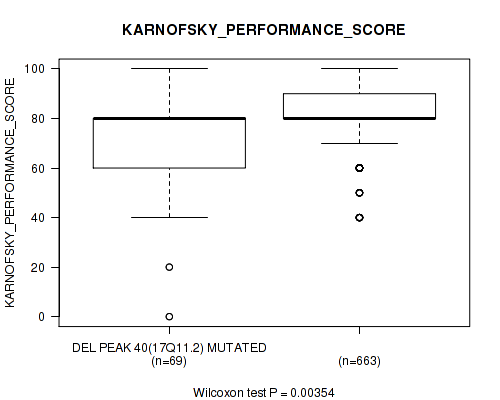
P value = 5e-05 (Fisher's exact test), Q value = 0.00018
Table S375. Gene #70: 'del_17q11.2' versus Clinical Feature #7: 'HISTOLOGICAL_TYPE'
| nPatients | ASTROCYTOMA | GLIOBLASTOMA MULTIFORME (GBM) | OLIGOASTROCYTOMA | OLIGODENDROGLIOMA | TREATED PRIMARY GBM | UNTREATED PRIMARY (DE NOVO) GBM |
|---|---|---|---|---|---|---|
| ALL | 194 | 30 | 129 | 189 | 18 | 525 |
| DEL PEAK 40(17Q11.2) MUTATED | 11 | 5 | 4 | 6 | 2 | 65 |
| DEL PEAK 40(17Q11.2) WILD-TYPE | 183 | 25 | 125 | 183 | 16 | 460 |
Figure S375. Get High-res Image Gene #70: 'del_17q11.2' versus Clinical Feature #7: 'HISTOLOGICAL_TYPE'
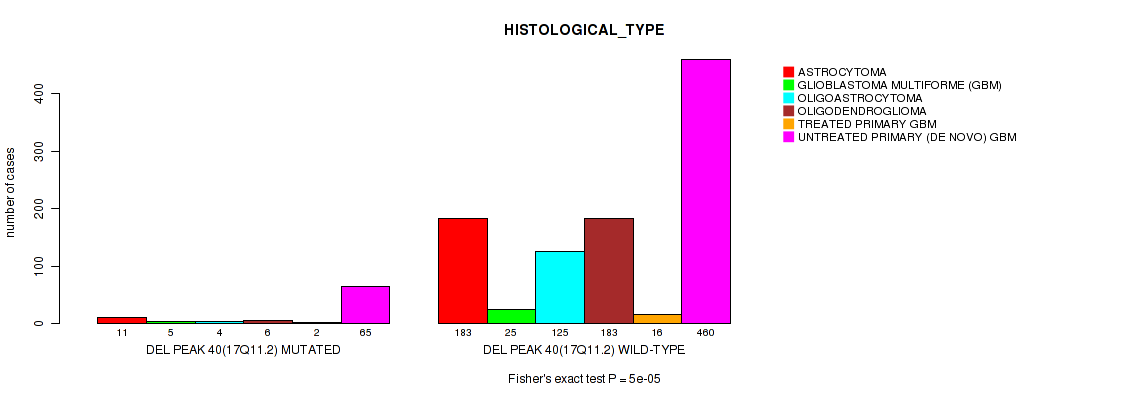
P value = 0.0931 (Fisher's exact test), Q value = 0.17
Table S376. Gene #70: 'del_17q11.2' versus Clinical Feature #8: 'RACE'
| nPatients | AMERICAN INDIAN OR ALASKA NATIVE | ASIAN | BLACK OR AFRICAN AMERICAN | WHITE |
|---|---|---|---|---|
| ALL | 1 | 21 | 71 | 959 |
| DEL PEAK 40(17Q11.2) MUTATED | 1 | 2 | 8 | 80 |
| DEL PEAK 40(17Q11.2) WILD-TYPE | 0 | 19 | 63 | 879 |
Figure S376. Get High-res Image Gene #70: 'del_17q11.2' versus Clinical Feature #8: 'RACE'
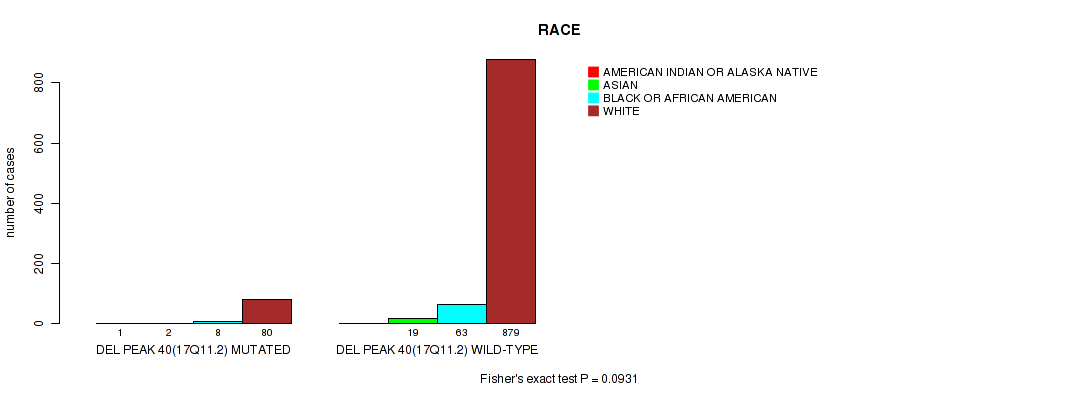
P value = 0 (logrank test), Q value = 0
Table S377. Gene #72: 'del_19q13.41' versus Clinical Feature #1: 'Time to Death'
| nPatients | nDeath | Duration Range (Median), Month | |
|---|---|---|---|
| ALL | 1078 | 598 | 0.0 - 211.2 (16.0) |
| DEL PEAK 42(19Q13.41) MUTATED | 359 | 133 | 0.0 - 182.3 (20.2) |
| DEL PEAK 42(19Q13.41) WILD-TYPE | 719 | 465 | 0.1 - 211.2 (14.4) |
Figure S377. Get High-res Image Gene #72: 'del_19q13.41' versus Clinical Feature #1: 'Time to Death'
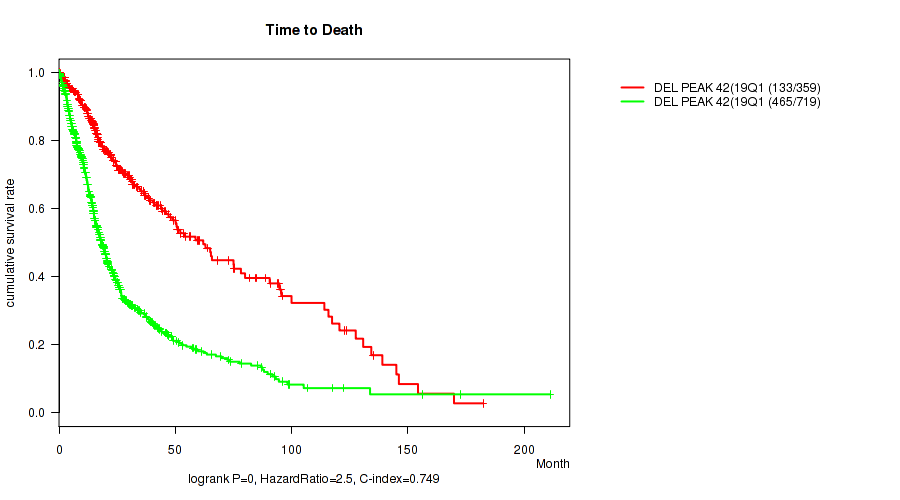
P value = 2.55e-09 (Wilcoxon-test), Q value = 1.7e-08
Table S378. Gene #72: 'del_19q13.41' versus Clinical Feature #2: 'YEARS_TO_BIRTH'
| nPatients | Mean (Std.Dev) | |
|---|---|---|
| ALL | 1084 | 50.8 (15.8) |
| DEL PEAK 42(19Q13.41) MUTATED | 363 | 47.0 (14.3) |
| DEL PEAK 42(19Q13.41) WILD-TYPE | 721 | 52.8 (16.1) |
Figure S378. Get High-res Image Gene #72: 'del_19q13.41' versus Clinical Feature #2: 'YEARS_TO_BIRTH'

P value = 2.93e-35 (Fisher's exact test), Q value = 5.4e-34
Table S379. Gene #72: 'del_19q13.41' versus Clinical Feature #3: 'TUMOR_TISSUE_SITE'
| nPatients | BRAIN | CENTRAL NERVOUS SYSTEM |
|---|---|---|
| ALL | 573 | 512 |
| DEL PEAK 42(19Q13.41) MUTATED | 97 | 267 |
| DEL PEAK 42(19Q13.41) WILD-TYPE | 476 | 245 |
Figure S379. Get High-res Image Gene #72: 'del_19q13.41' versus Clinical Feature #3: 'TUMOR_TISSUE_SITE'
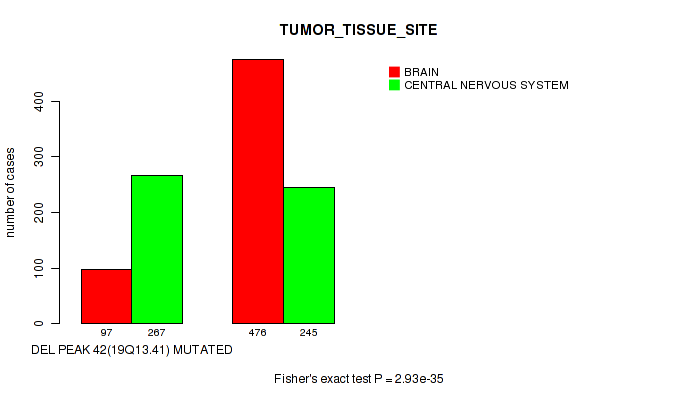
P value = 3.32e-08 (Fisher's exact test), Q value = 2e-07
Table S380. Gene #72: 'del_19q13.41' versus Clinical Feature #5: 'RADIATION_THERAPY'
| nPatients | NO | YES |
|---|---|---|
| ALL | 258 | 770 |
| DEL PEAK 42(19Q13.41) MUTATED | 123 | 220 |
| DEL PEAK 42(19Q13.41) WILD-TYPE | 135 | 550 |
Figure S380. Get High-res Image Gene #72: 'del_19q13.41' versus Clinical Feature #5: 'RADIATION_THERAPY'
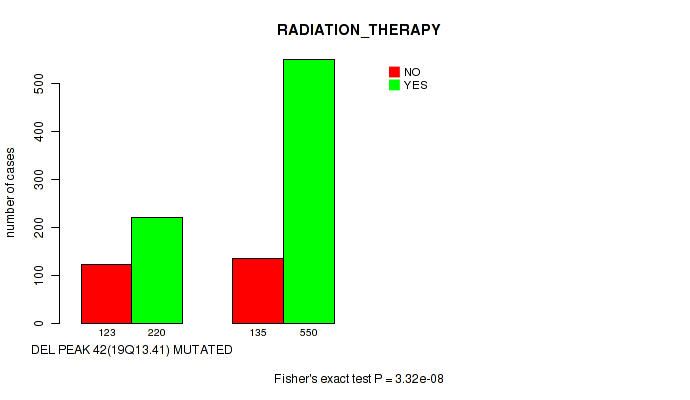
P value = 2.52e-05 (Wilcoxon-test), Q value = 9.3e-05
Table S381. Gene #72: 'del_19q13.41' versus Clinical Feature #6: 'KARNOFSKY_PERFORMANCE_SCORE'
| nPatients | Mean (Std.Dev) | |
|---|---|---|
| ALL | 732 | 81.1 (15.3) |
| DEL PEAK 42(19Q13.41) MUTATED | 237 | 84.4 (13.2) |
| DEL PEAK 42(19Q13.41) WILD-TYPE | 495 | 79.5 (16.0) |
Figure S381. Get High-res Image Gene #72: 'del_19q13.41' versus Clinical Feature #6: 'KARNOFSKY_PERFORMANCE_SCORE'
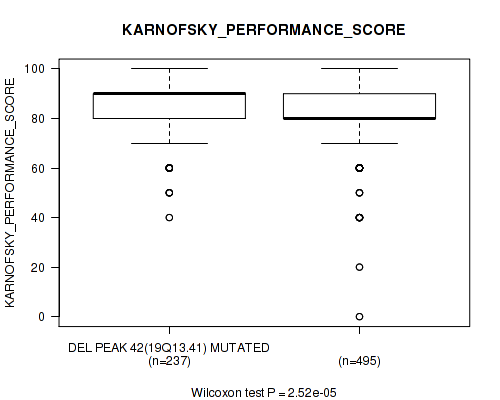
P value = 1e-05 (Fisher's exact test), Q value = 3.9e-05
Table S382. Gene #72: 'del_19q13.41' versus Clinical Feature #7: 'HISTOLOGICAL_TYPE'
| nPatients | ASTROCYTOMA | GLIOBLASTOMA MULTIFORME (GBM) | OLIGOASTROCYTOMA | OLIGODENDROGLIOMA | TREATED PRIMARY GBM | UNTREATED PRIMARY (DE NOVO) GBM |
|---|---|---|---|---|---|---|
| ALL | 194 | 30 | 129 | 189 | 18 | 525 |
| DEL PEAK 42(19Q13.41) MUTATED | 54 | 3 | 60 | 153 | 4 | 90 |
| DEL PEAK 42(19Q13.41) WILD-TYPE | 140 | 27 | 69 | 36 | 14 | 435 |
Figure S382. Get High-res Image Gene #72: 'del_19q13.41' versus Clinical Feature #7: 'HISTOLOGICAL_TYPE'
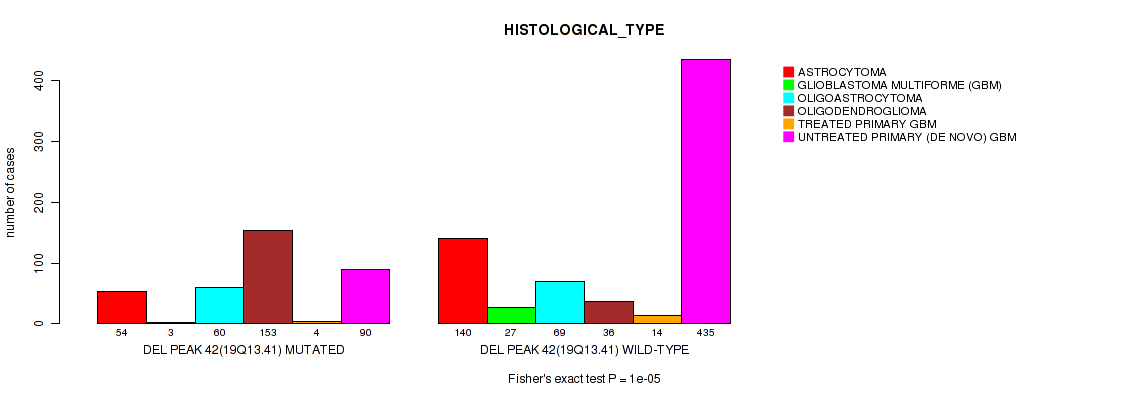
P value = 0.144 (Fisher's exact test), Q value = 0.24
Table S383. Gene #72: 'del_19q13.41' versus Clinical Feature #9: 'ETHNICITY'
| nPatients | HISPANIC OR LATINO | NOT HISPANIC OR LATINO |
|---|---|---|
| ALL | 44 | 921 |
| DEL PEAK 42(19Q13.41) MUTATED | 20 | 314 |
| DEL PEAK 42(19Q13.41) WILD-TYPE | 24 | 607 |
Figure S383. Get High-res Image Gene #72: 'del_19q13.41' versus Clinical Feature #9: 'ETHNICITY'
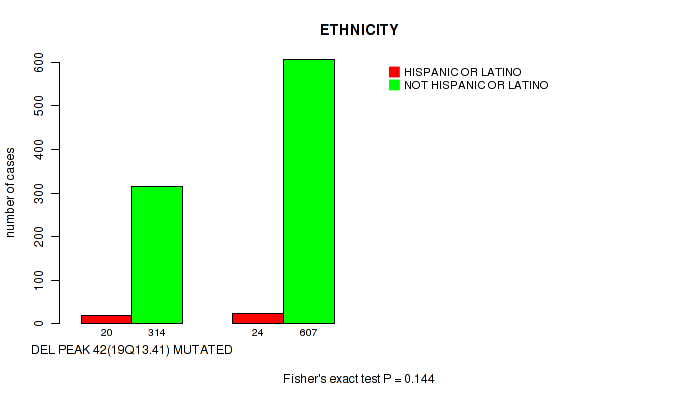
P value = 0 (logrank test), Q value = 0
Table S384. Gene #73: 'del_19q13.43' versus Clinical Feature #1: 'Time to Death'
| nPatients | nDeath | Duration Range (Median), Month | |
|---|---|---|---|
| ALL | 1078 | 598 | 0.0 - 211.2 (16.0) |
| DEL PEAK 43(19Q13.43) MUTATED | 350 | 120 | 0.0 - 182.3 (21.3) |
| DEL PEAK 43(19Q13.43) WILD-TYPE | 728 | 478 | 0.1 - 211.2 (14.3) |
Figure S384. Get High-res Image Gene #73: 'del_19q13.43' versus Clinical Feature #1: 'Time to Death'
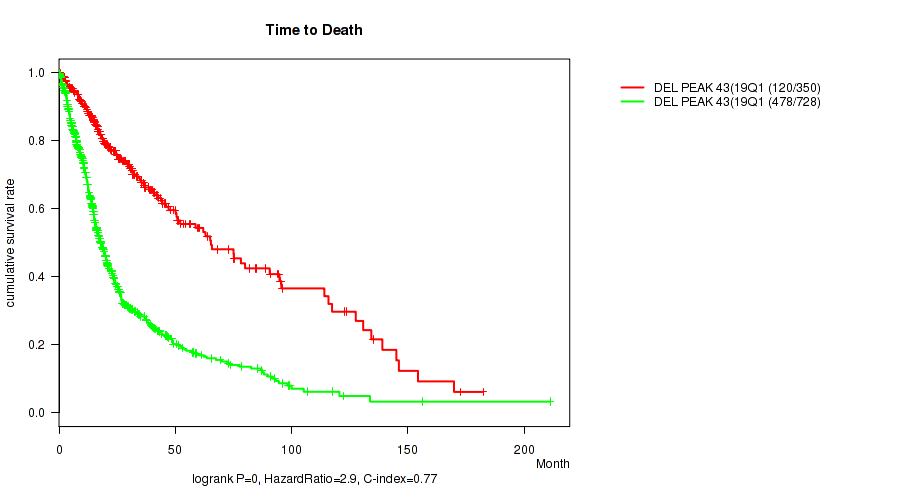
P value = 2.98e-14 (Wilcoxon-test), Q value = 3.3e-13
Table S385. Gene #73: 'del_19q13.43' versus Clinical Feature #2: 'YEARS_TO_BIRTH'
| nPatients | Mean (Std.Dev) | |
|---|---|---|
| ALL | 1084 | 50.8 (15.8) |
| DEL PEAK 43(19Q13.43) MUTATED | 354 | 45.7 (14.4) |
| DEL PEAK 43(19Q13.43) WILD-TYPE | 730 | 53.3 (15.8) |
Figure S385. Get High-res Image Gene #73: 'del_19q13.43' versus Clinical Feature #2: 'YEARS_TO_BIRTH'
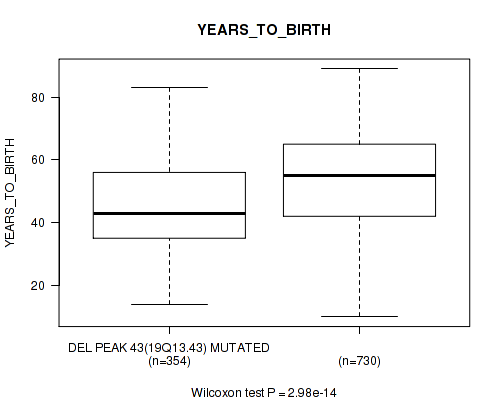
P value = 2.72e-41 (Fisher's exact test), Q value = 5.7e-40
Table S386. Gene #73: 'del_19q13.43' versus Clinical Feature #3: 'TUMOR_TISSUE_SITE'
| nPatients | BRAIN | CENTRAL NERVOUS SYSTEM |
|---|---|---|
| ALL | 573 | 512 |
| DEL PEAK 43(19Q13.43) MUTATED | 85 | 270 |
| DEL PEAK 43(19Q13.43) WILD-TYPE | 488 | 242 |
Figure S386. Get High-res Image Gene #73: 'del_19q13.43' versus Clinical Feature #3: 'TUMOR_TISSUE_SITE'
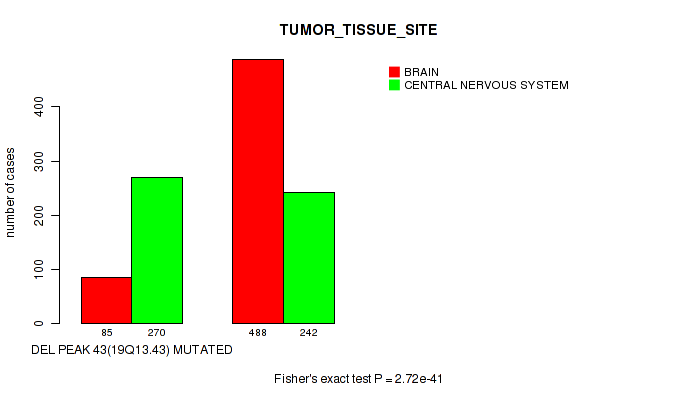
P value = 2.52e-09 (Fisher's exact test), Q value = 1.6e-08
Table S387. Gene #73: 'del_19q13.43' versus Clinical Feature #5: 'RADIATION_THERAPY'
| nPatients | NO | YES |
|---|---|---|
| ALL | 258 | 770 |
| DEL PEAK 43(19Q13.43) MUTATED | 124 | 211 |
| DEL PEAK 43(19Q13.43) WILD-TYPE | 134 | 559 |
Figure S387. Get High-res Image Gene #73: 'del_19q13.43' versus Clinical Feature #5: 'RADIATION_THERAPY'

P value = 2.85e-06 (Wilcoxon-test), Q value = 1.5e-05
Table S388. Gene #73: 'del_19q13.43' versus Clinical Feature #6: 'KARNOFSKY_PERFORMANCE_SCORE'
| nPatients | Mean (Std.Dev) | |
|---|---|---|
| ALL | 732 | 81.1 (15.3) |
| DEL PEAK 43(19Q13.43) MUTATED | 235 | 84.7 (13.4) |
| DEL PEAK 43(19Q13.43) WILD-TYPE | 497 | 79.4 (15.8) |
Figure S388. Get High-res Image Gene #73: 'del_19q13.43' versus Clinical Feature #6: 'KARNOFSKY_PERFORMANCE_SCORE'
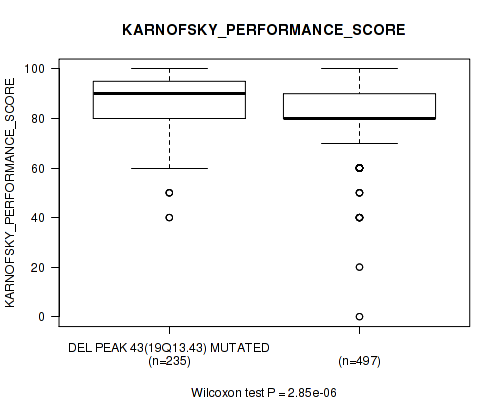
P value = 1e-05 (Fisher's exact test), Q value = 3.9e-05
Table S389. Gene #73: 'del_19q13.43' versus Clinical Feature #7: 'HISTOLOGICAL_TYPE'
| nPatients | ASTROCYTOMA | GLIOBLASTOMA MULTIFORME (GBM) | OLIGOASTROCYTOMA | OLIGODENDROGLIOMA | TREATED PRIMARY GBM | UNTREATED PRIMARY (DE NOVO) GBM |
|---|---|---|---|---|---|---|
| ALL | 194 | 30 | 129 | 189 | 18 | 525 |
| DEL PEAK 43(19Q13.43) MUTATED | 58 | 4 | 62 | 150 | 4 | 77 |
| DEL PEAK 43(19Q13.43) WILD-TYPE | 136 | 26 | 67 | 39 | 14 | 448 |
Figure S389. Get High-res Image Gene #73: 'del_19q13.43' versus Clinical Feature #7: 'HISTOLOGICAL_TYPE'

P value = 3.85e-12 (logrank test), Q value = 3.4e-11
Table S390. Gene #74: 'del_22q13.32' versus Clinical Feature #1: 'Time to Death'
| nPatients | nDeath | Duration Range (Median), Month | |
|---|---|---|---|
| ALL | 1078 | 598 | 0.0 - 211.2 (16.0) |
| DEL PEAK 44(22Q13.32) MUTATED | 289 | 215 | 0.1 - 156.2 (15.3) |
| DEL PEAK 44(22Q13.32) WILD-TYPE | 789 | 383 | 0.0 - 211.2 (16.4) |
Figure S390. Get High-res Image Gene #74: 'del_22q13.32' versus Clinical Feature #1: 'Time to Death'
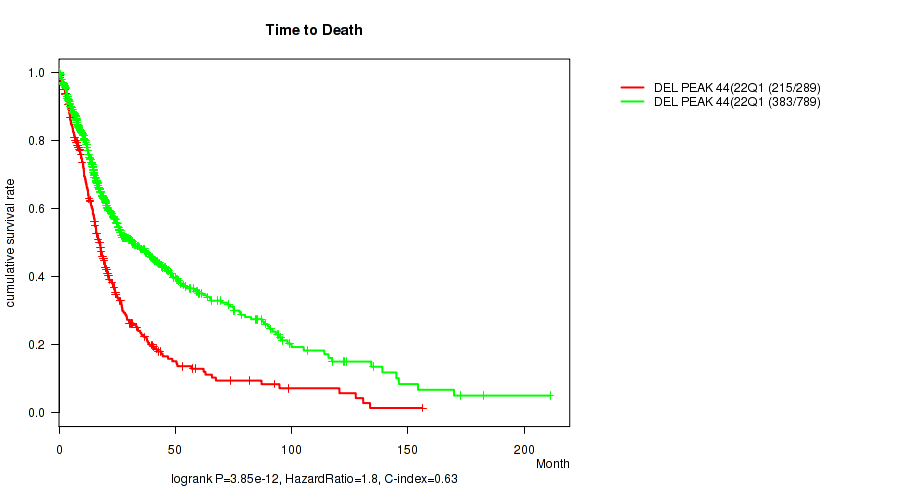
P value = 1.92e-10 (Wilcoxon-test), Q value = 1.5e-09
Table S391. Gene #74: 'del_22q13.32' versus Clinical Feature #2: 'YEARS_TO_BIRTH'
| nPatients | Mean (Std.Dev) | |
|---|---|---|
| ALL | 1084 | 50.8 (15.8) |
| DEL PEAK 44(22Q13.32) MUTATED | 289 | 55.7 (15.6) |
| DEL PEAK 44(22Q13.32) WILD-TYPE | 795 | 49.0 (15.5) |
Figure S391. Get High-res Image Gene #74: 'del_22q13.32' versus Clinical Feature #2: 'YEARS_TO_BIRTH'
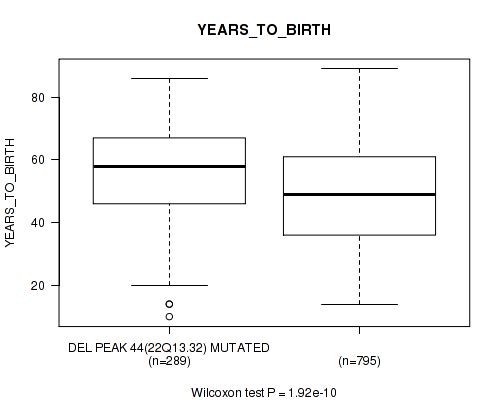
P value = 1.32e-16 (Fisher's exact test), Q value = 1.8e-15
Table S392. Gene #74: 'del_22q13.32' versus Clinical Feature #3: 'TUMOR_TISSUE_SITE'
| nPatients | BRAIN | CENTRAL NERVOUS SYSTEM |
|---|---|---|
| ALL | 573 | 512 |
| DEL PEAK 44(22Q13.32) MUTATED | 212 | 77 |
| DEL PEAK 44(22Q13.32) WILD-TYPE | 361 | 435 |
Figure S392. Get High-res Image Gene #74: 'del_22q13.32' versus Clinical Feature #3: 'TUMOR_TISSUE_SITE'
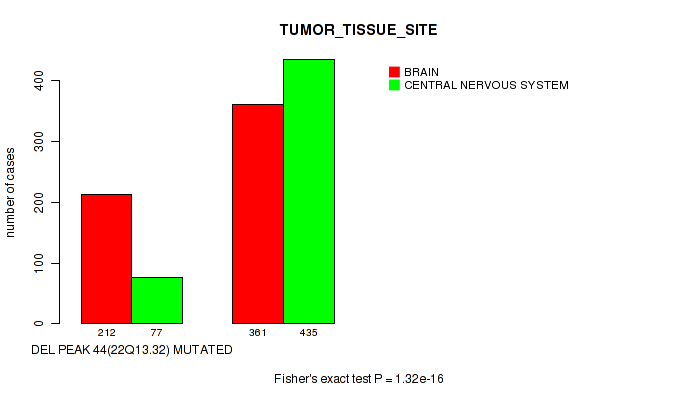
P value = 0.000175 (Fisher's exact test), Q value = 0.00058
Table S393. Gene #74: 'del_22q13.32' versus Clinical Feature #5: 'RADIATION_THERAPY'
| nPatients | NO | YES |
|---|---|---|
| ALL | 258 | 770 |
| DEL PEAK 44(22Q13.32) MUTATED | 46 | 228 |
| DEL PEAK 44(22Q13.32) WILD-TYPE | 212 | 542 |
Figure S393. Get High-res Image Gene #74: 'del_22q13.32' versus Clinical Feature #5: 'RADIATION_THERAPY'
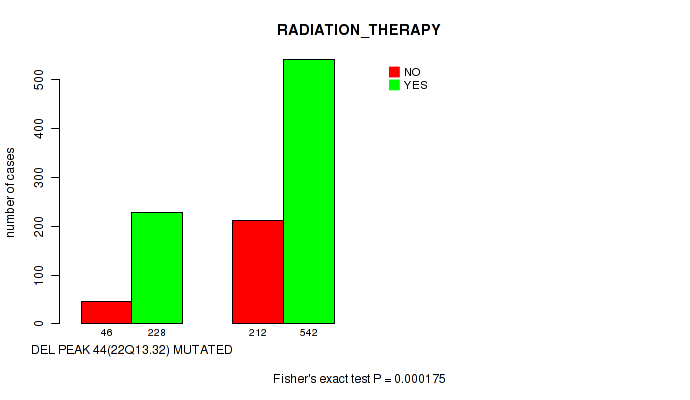
P value = 0.004 (Wilcoxon-test), Q value = 0.011
Table S394. Gene #74: 'del_22q13.32' versus Clinical Feature #6: 'KARNOFSKY_PERFORMANCE_SCORE'
| nPatients | Mean (Std.Dev) | |
|---|---|---|
| ALL | 732 | 81.1 (15.3) |
| DEL PEAK 44(22Q13.32) MUTATED | 205 | 79.2 (14.9) |
| DEL PEAK 44(22Q13.32) WILD-TYPE | 527 | 81.8 (15.4) |
Figure S394. Get High-res Image Gene #74: 'del_22q13.32' versus Clinical Feature #6: 'KARNOFSKY_PERFORMANCE_SCORE'
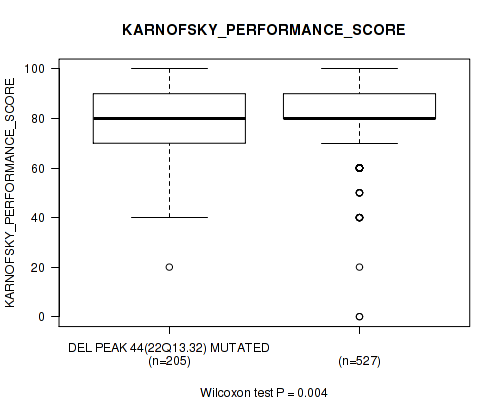
P value = 1e-05 (Fisher's exact test), Q value = 3.9e-05
Table S395. Gene #74: 'del_22q13.32' versus Clinical Feature #7: 'HISTOLOGICAL_TYPE'
| nPatients | ASTROCYTOMA | GLIOBLASTOMA MULTIFORME (GBM) | OLIGOASTROCYTOMA | OLIGODENDROGLIOMA | TREATED PRIMARY GBM | UNTREATED PRIMARY (DE NOVO) GBM |
|---|---|---|---|---|---|---|
| ALL | 194 | 30 | 129 | 189 | 18 | 525 |
| DEL PEAK 44(22Q13.32) MUTATED | 43 | 10 | 16 | 18 | 6 | 196 |
| DEL PEAK 44(22Q13.32) WILD-TYPE | 151 | 20 | 113 | 171 | 12 | 329 |
Figure S395. Get High-res Image Gene #74: 'del_22q13.32' versus Clinical Feature #7: 'HISTOLOGICAL_TYPE'
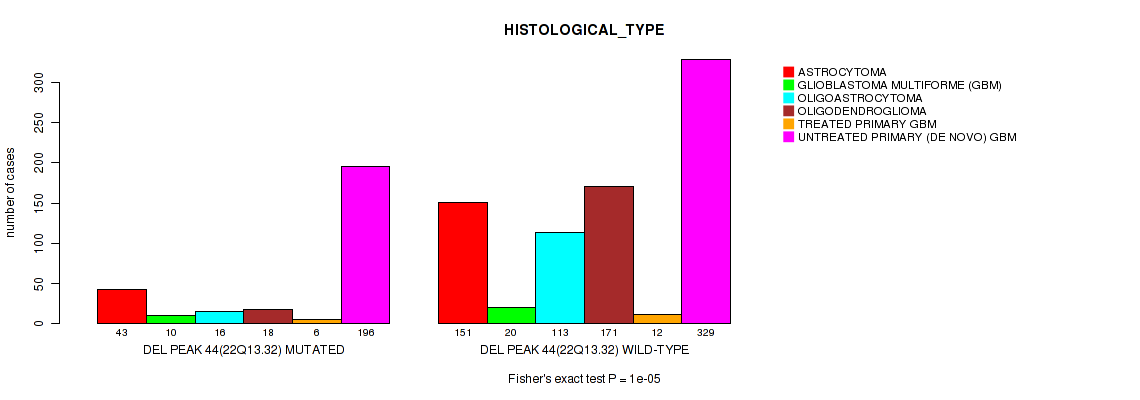
P value = 0.118 (Fisher's exact test), Q value = 0.2
Table S396. Gene #74: 'del_22q13.32' versus Clinical Feature #9: 'ETHNICITY'
| nPatients | HISPANIC OR LATINO | NOT HISPANIC OR LATINO |
|---|---|---|
| ALL | 44 | 921 |
| DEL PEAK 44(22Q13.32) MUTATED | 7 | 247 |
| DEL PEAK 44(22Q13.32) WILD-TYPE | 37 | 674 |
Figure S396. Get High-res Image Gene #74: 'del_22q13.32' versus Clinical Feature #9: 'ETHNICITY'
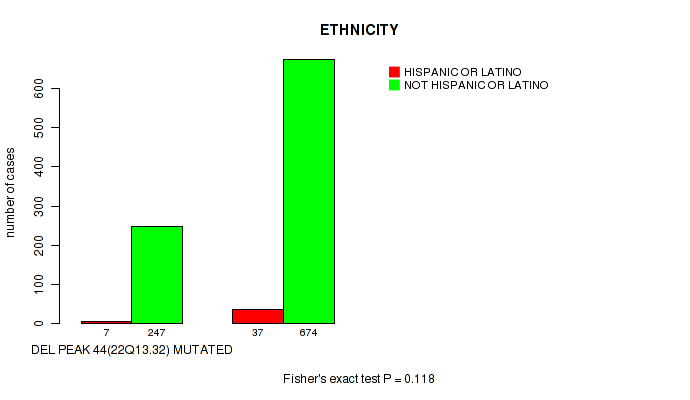
P value = 0.0306 (Wilcoxon-test), Q value = 0.064
Table S397. Gene #75: 'del_xq21.1' versus Clinical Feature #2: 'YEARS_TO_BIRTH'
| nPatients | Mean (Std.Dev) | |
|---|---|---|
| ALL | 1084 | 50.8 (15.8) |
| DEL PEAK 45(XQ21.1) MUTATED | 183 | 52.9 (16.0) |
| DEL PEAK 45(XQ21.1) WILD-TYPE | 901 | 50.4 (15.7) |
Figure S397. Get High-res Image Gene #75: 'del_xq21.1' versus Clinical Feature #2: 'YEARS_TO_BIRTH'

P value = 0.0818 (Wilcoxon-test), Q value = 0.15
Table S398. Gene #75: 'del_xq21.1' versus Clinical Feature #6: 'KARNOFSKY_PERFORMANCE_SCORE'
| nPatients | Mean (Std.Dev) | |
|---|---|---|
| ALL | 732 | 81.1 (15.3) |
| DEL PEAK 45(XQ21.1) MUTATED | 128 | 78.3 (17.6) |
| DEL PEAK 45(XQ21.1) WILD-TYPE | 604 | 81.7 (14.7) |
Figure S398. Get High-res Image Gene #75: 'del_xq21.1' versus Clinical Feature #6: 'KARNOFSKY_PERFORMANCE_SCORE'
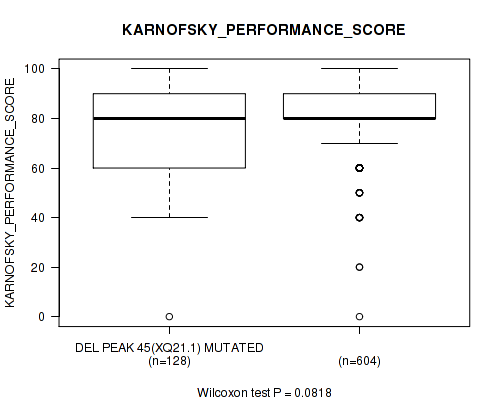
-
Copy number data file = all_lesions.txt from GISTIC pipeline
-
Processed Copy number data file = /xchip/cga/gdac-prod/tcga-gdac/jobResults/GDAC_Correlate_Genomic_Events_Preprocess/GBMLGG-TP/22534381/transformed.cor.cli.txt
-
Clinical data file = /xchip/cga/gdac-prod/tcga-gdac/jobResults/Append_Data/GBMLGG-TP/22506567/GBMLGG-TP.merged_data.txt
-
Number of patients = 1085
-
Number of significantly focal cnvs = 75
-
Number of selected clinical features = 9
-
Exclude genes that fewer than K tumors have mutations, K = 3
For survival clinical features, the Kaplan-Meier survival curves of tumors with and without gene mutations were plotted and the statistical significance P values were estimated by logrank test (Bland and Altman 2004) using the 'survdiff' function in R
For binary or multi-class clinical features (nominal or ordinal), two-tailed Fisher's exact tests (Fisher 1922) were used to estimate the P values using the 'fisher.test' function in R
For multiple hypothesis correction, Q value is the False Discovery Rate (FDR) analogue of the P value (Benjamini and Hochberg 1995), defined as the minimum FDR at which the test may be called significant. We used the 'Benjamini and Hochberg' method of 'p.adjust' function in R to convert P values into Q values.
In addition to the links below, the full results of the analysis summarized in this report can also be downloaded programmatically using firehose_get, or interactively from either the Broad GDAC website or TCGA Data Coordination Center Portal.