This pipeline computes the correlation between significant copy number variation (cnv focal) genes and selected clinical features.
Testing the association between copy number variation 29 focal events and 12 clinical features across 528 patients, 73 significant findings detected with Q value < 0.25.
-
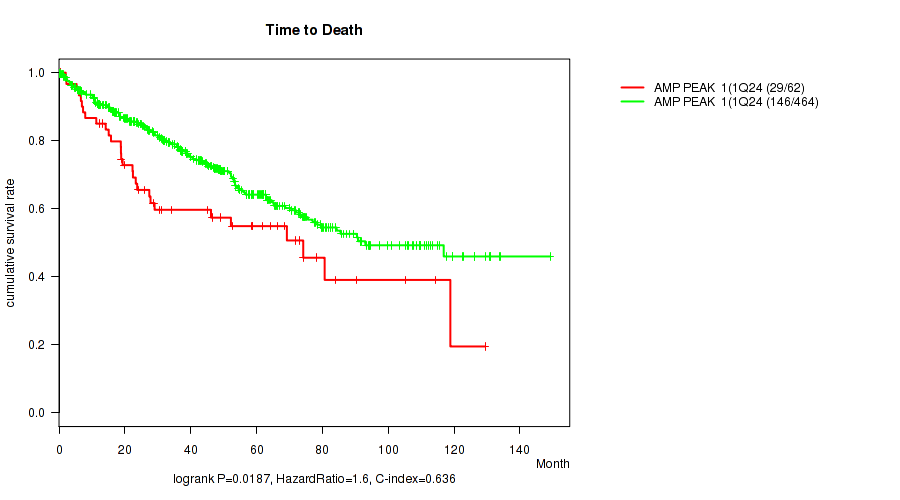
amp_1q24.1 cnv correlated to 'Time to Death'.
-
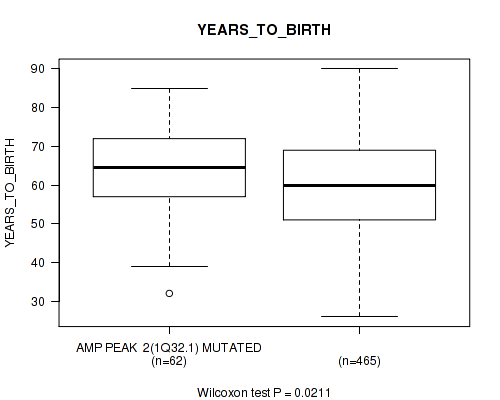
amp_1q32.1 cnv correlated to 'YEARS_TO_BIRTH'.
-
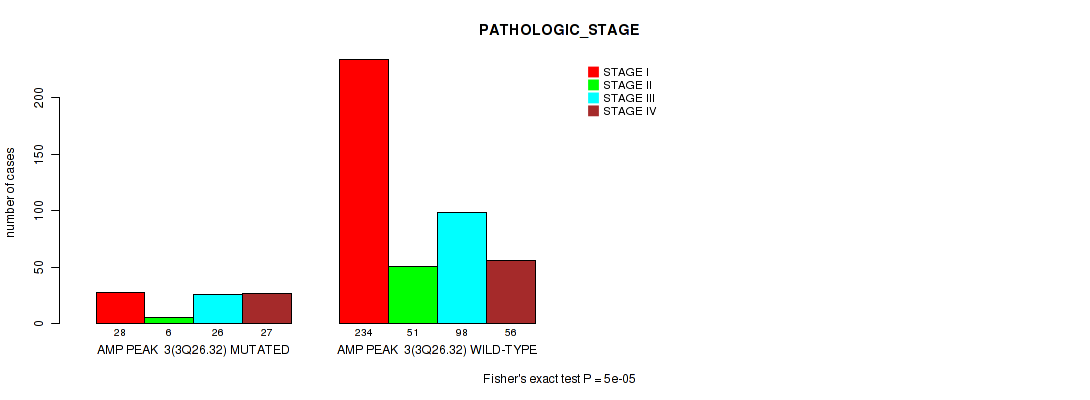
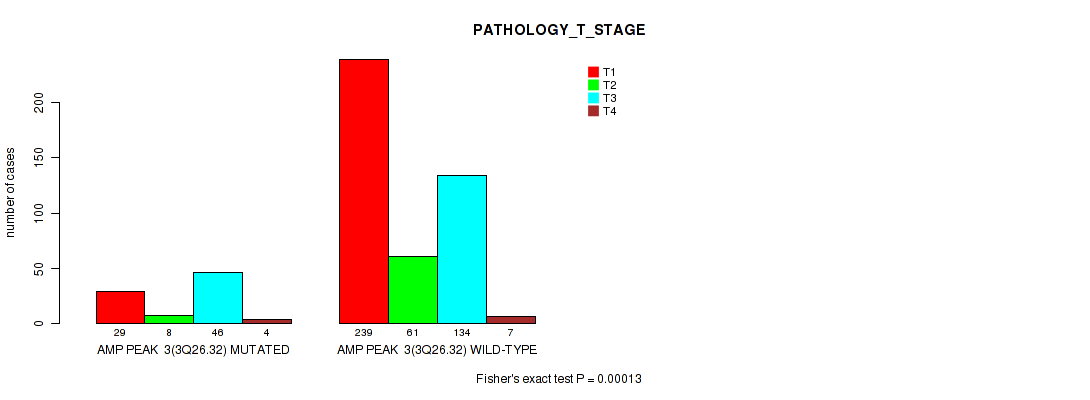
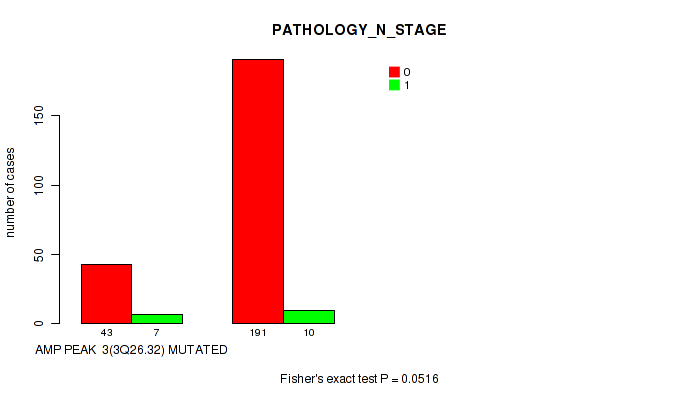
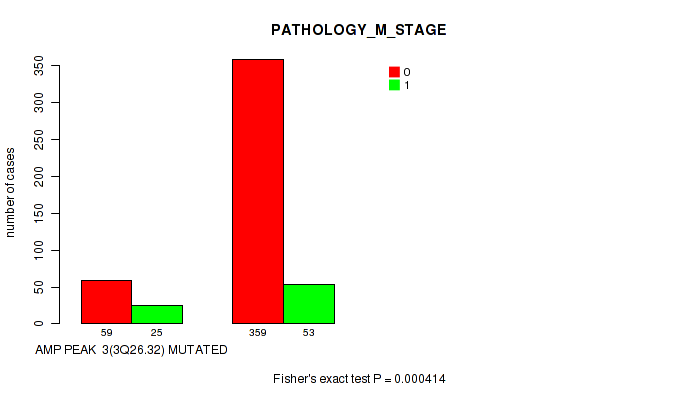
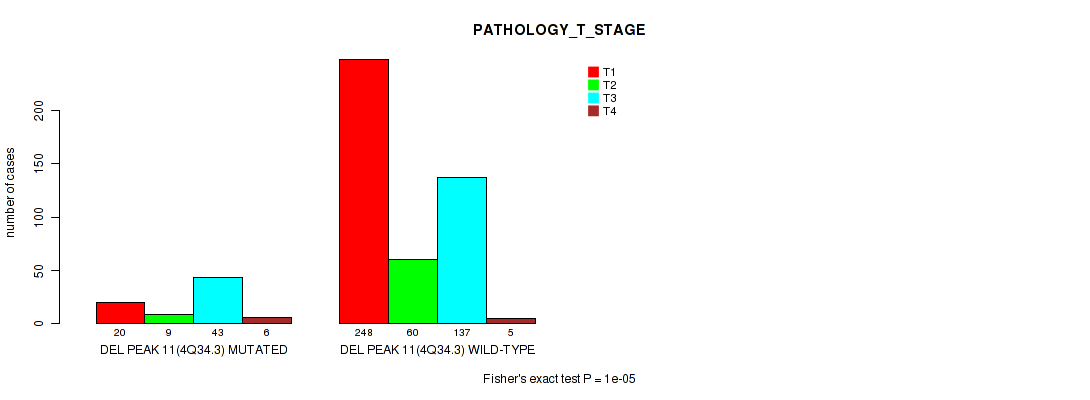
amp_3q26.32 cnv correlated to 'PATHOLOGIC_STAGE', 'PATHOLOGY_T_STAGE', 'PATHOLOGY_N_STAGE', and 'PATHOLOGY_M_STAGE'.
-
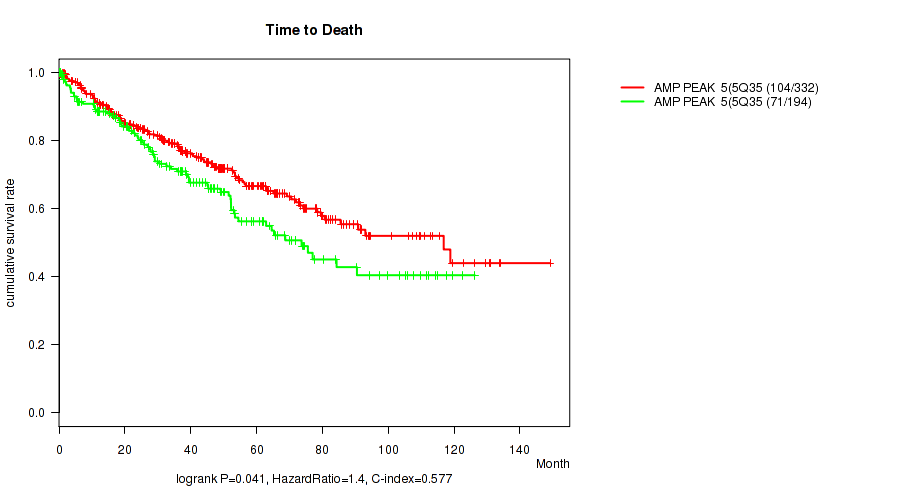
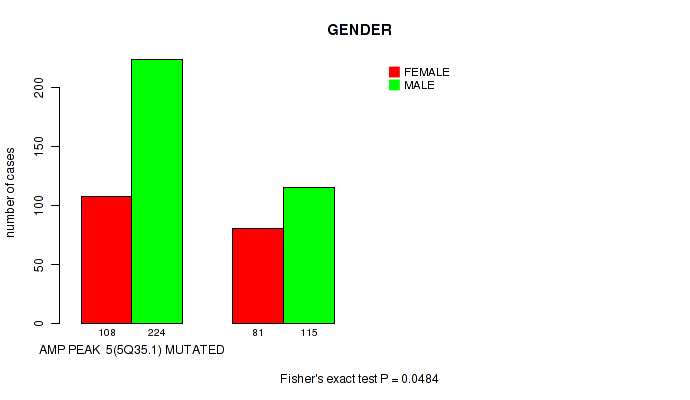
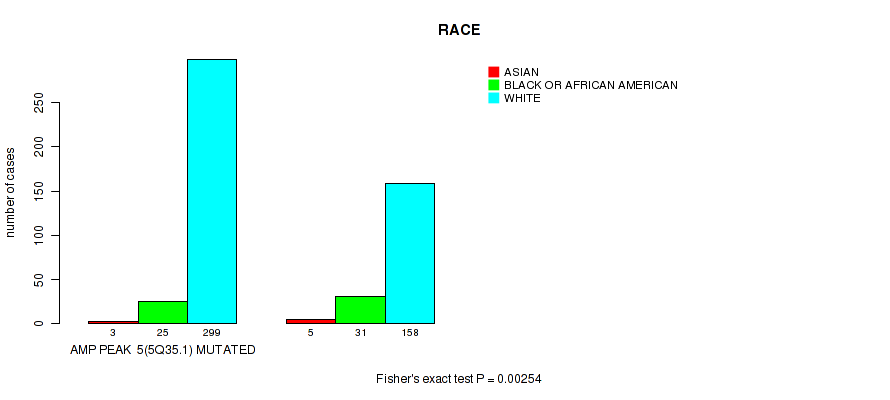
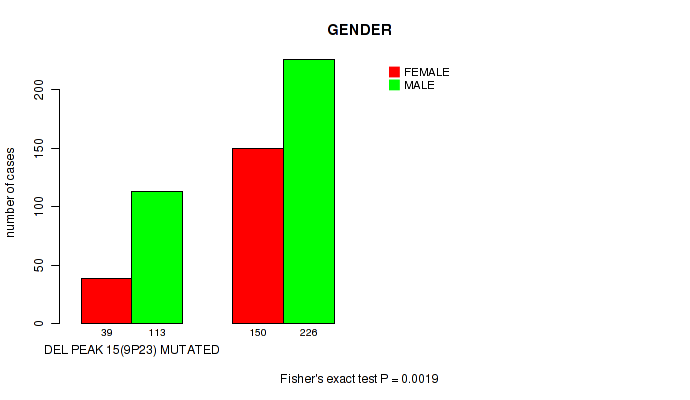
amp_5q35.1 cnv correlated to 'Time to Death', 'GENDER', and 'RACE'.
-
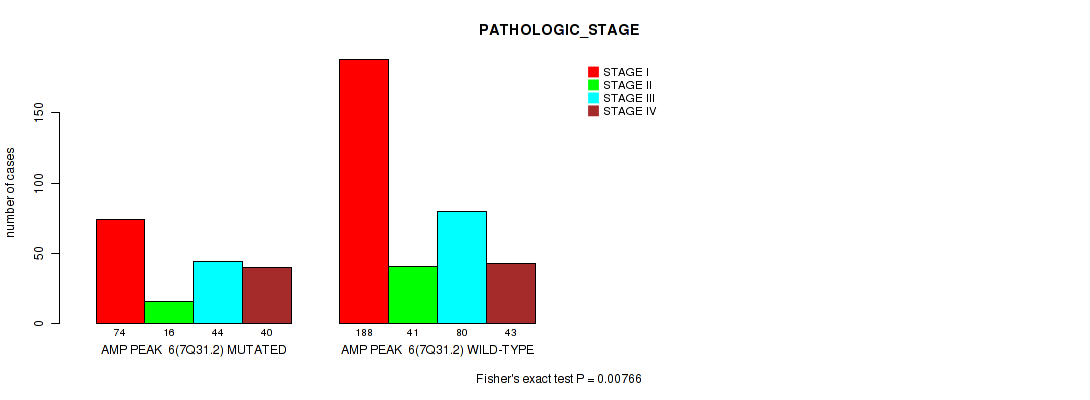
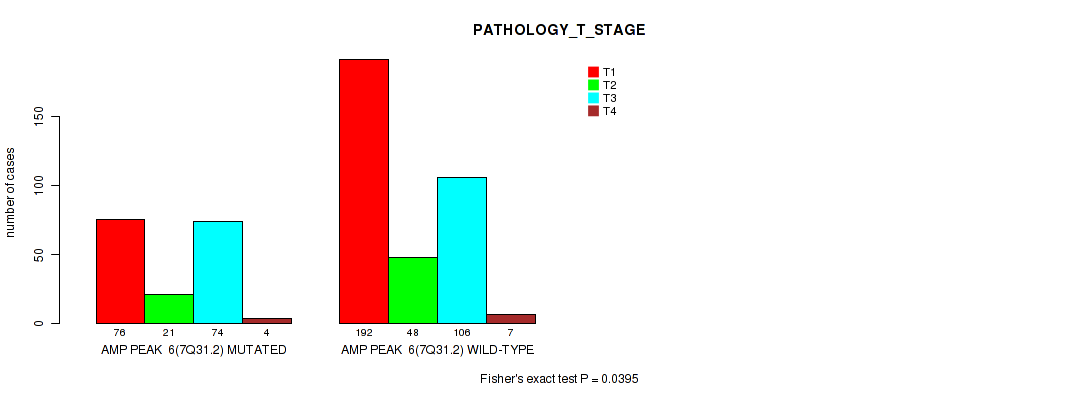
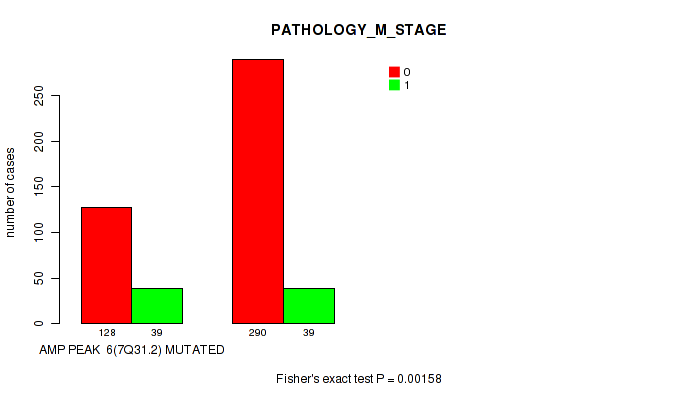
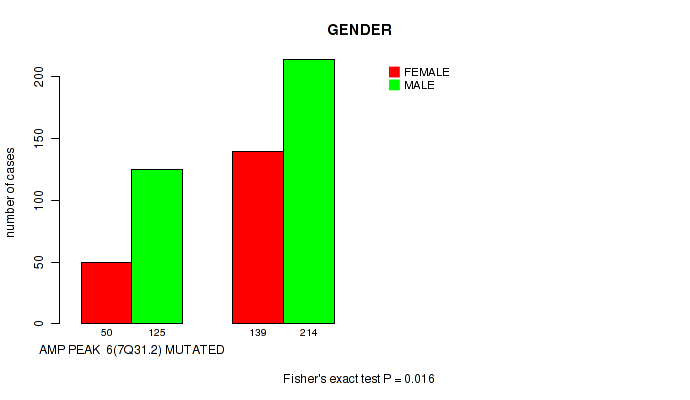
amp_7q31.2 cnv correlated to 'PATHOLOGIC_STAGE', 'PATHOLOGY_T_STAGE', 'PATHOLOGY_M_STAGE', and 'GENDER'.
-
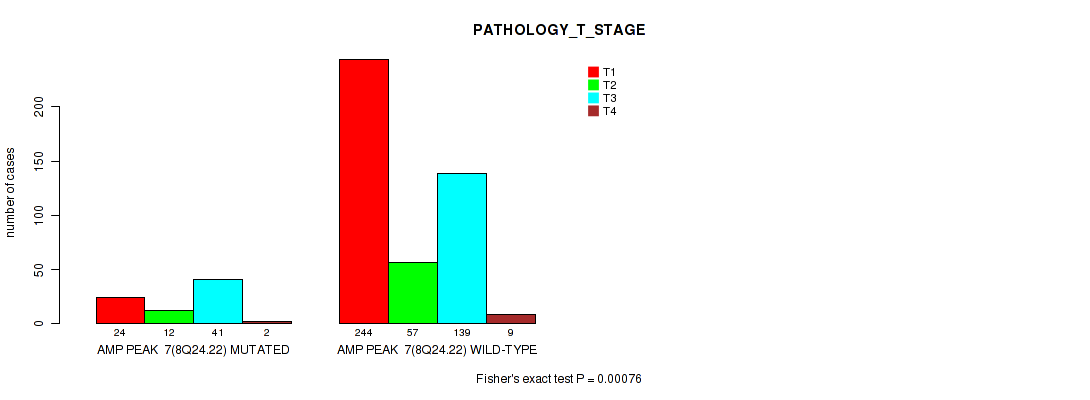
amp_8q24.22 cnv correlated to 'Time to Death', 'YEARS_TO_BIRTH', 'PATHOLOGIC_STAGE', and 'PATHOLOGY_T_STAGE'.
-
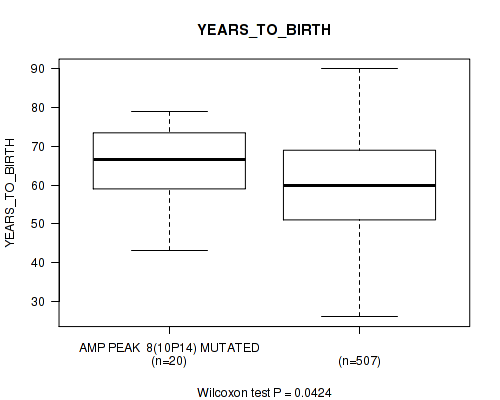
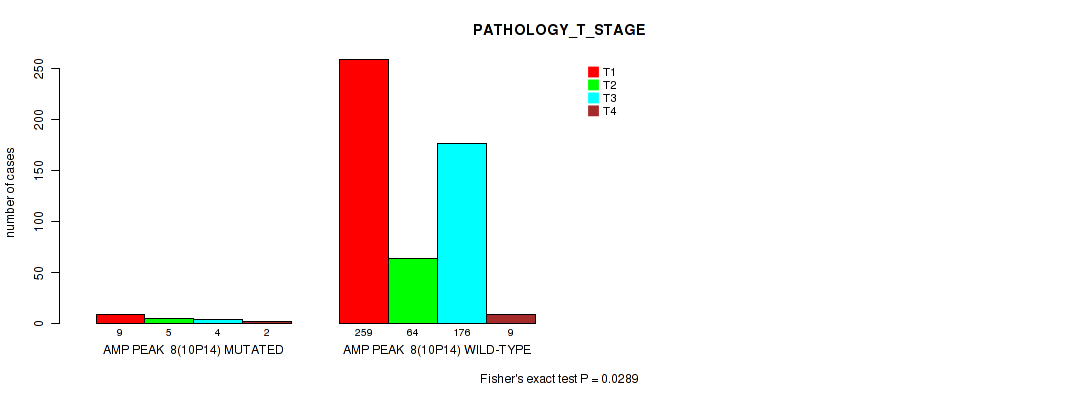
amp_10p14 cnv correlated to 'YEARS_TO_BIRTH' and 'PATHOLOGY_T_STAGE'.
-
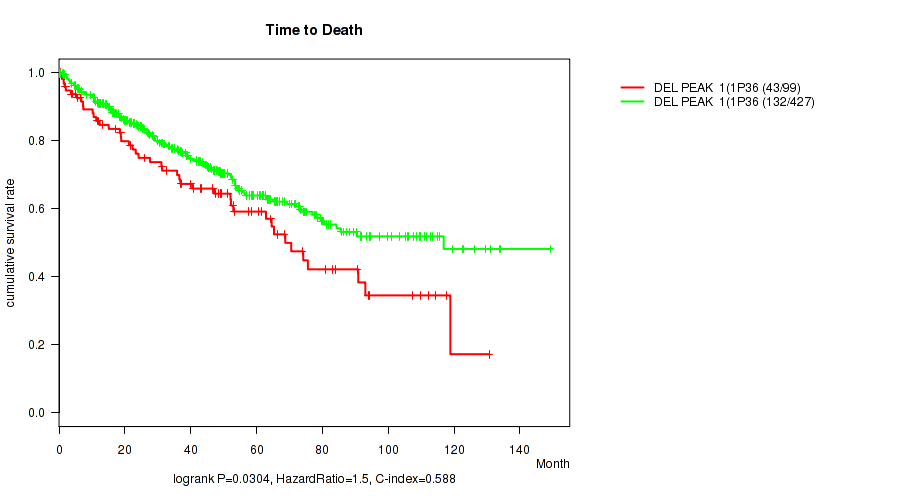
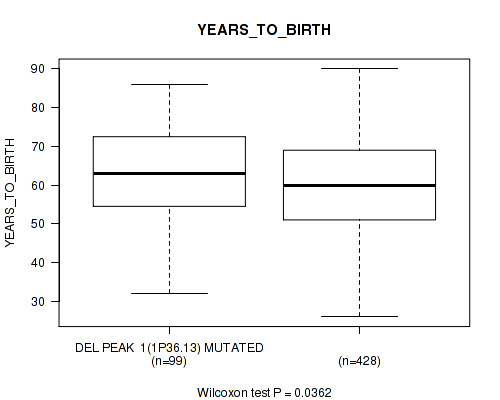
del_1p36.13 cnv correlated to 'Time to Death' and 'YEARS_TO_BIRTH'.
-
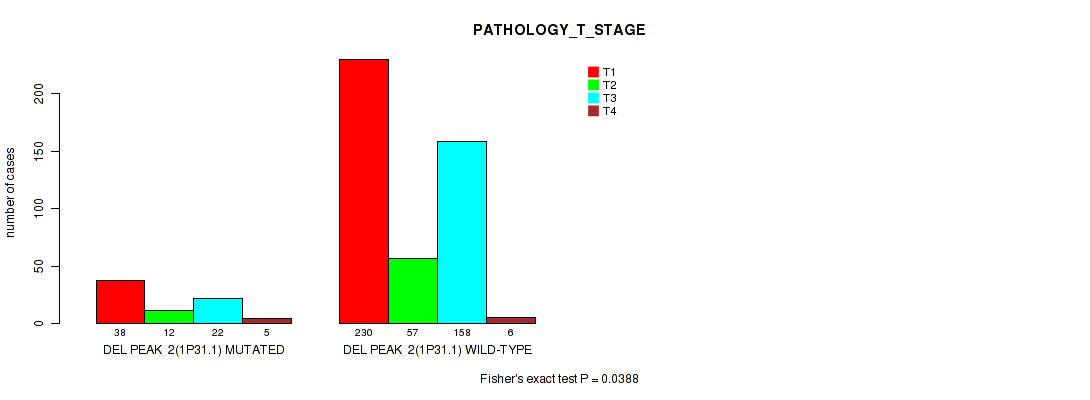
del_1p31.1 cnv correlated to 'PATHOLOGY_T_STAGE'.
-
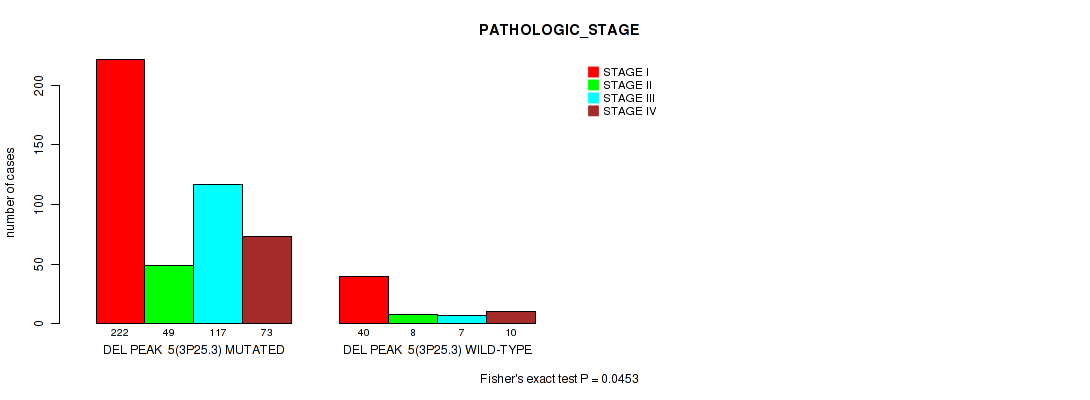
del_3p25.3 cnv correlated to 'PATHOLOGIC_STAGE', 'PATHOLOGY_T_STAGE', and 'RACE'.
-
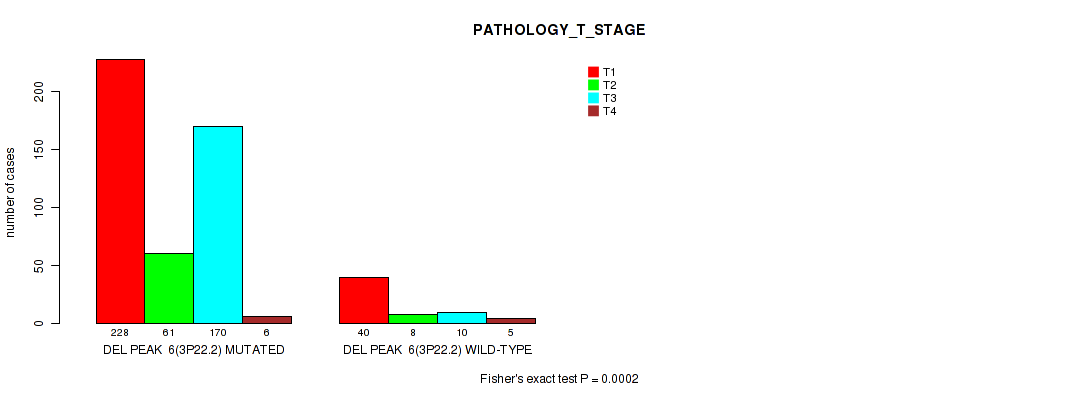
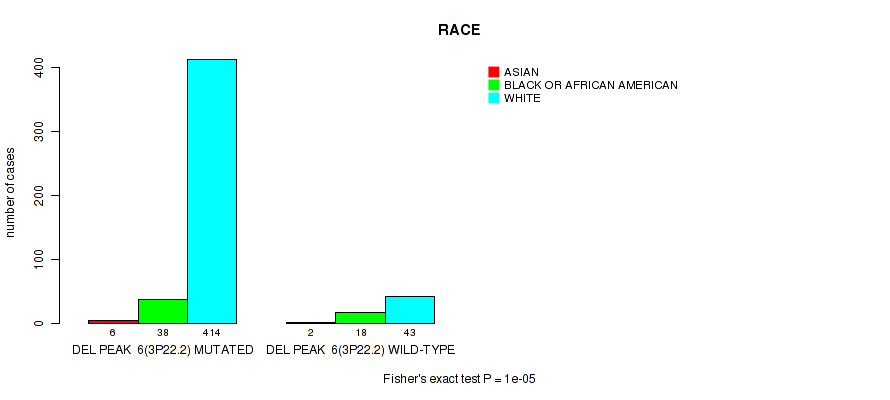
del_3p22.2 cnv correlated to 'PATHOLOGIC_STAGE', 'PATHOLOGY_T_STAGE', and 'RACE'.
-
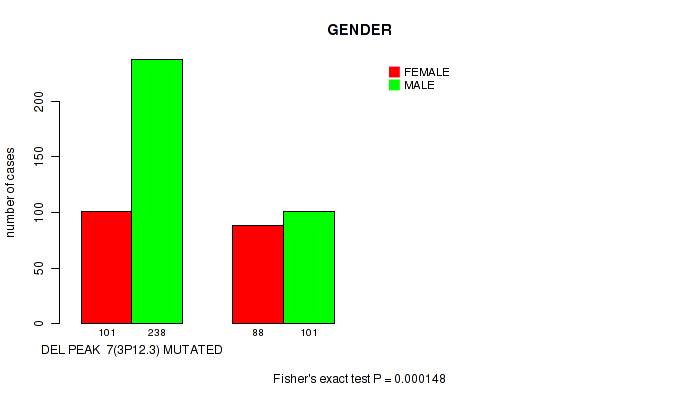
del_3p12.3 cnv correlated to 'PATHOLOGY_T_STAGE' and 'GENDER'.
-
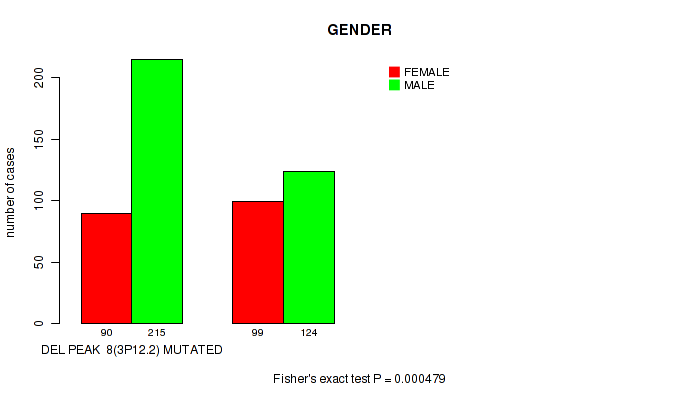
del_3p12.2 cnv correlated to 'GENDER'.
-
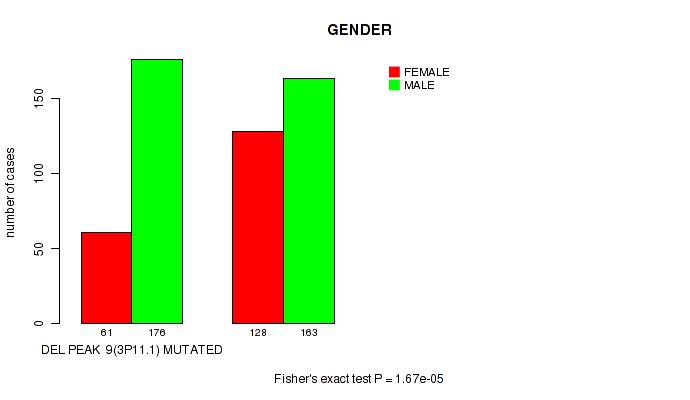
del_3p11.1 cnv correlated to 'YEARS_TO_BIRTH' and 'GENDER'.
-
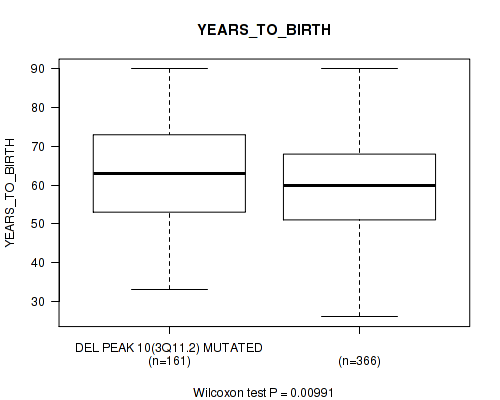
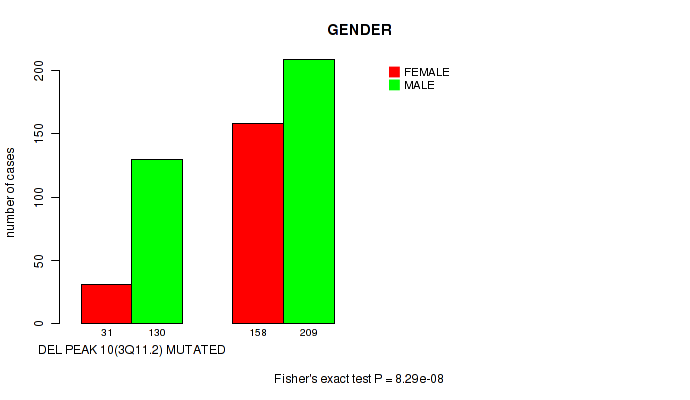
del_3q11.2 cnv correlated to 'YEARS_TO_BIRTH' and 'GENDER'.
-
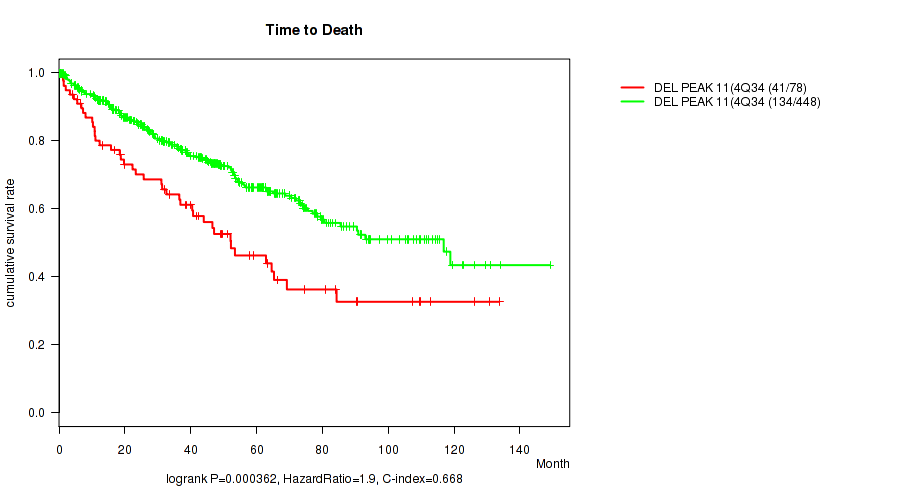
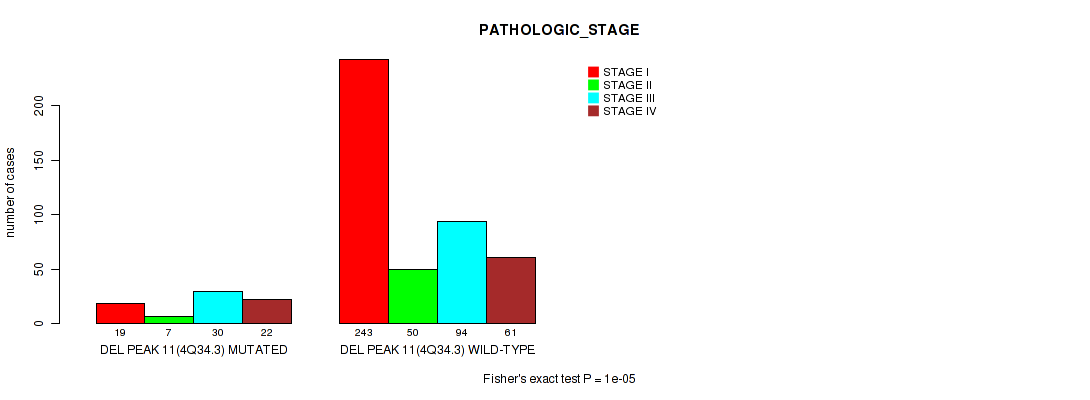
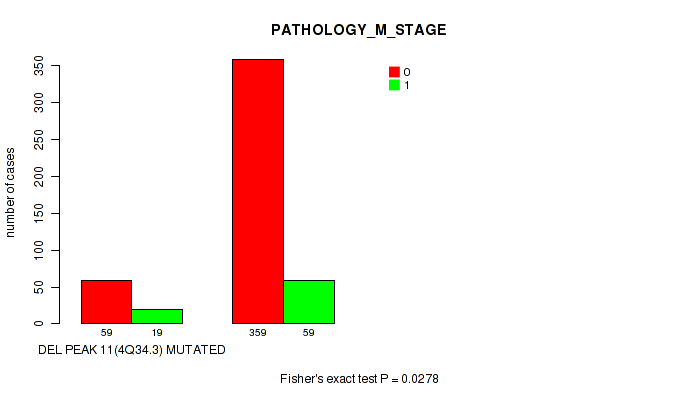
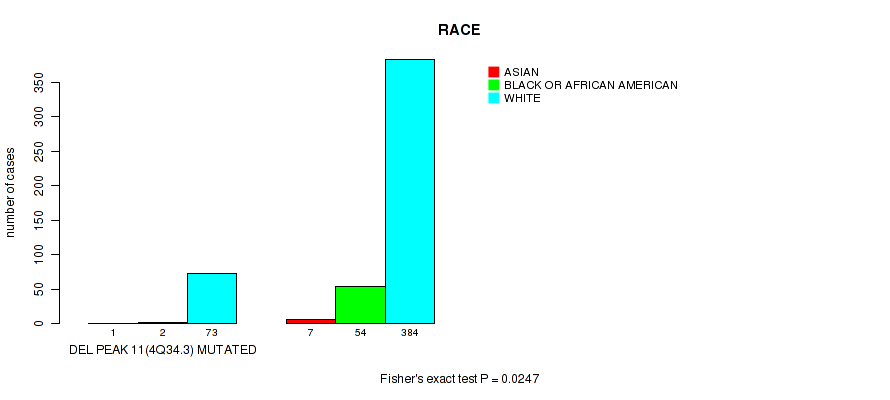
del_4q34.3 cnv correlated to 'Time to Death', 'PATHOLOGIC_STAGE', 'PATHOLOGY_T_STAGE', 'PATHOLOGY_M_STAGE', and 'RACE'.
-
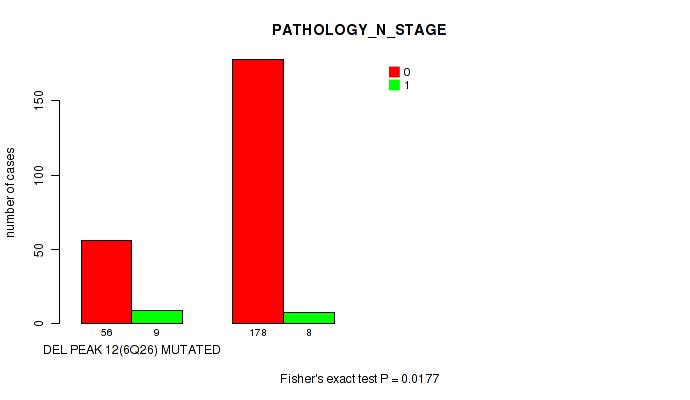
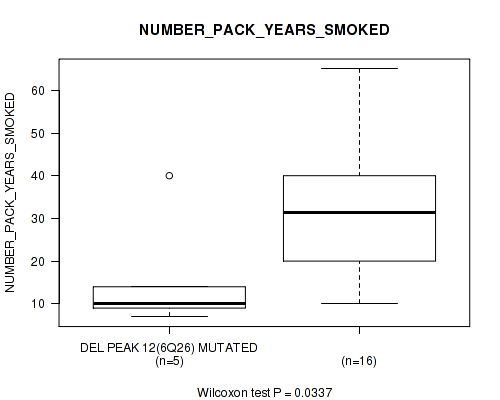
del_6q26 cnv correlated to 'PATHOLOGY_N_STAGE', 'GENDER', and 'NUMBER_PACK_YEARS_SMOKED'.
-
del_6q26 cnv correlated to 'PATHOLOGY_N_STAGE', 'GENDER', and 'NUMBER_PACK_YEARS_SMOKED'.
-
del_8p23.2 cnv correlated to 'Time to Death' and 'ETHNICITY'.
-
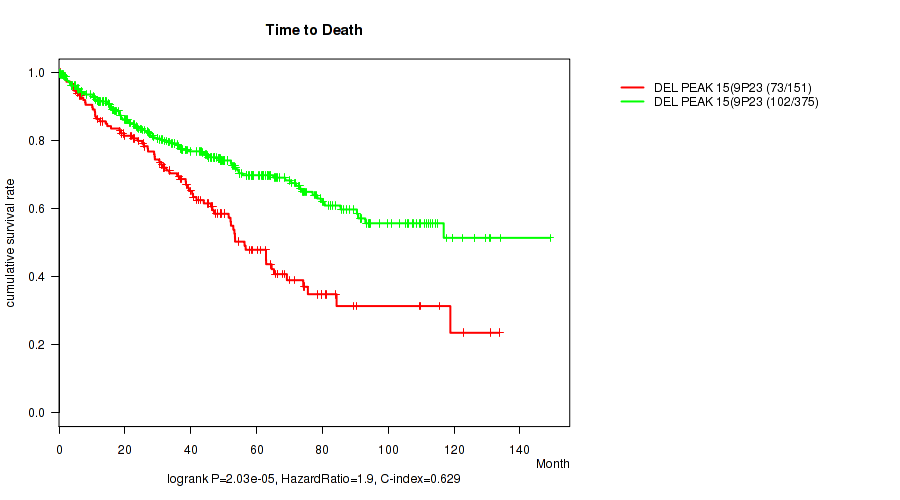
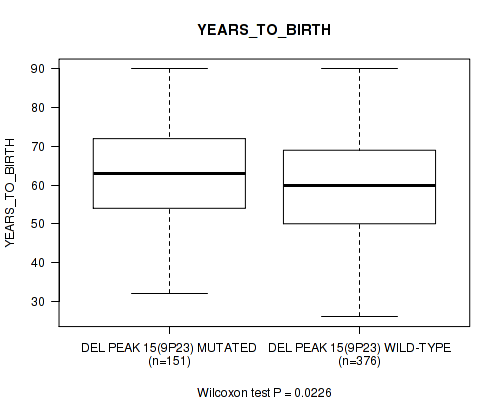
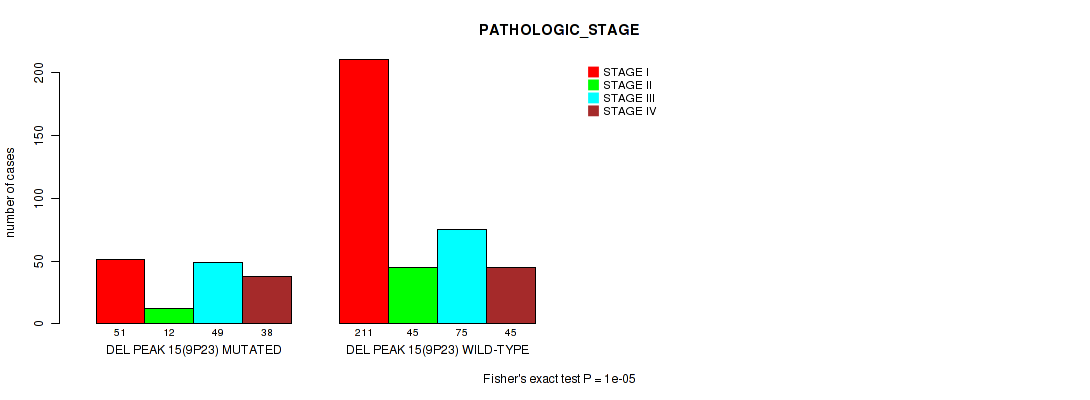
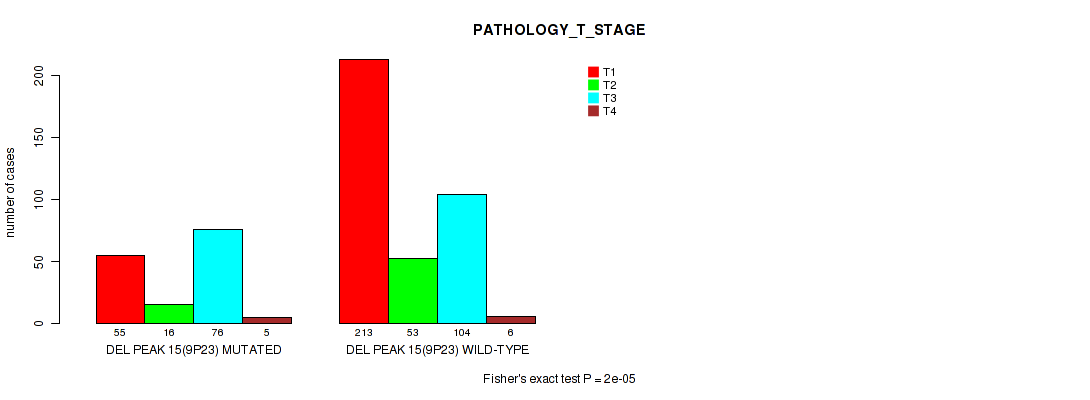
del_9p23 cnv correlated to 'Time to Death', 'YEARS_TO_BIRTH', 'PATHOLOGIC_STAGE', 'PATHOLOGY_T_STAGE', 'PATHOLOGY_M_STAGE', and 'GENDER'.
-
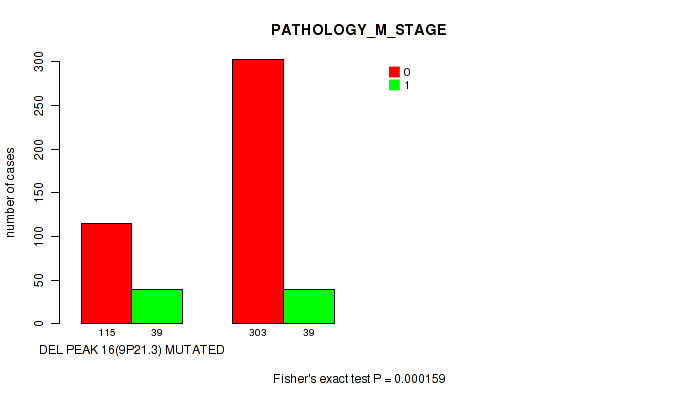
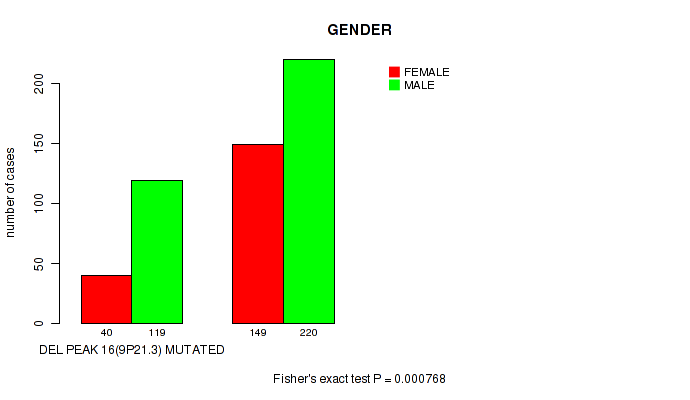
del_9p21.3 cnv correlated to 'Time to Death', 'YEARS_TO_BIRTH', 'PATHOLOGIC_STAGE', 'PATHOLOGY_T_STAGE', 'PATHOLOGY_N_STAGE', 'PATHOLOGY_M_STAGE', and 'GENDER'.
-
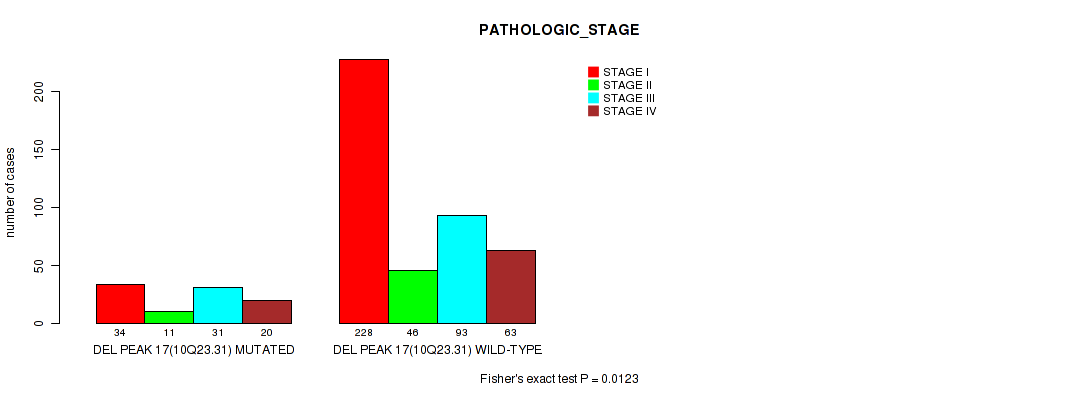
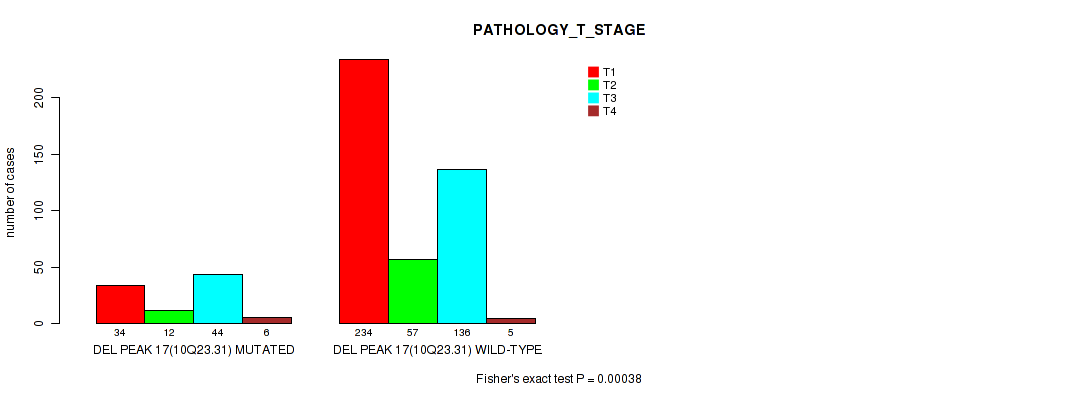
del_10q23.31 cnv correlated to 'PATHOLOGIC_STAGE' and 'PATHOLOGY_T_STAGE'.
-
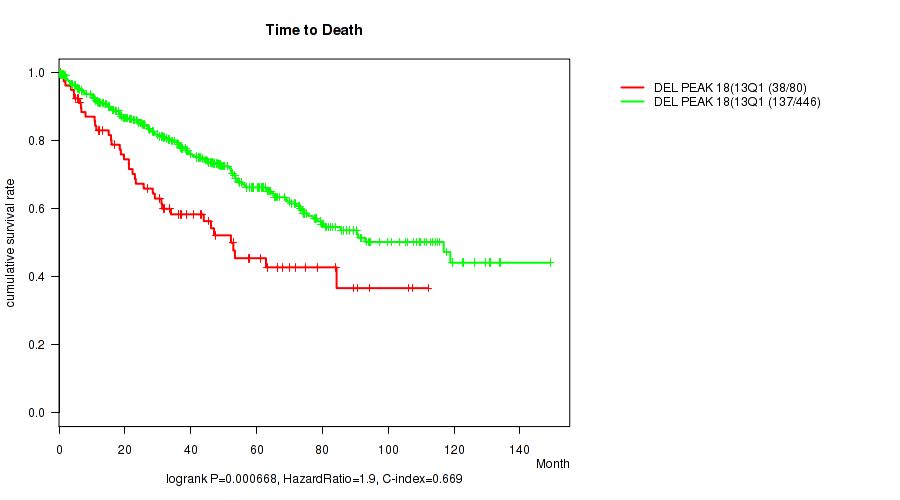
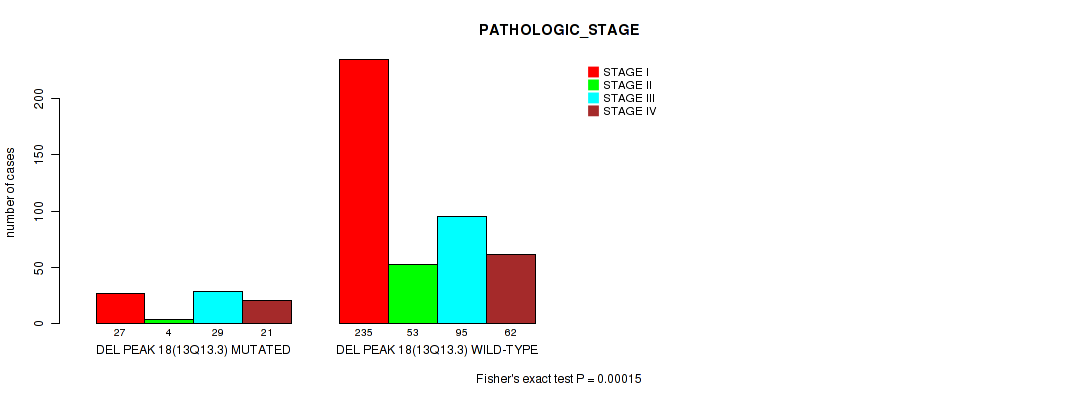
del_13q13.3 cnv correlated to 'Time to Death', 'PATHOLOGIC_STAGE', and 'PATHOLOGY_T_STAGE'.
-
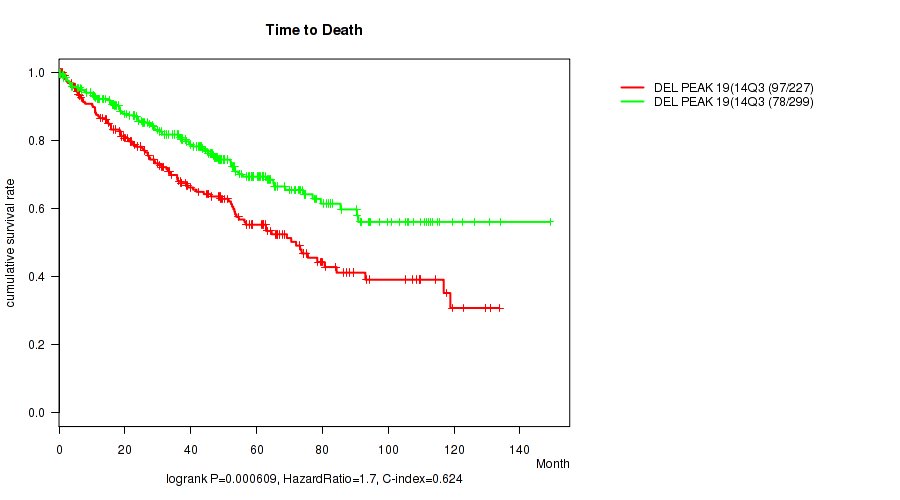
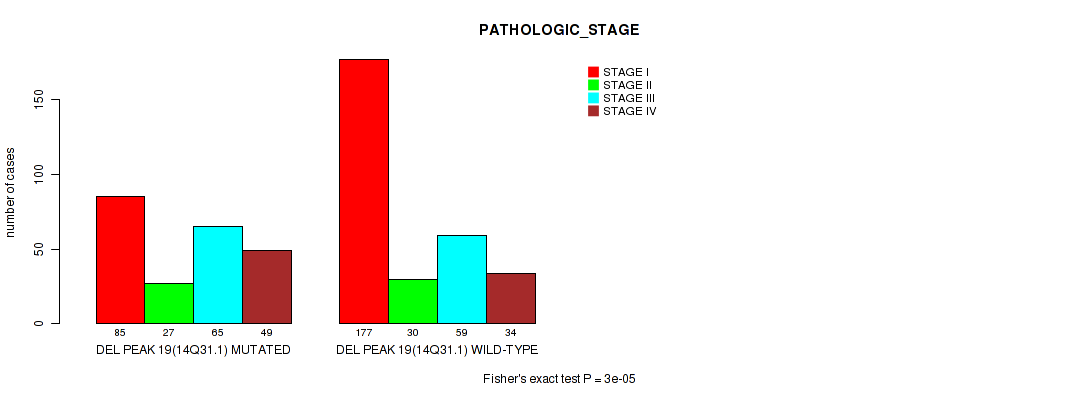
del_14q31.1 cnv correlated to 'Time to Death', 'PATHOLOGIC_STAGE', 'PATHOLOGY_T_STAGE', 'PATHOLOGY_N_STAGE', 'PATHOLOGY_M_STAGE', 'KARNOFSKY_PERFORMANCE_SCORE', and 'RACE'.
Table 1. Get Full Table Overview of the association between significant copy number variation of 29 focal events and 12 clinical features. Shown in the table are P values (Q values). Thresholded by Q value < 0.25, 73 significant findings detected.
|
Clinical Features |
Time to Death |
YEARS TO BIRTH |
PATHOLOGIC STAGE |
PATHOLOGY T STAGE |
PATHOLOGY N STAGE |
PATHOLOGY M STAGE |
GENDER |
KARNOFSKY PERFORMANCE SCORE |
NUMBER PACK YEARS SMOKED |
YEAR OF TOBACCO SMOKING ONSET |
RACE | ETHNICITY | ||
| nCNV (%) | nWild-Type | logrank test | Wilcoxon-test | Fisher's exact test | Fisher's exact test | Fisher's exact test | Fisher's exact test | Fisher's exact test | Wilcoxon-test | Wilcoxon-test | Wilcoxon-test | Fisher's exact test | Fisher's exact test | |
| del 9p21 3 | 159 (30%) | 369 |
4.25e-07 (7.4e-05) |
0.0385 (0.205) |
1e-05 (0.000435) |
1e-05 (0.000435) |
0.0126 (0.105) |
0.000159 (0.00277) |
0.000768 (0.00891) |
0.315 (0.718) |
0.91 (1.00) |
0.935 (1.00) |
0.0594 (0.265) |
0.827 (1.00) |
| del 14q31 1 | 228 (43%) | 300 |
0.000609 (0.00785) |
0.0959 (0.346) |
3e-05 (0.00087) |
7e-05 (0.00152) |
0.000258 (0.00408) |
0.00114 (0.012) |
0.17 (0.515) |
0.0296 (0.181) |
0.37 (0.767) |
0.199 (0.528) |
0.0395 (0.205) |
1 (1.00) |
| del 9p23 | 152 (29%) | 376 |
2.03e-05 (0.000642) |
0.0226 (0.157) |
1e-05 (0.000435) |
2e-05 (0.000642) |
0.0879 (0.338) |
0.00173 (0.0172) |
0.0019 (0.0184) |
0.315 (0.718) |
0.707 (0.988) |
0.872 (1.00) |
0.321 (0.725) |
0.655 (0.958) |
| del 4q34 3 | 78 (15%) | 450 |
0.000362 (0.00548) |
0.56 (0.918) |
1e-05 (0.000435) |
1e-05 (0.000435) |
0.714 (0.993) |
0.0278 (0.179) |
0.371 (0.767) |
0.877 (1.00) |
0.0247 (0.169) |
0.579 (0.918) |
||
| amp 3q26 32 | 87 (16%) | 441 |
0.106 (0.376) |
0.991 (1.00) |
5e-05 (0.00116) |
0.00013 (0.00266) |
0.0516 (0.246) |
0.000414 (0.00577) |
0.903 (1.00) |
0.815 (1.00) |
1 (1.00) |
0.571 (0.918) |
1 (1.00) |
|
| amp 7q31 2 | 175 (33%) | 353 |
0.427 (0.818) |
0.326 (0.733) |
0.00766 (0.0684) |
0.0395 (0.205) |
0.306 (0.709) |
0.00158 (0.0162) |
0.016 (0.127) |
0.138 (0.463) |
0.154 (0.492) |
0.233 (0.591) |
0.081 (0.324) |
0.27 (0.657) |
| amp 8q24 22 | 79 (15%) | 449 |
0.0297 (0.181) |
0.00692 (0.0634) |
0.00111 (0.012) |
0.00076 (0.00891) |
0.728 (0.995) |
0.0578 (0.265) |
0.0747 (0.307) |
0.523 (0.892) |
0.8 (1.00) |
0.256 (0.627) |
0.229 (0.591) |
|
| amp 5q35 1 | 332 (63%) | 196 |
0.041 (0.21) |
0.183 (0.528) |
0.343 (0.736) |
0.241 (0.603) |
0.192 (0.528) |
0.306 (0.709) |
0.0484 (0.234) |
0.836 (1.00) |
0.155 (0.492) |
0.47 (0.847) |
0.00254 (0.0239) |
1 (1.00) |
| del 3p25 3 | 463 (88%) | 65 |
0.88 (1.00) |
0.512 (0.89) |
0.0453 (0.222) |
0.0011 (0.012) |
1 (1.00) |
0.848 (1.00) |
0.783 (1.00) |
0.279 (0.675) |
0.619 (0.945) |
5e-05 (0.00116) |
1 (1.00) |
|
| del 3p22 2 | 465 (88%) | 63 |
0.66 (0.962) |
0.53 (0.896) |
0.0182 (0.135) |
0.0002 (0.00331) |
1 (1.00) |
0.563 (0.918) |
0.89 (1.00) |
0.482 (0.86) |
0.619 (0.945) |
1e-05 (0.000435) |
1 (1.00) |
|
| del 6q26 | 151 (29%) | 377 |
0.803 (1.00) |
0.236 (0.595) |
0.342 (0.736) |
0.568 (0.918) |
0.0177 (0.134) |
0.588 (0.918) |
0.0274 (0.179) |
0.181 (0.528) |
0.0337 (0.192) |
0.643 (0.952) |
0.0688 (0.292) |
0.12 (0.414) |
| del 6q26 | 151 (29%) | 377 |
0.826 (1.00) |
0.194 (0.528) |
0.341 (0.736) |
0.568 (0.918) |
0.0177 (0.134) |
0.588 (0.918) |
0.0161 (0.127) |
0.181 (0.528) |
0.0337 (0.192) |
0.643 (0.952) |
0.0702 (0.294) |
0.12 (0.414) |
| del 13q13 3 | 81 (15%) | 447 |
0.000668 (0.00831) |
0.942 (1.00) |
0.00015 (0.00275) |
5e-05 (0.00116) |
0.181 (0.528) |
0.0652 (0.28) |
0.802 (1.00) |
0.665 (0.964) |
0.478 (0.857) |
0.0932 (0.345) |
0.15 (0.487) |
|
| amp 10p14 | 20 (4%) | 508 |
0.847 (1.00) |
0.0424 (0.211) |
0.189 (0.528) |
0.0289 (0.181) |
0.191 (0.528) |
0.536 (0.896) |
0.643 (0.952) |
0.346 (0.737) |
0.381 (0.781) |
1 (1.00) |
||
| del 1p36 13 | 99 (19%) | 429 |
0.0304 (0.182) |
0.0362 (0.2) |
0.629 (0.952) |
0.365 (0.766) |
0.763 (1.00) |
1 (1.00) |
0.163 (0.501) |
0.46 (0.838) |
0.919 (1.00) |
1 (1.00) |
0.315 (0.718) |
|
| del 3p12 3 | 339 (64%) | 189 |
0.964 (1.00) |
0.719 (0.993) |
0.192 (0.528) |
0.0268 (0.179) |
0.192 (0.528) |
0.441 (0.829) |
0.000148 (0.00275) |
0.69 (0.976) |
0.913 (1.00) |
0.871 (1.00) |
0.13 (0.442) |
1 (1.00) |
| del 3p11 1 | 237 (45%) | 291 |
0.428 (0.818) |
0.0419 (0.211) |
0.635 (0.952) |
0.704 (0.988) |
0.805 (1.00) |
0.386 (0.786) |
1.67e-05 (0.000642) |
0.5 (0.883) |
0.523 (0.892) |
0.684 (0.976) |
0.703 (0.988) |
0.415 (0.807) |
| del 3q11 2 | 161 (30%) | 367 |
0.672 (0.966) |
0.00991 (0.0862) |
0.405 (0.8) |
0.0885 (0.338) |
0.409 (0.803) |
0.689 (0.976) |
8.29e-08 (2.88e-05) |
0.164 (0.501) |
0.588 (0.918) |
0.19 (0.528) |
0.372 (0.767) |
|
| del 8p23 2 | 154 (29%) | 374 |
0.0325 (0.192) |
0.131 (0.442) |
0.0964 (0.346) |
0.075 (0.307) |
0.785 (1.00) |
0.14 (0.466) |
0.232 (0.591) |
0.516 (0.892) |
0.647 (0.954) |
0.865 (1.00) |
0.0541 (0.253) |
0.0361 (0.2) |
| del 10q23 31 | 96 (18%) | 432 |
0.198 (0.528) |
0.46 (0.838) |
0.0123 (0.105) |
0.00038 (0.00551) |
1 (1.00) |
0.434 (0.825) |
0.0593 (0.265) |
0.792 (1.00) |
0.147 (0.482) |
0.427 (0.818) |
||
| amp 1q24 1 | 62 (12%) | 466 |
0.0187 (0.136) |
0.0803 (0.324) |
0.117 (0.411) |
0.0948 (0.346) |
0.0624 (0.272) |
0.194 (0.528) |
0.575 (0.918) |
0.401 (0.8) |
0.534 (0.896) |
0.52 (0.892) |
||
| amp 1q32 1 | 62 (12%) | 466 |
0.0621 (0.272) |
0.0211 (0.15) |
0.0842 (0.329) |
0.0828 (0.328) |
0.462 (0.838) |
0.352 (0.742) |
0.575 (0.918) |
0.401 (0.8) |
0.532 (0.896) |
0.2 (0.528) |
||
| del 1p31 1 | 77 (15%) | 451 |
0.248 (0.617) |
0.176 (0.528) |
0.572 (0.918) |
0.0388 (0.205) |
0.3 (0.707) |
0.73 (0.995) |
0.0544 (0.253) |
0.881 (1.00) |
0.607 (0.939) |
0.0916 (0.343) |
||
| del 3p12 2 | 305 (58%) | 223 |
0.339 (0.736) |
0.858 (1.00) |
0.671 (0.966) |
0.211 (0.548) |
0.449 (0.836) |
0.457 (0.838) |
0.000479 (0.00642) |
0.25 (0.618) |
1 (1.00) |
0.871 (1.00) |
0.288 (0.686) |
0.538 (0.896) |
| amp 4q32 1 | 16 (3%) | 512 |
0.197 (0.528) |
0.338 (0.736) |
0.762 (1.00) |
0.341 (0.736) |
0.511 (0.89) |
1 (1.00) |
0.598 (0.929) |
0.151 (0.487) |
1 (1.00) |
1 (1.00) |
||
| amp xq11 2 | 29 (5%) | 499 |
0.643 (0.952) |
0.297 (0.703) |
0.287 (0.686) |
0.347 (0.737) |
1 (1.00) |
0.411 (0.803) |
1 (1.00) |
0.587 (0.918) |
0.0893 (0.338) |
0.612 (0.943) |
||
| amp xq28 | 37 (7%) | 491 |
0.556 (0.918) |
0.504 (0.885) |
0.456 (0.838) |
0.643 (0.952) |
1 (1.00) |
0.211 (0.548) |
0.859 (1.00) |
0.331 (0.736) |
1 (1.00) |
0.394 (0.797) |
||
| del 1q44 | 44 (8%) | 484 |
0.774 (1.00) |
0.444 (0.831) |
0.921 (1.00) |
0.157 (0.493) |
1 (1.00) |
1 (1.00) |
1 (1.00) |
0.655 (0.958) |
0.726 (0.995) |
0.732 (0.995) |
||
| del 2q37 3 | 50 (9%) | 478 |
0.88 (1.00) |
0.718 (0.993) |
0.44 (0.829) |
0.688 (0.976) |
1 (1.00) |
0.403 (0.8) |
0.163 (0.501) |
0.761 (1.00) |
0.492 (0.874) |
P value = 0.0187 (logrank test), Q value = 0.14
Table S1. Gene #1: 'amp_1q24.1' versus Clinical Feature #1: 'Time to Death'
| nPatients | nDeath | Duration Range (Median), Month | |
|---|---|---|---|
| ALL | 526 | 175 | 0.1 - 149.2 (38.8) |
| AMP PEAK 1(1Q24.1) MUTATED | 62 | 29 | 0.4 - 129.4 (28.9) |
| AMP PEAK 1(1Q24.1) WILD-TYPE | 464 | 146 | 0.1 - 149.2 (39.7) |
Figure S1. Get High-res Image Gene #1: 'amp_1q24.1' versus Clinical Feature #1: 'Time to Death'
P value = 0.0211 (Wilcoxon-test), Q value = 0.15
Table S2. Gene #2: 'amp_1q32.1' versus Clinical Feature #2: 'YEARS_TO_BIRTH'
| nPatients | Mean (Std.Dev) | |
|---|---|---|
| ALL | 527 | 60.5 (12.1) |
| AMP PEAK 2(1Q32.1) MUTATED | 62 | 63.4 (11.9) |
| AMP PEAK 2(1Q32.1) WILD-TYPE | 465 | 60.1 (12.1) |
Figure S2. Get High-res Image Gene #2: 'amp_1q32.1' versus Clinical Feature #2: 'YEARS_TO_BIRTH'
P value = 5e-05 (Fisher's exact test), Q value = 0.0012
Table S3. Gene #3: 'amp_3q26.32' versus Clinical Feature #3: 'PATHOLOGIC_STAGE'
| nPatients | STAGE I | STAGE II | STAGE III | STAGE IV |
|---|---|---|---|---|
| ALL | 262 | 57 | 124 | 83 |
| AMP PEAK 3(3Q26.32) MUTATED | 28 | 6 | 26 | 27 |
| AMP PEAK 3(3Q26.32) WILD-TYPE | 234 | 51 | 98 | 56 |
Figure S3. Get High-res Image Gene #3: 'amp_3q26.32' versus Clinical Feature #3: 'PATHOLOGIC_STAGE'
P value = 0.00013 (Fisher's exact test), Q value = 0.0027
Table S4. Gene #3: 'amp_3q26.32' versus Clinical Feature #4: 'PATHOLOGY_T_STAGE'
| nPatients | T1 | T2 | T3 | T4 |
|---|---|---|---|---|
| ALL | 268 | 69 | 180 | 11 |
| AMP PEAK 3(3Q26.32) MUTATED | 29 | 8 | 46 | 4 |
| AMP PEAK 3(3Q26.32) WILD-TYPE | 239 | 61 | 134 | 7 |
Figure S4. Get High-res Image Gene #3: 'amp_3q26.32' versus Clinical Feature #4: 'PATHOLOGY_T_STAGE'
P value = 0.0516 (Fisher's exact test), Q value = 0.25
Table S5. Gene #3: 'amp_3q26.32' versus Clinical Feature #5: 'PATHOLOGY_N_STAGE'
| nPatients | 0 | 1 |
|---|---|---|
| ALL | 234 | 17 |
| AMP PEAK 3(3Q26.32) MUTATED | 43 | 7 |
| AMP PEAK 3(3Q26.32) WILD-TYPE | 191 | 10 |
Figure S5. Get High-res Image Gene #3: 'amp_3q26.32' versus Clinical Feature #5: 'PATHOLOGY_N_STAGE'
P value = 0.000414 (Fisher's exact test), Q value = 0.0058
Table S6. Gene #3: 'amp_3q26.32' versus Clinical Feature #6: 'PATHOLOGY_M_STAGE'
| nPatients | 0 | 1 |
|---|---|---|
| ALL | 418 | 78 |
| AMP PEAK 3(3Q26.32) MUTATED | 59 | 25 |
| AMP PEAK 3(3Q26.32) WILD-TYPE | 359 | 53 |
Figure S6. Get High-res Image Gene #3: 'amp_3q26.32' versus Clinical Feature #6: 'PATHOLOGY_M_STAGE'
P value = 0.041 (logrank test), Q value = 0.21
Table S7. Gene #5: 'amp_5q35.1' versus Clinical Feature #1: 'Time to Death'
| nPatients | nDeath | Duration Range (Median), Month | |
|---|---|---|---|
| ALL | 526 | 175 | 0.1 - 149.2 (38.8) |
| AMP PEAK 5(5Q35.1) MUTATED | 332 | 104 | 0.1 - 149.2 (43.6) |
| AMP PEAK 5(5Q35.1) WILD-TYPE | 194 | 71 | 0.1 - 126.3 (33.7) |
Figure S7. Get High-res Image Gene #5: 'amp_5q35.1' versus Clinical Feature #1: 'Time to Death'
P value = 0.0484 (Fisher's exact test), Q value = 0.23
Table S8. Gene #5: 'amp_5q35.1' versus Clinical Feature #7: 'GENDER'
| nPatients | FEMALE | MALE |
|---|---|---|
| ALL | 189 | 339 |
| AMP PEAK 5(5Q35.1) MUTATED | 108 | 224 |
| AMP PEAK 5(5Q35.1) WILD-TYPE | 81 | 115 |
Figure S8. Get High-res Image Gene #5: 'amp_5q35.1' versus Clinical Feature #7: 'GENDER'
P value = 0.00254 (Fisher's exact test), Q value = 0.024
Table S9. Gene #5: 'amp_5q35.1' versus Clinical Feature #11: 'RACE'
| nPatients | ASIAN | BLACK OR AFRICAN AMERICAN | WHITE |
|---|---|---|---|
| ALL | 8 | 56 | 457 |
| AMP PEAK 5(5Q35.1) MUTATED | 3 | 25 | 299 |
| AMP PEAK 5(5Q35.1) WILD-TYPE | 5 | 31 | 158 |
Figure S9. Get High-res Image Gene #5: 'amp_5q35.1' versus Clinical Feature #11: 'RACE'
P value = 0.00766 (Fisher's exact test), Q value = 0.068
Table S10. Gene #6: 'amp_7q31.2' versus Clinical Feature #3: 'PATHOLOGIC_STAGE'
| nPatients | STAGE I | STAGE II | STAGE III | STAGE IV |
|---|---|---|---|---|
| ALL | 262 | 57 | 124 | 83 |
| AMP PEAK 6(7Q31.2) MUTATED | 74 | 16 | 44 | 40 |
| AMP PEAK 6(7Q31.2) WILD-TYPE | 188 | 41 | 80 | 43 |
Figure S10. Get High-res Image Gene #6: 'amp_7q31.2' versus Clinical Feature #3: 'PATHOLOGIC_STAGE'
P value = 0.0395 (Fisher's exact test), Q value = 0.21
Table S11. Gene #6: 'amp_7q31.2' versus Clinical Feature #4: 'PATHOLOGY_T_STAGE'
| nPatients | T1 | T2 | T3 | T4 |
|---|---|---|---|---|
| ALL | 268 | 69 | 180 | 11 |
| AMP PEAK 6(7Q31.2) MUTATED | 76 | 21 | 74 | 4 |
| AMP PEAK 6(7Q31.2) WILD-TYPE | 192 | 48 | 106 | 7 |
Figure S11. Get High-res Image Gene #6: 'amp_7q31.2' versus Clinical Feature #4: 'PATHOLOGY_T_STAGE'
P value = 0.00158 (Fisher's exact test), Q value = 0.016
Table S12. Gene #6: 'amp_7q31.2' versus Clinical Feature #6: 'PATHOLOGY_M_STAGE'
| nPatients | 0 | 1 |
|---|---|---|
| ALL | 418 | 78 |
| AMP PEAK 6(7Q31.2) MUTATED | 128 | 39 |
| AMP PEAK 6(7Q31.2) WILD-TYPE | 290 | 39 |
Figure S12. Get High-res Image Gene #6: 'amp_7q31.2' versus Clinical Feature #6: 'PATHOLOGY_M_STAGE'
P value = 0.016 (Fisher's exact test), Q value = 0.13
Table S13. Gene #6: 'amp_7q31.2' versus Clinical Feature #7: 'GENDER'
| nPatients | FEMALE | MALE |
|---|---|---|
| ALL | 189 | 339 |
| AMP PEAK 6(7Q31.2) MUTATED | 50 | 125 |
| AMP PEAK 6(7Q31.2) WILD-TYPE | 139 | 214 |
Figure S13. Get High-res Image Gene #6: 'amp_7q31.2' versus Clinical Feature #7: 'GENDER'
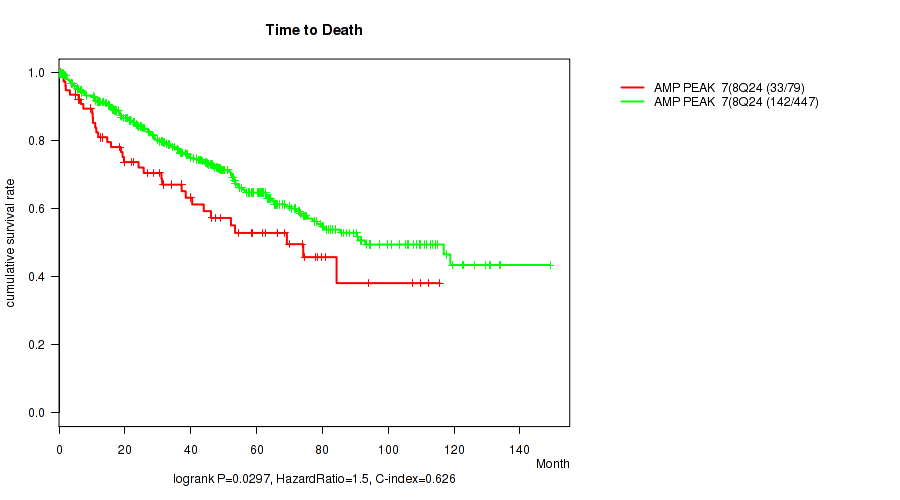
P value = 0.0297 (logrank test), Q value = 0.18
Table S14. Gene #7: 'amp_8q24.22' versus Clinical Feature #1: 'Time to Death'
| nPatients | nDeath | Duration Range (Median), Month | |
|---|---|---|---|
| ALL | 526 | 175 | 0.1 - 149.2 (38.8) |
| AMP PEAK 7(8Q24.22) MUTATED | 79 | 33 | 0.5 - 115.7 (31.3) |
| AMP PEAK 7(8Q24.22) WILD-TYPE | 447 | 142 | 0.1 - 149.2 (40.7) |
Figure S14. Get High-res Image Gene #7: 'amp_8q24.22' versus Clinical Feature #1: 'Time to Death'
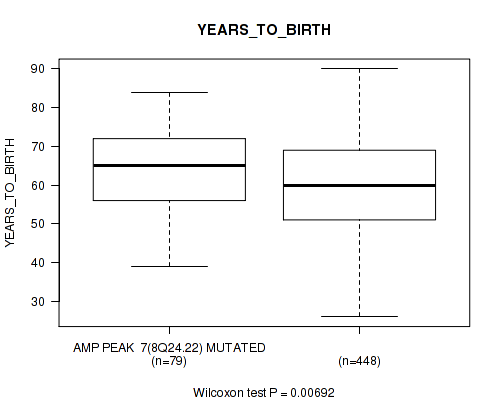
P value = 0.00692 (Wilcoxon-test), Q value = 0.063
Table S15. Gene #7: 'amp_8q24.22' versus Clinical Feature #2: 'YEARS_TO_BIRTH'
| nPatients | Mean (Std.Dev) | |
|---|---|---|
| ALL | 527 | 60.5 (12.1) |
| AMP PEAK 7(8Q24.22) MUTATED | 79 | 63.8 (11.4) |
| AMP PEAK 7(8Q24.22) WILD-TYPE | 448 | 59.9 (12.1) |
Figure S15. Get High-res Image Gene #7: 'amp_8q24.22' versus Clinical Feature #2: 'YEARS_TO_BIRTH'
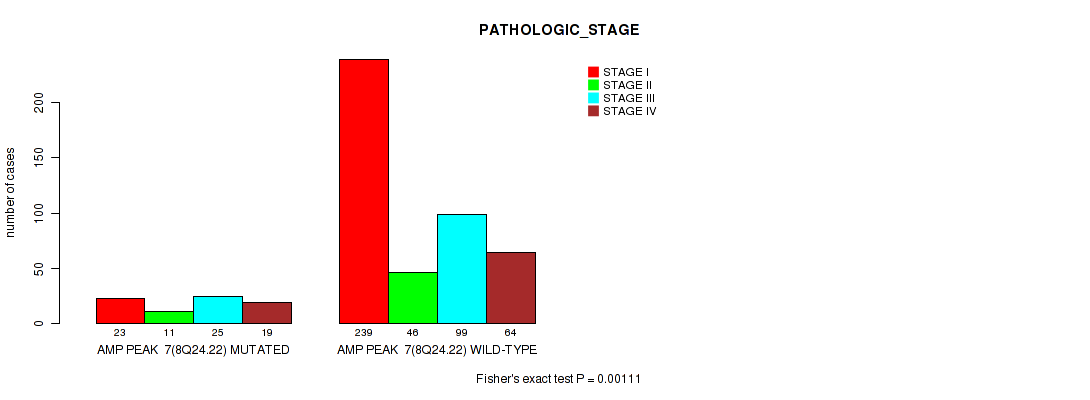
P value = 0.00111 (Fisher's exact test), Q value = 0.012
Table S16. Gene #7: 'amp_8q24.22' versus Clinical Feature #3: 'PATHOLOGIC_STAGE'
| nPatients | STAGE I | STAGE II | STAGE III | STAGE IV |
|---|---|---|---|---|
| ALL | 262 | 57 | 124 | 83 |
| AMP PEAK 7(8Q24.22) MUTATED | 23 | 11 | 25 | 19 |
| AMP PEAK 7(8Q24.22) WILD-TYPE | 239 | 46 | 99 | 64 |
Figure S16. Get High-res Image Gene #7: 'amp_8q24.22' versus Clinical Feature #3: 'PATHOLOGIC_STAGE'
P value = 0.00076 (Fisher's exact test), Q value = 0.0089
Table S17. Gene #7: 'amp_8q24.22' versus Clinical Feature #4: 'PATHOLOGY_T_STAGE'
| nPatients | T1 | T2 | T3 | T4 |
|---|---|---|---|---|
| ALL | 268 | 69 | 180 | 11 |
| AMP PEAK 7(8Q24.22) MUTATED | 24 | 12 | 41 | 2 |
| AMP PEAK 7(8Q24.22) WILD-TYPE | 244 | 57 | 139 | 9 |
Figure S17. Get High-res Image Gene #7: 'amp_8q24.22' versus Clinical Feature #4: 'PATHOLOGY_T_STAGE'
P value = 0.0424 (Wilcoxon-test), Q value = 0.21
Table S18. Gene #8: 'amp_10p14' versus Clinical Feature #2: 'YEARS_TO_BIRTH'
| nPatients | Mean (Std.Dev) | |
|---|---|---|
| ALL | 527 | 60.5 (12.1) |
| AMP PEAK 8(10P14) MUTATED | 20 | 65.5 (10.5) |
| AMP PEAK 8(10P14) WILD-TYPE | 507 | 60.3 (12.1) |
Figure S18. Get High-res Image Gene #8: 'amp_10p14' versus Clinical Feature #2: 'YEARS_TO_BIRTH'
P value = 0.0289 (Fisher's exact test), Q value = 0.18
Table S19. Gene #8: 'amp_10p14' versus Clinical Feature #4: 'PATHOLOGY_T_STAGE'
| nPatients | T1 | T2 | T3 | T4 |
|---|---|---|---|---|
| ALL | 268 | 69 | 180 | 11 |
| AMP PEAK 8(10P14) MUTATED | 9 | 5 | 4 | 2 |
| AMP PEAK 8(10P14) WILD-TYPE | 259 | 64 | 176 | 9 |
Figure S19. Get High-res Image Gene #8: 'amp_10p14' versus Clinical Feature #4: 'PATHOLOGY_T_STAGE'
P value = 0.0304 (logrank test), Q value = 0.18
Table S20. Gene #11: 'del_1p36.13' versus Clinical Feature #1: 'Time to Death'
| nPatients | nDeath | Duration Range (Median), Month | |
|---|---|---|---|
| ALL | 526 | 175 | 0.1 - 149.2 (38.8) |
| DEL PEAK 1(1P36.13) MUTATED | 99 | 43 | 0.5 - 130.7 (40.0) |
| DEL PEAK 1(1P36.13) WILD-TYPE | 427 | 132 | 0.1 - 149.2 (38.7) |
Figure S20. Get High-res Image Gene #11: 'del_1p36.13' versus Clinical Feature #1: 'Time to Death'
P value = 0.0362 (Wilcoxon-test), Q value = 0.2
Table S21. Gene #11: 'del_1p36.13' versus Clinical Feature #2: 'YEARS_TO_BIRTH'
| nPatients | Mean (Std.Dev) | |
|---|---|---|
| ALL | 527 | 60.5 (12.1) |
| DEL PEAK 1(1P36.13) MUTATED | 99 | 62.7 (11.7) |
| DEL PEAK 1(1P36.13) WILD-TYPE | 428 | 60.0 (12.2) |
Figure S21. Get High-res Image Gene #11: 'del_1p36.13' versus Clinical Feature #2: 'YEARS_TO_BIRTH'
P value = 0.0388 (Fisher's exact test), Q value = 0.21
Table S22. Gene #12: 'del_1p31.1' versus Clinical Feature #4: 'PATHOLOGY_T_STAGE'
| nPatients | T1 | T2 | T3 | T4 |
|---|---|---|---|---|
| ALL | 268 | 69 | 180 | 11 |
| DEL PEAK 2(1P31.1) MUTATED | 38 | 12 | 22 | 5 |
| DEL PEAK 2(1P31.1) WILD-TYPE | 230 | 57 | 158 | 6 |
Figure S22. Get High-res Image Gene #12: 'del_1p31.1' versus Clinical Feature #4: 'PATHOLOGY_T_STAGE'
P value = 0.0453 (Fisher's exact test), Q value = 0.22
Table S23. Gene #15: 'del_3p25.3' versus Clinical Feature #3: 'PATHOLOGIC_STAGE'
| nPatients | STAGE I | STAGE II | STAGE III | STAGE IV |
|---|---|---|---|---|
| ALL | 262 | 57 | 124 | 83 |
| DEL PEAK 5(3P25.3) MUTATED | 222 | 49 | 117 | 73 |
| DEL PEAK 5(3P25.3) WILD-TYPE | 40 | 8 | 7 | 10 |
Figure S23. Get High-res Image Gene #15: 'del_3p25.3' versus Clinical Feature #3: 'PATHOLOGIC_STAGE'
P value = 0.0011 (Fisher's exact test), Q value = 0.012
Table S24. Gene #15: 'del_3p25.3' versus Clinical Feature #4: 'PATHOLOGY_T_STAGE'
| nPatients | T1 | T2 | T3 | T4 |
|---|---|---|---|---|
| ALL | 268 | 69 | 180 | 11 |
| DEL PEAK 5(3P25.3) MUTATED | 228 | 61 | 168 | 6 |
| DEL PEAK 5(3P25.3) WILD-TYPE | 40 | 8 | 12 | 5 |
Figure S24. Get High-res Image Gene #15: 'del_3p25.3' versus Clinical Feature #4: 'PATHOLOGY_T_STAGE'

P value = 5e-05 (Fisher's exact test), Q value = 0.0012
Table S25. Gene #15: 'del_3p25.3' versus Clinical Feature #11: 'RACE'
| nPatients | ASIAN | BLACK OR AFRICAN AMERICAN | WHITE |
|---|---|---|---|
| ALL | 8 | 56 | 457 |
| DEL PEAK 5(3P25.3) MUTATED | 6 | 38 | 412 |
| DEL PEAK 5(3P25.3) WILD-TYPE | 2 | 18 | 45 |
Figure S25. Get High-res Image Gene #15: 'del_3p25.3' versus Clinical Feature #11: 'RACE'

P value = 0.0182 (Fisher's exact test), Q value = 0.14
Table S26. Gene #16: 'del_3p22.2' versus Clinical Feature #3: 'PATHOLOGIC_STAGE'
| nPatients | STAGE I | STAGE II | STAGE III | STAGE IV |
|---|---|---|---|---|
| ALL | 262 | 57 | 124 | 83 |
| DEL PEAK 6(3P22.2) MUTATED | 222 | 49 | 118 | 74 |
| DEL PEAK 6(3P22.2) WILD-TYPE | 40 | 8 | 6 | 9 |
Figure S26. Get High-res Image Gene #16: 'del_3p22.2' versus Clinical Feature #3: 'PATHOLOGIC_STAGE'

P value = 2e-04 (Fisher's exact test), Q value = 0.0033
Table S27. Gene #16: 'del_3p22.2' versus Clinical Feature #4: 'PATHOLOGY_T_STAGE'
| nPatients | T1 | T2 | T3 | T4 |
|---|---|---|---|---|
| ALL | 268 | 69 | 180 | 11 |
| DEL PEAK 6(3P22.2) MUTATED | 228 | 61 | 170 | 6 |
| DEL PEAK 6(3P22.2) WILD-TYPE | 40 | 8 | 10 | 5 |
Figure S27. Get High-res Image Gene #16: 'del_3p22.2' versus Clinical Feature #4: 'PATHOLOGY_T_STAGE'
P value = 1e-05 (Fisher's exact test), Q value = 0.00043
Table S28. Gene #16: 'del_3p22.2' versus Clinical Feature #11: 'RACE'
| nPatients | ASIAN | BLACK OR AFRICAN AMERICAN | WHITE |
|---|---|---|---|
| ALL | 8 | 56 | 457 |
| DEL PEAK 6(3P22.2) MUTATED | 6 | 38 | 414 |
| DEL PEAK 6(3P22.2) WILD-TYPE | 2 | 18 | 43 |
Figure S28. Get High-res Image Gene #16: 'del_3p22.2' versus Clinical Feature #11: 'RACE'
P value = 0.0268 (Fisher's exact test), Q value = 0.18
Table S29. Gene #17: 'del_3p12.3' versus Clinical Feature #4: 'PATHOLOGY_T_STAGE'
| nPatients | T1 | T2 | T3 | T4 |
|---|---|---|---|---|
| ALL | 268 | 69 | 180 | 11 |
| DEL PEAK 7(3P12.3) MUTATED | 165 | 48 | 123 | 3 |
| DEL PEAK 7(3P12.3) WILD-TYPE | 103 | 21 | 57 | 8 |
Figure S29. Get High-res Image Gene #17: 'del_3p12.3' versus Clinical Feature #4: 'PATHOLOGY_T_STAGE'

P value = 0.000148 (Fisher's exact test), Q value = 0.0027
Table S30. Gene #17: 'del_3p12.3' versus Clinical Feature #7: 'GENDER'
| nPatients | FEMALE | MALE |
|---|---|---|
| ALL | 189 | 339 |
| DEL PEAK 7(3P12.3) MUTATED | 101 | 238 |
| DEL PEAK 7(3P12.3) WILD-TYPE | 88 | 101 |
Figure S30. Get High-res Image Gene #17: 'del_3p12.3' versus Clinical Feature #7: 'GENDER'
P value = 0.000479 (Fisher's exact test), Q value = 0.0064
Table S31. Gene #18: 'del_3p12.2' versus Clinical Feature #7: 'GENDER'
| nPatients | FEMALE | MALE |
|---|---|---|
| ALL | 189 | 339 |
| DEL PEAK 8(3P12.2) MUTATED | 90 | 215 |
| DEL PEAK 8(3P12.2) WILD-TYPE | 99 | 124 |
Figure S31. Get High-res Image Gene #18: 'del_3p12.2' versus Clinical Feature #7: 'GENDER'
P value = 0.0419 (Wilcoxon-test), Q value = 0.21
Table S32. Gene #19: 'del_3p11.1' versus Clinical Feature #2: 'YEARS_TO_BIRTH'
| nPatients | Mean (Std.Dev) | |
|---|---|---|
| ALL | 527 | 60.5 (12.1) |
| DEL PEAK 9(3P11.1) MUTATED | 237 | 61.8 (12.3) |
| DEL PEAK 9(3P11.1) WILD-TYPE | 290 | 59.5 (11.8) |
Figure S32. Get High-res Image Gene #19: 'del_3p11.1' versus Clinical Feature #2: 'YEARS_TO_BIRTH'

P value = 1.67e-05 (Fisher's exact test), Q value = 0.00064
Table S33. Gene #19: 'del_3p11.1' versus Clinical Feature #7: 'GENDER'
| nPatients | FEMALE | MALE |
|---|---|---|
| ALL | 189 | 339 |
| DEL PEAK 9(3P11.1) MUTATED | 61 | 176 |
| DEL PEAK 9(3P11.1) WILD-TYPE | 128 | 163 |
Figure S33. Get High-res Image Gene #19: 'del_3p11.1' versus Clinical Feature #7: 'GENDER'
P value = 0.00991 (Wilcoxon-test), Q value = 0.086
Table S34. Gene #20: 'del_3q11.2' versus Clinical Feature #2: 'YEARS_TO_BIRTH'
| nPatients | Mean (Std.Dev) | |
|---|---|---|
| ALL | 527 | 60.5 (12.1) |
| DEL PEAK 10(3Q11.2) MUTATED | 161 | 62.8 (12.9) |
| DEL PEAK 10(3Q11.2) WILD-TYPE | 366 | 59.5 (11.6) |
Figure S34. Get High-res Image Gene #20: 'del_3q11.2' versus Clinical Feature #2: 'YEARS_TO_BIRTH'
P value = 8.29e-08 (Fisher's exact test), Q value = 2.9e-05
Table S35. Gene #20: 'del_3q11.2' versus Clinical Feature #7: 'GENDER'
| nPatients | FEMALE | MALE |
|---|---|---|
| ALL | 189 | 339 |
| DEL PEAK 10(3Q11.2) MUTATED | 31 | 130 |
| DEL PEAK 10(3Q11.2) WILD-TYPE | 158 | 209 |
Figure S35. Get High-res Image Gene #20: 'del_3q11.2' versus Clinical Feature #7: 'GENDER'
P value = 0.000362 (logrank test), Q value = 0.0055
Table S36. Gene #21: 'del_4q34.3' versus Clinical Feature #1: 'Time to Death'
| nPatients | nDeath | Duration Range (Median), Month | |
|---|---|---|---|
| ALL | 526 | 175 | 0.1 - 149.2 (38.8) |
| DEL PEAK 11(4Q34.3) MUTATED | 78 | 41 | 0.6 - 133.7 (38.5) |
| DEL PEAK 11(4Q34.3) WILD-TYPE | 448 | 134 | 0.1 - 149.2 (39.1) |
Figure S36. Get High-res Image Gene #21: 'del_4q34.3' versus Clinical Feature #1: 'Time to Death'
P value = 1e-05 (Fisher's exact test), Q value = 0.00043
Table S37. Gene #21: 'del_4q34.3' versus Clinical Feature #3: 'PATHOLOGIC_STAGE'
| nPatients | STAGE I | STAGE II | STAGE III | STAGE IV |
|---|---|---|---|---|
| ALL | 262 | 57 | 124 | 83 |
| DEL PEAK 11(4Q34.3) MUTATED | 19 | 7 | 30 | 22 |
| DEL PEAK 11(4Q34.3) WILD-TYPE | 243 | 50 | 94 | 61 |
Figure S37. Get High-res Image Gene #21: 'del_4q34.3' versus Clinical Feature #3: 'PATHOLOGIC_STAGE'
P value = 1e-05 (Fisher's exact test), Q value = 0.00043
Table S38. Gene #21: 'del_4q34.3' versus Clinical Feature #4: 'PATHOLOGY_T_STAGE'
| nPatients | T1 | T2 | T3 | T4 |
|---|---|---|---|---|
| ALL | 268 | 69 | 180 | 11 |
| DEL PEAK 11(4Q34.3) MUTATED | 20 | 9 | 43 | 6 |
| DEL PEAK 11(4Q34.3) WILD-TYPE | 248 | 60 | 137 | 5 |
Figure S38. Get High-res Image Gene #21: 'del_4q34.3' versus Clinical Feature #4: 'PATHOLOGY_T_STAGE'
P value = 0.0278 (Fisher's exact test), Q value = 0.18
Table S39. Gene #21: 'del_4q34.3' versus Clinical Feature #6: 'PATHOLOGY_M_STAGE'
| nPatients | 0 | 1 |
|---|---|---|
| ALL | 418 | 78 |
| DEL PEAK 11(4Q34.3) MUTATED | 59 | 19 |
| DEL PEAK 11(4Q34.3) WILD-TYPE | 359 | 59 |
Figure S39. Get High-res Image Gene #21: 'del_4q34.3' versus Clinical Feature #6: 'PATHOLOGY_M_STAGE'
P value = 0.0247 (Fisher's exact test), Q value = 0.17
Table S40. Gene #21: 'del_4q34.3' versus Clinical Feature #11: 'RACE'
| nPatients | ASIAN | BLACK OR AFRICAN AMERICAN | WHITE |
|---|---|---|---|
| ALL | 8 | 56 | 457 |
| DEL PEAK 11(4Q34.3) MUTATED | 1 | 2 | 73 |
| DEL PEAK 11(4Q34.3) WILD-TYPE | 7 | 54 | 384 |
Figure S40. Get High-res Image Gene #21: 'del_4q34.3' versus Clinical Feature #11: 'RACE'
P value = 0.0177 (Fisher's exact test), Q value = 0.13
Table S41. Gene #22: 'del_6q26' versus Clinical Feature #5: 'PATHOLOGY_N_STAGE'
| nPatients | 0 | 1 |
|---|---|---|
| ALL | 234 | 17 |
| DEL PEAK 12(6Q26) MUTATED | 56 | 9 |
| DEL PEAK 12(6Q26) WILD-TYPE | 178 | 8 |
Figure S41. Get High-res Image Gene #22: 'del_6q26' versus Clinical Feature #5: 'PATHOLOGY_N_STAGE'
P value = 0.0274 (Fisher's exact test), Q value = 0.18
Table S42. Gene #22: 'del_6q26' versus Clinical Feature #7: 'GENDER'
| nPatients | FEMALE | MALE |
|---|---|---|
| ALL | 189 | 339 |
| DEL PEAK 12(6Q26) MUTATED | 43 | 108 |
| DEL PEAK 12(6Q26) WILD-TYPE | 146 | 231 |
Figure S42. Get High-res Image Gene #22: 'del_6q26' versus Clinical Feature #7: 'GENDER'

P value = 0.0337 (Wilcoxon-test), Q value = 0.19
Table S43. Gene #22: 'del_6q26' versus Clinical Feature #9: 'NUMBER_PACK_YEARS_SMOKED'
| nPatients | Mean (Std.Dev) | |
|---|---|---|
| ALL | 21 | 28.3 (16.1) |
| DEL PEAK 12(6Q26) MUTATED | 5 | 16.0 (13.7) |
| DEL PEAK 12(6Q26) WILD-TYPE | 16 | 32.2 (15.2) |
Figure S43. Get High-res Image Gene #22: 'del_6q26' versus Clinical Feature #9: 'NUMBER_PACK_YEARS_SMOKED'
P value = 0.0177 (Fisher's exact test), Q value = 0.13
Table S44. Gene #23: 'del_6q26' versus Clinical Feature #5: 'PATHOLOGY_N_STAGE'
| nPatients | 0 | 1 |
|---|---|---|
| ALL | 234 | 17 |
| DEL PEAK 13(6Q26) MUTATED | 56 | 9 |
| DEL PEAK 13(6Q26) WILD-TYPE | 178 | 8 |
Figure S44. Get High-res Image Gene #23: 'del_6q26' versus Clinical Feature #5: 'PATHOLOGY_N_STAGE'

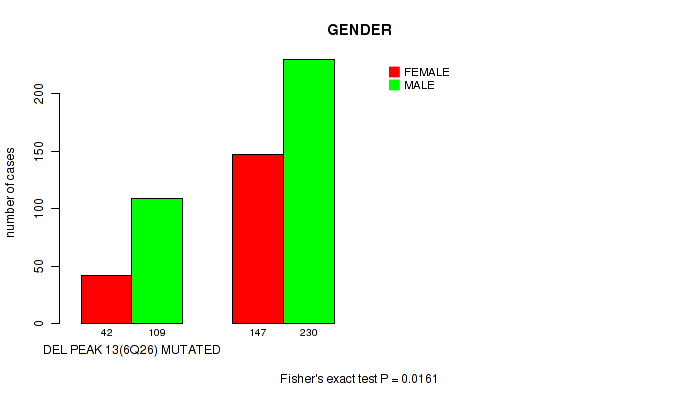
P value = 0.0161 (Fisher's exact test), Q value = 0.13
Table S45. Gene #23: 'del_6q26' versus Clinical Feature #7: 'GENDER'
| nPatients | FEMALE | MALE |
|---|---|---|
| ALL | 189 | 339 |
| DEL PEAK 13(6Q26) MUTATED | 42 | 109 |
| DEL PEAK 13(6Q26) WILD-TYPE | 147 | 230 |
Figure S45. Get High-res Image Gene #23: 'del_6q26' versus Clinical Feature #7: 'GENDER'
P value = 0.0337 (Wilcoxon-test), Q value = 0.19
Table S46. Gene #23: 'del_6q26' versus Clinical Feature #9: 'NUMBER_PACK_YEARS_SMOKED'
| nPatients | Mean (Std.Dev) | |
|---|---|---|
| ALL | 21 | 28.3 (16.1) |
| DEL PEAK 13(6Q26) MUTATED | 5 | 16.0 (13.7) |
| DEL PEAK 13(6Q26) WILD-TYPE | 16 | 32.2 (15.2) |
Figure S46. Get High-res Image Gene #23: 'del_6q26' versus Clinical Feature #9: 'NUMBER_PACK_YEARS_SMOKED'

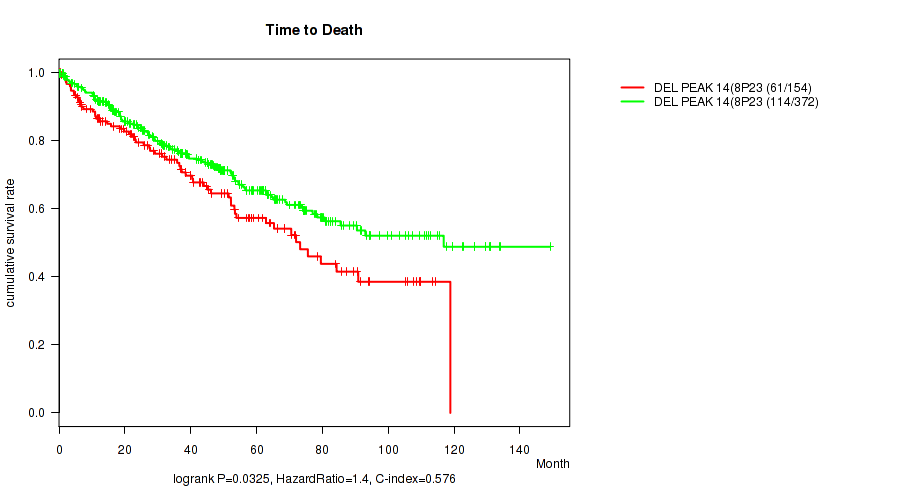
P value = 0.0325 (logrank test), Q value = 0.19
Table S47. Gene #24: 'del_8p23.2' versus Clinical Feature #1: 'Time to Death'
| nPatients | nDeath | Duration Range (Median), Month | |
|---|---|---|---|
| ALL | 526 | 175 | 0.1 - 149.2 (38.8) |
| DEL PEAK 14(8P23.2) MUTATED | 154 | 61 | 0.1 - 118.8 (37.1) |
| DEL PEAK 14(8P23.2) WILD-TYPE | 372 | 114 | 0.1 - 149.2 (41.7) |
Figure S47. Get High-res Image Gene #24: 'del_8p23.2' versus Clinical Feature #1: 'Time to Death'
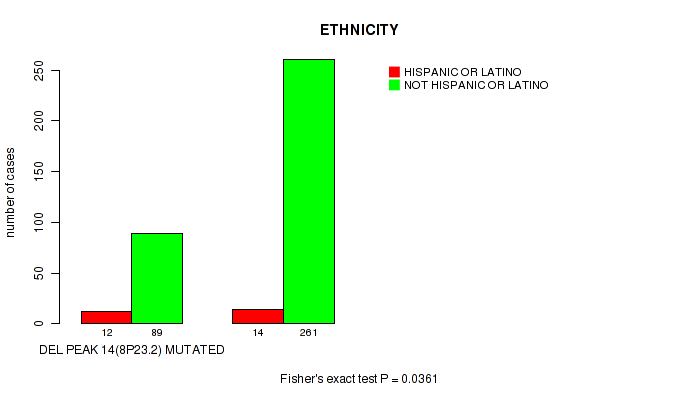
P value = 0.0361 (Fisher's exact test), Q value = 0.2
Table S48. Gene #24: 'del_8p23.2' versus Clinical Feature #12: 'ETHNICITY'
| nPatients | HISPANIC OR LATINO | NOT HISPANIC OR LATINO |
|---|---|---|
| ALL | 26 | 350 |
| DEL PEAK 14(8P23.2) MUTATED | 12 | 89 |
| DEL PEAK 14(8P23.2) WILD-TYPE | 14 | 261 |
Figure S48. Get High-res Image Gene #24: 'del_8p23.2' versus Clinical Feature #12: 'ETHNICITY'
P value = 2.03e-05 (logrank test), Q value = 0.00064
Table S49. Gene #25: 'del_9p23' versus Clinical Feature #1: 'Time to Death'
| nPatients | nDeath | Duration Range (Median), Month | |
|---|---|---|---|
| ALL | 526 | 175 | 0.1 - 149.2 (38.8) |
| DEL PEAK 15(9P23) MUTATED | 151 | 73 | 0.5 - 133.7 (39.2) |
| DEL PEAK 15(9P23) WILD-TYPE | 375 | 102 | 0.1 - 149.2 (38.7) |
Figure S49. Get High-res Image Gene #25: 'del_9p23' versus Clinical Feature #1: 'Time to Death'
P value = 0.0226 (Wilcoxon-test), Q value = 0.16
Table S50. Gene #25: 'del_9p23' versus Clinical Feature #2: 'YEARS_TO_BIRTH'
| nPatients | Mean (Std.Dev) | |
|---|---|---|
| ALL | 527 | 60.5 (12.1) |
| DEL PEAK 15(9P23) MUTATED | 151 | 62.3 (11.7) |
| DEL PEAK 15(9P23) WILD-TYPE | 376 | 59.8 (12.2) |
Figure S50. Get High-res Image Gene #25: 'del_9p23' versus Clinical Feature #2: 'YEARS_TO_BIRTH'
P value = 1e-05 (Fisher's exact test), Q value = 0.00043
Table S51. Gene #25: 'del_9p23' versus Clinical Feature #3: 'PATHOLOGIC_STAGE'
| nPatients | STAGE I | STAGE II | STAGE III | STAGE IV |
|---|---|---|---|---|
| ALL | 262 | 57 | 124 | 83 |
| DEL PEAK 15(9P23) MUTATED | 51 | 12 | 49 | 38 |
| DEL PEAK 15(9P23) WILD-TYPE | 211 | 45 | 75 | 45 |
Figure S51. Get High-res Image Gene #25: 'del_9p23' versus Clinical Feature #3: 'PATHOLOGIC_STAGE'
P value = 2e-05 (Fisher's exact test), Q value = 0.00064
Table S52. Gene #25: 'del_9p23' versus Clinical Feature #4: 'PATHOLOGY_T_STAGE'
| nPatients | T1 | T2 | T3 | T4 |
|---|---|---|---|---|
| ALL | 268 | 69 | 180 | 11 |
| DEL PEAK 15(9P23) MUTATED | 55 | 16 | 76 | 5 |
| DEL PEAK 15(9P23) WILD-TYPE | 213 | 53 | 104 | 6 |
Figure S52. Get High-res Image Gene #25: 'del_9p23' versus Clinical Feature #4: 'PATHOLOGY_T_STAGE'
P value = 0.00173 (Fisher's exact test), Q value = 0.017
Table S53. Gene #25: 'del_9p23' versus Clinical Feature #6: 'PATHOLOGY_M_STAGE'
| nPatients | 0 | 1 |
|---|---|---|
| ALL | 418 | 78 |
| DEL PEAK 15(9P23) MUTATED | 111 | 35 |
| DEL PEAK 15(9P23) WILD-TYPE | 307 | 43 |
Figure S53. Get High-res Image Gene #25: 'del_9p23' versus Clinical Feature #6: 'PATHOLOGY_M_STAGE'

P value = 0.0019 (Fisher's exact test), Q value = 0.018
Table S54. Gene #25: 'del_9p23' versus Clinical Feature #7: 'GENDER'
| nPatients | FEMALE | MALE |
|---|---|---|
| ALL | 189 | 339 |
| DEL PEAK 15(9P23) MUTATED | 39 | 113 |
| DEL PEAK 15(9P23) WILD-TYPE | 150 | 226 |
Figure S54. Get High-res Image Gene #25: 'del_9p23' versus Clinical Feature #7: 'GENDER'
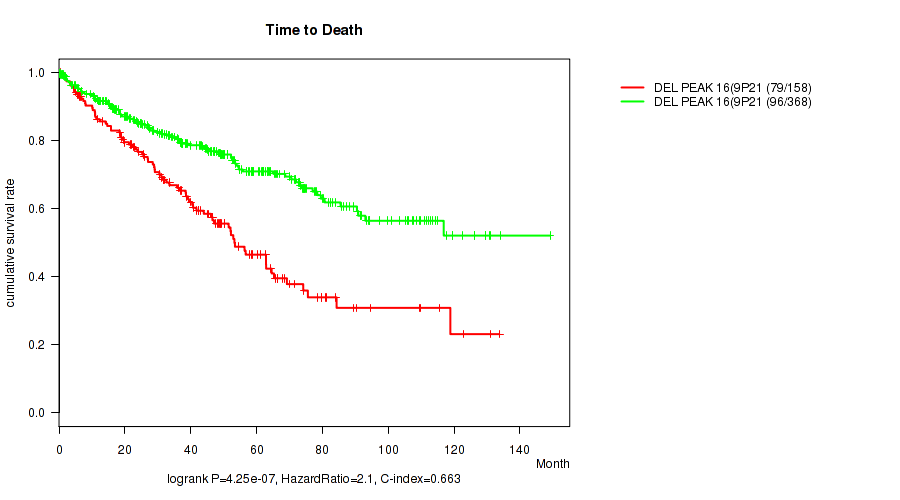
P value = 4.25e-07 (logrank test), Q value = 7.4e-05
Table S55. Gene #26: 'del_9p21.3' versus Clinical Feature #1: 'Time to Death'
| nPatients | nDeath | Duration Range (Median), Month | |
|---|---|---|---|
| ALL | 526 | 175 | 0.1 - 149.2 (38.8) |
| DEL PEAK 16(9P21.3) MUTATED | 158 | 79 | 0.5 - 133.7 (37.8) |
| DEL PEAK 16(9P21.3) WILD-TYPE | 368 | 96 | 0.1 - 149.2 (40.8) |
Figure S55. Get High-res Image Gene #26: 'del_9p21.3' versus Clinical Feature #1: 'Time to Death'
P value = 0.0385 (Wilcoxon-test), Q value = 0.21
Table S56. Gene #26: 'del_9p21.3' versus Clinical Feature #2: 'YEARS_TO_BIRTH'
| nPatients | Mean (Std.Dev) | |
|---|---|---|
| ALL | 527 | 60.5 (12.1) |
| DEL PEAK 16(9P21.3) MUTATED | 158 | 62.1 (11.6) |
| DEL PEAK 16(9P21.3) WILD-TYPE | 369 | 59.8 (12.3) |
Figure S56. Get High-res Image Gene #26: 'del_9p21.3' versus Clinical Feature #2: 'YEARS_TO_BIRTH'

P value = 1e-05 (Fisher's exact test), Q value = 0.00043
Table S57. Gene #26: 'del_9p21.3' versus Clinical Feature #3: 'PATHOLOGIC_STAGE'
| nPatients | STAGE I | STAGE II | STAGE III | STAGE IV |
|---|---|---|---|---|
| ALL | 262 | 57 | 124 | 83 |
| DEL PEAK 16(9P21.3) MUTATED | 52 | 11 | 53 | 41 |
| DEL PEAK 16(9P21.3) WILD-TYPE | 210 | 46 | 71 | 42 |
Figure S57. Get High-res Image Gene #26: 'del_9p21.3' versus Clinical Feature #3: 'PATHOLOGIC_STAGE'

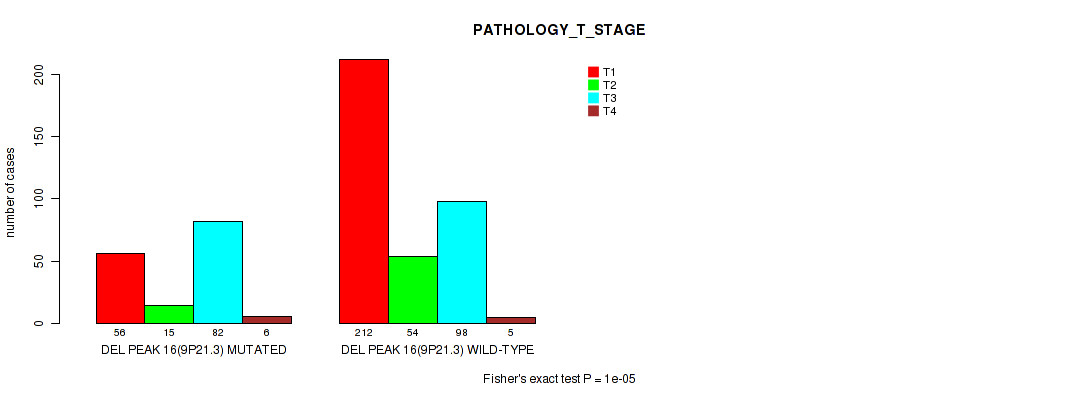
P value = 1e-05 (Fisher's exact test), Q value = 0.00043
Table S58. Gene #26: 'del_9p21.3' versus Clinical Feature #4: 'PATHOLOGY_T_STAGE'
| nPatients | T1 | T2 | T3 | T4 |
|---|---|---|---|---|
| ALL | 268 | 69 | 180 | 11 |
| DEL PEAK 16(9P21.3) MUTATED | 56 | 15 | 82 | 6 |
| DEL PEAK 16(9P21.3) WILD-TYPE | 212 | 54 | 98 | 5 |
Figure S58. Get High-res Image Gene #26: 'del_9p21.3' versus Clinical Feature #4: 'PATHOLOGY_T_STAGE'
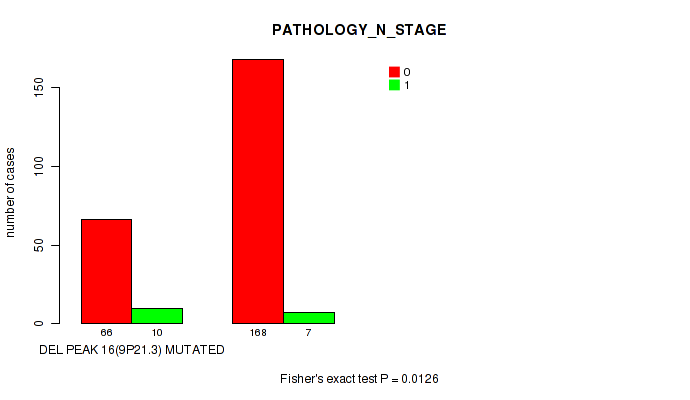
P value = 0.0126 (Fisher's exact test), Q value = 0.1
Table S59. Gene #26: 'del_9p21.3' versus Clinical Feature #5: 'PATHOLOGY_N_STAGE'
| nPatients | 0 | 1 |
|---|---|---|
| ALL | 234 | 17 |
| DEL PEAK 16(9P21.3) MUTATED | 66 | 10 |
| DEL PEAK 16(9P21.3) WILD-TYPE | 168 | 7 |
Figure S59. Get High-res Image Gene #26: 'del_9p21.3' versus Clinical Feature #5: 'PATHOLOGY_N_STAGE'
P value = 0.000159 (Fisher's exact test), Q value = 0.0028
Table S60. Gene #26: 'del_9p21.3' versus Clinical Feature #6: 'PATHOLOGY_M_STAGE'
| nPatients | 0 | 1 |
|---|---|---|
| ALL | 418 | 78 |
| DEL PEAK 16(9P21.3) MUTATED | 115 | 39 |
| DEL PEAK 16(9P21.3) WILD-TYPE | 303 | 39 |
Figure S60. Get High-res Image Gene #26: 'del_9p21.3' versus Clinical Feature #6: 'PATHOLOGY_M_STAGE'
P value = 0.000768 (Fisher's exact test), Q value = 0.0089
Table S61. Gene #26: 'del_9p21.3' versus Clinical Feature #7: 'GENDER'
| nPatients | FEMALE | MALE |
|---|---|---|
| ALL | 189 | 339 |
| DEL PEAK 16(9P21.3) MUTATED | 40 | 119 |
| DEL PEAK 16(9P21.3) WILD-TYPE | 149 | 220 |
Figure S61. Get High-res Image Gene #26: 'del_9p21.3' versus Clinical Feature #7: 'GENDER'
P value = 0.0123 (Fisher's exact test), Q value = 0.1
Table S62. Gene #27: 'del_10q23.31' versus Clinical Feature #3: 'PATHOLOGIC_STAGE'
| nPatients | STAGE I | STAGE II | STAGE III | STAGE IV |
|---|---|---|---|---|
| ALL | 262 | 57 | 124 | 83 |
| DEL PEAK 17(10Q23.31) MUTATED | 34 | 11 | 31 | 20 |
| DEL PEAK 17(10Q23.31) WILD-TYPE | 228 | 46 | 93 | 63 |
Figure S62. Get High-res Image Gene #27: 'del_10q23.31' versus Clinical Feature #3: 'PATHOLOGIC_STAGE'
P value = 0.00038 (Fisher's exact test), Q value = 0.0055
Table S63. Gene #27: 'del_10q23.31' versus Clinical Feature #4: 'PATHOLOGY_T_STAGE'
| nPatients | T1 | T2 | T3 | T4 |
|---|---|---|---|---|
| ALL | 268 | 69 | 180 | 11 |
| DEL PEAK 17(10Q23.31) MUTATED | 34 | 12 | 44 | 6 |
| DEL PEAK 17(10Q23.31) WILD-TYPE | 234 | 57 | 136 | 5 |
Figure S63. Get High-res Image Gene #27: 'del_10q23.31' versus Clinical Feature #4: 'PATHOLOGY_T_STAGE'
P value = 0.000668 (logrank test), Q value = 0.0083
Table S64. Gene #28: 'del_13q13.3' versus Clinical Feature #1: 'Time to Death'
| nPatients | nDeath | Duration Range (Median), Month | |
|---|---|---|---|
| ALL | 526 | 175 | 0.1 - 149.2 (38.8) |
| DEL PEAK 18(13Q13.3) MUTATED | 80 | 38 | 0.5 - 112.1 (31.5) |
| DEL PEAK 18(13Q13.3) WILD-TYPE | 446 | 137 | 0.1 - 149.2 (41.2) |
Figure S64. Get High-res Image Gene #28: 'del_13q13.3' versus Clinical Feature #1: 'Time to Death'
P value = 0.00015 (Fisher's exact test), Q value = 0.0027
Table S65. Gene #28: 'del_13q13.3' versus Clinical Feature #3: 'PATHOLOGIC_STAGE'
| nPatients | STAGE I | STAGE II | STAGE III | STAGE IV |
|---|---|---|---|---|
| ALL | 262 | 57 | 124 | 83 |
| DEL PEAK 18(13Q13.3) MUTATED | 27 | 4 | 29 | 21 |
| DEL PEAK 18(13Q13.3) WILD-TYPE | 235 | 53 | 95 | 62 |
Figure S65. Get High-res Image Gene #28: 'del_13q13.3' versus Clinical Feature #3: 'PATHOLOGIC_STAGE'
P value = 5e-05 (Fisher's exact test), Q value = 0.0012
Table S66. Gene #28: 'del_13q13.3' versus Clinical Feature #4: 'PATHOLOGY_T_STAGE'
| nPatients | T1 | T2 | T3 | T4 |
|---|---|---|---|---|
| ALL | 268 | 69 | 180 | 11 |
| DEL PEAK 18(13Q13.3) MUTATED | 29 | 5 | 41 | 6 |
| DEL PEAK 18(13Q13.3) WILD-TYPE | 239 | 64 | 139 | 5 |
Figure S66. Get High-res Image Gene #28: 'del_13q13.3' versus Clinical Feature #4: 'PATHOLOGY_T_STAGE'

P value = 0.000609 (logrank test), Q value = 0.0078
Table S67. Gene #29: 'del_14q31.1' versus Clinical Feature #1: 'Time to Death'
| nPatients | nDeath | Duration Range (Median), Month | |
|---|---|---|---|
| ALL | 526 | 175 | 0.1 - 149.2 (38.8) |
| DEL PEAK 19(14Q31.1) MUTATED | 227 | 97 | 0.4 - 133.7 (36.8) |
| DEL PEAK 19(14Q31.1) WILD-TYPE | 299 | 78 | 0.1 - 149.2 (42.7) |
Figure S67. Get High-res Image Gene #29: 'del_14q31.1' versus Clinical Feature #1: 'Time to Death'
P value = 3e-05 (Fisher's exact test), Q value = 0.00087
Table S68. Gene #29: 'del_14q31.1' versus Clinical Feature #3: 'PATHOLOGIC_STAGE'
| nPatients | STAGE I | STAGE II | STAGE III | STAGE IV |
|---|---|---|---|---|
| ALL | 262 | 57 | 124 | 83 |
| DEL PEAK 19(14Q31.1) MUTATED | 85 | 27 | 65 | 49 |
| DEL PEAK 19(14Q31.1) WILD-TYPE | 177 | 30 | 59 | 34 |
Figure S68. Get High-res Image Gene #29: 'del_14q31.1' versus Clinical Feature #3: 'PATHOLOGIC_STAGE'
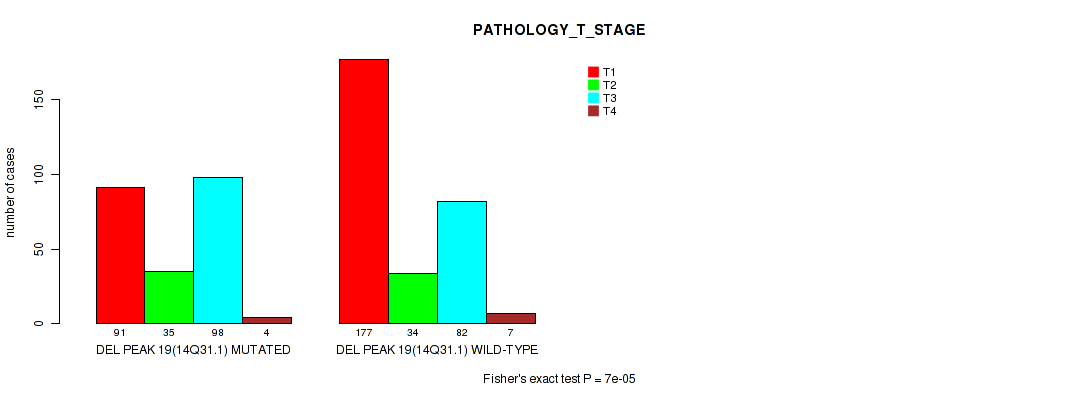
P value = 7e-05 (Fisher's exact test), Q value = 0.0015
Table S69. Gene #29: 'del_14q31.1' versus Clinical Feature #4: 'PATHOLOGY_T_STAGE'
| nPatients | T1 | T2 | T3 | T4 |
|---|---|---|---|---|
| ALL | 268 | 69 | 180 | 11 |
| DEL PEAK 19(14Q31.1) MUTATED | 91 | 35 | 98 | 4 |
| DEL PEAK 19(14Q31.1) WILD-TYPE | 177 | 34 | 82 | 7 |
Figure S69. Get High-res Image Gene #29: 'del_14q31.1' versus Clinical Feature #4: 'PATHOLOGY_T_STAGE'
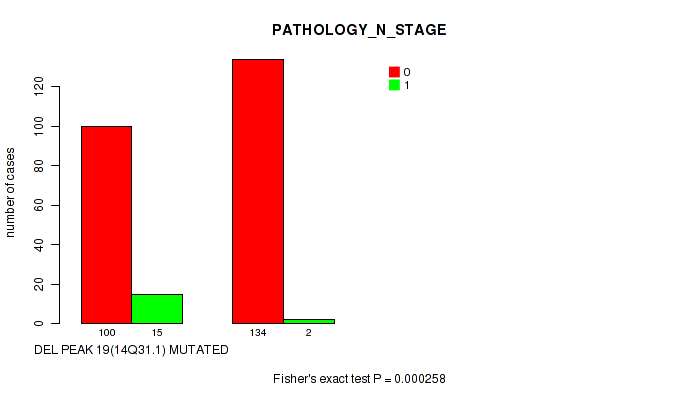
P value = 0.000258 (Fisher's exact test), Q value = 0.0041
Table S70. Gene #29: 'del_14q31.1' versus Clinical Feature #5: 'PATHOLOGY_N_STAGE'
| nPatients | 0 | 1 |
|---|---|---|
| ALL | 234 | 17 |
| DEL PEAK 19(14Q31.1) MUTATED | 100 | 15 |
| DEL PEAK 19(14Q31.1) WILD-TYPE | 134 | 2 |
Figure S70. Get High-res Image Gene #29: 'del_14q31.1' versus Clinical Feature #5: 'PATHOLOGY_N_STAGE'
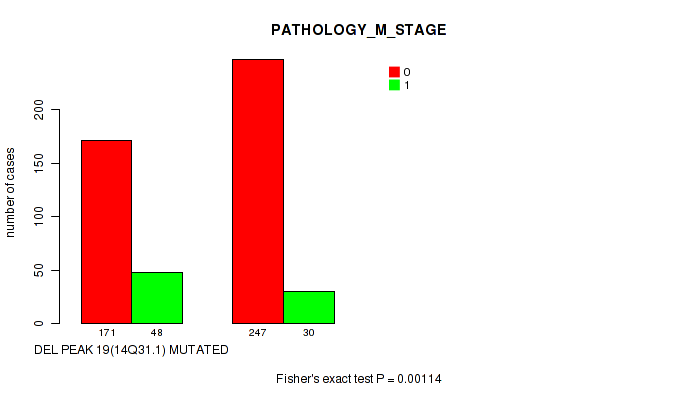
P value = 0.00114 (Fisher's exact test), Q value = 0.012
Table S71. Gene #29: 'del_14q31.1' versus Clinical Feature #6: 'PATHOLOGY_M_STAGE'
| nPatients | 0 | 1 |
|---|---|---|
| ALL | 418 | 78 |
| DEL PEAK 19(14Q31.1) MUTATED | 171 | 48 |
| DEL PEAK 19(14Q31.1) WILD-TYPE | 247 | 30 |
Figure S71. Get High-res Image Gene #29: 'del_14q31.1' versus Clinical Feature #6: 'PATHOLOGY_M_STAGE'
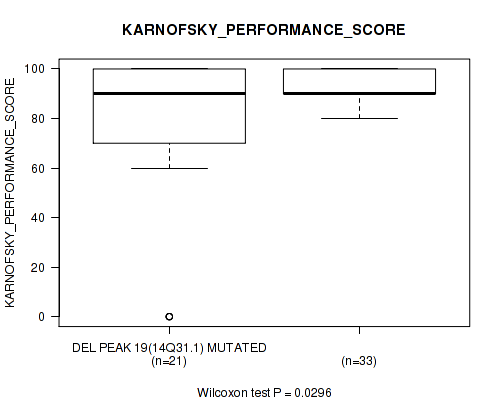
P value = 0.0296 (Wilcoxon-test), Q value = 0.18
Table S72. Gene #29: 'del_14q31.1' versus Clinical Feature #8: 'KARNOFSKY_PERFORMANCE_SCORE'
| nPatients | Mean (Std.Dev) | |
|---|---|---|
| ALL | 54 | 85.6 (25.8) |
| DEL PEAK 19(14Q31.1) MUTATED | 21 | 72.4 (37.5) |
| DEL PEAK 19(14Q31.1) WILD-TYPE | 33 | 93.9 (6.1) |
Figure S72. Get High-res Image Gene #29: 'del_14q31.1' versus Clinical Feature #8: 'KARNOFSKY_PERFORMANCE_SCORE'
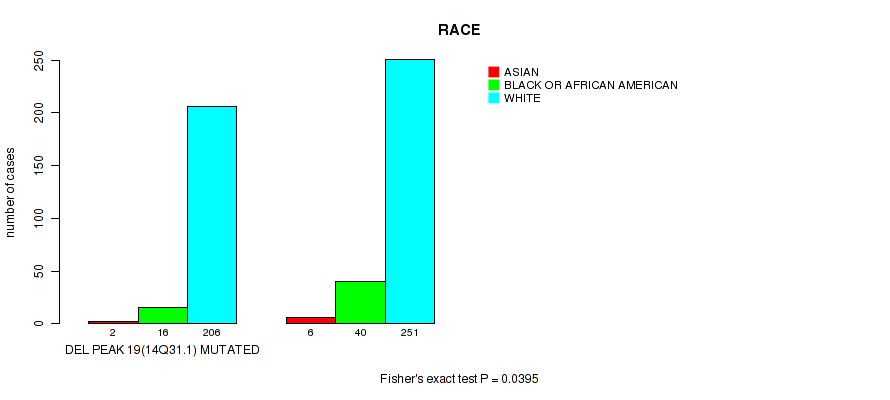
P value = 0.0395 (Fisher's exact test), Q value = 0.21
Table S73. Gene #29: 'del_14q31.1' versus Clinical Feature #11: 'RACE'
| nPatients | ASIAN | BLACK OR AFRICAN AMERICAN | WHITE |
|---|---|---|---|
| ALL | 8 | 56 | 457 |
| DEL PEAK 19(14Q31.1) MUTATED | 2 | 16 | 206 |
| DEL PEAK 19(14Q31.1) WILD-TYPE | 6 | 40 | 251 |
Figure S73. Get High-res Image Gene #29: 'del_14q31.1' versus Clinical Feature #11: 'RACE'
-
Copy number data file = all_lesions.txt from GISTIC pipeline
-
Processed Copy number data file = /xchip/cga/gdac-prod/tcga-gdac/jobResults/GDAC_Correlate_Genomic_Events_Preprocess/KIRC-TP/22531283/transformed.cor.cli.txt
-
Clinical data file = /xchip/cga/gdac-prod/tcga-gdac/jobResults/Append_Data/KIRC-TP/22506714/KIRC-TP.merged_data.txt
-
Number of patients = 528
-
Number of significantly focal cnvs = 29
-
Number of selected clinical features = 12
-
Exclude genes that fewer than K tumors have mutations, K = 3
For survival clinical features, the Kaplan-Meier survival curves of tumors with and without gene mutations were plotted and the statistical significance P values were estimated by logrank test (Bland and Altman 2004) using the 'survdiff' function in R
For binary or multi-class clinical features (nominal or ordinal), two-tailed Fisher's exact tests (Fisher 1922) were used to estimate the P values using the 'fisher.test' function in R
For multiple hypothesis correction, Q value is the False Discovery Rate (FDR) analogue of the P value (Benjamini and Hochberg 1995), defined as the minimum FDR at which the test may be called significant. We used the 'Benjamini and Hochberg' method of 'p.adjust' function in R to convert P values into Q values.
In addition to the links below, the full results of the analysis summarized in this report can also be downloaded programmatically using firehose_get, or interactively from either the Broad GDAC website or TCGA Data Coordination Center Portal.