This report serves to describe the mutational landscape and properties of a given individual set, as well as rank genes and genesets according to mutational significance. MutSig v2.0 was used to generate the results found in this report.
-
Working with individual set: KIRC-TP
-
Number of patients in set: 451
The input for this pipeline is a set of individuals with the following files associated for each:
-
An annotated .maf file describing the mutations called for the respective individual, and their properties.
-
A .wig file that contains information about the coverage of the sample.
-
MAF used for this analysis:KIRC-TP.final_analysis_set.maf
-
Blacklist used for this analysis: pancan_mutation_blacklist.v14.hg19.txt
-
Significantly mutated genes (q ≤ 0.1): 212
-
Mutations seen in COSMIC: 432
-
Significantly mutated genes in COSMIC territory: 58
-
Significantly mutated genesets: 11
-
Significantly mutated genesets: (excluding sig. mutated genes):0
-
Read 451 MAFs of type "maf1"
-
Total number of mutations in input MAFs: 46768
-
After removing 23 mutations outside chr1-24: 46745
-
After removing 7797 blacklisted mutations: 38948
-
After removing 2073 noncoding mutations: 36875
-
After collapsing adjacent/redundant mutations: 33030
-
Number of mutations before filtering: 33030
-
After removing 1955 mutations outside gene set: 31075
-
After removing 124 mutations outside category set: 30951
-
After removing 7 "impossible" mutations in
-
gene-patient-category bins of zero coverage: 28865
Table 1. Get Full Table Table representing breakdown of mutations by type.
| type | count |
|---|---|
| De_novo_Start_InFrame | 8 |
| De_novo_Start_OutOfFrame | 26 |
| Frame_Shift_Del | 1541 |
| Frame_Shift_Ins | 2938 |
| In_Frame_Del | 299 |
| In_Frame_Ins | 54 |
| Missense_Mutation | 16656 |
| Nonsense_Mutation | 1202 |
| Nonstop_Mutation | 44 |
| Silent | 6172 |
| Splice_Site | 1972 |
| Start_Codon_Del | 7 |
| Start_Codon_Ins | 2 |
| Start_Codon_SNP | 26 |
| Stop_Codon_Del | 2 |
| Stop_Codon_Ins | 2 |
| Total | 30951 |
Table 2. Get Full Table A breakdown of mutation rates per category discovered for this individual set.
| category | n | N | rate | rate_per_mb | relative_rate | exp_ns_s_ratio |
|---|---|---|---|---|---|---|
| *CpG->T | 1780 | 666857343 | 2.7e-06 | 2.7 | 1.4 | 2.2 |
| *Cp(A/C/T)->T | 3268 | 5856172488 | 5.6e-07 | 0.56 | 0.29 | 1.7 |
| A->G | 2700 | 6472983367 | 4.2e-07 | 0.42 | 0.22 | 2.3 |
| transver | 8932 | 12996013198 | 6.9e-07 | 0.69 | 0.36 | 5.1 |
| indel+null | 7981 | 12996013198 | 6.1e-07 | 0.61 | 0.32 | NaN |
| double_null | 114 | 12996013198 | 8.8e-09 | 0.0088 | 0.0046 | NaN |
| Total | 24775 | 12996013198 | 1.9e-06 | 1.9 | 1 | 3.5 |
The x axis represents the samples. The y axis represents the exons, one row per exon, and they are sorted by average coverage across samples. For exons with exactly the same average coverage, they are sorted next by the %GC of the exon. (The secondary sort is especially useful for the zero-coverage exons at the bottom). If the figure is unpopulated, then full coverage is assumed (e.g. MutSig CV doesn't use WIGs and assumes full coverage).
Figure 1.
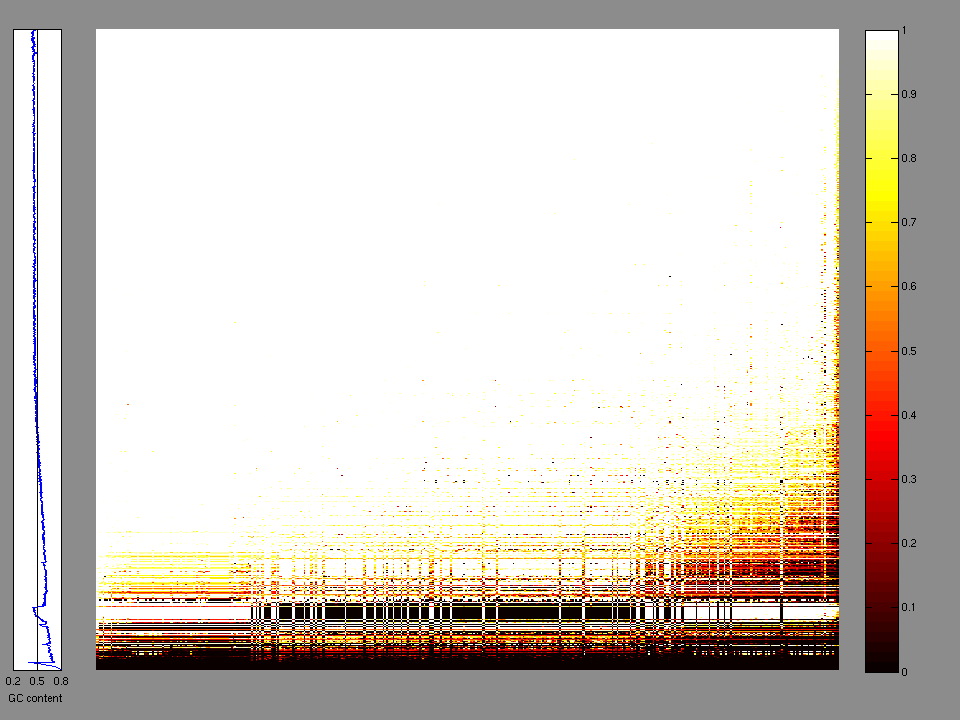
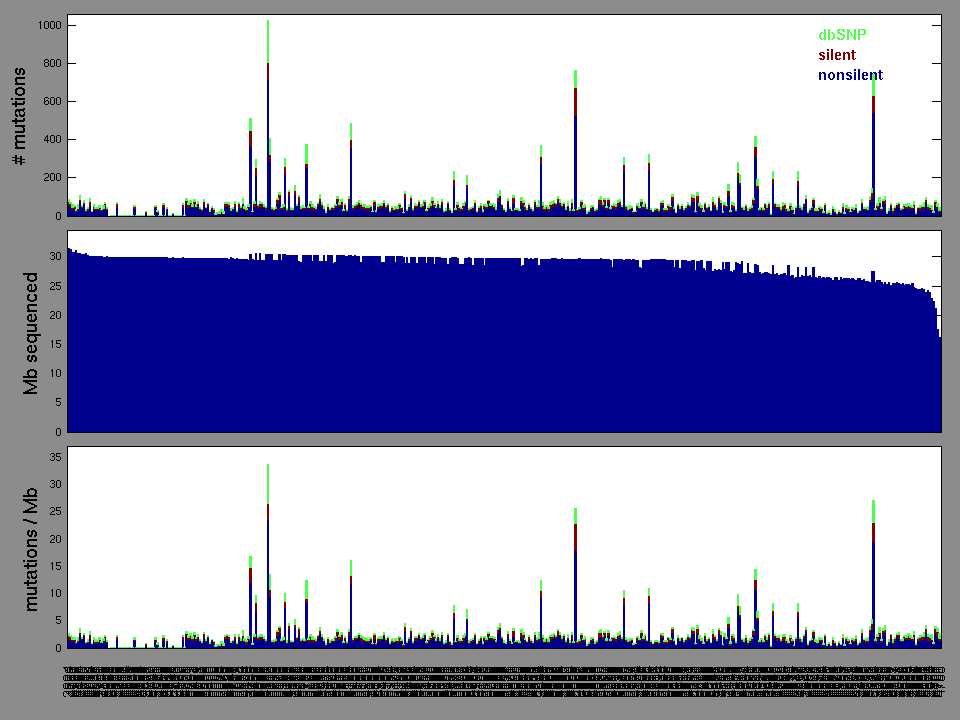
Figure 2. Patients counts and rates file used to generate this plot: KIRC-TP.patients.counts_and_rates.txt
The mutation spectrum is depicted in the lego plots below in which the 96 possible mutation types are subdivided into six large blocks, color-coded to reflect the base substitution type. Each large block is further subdivided into the 16 possible pairs of 5' and 3' neighbors, as listed in the 4x4 trinucleotide context legend. The height of each block corresponds to the mutation frequency for that kind of mutation (counts of mutations normalized by the base coverage in a given bin). The shape of the spectrum is a signature for dominant mutational mechanisms in different tumor types.
Figure 3. Get High-res Image SNV Mutation rate lego plot for entire set. Each bin is normalized by base coverage for that bin. Colors represent the six SNV types on the upper right. The three-base context for each mutation is labeled in the 4x4 legend on the lower right. The fractional breakdown of SNV counts is shown in the pie chart on the upper left. If this figure is blank, not enough information was provided in the MAF to generate it.
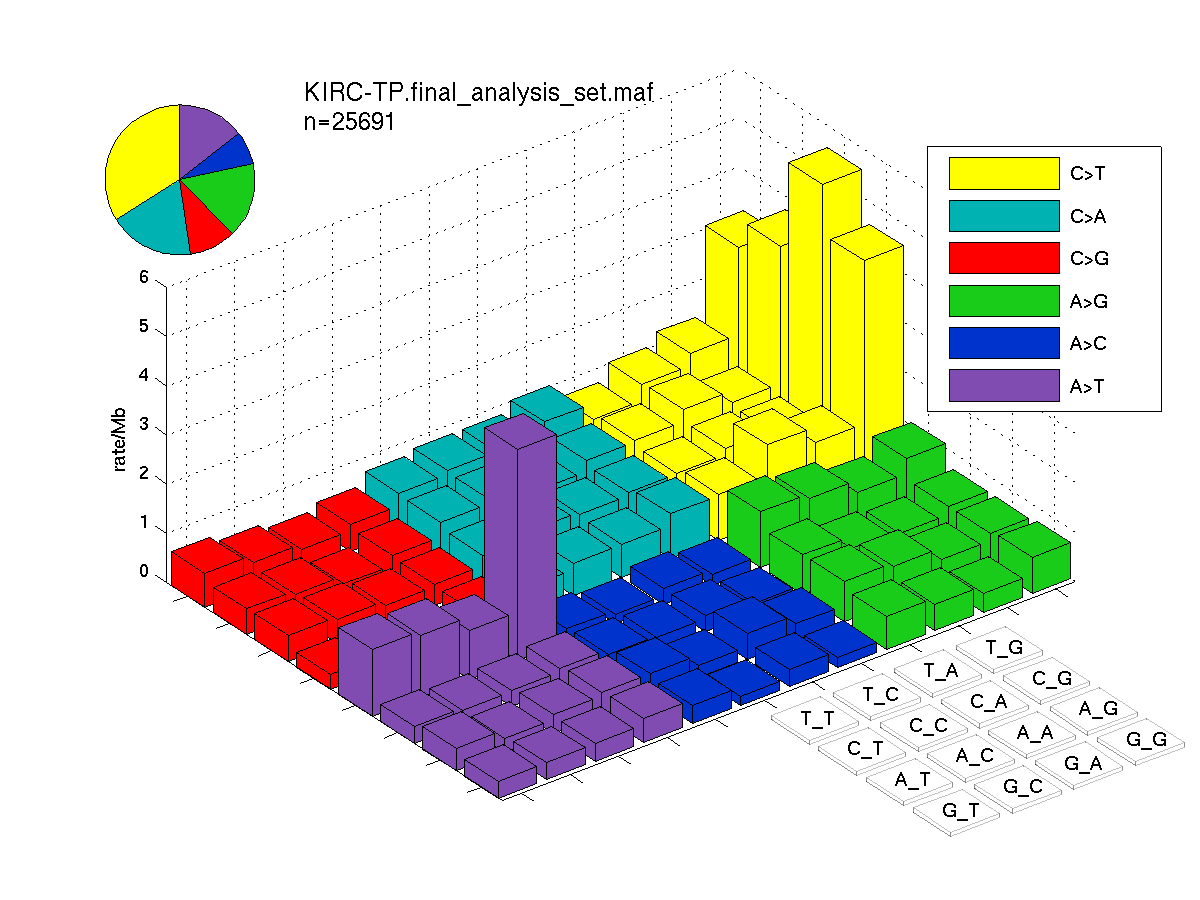
Figure 4. Get High-res Image SNV Mutation rate lego plots for 4 slices of mutation allele fraction (0<=AF<0.1, 0.1<=AF<0.25, 0.25<=AF<0.5, & 0.5<=AF) . The color code and three-base context legends are the same as the previous figure. If this figure is blank, not enough information was provided in the MAF to generate it.
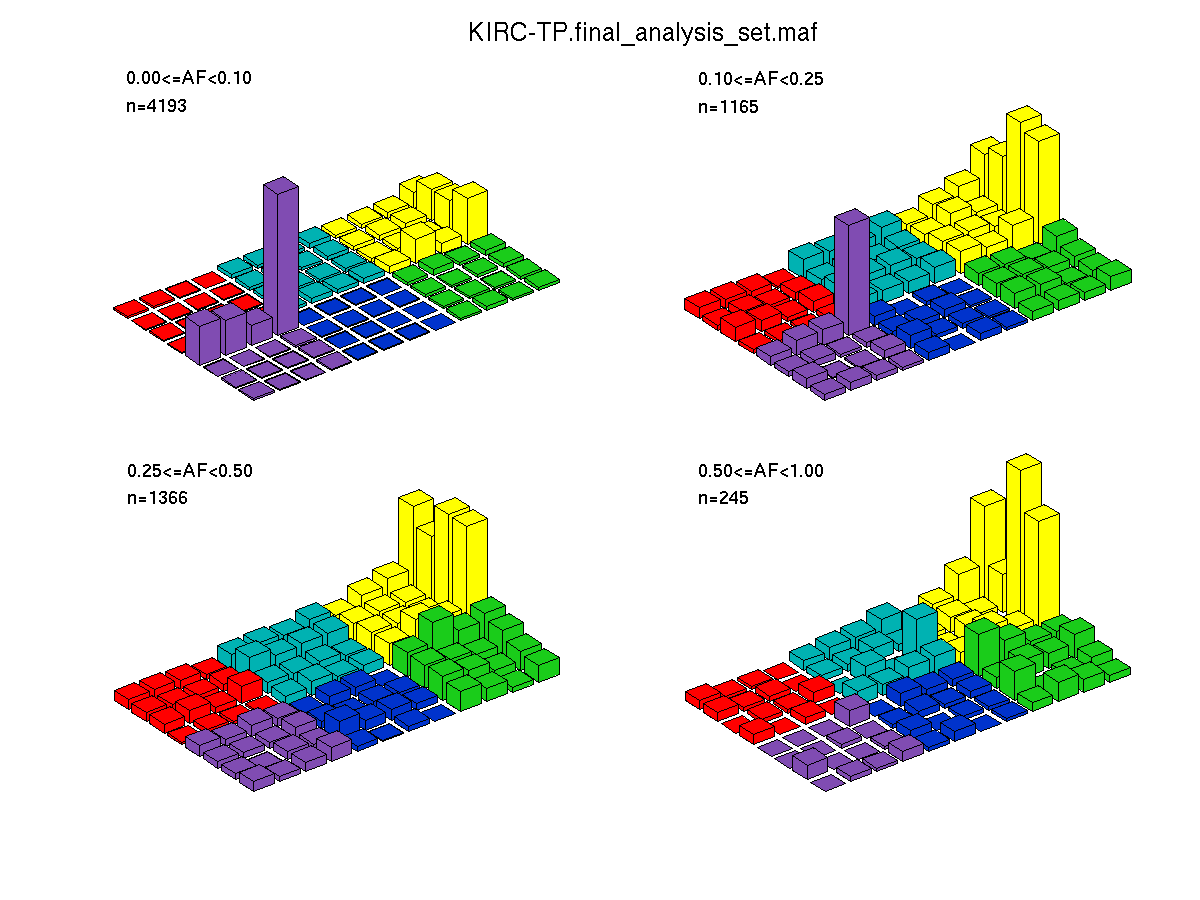
Figure 5. Get High-res Image The matrix in the center of the figure represents individual mutations in patient samples, color-coded by type of mutation, for the significantly mutated genes. The rate of synonymous and non-synonymous mutations is displayed at the top of the matrix. The barplot on the left of the matrix shows the number of mutations in each gene. The percentages represent the fraction of tumors with at least one mutation in the specified gene. The barplot to the right of the matrix displays the q-values for the most significantly mutated genes. The purple boxplots below the matrix (only displayed if required columns are present in the provided MAF) represent the distributions of allelic fractions observed in each sample. The plot at the bottom represents the base substitution distribution of individual samples, using the same categories that were used to calculate significance.
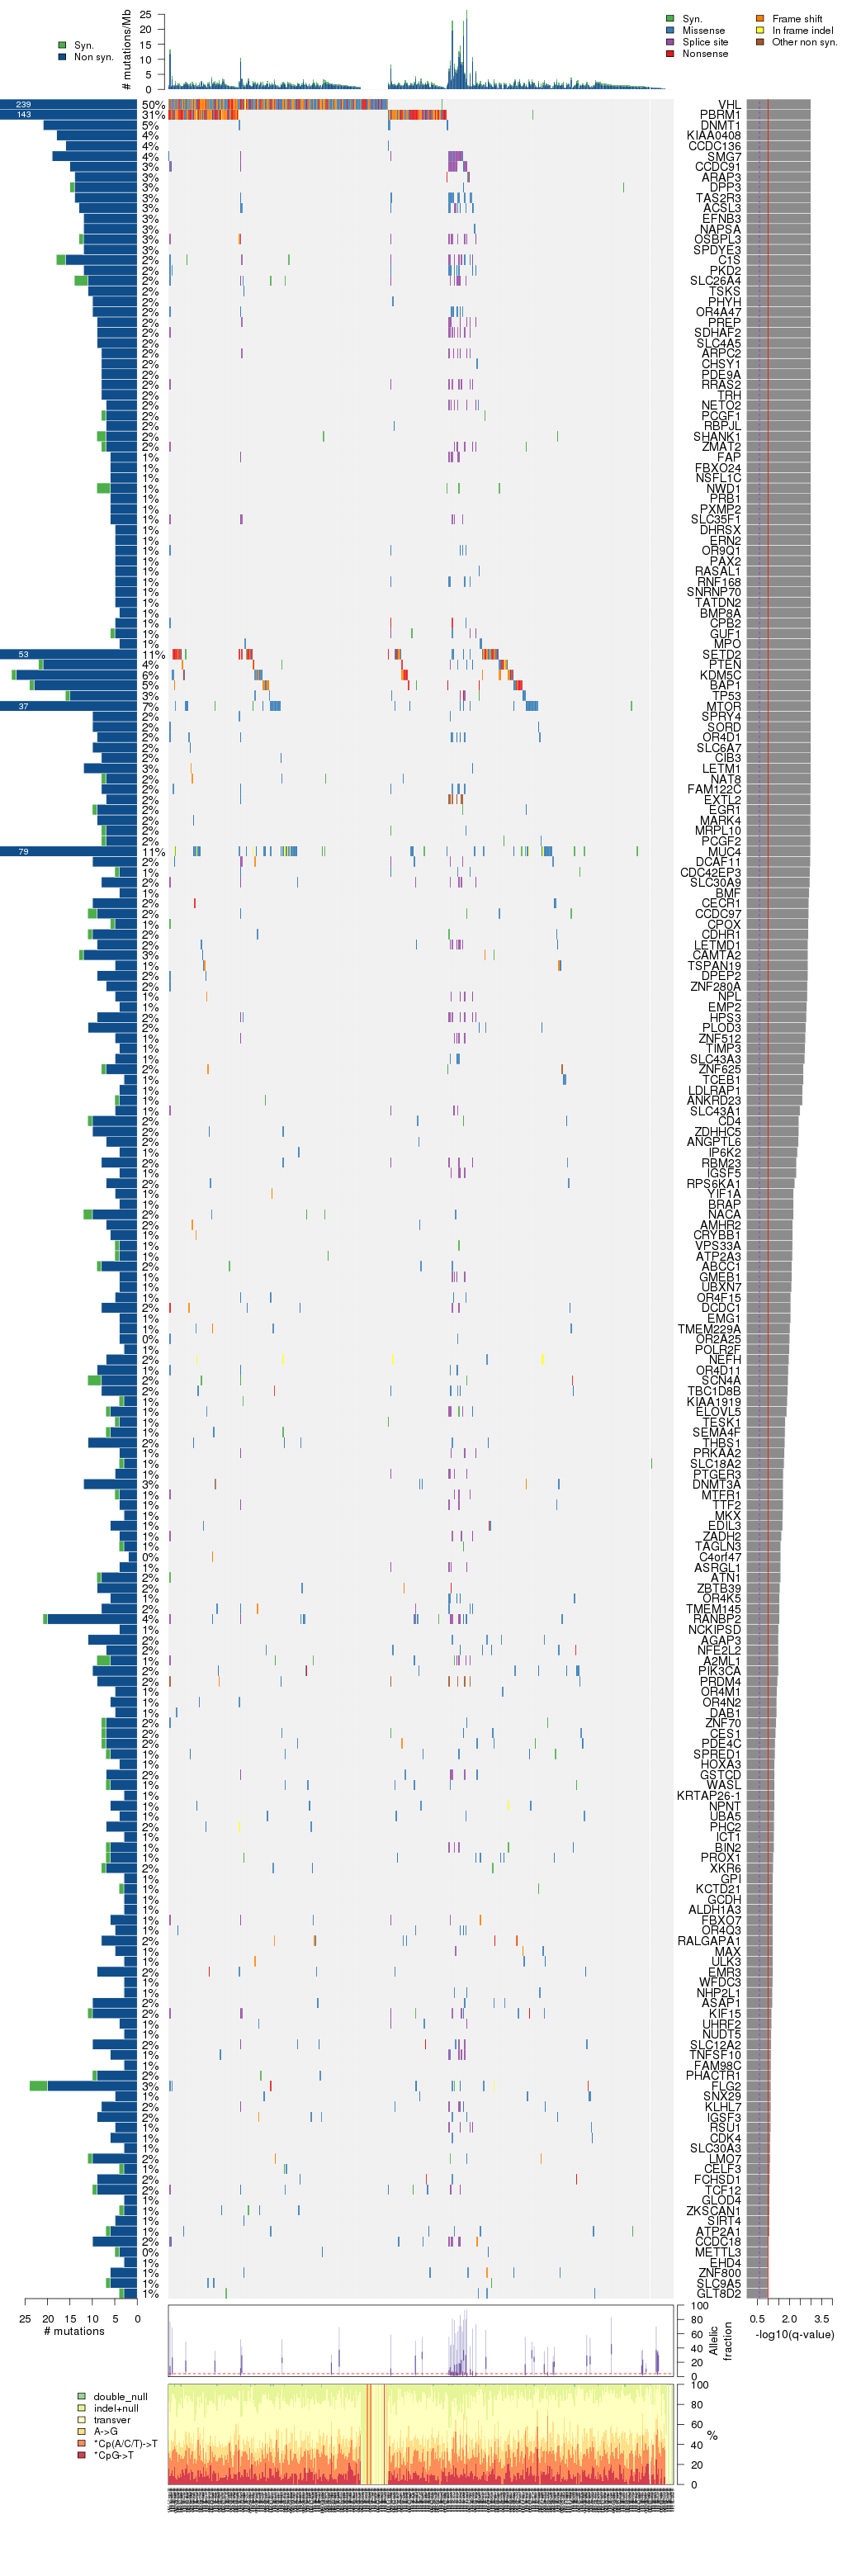
Column Descriptions:
-
N = number of sequenced bases in this gene across the individual set
-
n = number of (nonsilent) mutations in this gene across the individual set
-
npat = number of patients (individuals) with at least one nonsilent mutation
-
nsite = number of unique sites having a non-silent mutation
-
nsil = number of silent mutations in this gene across the individual set
-
n1 = number of nonsilent mutations of type: *CpG->T
-
n2 = number of nonsilent mutations of type: *Cp(A/C/T)->T
-
n3 = number of nonsilent mutations of type: A->G
-
n4 = number of nonsilent mutations of type: transver
-
n5 = number of nonsilent mutations of type: indel+null
-
n6 = number of nonsilent mutations of type: double_null
-
p_classic = p-value for the observed amount of nonsilent mutations being elevated in this gene
-
p_ns_s = p-value for the observed nonsilent/silent ratio being elevated in this gene
-
p_cons = p-value for enrichment of mutations at evolutionarily most-conserved sites in gene
-
p_joint = p-value for clustering + conservation
-
p = p-value (overall)
-
q = q-value, False Discovery Rate (Benjamini-Hochberg procedure)
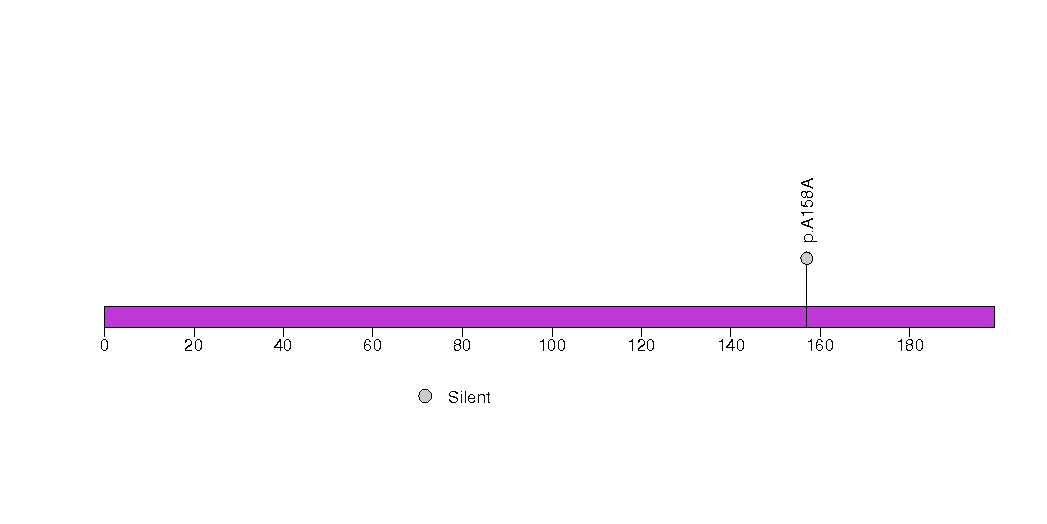
Table 3. Get Full Table A Ranked List of Significantly Mutated Genes. Number of significant genes found: 212. Number of genes displayed: 35. Click on a gene name to display its stick figure depicting the distribution of mutations and mutation types across the chosen gene (this feature may not be available for all significant genes).
| rank | gene | description | N | n | npat | nsite | nsil | n1 | n2 | n3 | n4 | n5 | n6 | p_classic | p_ns_s | p_clust | p_cons | p_joint | p | q |
|---|---|---|---|---|---|---|---|---|---|---|---|---|---|---|---|---|---|---|---|---|
| 1 | VHL | von Hippel-Lindau tumor suppressor | 164008 | 237 | 225 | 140 | 2 | 8 | 11 | 24 | 60 | 133 | 1 | 2.3e-15 | <1.00e-15 | 0.0063 | 0.052 | 0.0061 | 5.55e-16 | 3.45e-13 |
| 2 | PBRM1 | polybromo 1 | 2247536 | 141 | 138 | 130 | 2 | 0 | 3 | 5 | 17 | 116 | 0 | 1.6e-15 | 3.95e-07 | 0.037 | 0.02 | 0.016 | 9.99e-16 | 3.45e-13 |
| 3 | DNMT1 | DNA (cytosine-5-)-methyltransferase 1 | 2083111 | 21 | 21 | 6 | 0 | 0 | 1 | 3 | 1 | 16 | 0 | 1.6e-06 | 0.221 | 0 | 1 | 0 | <1.00e-15 | <3.45e-13 |
| 4 | KIAA0408 | KIAA0408 | 931597 | 18 | 18 | 2 | 0 | 0 | 0 | 0 | 0 | 18 | 0 | 4.9e-08 | 1.000 | 0 | 0.72 | 0 | <1.00e-15 | <3.45e-13 |
| 5 | CCDC136 | coiled-coil domain containing 136 | 1318310 | 16 | 16 | 3 | 0 | 1 | 0 | 0 | 0 | 15 | 0 | 6.1e-06 | 0.413 | 0 | 1 | 0 | <1.00e-15 | <3.45e-13 |
| 6 | SMG7 | Smg-7 homolog, nonsense mediated mRNA decay factor (C. elegans) | 1558778 | 19 | 16 | 3 | 0 | 0 | 0 | 0 | 7 | 11 | 1 | 7.1e-06 | 0.0364 | 0 | 0.84 | 0 | <1.00e-15 | <3.45e-13 |
| 7 | CCDC91 | coiled-coil domain containing 91 | 614810 | 15 | 15 | 3 | 0 | 0 | 0 | 1 | 1 | 13 | 0 | 7.5e-09 | 0.0849 | 0 | 0.44 | 0 | <1.00e-15 | <3.45e-13 |
| 8 | ARAP3 | ArfGAP with RhoGAP domain, ankyrin repeat and PH domain 3 | 1928794 | 14 | 14 | 3 | 0 | 0 | 0 | 0 | 1 | 11 | 2 | 0.00039 | 0.533 | 0 | 0.97 | 0 | <1.00e-15 | <3.45e-13 |
| 9 | DPP3 | dipeptidyl-peptidase 3 | 945518 | 14 | 14 | 2 | 1 | 0 | 1 | 0 | 0 | 13 | 0 | 0.000018 | 0.919 | 0 | 1 | 0 | <1.00e-15 | <3.45e-13 |
| 10 | TAS2R3 | taste receptor, type 2, member 3 | 429539 | 14 | 13 | 5 | 0 | 0 | 0 | 1 | 13 | 0 | 0 | 8.8e-11 | 0.0596 | 0 | 0.96 | 0 | <1.00e-15 | <3.45e-13 |
| 11 | ACSL3 | acyl-CoA synthetase long-chain family member 3 | 997929 | 13 | 12 | 3 | 0 | 0 | 1 | 0 | 10 | 2 | 0 | 5.2e-06 | 0.0941 | 0 | 0.0096 | 0 | <1.00e-15 | <3.45e-13 |
| 12 | EFNB3 | ephrin-B3 | 348243 | 12 | 12 | 1 | 0 | 0 | 0 | 0 | 0 | 12 | 0 | 9.4e-08 | 1.000 | 0 | 0.56 | 0 | <1.00e-15 | <3.45e-13 |
| 13 | NAPSA | napsin A aspartic peptidase | 515598 | 12 | 12 | 2 | 0 | 1 | 0 | 0 | 0 | 10 | 1 | 3.7e-07 | 0.637 | 0 | 0.99 | 0 | <1.00e-15 | <3.45e-13 |
| 14 | OSBPL3 | oxysterol binding protein-like 3 | 1231143 | 12 | 12 | 3 | 1 | 0 | 0 | 0 | 0 | 11 | 1 | 0.00034 | 0.450 | 2e-07 | 0.052 | 0 | <1.00e-15 | <3.45e-13 |
| 15 | SPDYE3 | speedy homolog E3 (Xenopus laevis) | 358182 | 12 | 12 | 1 | 0 | 0 | 0 | 0 | 0 | 12 | 0 | 1.9e-07 | 1.000 | 0 | 0.17 | 0 | <1.00e-15 | <3.45e-13 |
| 16 | C1S | complement component 1, s subcomponent | 949879 | 16 | 11 | 3 | 2 | 0 | 1 | 0 | 7 | 8 | 0 | 0.0001 | 0.386 | 0 | 0.00029 | 0 | <1.00e-15 | <3.45e-13 |
| 17 | PKD2 | polycystic kidney disease 2 (autosomal dominant) | 1063183 | 12 | 11 | 3 | 0 | 0 | 1 | 0 | 11 | 0 | 0 | 0.000054 | 0.104 | 8e-07 | 0.00021 | 0 | <1.00e-15 | <3.45e-13 |
| 18 | SLC26A4 | solute carrier family 26, member 4 | 1015348 | 11 | 11 | 3 | 3 | 1 | 0 | 0 | 1 | 9 | 0 | 0.0036 | 0.553 | 2e-06 | 0.041 | 0 | <1.00e-15 | <3.45e-13 |
| 19 | TSKS | testis-specific serine kinase substrate | 691209 | 11 | 11 | 2 | 0 | 0 | 1 | 0 | 0 | 10 | 0 | 0.000053 | 0.548 | 0 | 0.78 | 0 | <1.00e-15 | <3.45e-13 |
| 20 | PHYH | phytanoyl-CoA 2-hydroxylase | 429107 | 10 | 10 | 2 | 0 | 0 | 0 | 0 | 1 | 9 | 0 | 2.7e-06 | 0.858 | 0 | 1 | 0 | <1.00e-15 | <3.45e-13 |
| 21 | OR4A47 | olfactory receptor, family 4, subfamily A, member 47 | 408792 | 10 | 9 | 2 | 0 | 0 | 0 | 0 | 10 | 0 | 0 | 8.5e-07 | 0.158 | 0 | 0.92 | 0 | <1.00e-15 | <3.45e-13 |
| 22 | PREP | prolyl endopeptidase | 973443 | 9 | 9 | 2 | 0 | 0 | 0 | 0 | 0 | 9 | 0 | 0.0018 | 0.181 | 0 | 0.27 | 0 | <1.00e-15 | <3.45e-13 |
| 23 | SDHAF2 | succinate dehydrogenase complex assembly factor 2 | 232996 | 9 | 9 | 1 | 0 | 0 | 0 | 0 | 0 | 9 | 0 | 4.5e-07 | 0.236 | 0 | 0.0067 | 0 | <1.00e-15 | <3.45e-13 |
| 24 | SLC4A5 | solute carrier family 4, sodium bicarbonate cotransporter, member 5 | 1541933 | 9 | 9 | 2 | 0 | 0 | 0 | 0 | 0 | 9 | 0 | 0.055 | 0.828 | 0 | 0.0012 | 0 | <1.00e-15 | <3.45e-13 |
| 25 | ARPC2 | actin related protein 2/3 complex, subunit 2, 34kDa | 412986 | 8 | 8 | 2 | 0 | 0 | 0 | 0 | 0 | 8 | 0 | 0.000057 | 0.280 | 0 | 0.46 | 0 | <1.00e-15 | <3.45e-13 |
| 26 | CHSY1 | chondroitin sulfate synthase 1 | 938583 | 8 | 8 | 2 | 0 | 0 | 0 | 0 | 1 | 7 | 0 | 0.011 | 0.851 | 0.000021 | 2e-07 | 0 | <1.00e-15 | <3.45e-13 |
| 27 | PDE9A | phosphodiesterase 9A | 831641 | 8 | 8 | 1 | 0 | 0 | 0 | 0 | 0 | 8 | 0 | 0.011 | 1.000 | 0 | 0.5 | 0 | <1.00e-15 | <3.45e-13 |
| 28 | RRAS2 | related RAS viral (r-ras) oncogene homolog 2 | 238375 | 8 | 8 | 1 | 0 | 0 | 0 | 0 | 0 | 8 | 0 | 5.1e-06 | 0.308 | 0 | 0.15 | 0 | <1.00e-15 | <3.45e-13 |
| 29 | TRH | thyrotropin-releasing hormone | 243937 | 8 | 8 | 1 | 0 | 0 | 0 | 0 | 0 | 8 | 0 | 8.6e-06 | 1.000 | 0 | 0.44 | 0 | <1.00e-15 | <3.45e-13 |
| 30 | NETO2 | neuropilin (NRP) and tolloid (TLL)-like 2 | 707598 | 7 | 7 | 2 | 0 | 0 | 0 | 1 | 0 | 6 | 0 | 0.0035 | 0.245 | 0 | 0.34 | 0 | <1.00e-15 | <3.45e-13 |
| 31 | PCGF1 | polycomb group ring finger 1 | 340537 | 7 | 7 | 1 | 1 | 0 | 0 | 0 | 0 | 7 | 0 | 0.00026 | 1.000 | 0 | 0.96 | 0 | <1.00e-15 | <3.45e-13 |
| 32 | RBPJL | recombination signal binding protein for immunoglobulin kappa J region-like | 565554 | 7 | 7 | 2 | 0 | 0 | 0 | 1 | 0 | 6 | 0 | 0.0013 | 0.803 | 2e-07 | 0.00016 | 0 | <1.00e-15 | <3.45e-13 |
| 33 | SHANK1 | SH3 and multiple ankyrin repeat domains 1 | 1347926 | 7 | 7 | 1 | 2 | 0 | 0 | 0 | 0 | 7 | 0 | 0.14 | 1.000 | 0 | 0.0012 | 0 | <1.00e-15 | <3.45e-13 |
| 34 | ZMAT2 | zinc finger, matrin type 2 | 279511 | 7 | 7 | 1 | 1 | 0 | 0 | 0 | 0 | 7 | 0 | 0.000065 | 0.768 | 2e-07 | 0.29 | 0 | <1.00e-15 | <3.45e-13 |
| 35 | FAP | fibroblast activation protein, alpha | 1072599 | 6 | 6 | 1 | 0 | 0 | 0 | 0 | 0 | 6 | 0 | 0.078 | 0.388 | 0 | 0.0027 | 0 | <1.00e-15 | <3.45e-13 |
Figure S1. This figure depicts the distribution of mutations and mutation types across the VHL significant gene.
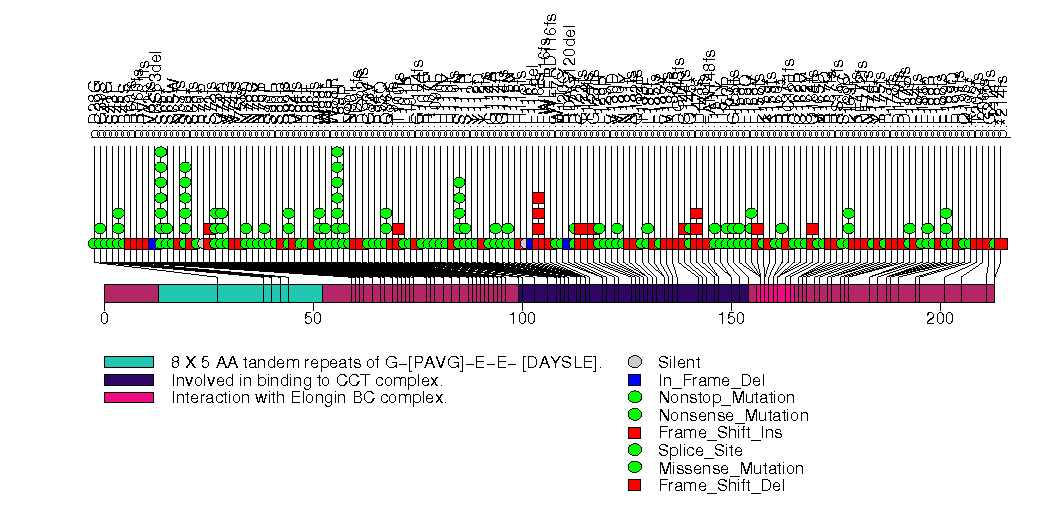
Figure S2. This figure depicts the distribution of mutations and mutation types across the PBRM1 significant gene.
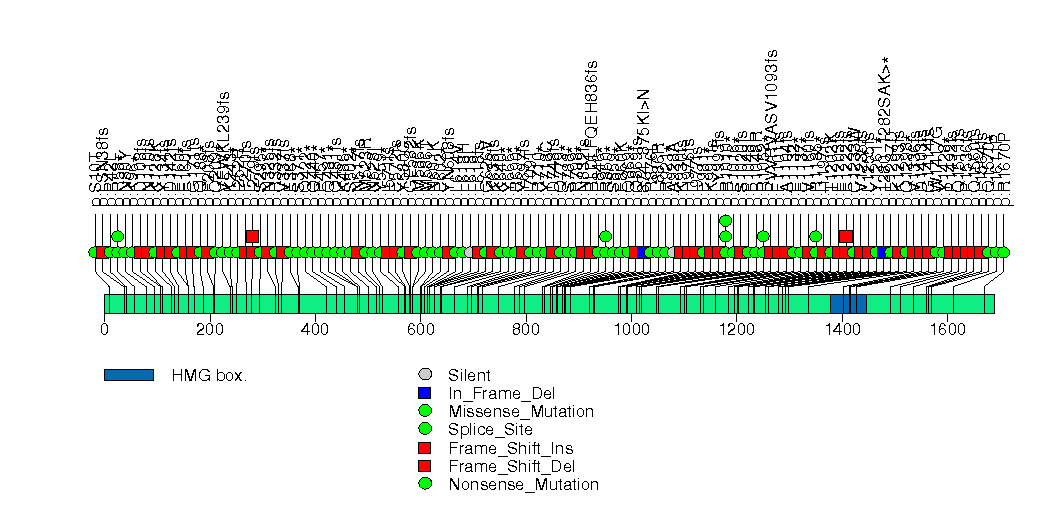
Figure S3. This figure depicts the distribution of mutations and mutation types across the DNMT1 significant gene.
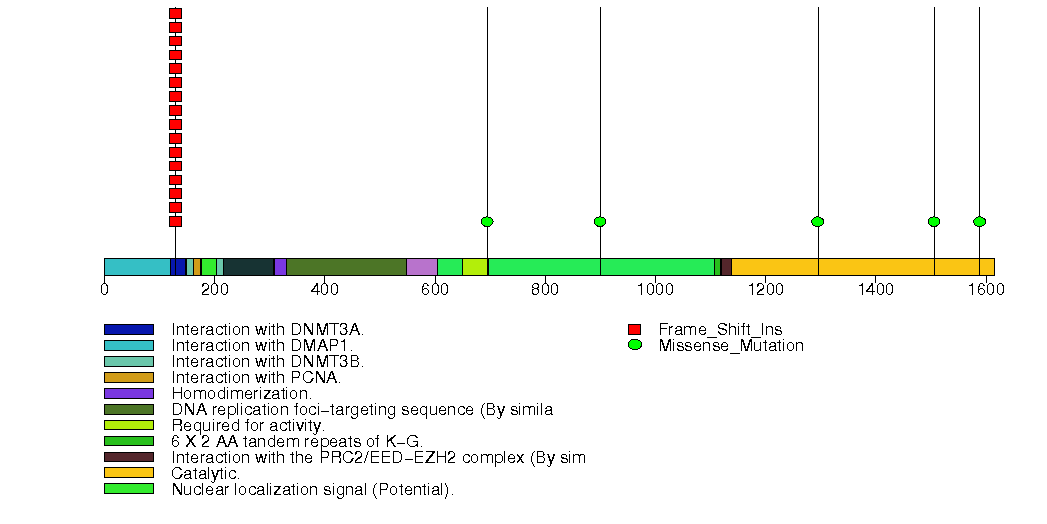
Figure S4. This figure depicts the distribution of mutations and mutation types across the KIAA0408 significant gene.
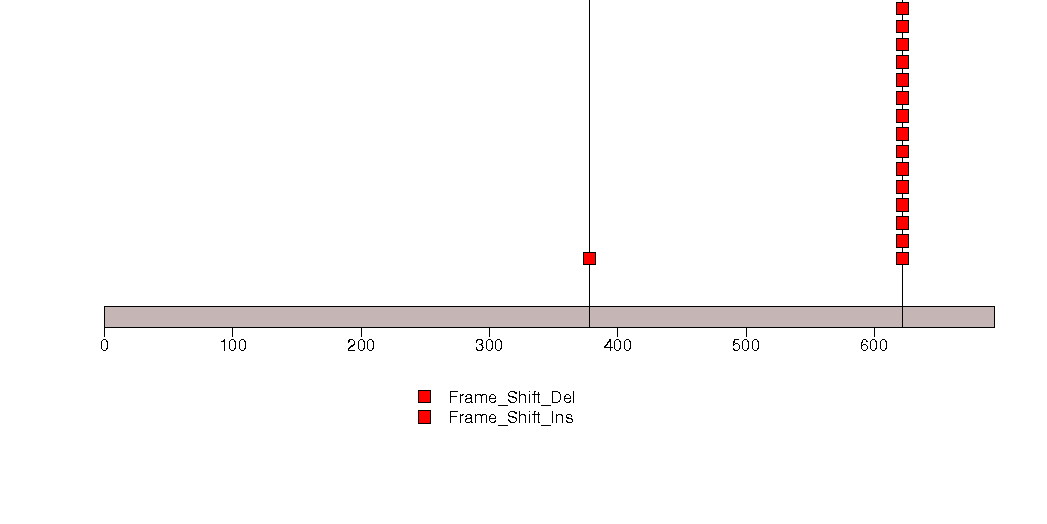
Figure S5. This figure depicts the distribution of mutations and mutation types across the CCDC136 significant gene.
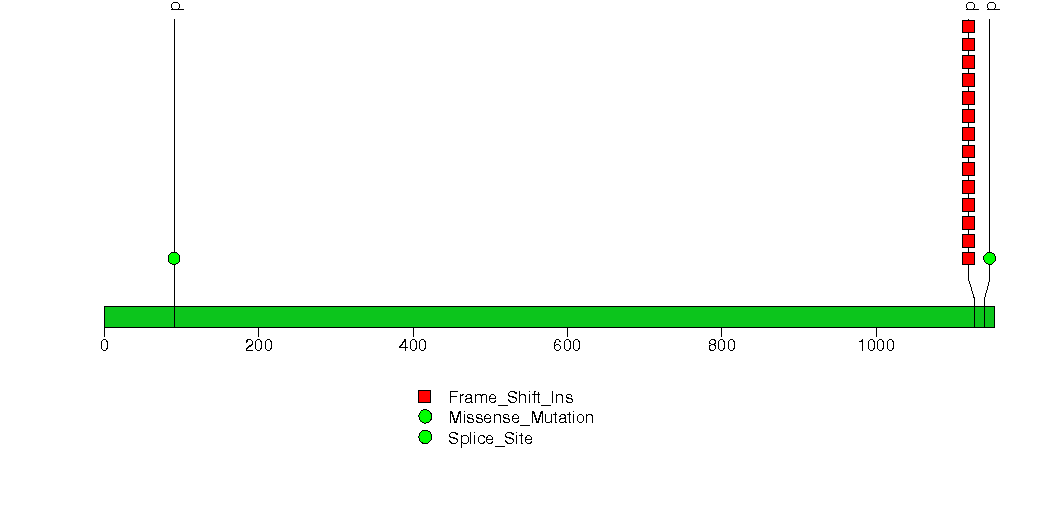
Figure S6. This figure depicts the distribution of mutations and mutation types across the SMG7 significant gene.
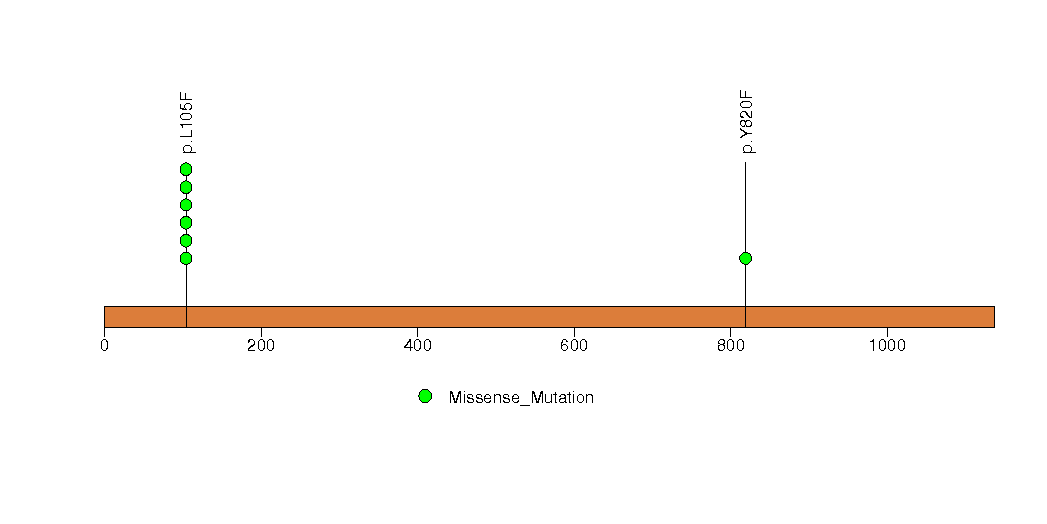
Figure S7. This figure depicts the distribution of mutations and mutation types across the CCDC91 significant gene.
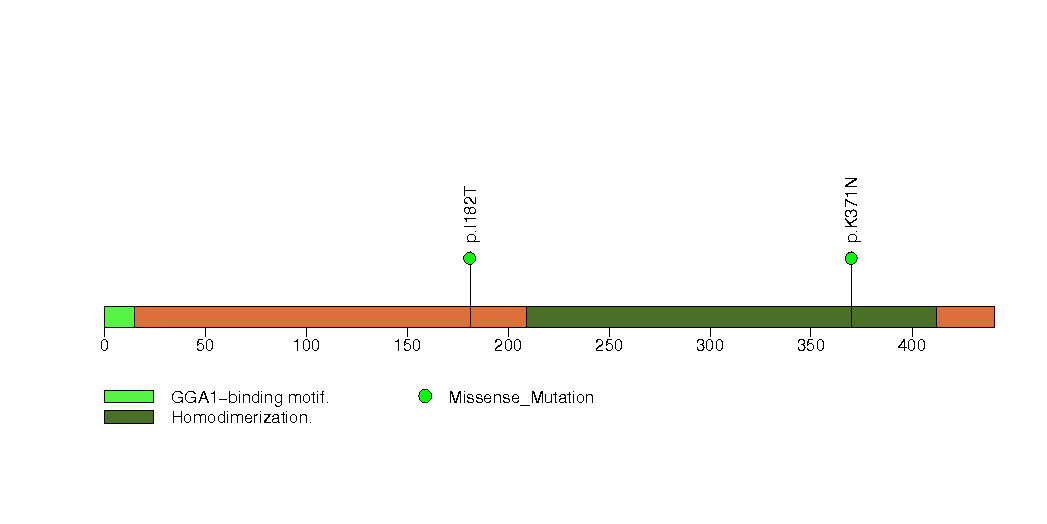
Figure S8. This figure depicts the distribution of mutations and mutation types across the ARAP3 significant gene.
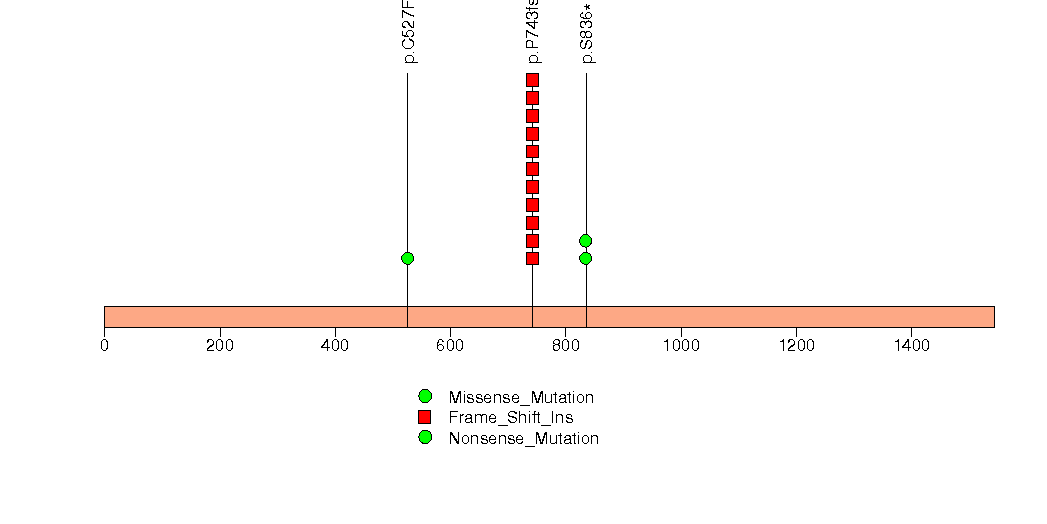
Figure S9. This figure depicts the distribution of mutations and mutation types across the DPP3 significant gene.
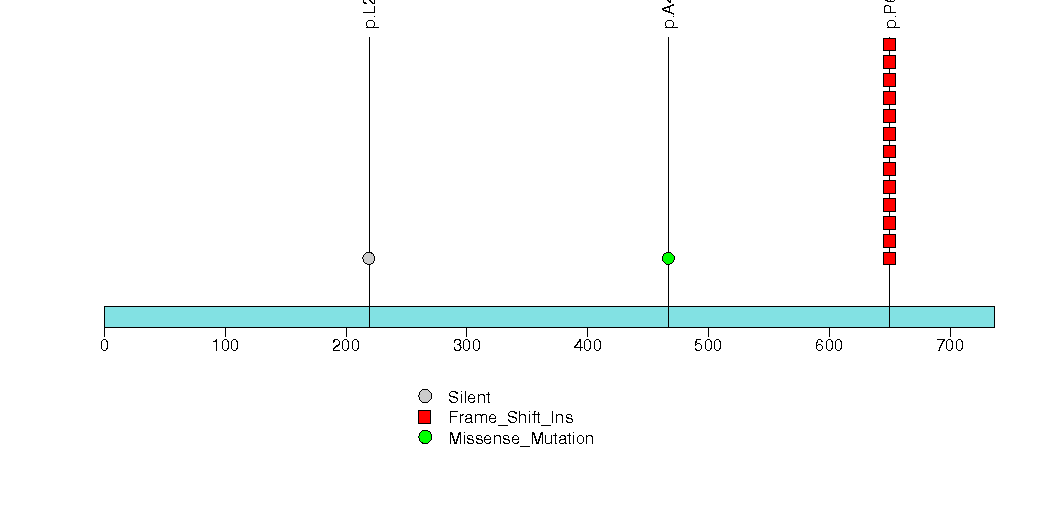
Figure S10. This figure depicts the distribution of mutations and mutation types across the TAS2R3 significant gene.
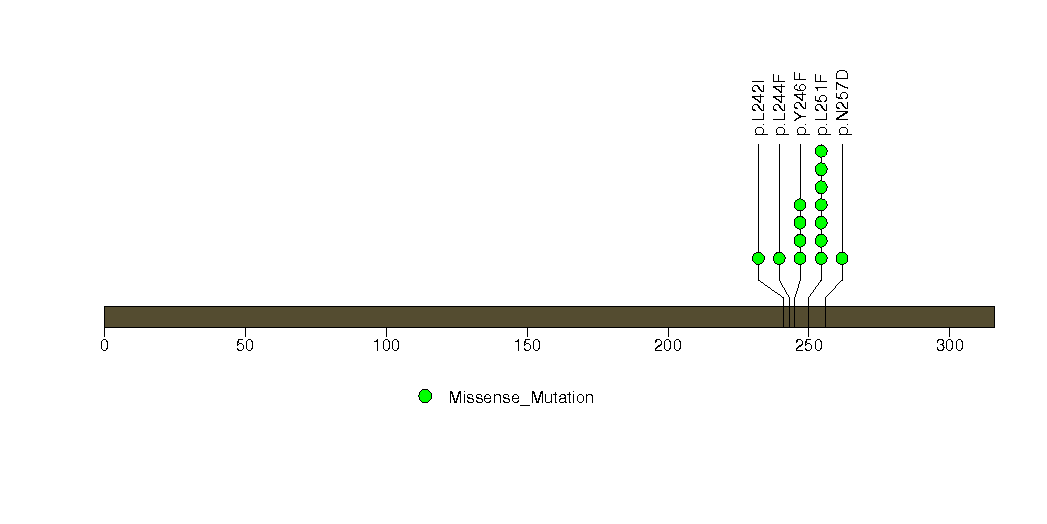
Figure S11. This figure depicts the distribution of mutations and mutation types across the ACSL3 significant gene.
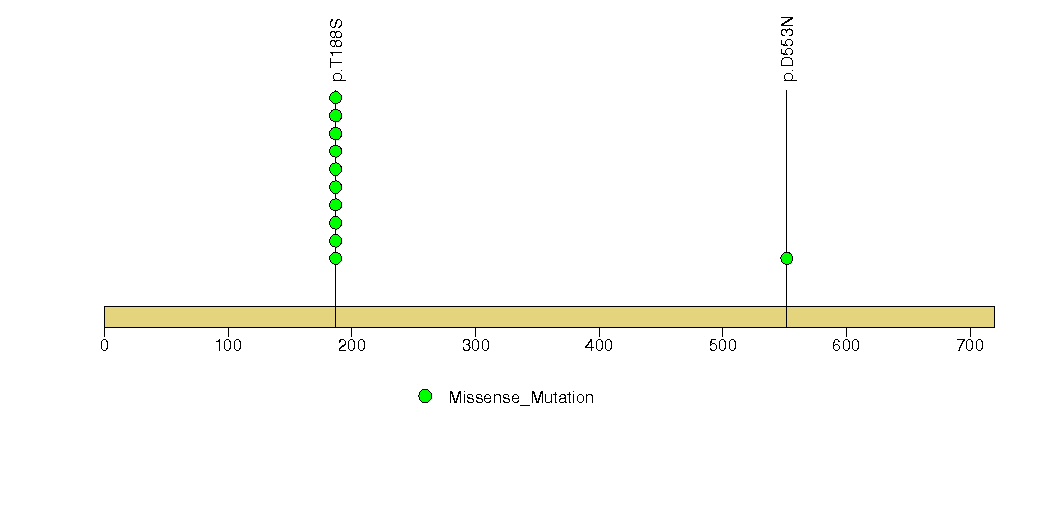
Figure S12. This figure depicts the distribution of mutations and mutation types across the EFNB3 significant gene.
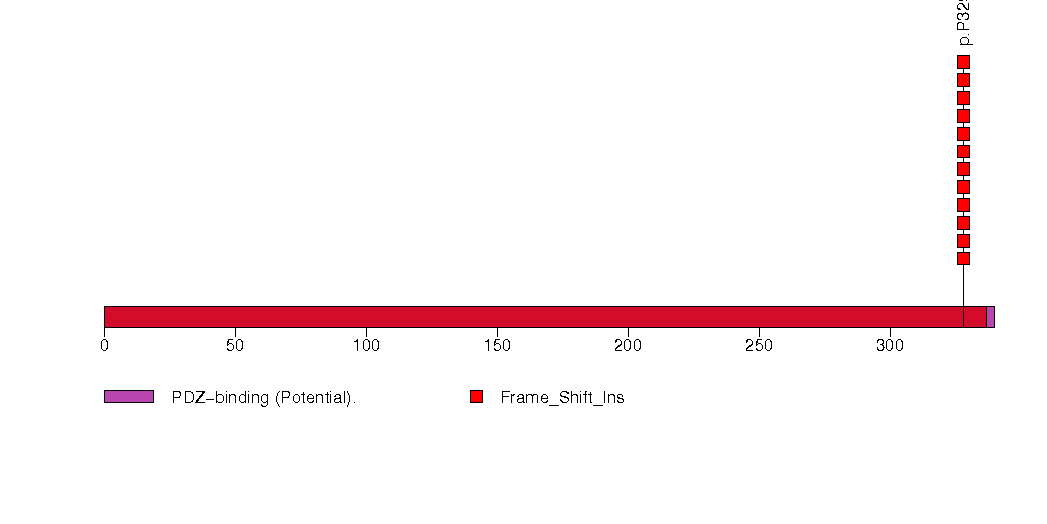
Figure S13. This figure depicts the distribution of mutations and mutation types across the NAPSA significant gene.
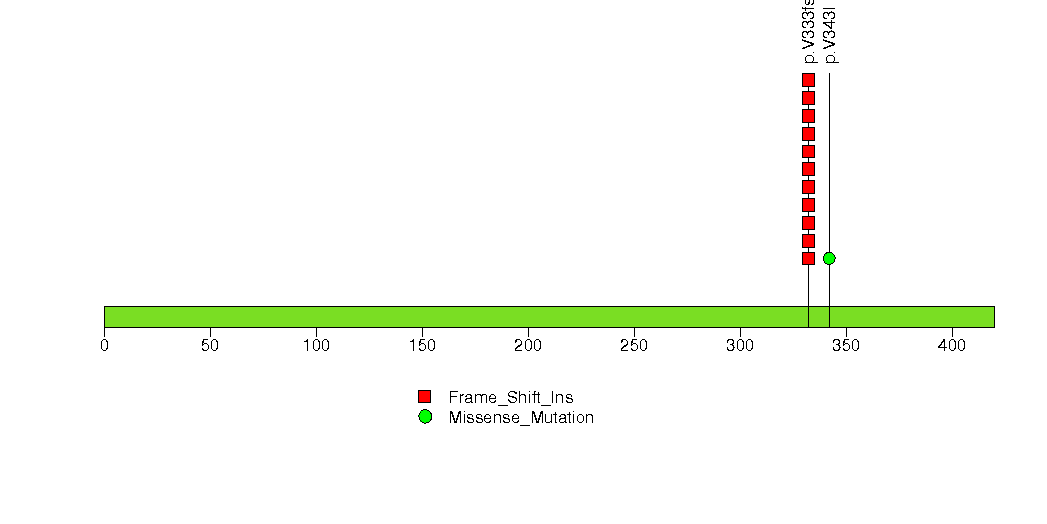
Figure S14. This figure depicts the distribution of mutations and mutation types across the OSBPL3 significant gene.
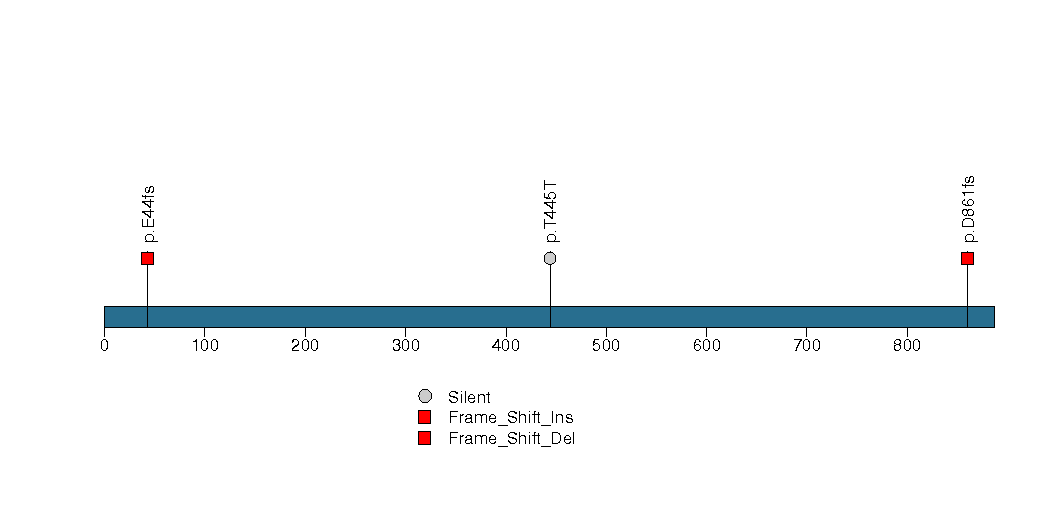
Figure S15. This figure depicts the distribution of mutations and mutation types across the SPDYE3 significant gene.
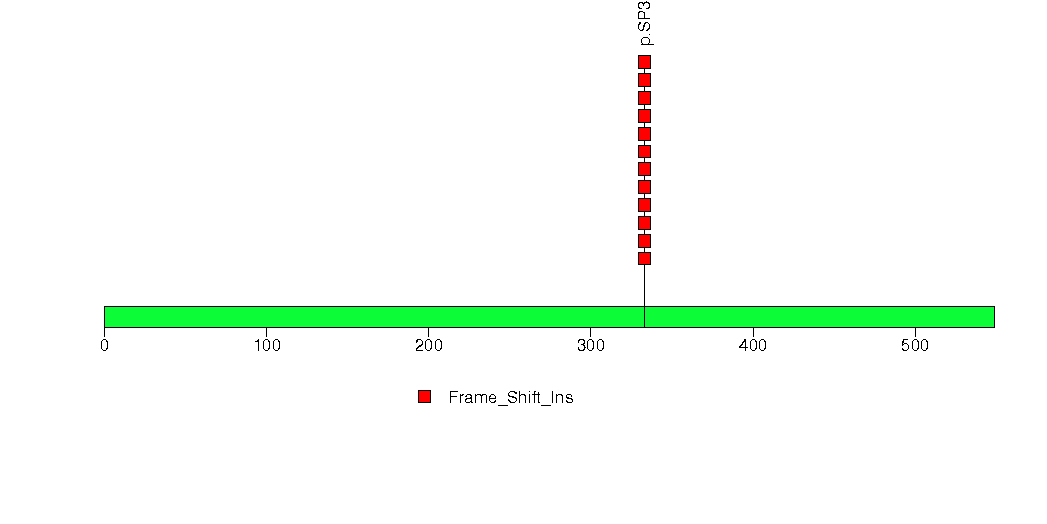
Figure S16. This figure depicts the distribution of mutations and mutation types across the C1S significant gene.
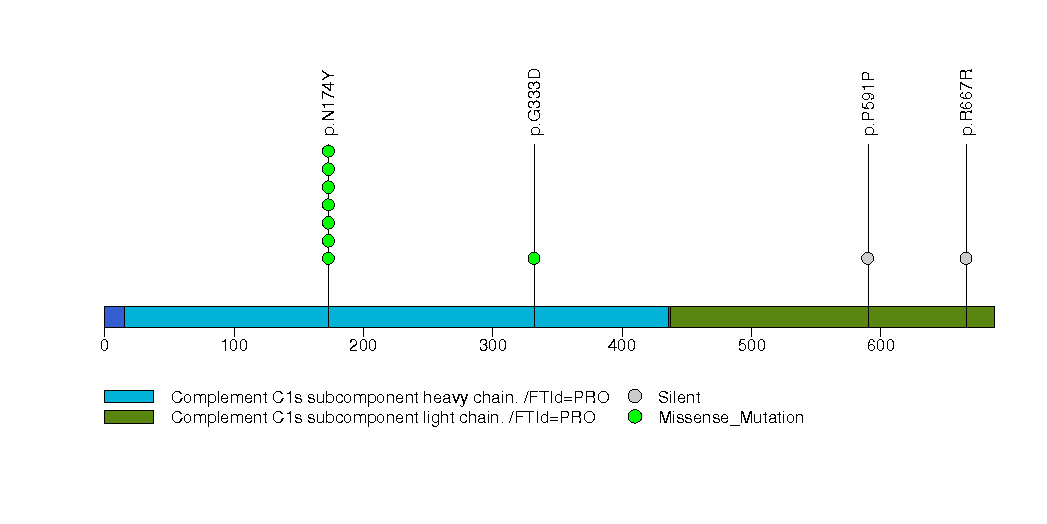
Figure S17. This figure depicts the distribution of mutations and mutation types across the PKD2 significant gene.
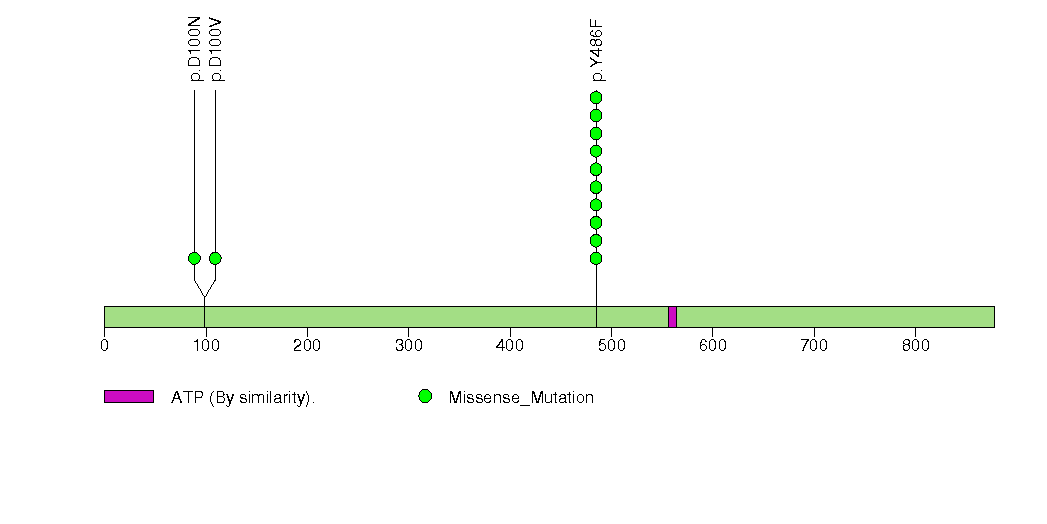
Figure S18. This figure depicts the distribution of mutations and mutation types across the SLC26A4 significant gene.
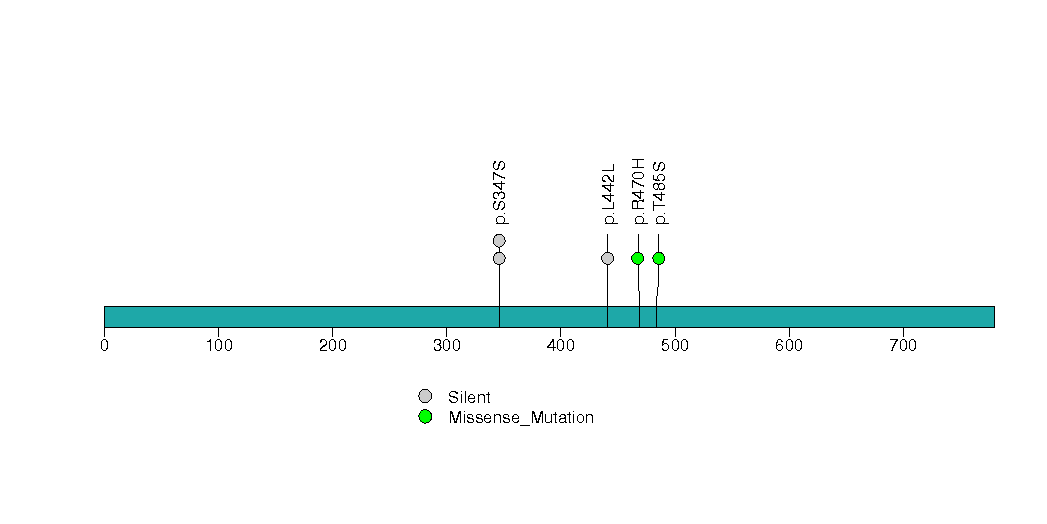
Figure S19. This figure depicts the distribution of mutations and mutation types across the TSKS significant gene.
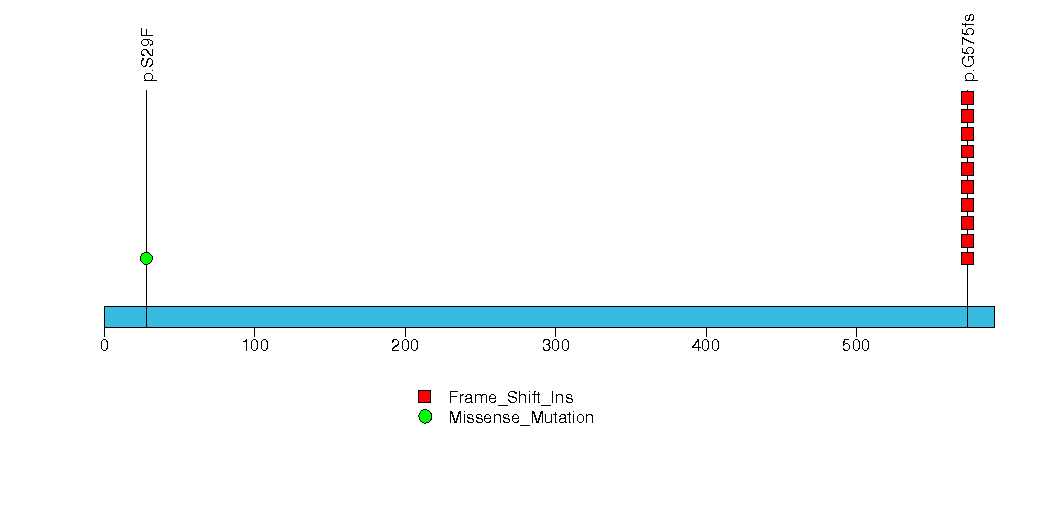
Figure S20. This figure depicts the distribution of mutations and mutation types across the PHYH significant gene.
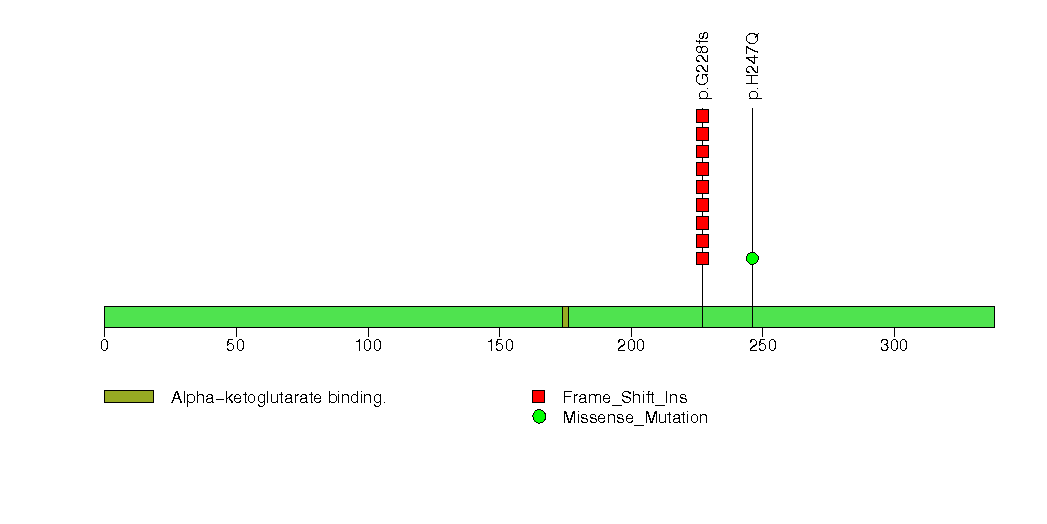
Figure S21. This figure depicts the distribution of mutations and mutation types across the OR4A47 significant gene.
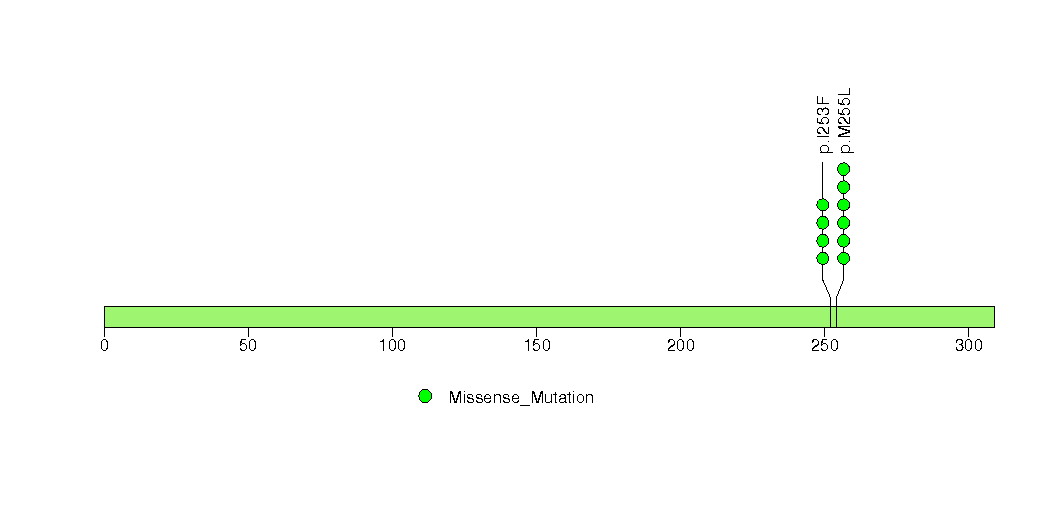
Figure S22. This figure depicts the distribution of mutations and mutation types across the ARPC2 significant gene.
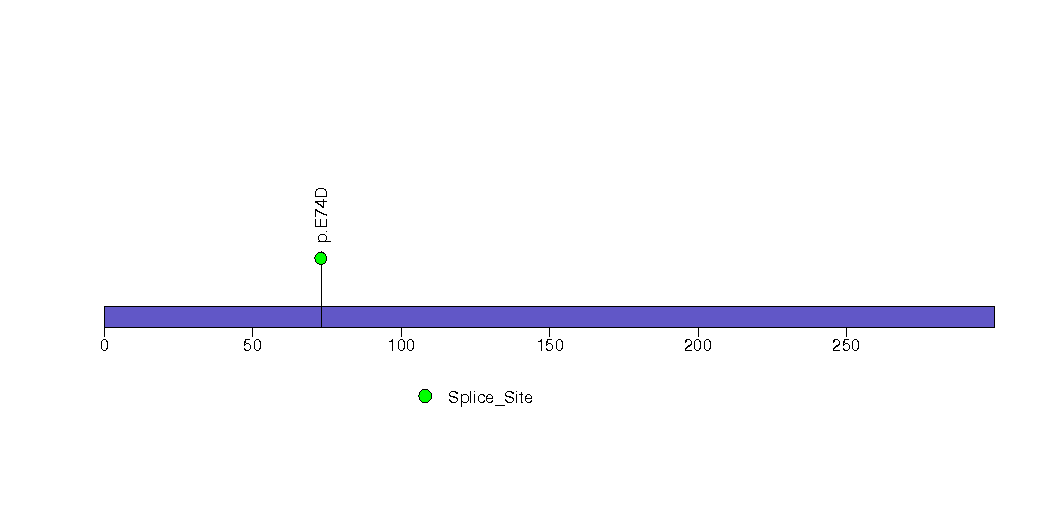
Figure S23. This figure depicts the distribution of mutations and mutation types across the CHSY1 significant gene.
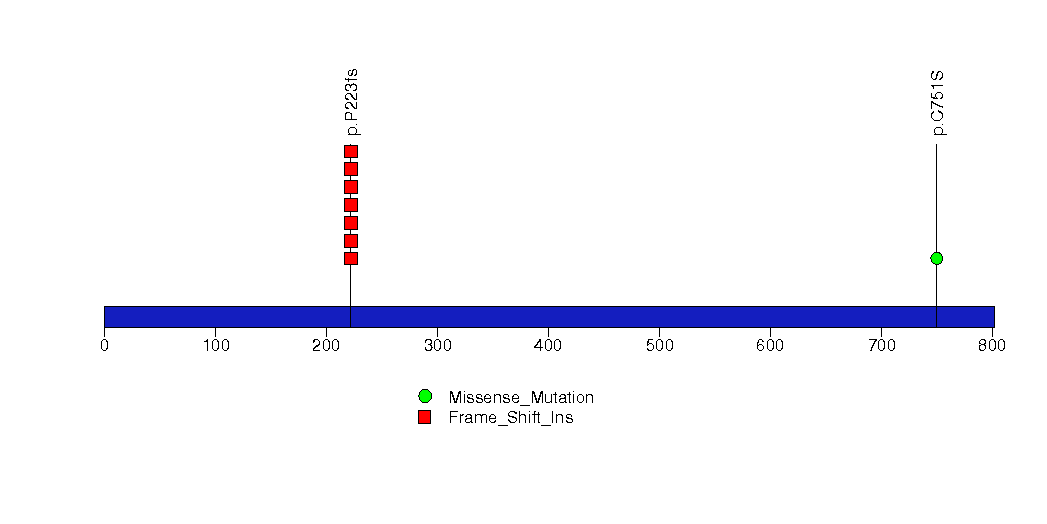
Figure S24. This figure depicts the distribution of mutations and mutation types across the PDE9A significant gene.
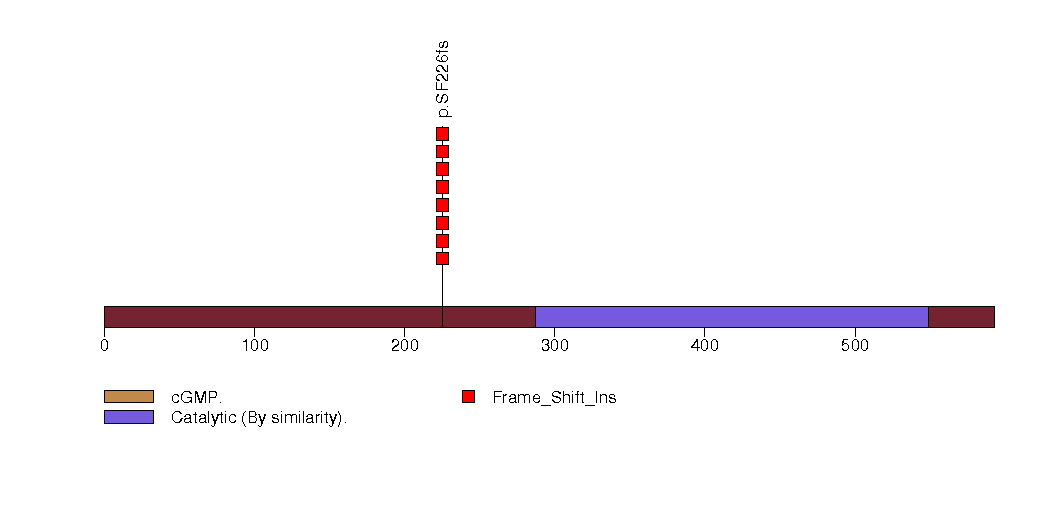
Figure S25. This figure depicts the distribution of mutations and mutation types across the TRH significant gene.
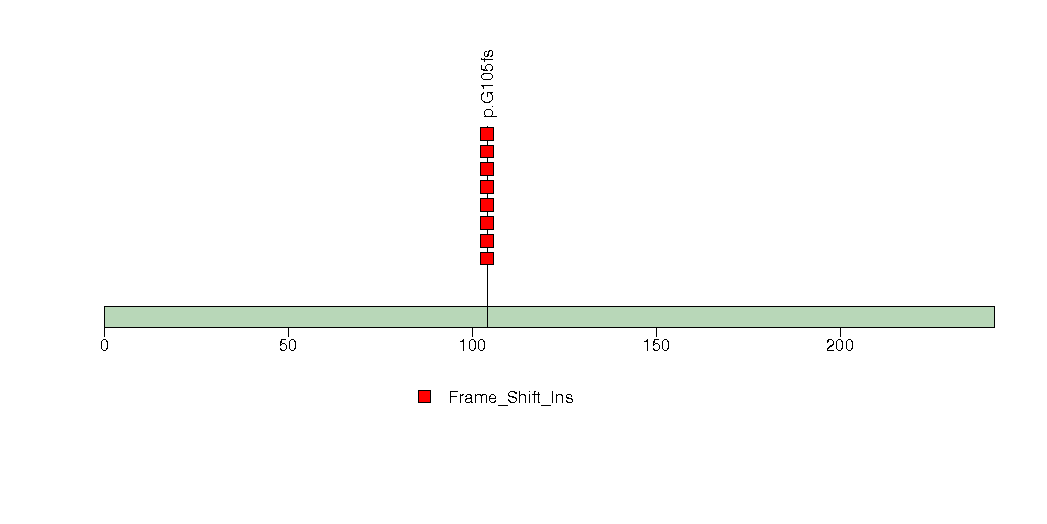
Figure S26. This figure depicts the distribution of mutations and mutation types across the NETO2 significant gene.
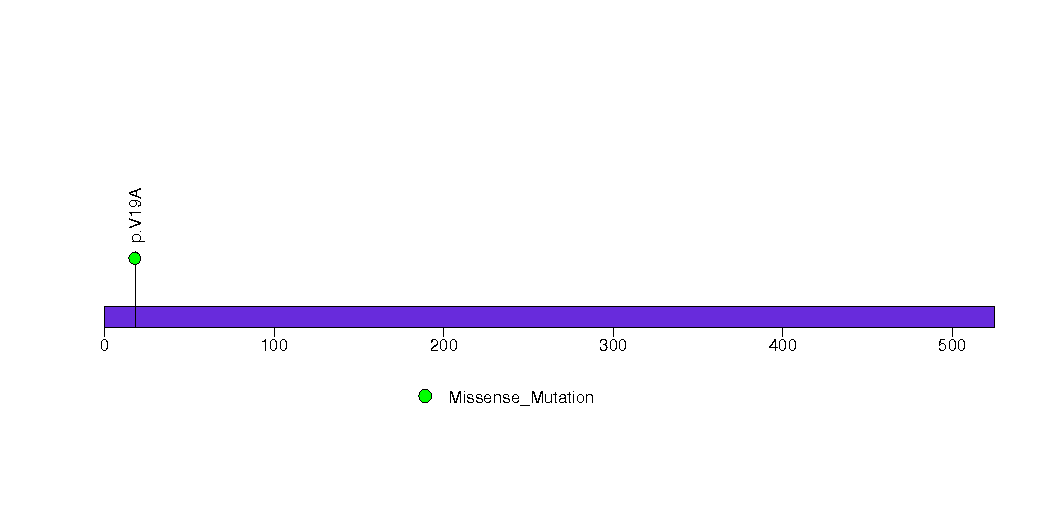
Figure S27. This figure depicts the distribution of mutations and mutation types across the PCGF1 significant gene.
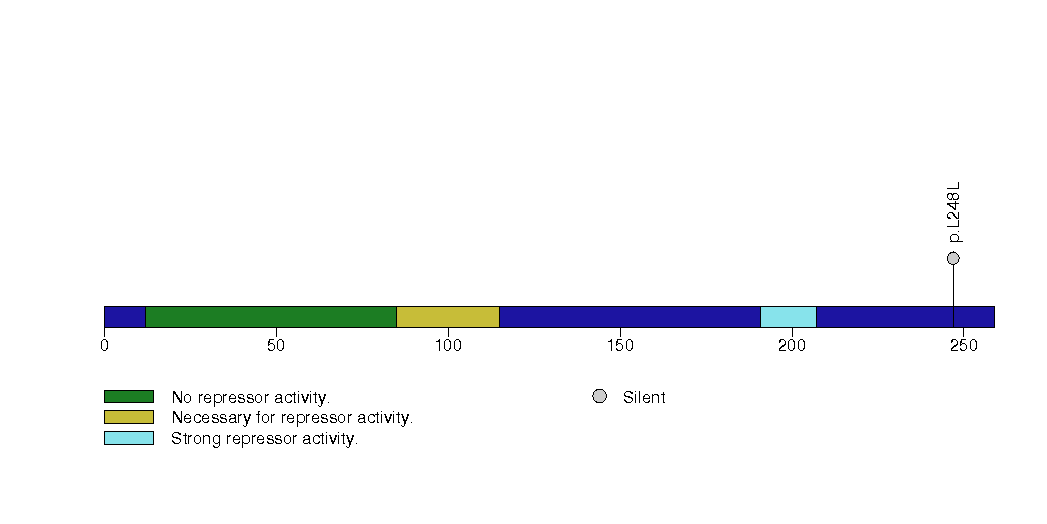
Figure S28. This figure depicts the distribution of mutations and mutation types across the RBPJL significant gene.
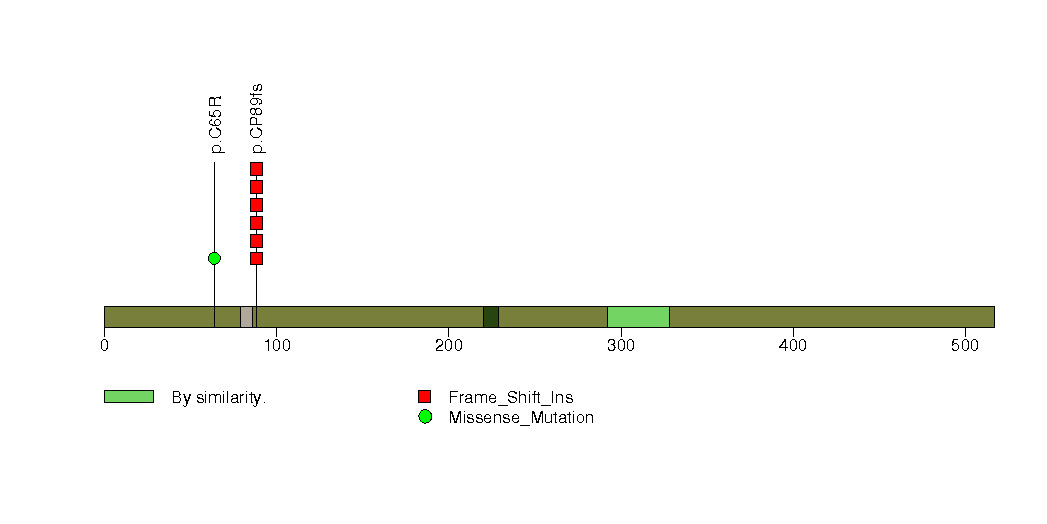
Figure S29. This figure depicts the distribution of mutations and mutation types across the SHANK1 significant gene.
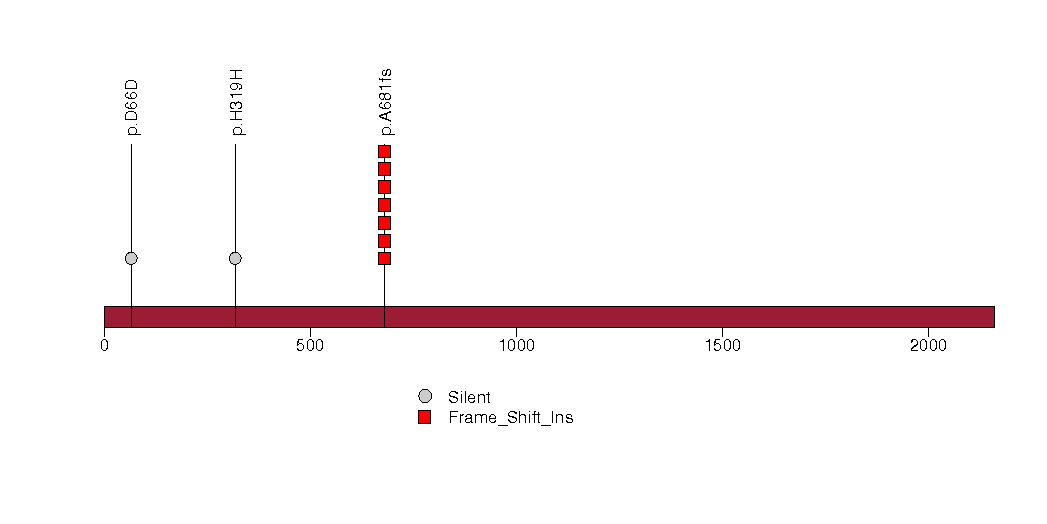
Figure S30. This figure depicts the distribution of mutations and mutation types across the ZMAT2 significant gene.
In this analysis, COSMIC is used as a filter to increase power by restricting the territory of each gene. Cosmic version: v48.
Table 4. Get Full Table Significantly mutated genes (COSMIC territory only). To access the database please go to: COSMIC. Number of significant genes found: 58. Number of genes displayed: 10
| rank | gene | description | n | cos | n_cos | N_cos | cos_ev | p | q |
|---|---|---|---|---|---|---|---|---|---|
| 1 | VHL | von Hippel-Lindau tumor suppressor | 237 | 541 | 233 | 243991 | 5671 | 0 | 0 |
| 2 | TP53 | tumor protein p53 | 15 | 356 | 13 | 160556 | 863 | 0 | 0 |
| 3 | PTEN | phosphatase and tensin homolog (mutated in multiple advanced cancers 1) | 21 | 767 | 21 | 345917 | 558 | 0 | 0 |
| 4 | PIK3CA | phosphoinositide-3-kinase, catalytic, alpha polypeptide | 10 | 220 | 8 | 99220 | 2986 | 3.2e-11 | 3.6e-08 |
| 5 | PTCH1 | patched homolog 1 (Drosophila) | 9 | 256 | 7 | 115456 | 10 | 4.1e-09 | 3.7e-06 |
| 6 | STXBP3 | syntaxin binding protein 3 | 3 | 1 | 2 | 451 | 2 | 3.7e-07 | 0.00028 |
| 7 | KLK10 | kallikrein-related peptidase 10 | 3 | 2 | 2 | 902 | 2 | 1.5e-06 | 0.00083 |
| 8 | ZFYVE26 | zinc finger, FYVE domain containing 26 | 7 | 2 | 2 | 902 | 2 | 1.5e-06 | 0.00083 |
| 9 | NEK8 | NIMA (never in mitosis gene a)- related kinase 8 | 2 | 3 | 2 | 1353 | 2 | 3.3e-06 | 0.0017 |
| 10 | ARAP3 | ArfGAP with RhoGAP domain, ankyrin repeat and PH domain 3 | 14 | 4 | 2 | 1804 | 4 | 5.9e-06 | 0.0027 |
Note:
n - number of (nonsilent) mutations in this gene across the individual set.
cos = number of unique mutated sites in this gene in COSMIC
n_cos = overlap between n and cos.
N_cos = number of individuals times cos.
cos_ev = total evidence: number of reports in COSMIC for mutations seen in this gene.
p = p-value for seeing the observed amount of overlap in this gene)
q = q-value, False Discovery Rate (Benjamini-Hochberg procedure)
Table 5. Get Full Table A Ranked List of Significantly Mutated Genesets. (Source: MSigDB GSEA Cannonical Pathway Set).Number of significant genesets found: 11. Number of genesets displayed: 10
| rank | geneset | description | genes | N_genes | mut_tally | N | n | npat | nsite | nsil | n1 | n2 | n3 | n4 | n5 | n6 | p_ns_s | p | q |
|---|---|---|---|---|---|---|---|---|---|---|---|---|---|---|---|---|---|---|---|
| 1 | HSA04120_UBIQUITIN_MEDIATED_PROTEOLYSIS | Genes involved in ubiquitin mediated proteolysis | ANAPC1, ANAPC10, ANAPC11, ANAPC2, ANAPC4, ANAPC5, ANAPC7, BTRC, CDC16, CDC20, CDC23, CDC26, CDC27, CUL1, CUL2, CUL3, FBXW11, FBXW7, FZR1, ITCH, LOC728919, RBX1, SKP1, SKP2, SMURF1, SMURF2, TCEB1, TCEB2, UBA1, UBE2C, UBE2D1, UBE2D2, UBE2D3, UBE2D4, UBE2E1, UBE2E2, UBE2E3, VHL, WWP1, WWP2 | 39 | ANAPC1(4), ANAPC2(1), ANAPC4(5), ANAPC5(1), ANAPC7(2), BTRC(2), CDC16(3), CDC20(1), CDC23(2), CDC27(1), CUL1(3), CUL2(1), CUL3(6), FBXW11(1), FBXW7(2), FZR1(3), ITCH(1), SKP2(1), SMURF1(1), SMURF2(2), TCEB1(3), TCEB2(1), UBA1(1), UBE2D1(2), UBE2D2(1), UBE2D3(2), UBE2E2(1), VHL(237), WWP2(3) | 26842932 | 294 | 255 | 193 | 13 | 10 | 17 | 29 | 83 | 153 | 2 | 9.2e-12 | <1.00e-15 | <4.10e-13 |
| 2 | VEGFPATHWAY | Vascular endothelial growth factor (VEGF) is upregulated by hypoxic conditions and promotes normal blood vessel formation and angiogenesis related to tumor growth or cardiac disease. | ARNT, EIF1, EIF1A, EIF2B1, EIF2B2, EIF2B3, EIF2B4, EIF2B5, EIF2S1, EIF2S2, EIF2S3, ELAVL1, FLT1, FLT4, HIF1A, HRAS, KDR, NOS3, PIK3CA, PIK3R1, PLCG1, PRKCA, PRKCB1, PTK2, PXN, SHC1, VEGF, VHL | 25 | ARNT(2), EIF1(2), EIF2B1(1), EIF2B2(1), EIF2B3(1), EIF2B5(2), EIF2S2(2), FLT1(7), FLT4(7), HIF1A(3), HRAS(1), KDR(5), NOS3(2), PIK3CA(10), PIK3R1(2), PLCG1(2), PRKCA(2), PTK2(1), PXN(1), SHC1(3), VHL(237) | 22290046 | 294 | 252 | 193 | 16 | 12 | 21 | 29 | 80 | 151 | 1 | 5.4e-11 | 1.33e-15 | 4.10e-13 |
| 3 | HIFPATHWAY | Under normal conditions, hypoxia inducible factor HIF-1 is degraded; under hypoxic conditions, it activates transcription of genes controlled by hpoxic response elements (HREs). | ARNT, ASPH, COPS5, CREB1, EDN1, EP300, EPO, HIF1A, HSPCA, JUN, LDHA, NOS3, P4HB, VEGF, VHL | 13 | ARNT(2), COPS5(1), EP300(11), HIF1A(3), JUN(2), NOS3(2), VHL(237) | 11058426 | 258 | 235 | 158 | 10 | 8 | 11 | 27 | 68 | 143 | 1 | 2.2e-11 | 4.66e-15 | 9.57e-13 |
| 4 | SA_PTEN_PATHWAY | PTEN is a tumor suppressor that dephosphorylates the lipid messenger phosphatidylinositol triphosphate. | AKT1, AKT2, AKT3, BPNT1, GRB2, ILK, MAPK1, MAPK3, PDK1, PIK3CA, PIK3CD, PIP3-E, PTEN, PTK2B, RBL2, SHC1, SOS1 | 16 | AKT1(1), AKT2(3), AKT3(1), GRB2(2), ILK(4), MAPK3(1), PDK1(1), PIK3CA(10), PIK3CD(1), PTEN(21), PTK2B(3), RBL2(2), SHC1(3), SOS1(5) | 13295530 | 58 | 51 | 53 | 3 | 4 | 13 | 4 | 14 | 22 | 1 | 0.00037 | 1.92e-07 | 2.96e-05 |
| 5 | TERTPATHWAY | hTERC, the RNA subunit of telomerase, and hTERT, the catalytic protein subunit, are required for telomerase activity and are overexpressed in many cancers. | HDAC1, MAX, MYC, SP1, SP3, TP53, WT1, ZNF42 | 7 | HDAC1(2), MAX(5), SP1(2), SP3(2), TP53(15), WT1(3) | 4549903 | 29 | 25 | 27 | 3 | 1 | 3 | 1 | 10 | 12 | 2 | 0.14 | 0.000104 | 0.0109 |
| 6 | BBCELLPATHWAY | Fas ligand expression by T cells induces apoptosis in Fas-expressing, inactive B cells. | CD28, CD4, HLA-DRA, HLA-DRB1, TNFRSF5, TNFRSF6, TNFSF5, TNFSF6 | 4 | CD28(1), CD4(10), HLA-DRA(1), HLA-DRB1(1) | 1356343 | 13 | 13 | 7 | 1 | 1 | 1 | 0 | 1 | 9 | 1 | 0.7 | 0.000111 | 0.0109 |
| 7 | SA_G1_AND_S_PHASES | Cdk2, 4, and 6 bind cyclin D in G1, while cdk2/cyclin E promotes the G1/S transition. | ARF1, ARF3, CCND1, CDK2, CDK4, CDKN1A, CDKN1B, CDKN2A, CFL1, E2F1, E2F2, MDM2, NXT1, PRB1, TP53 | 15 | ARF1(1), ARF3(1), CDK2(2), CDK4(6), CDKN1A(1), CDKN2A(3), CFL1(1), E2F1(1), PRB1(6), TP53(15) | 5336707 | 37 | 29 | 27 | 3 | 1 | 2 | 4 | 6 | 22 | 2 | 0.11 | 0.000126 | 0.0109 |
| 8 | SA_TRKA_RECEPTOR | The TrkA receptor binds nerve growth factor to activate MAP kinase pathways and promote cell growth. | AKT1, AKT2, AKT3, ARHA, CDKN1A, ELK1, GRB2, HRAS, MAP2K1, MAP2K2, NGFB, NGFR, NTRK1, PIK3CA, PIK3CD, SHC1, SOS1 | 15 | AKT1(1), AKT2(3), AKT3(1), CDKN1A(1), ELK1(1), GRB2(2), HRAS(1), NGFR(1), NTRK1(5), PIK3CA(10), PIK3CD(1), SHC1(3), SOS1(5) | 10262631 | 35 | 34 | 31 | 1 | 2 | 10 | 3 | 16 | 4 | 0 | 0.00068 | 0.000142 | 0.0109 |
| 9 | CDC42RACPATHWAY | PI3 kinase stimulates cell migration by activating cdc42, which activates ARP2/3, which in turn promotes formation of new actin fibers. | ACTR2, ACTR3, ARHA, ARPC1A, ARPC1B, ARPC2, ARPC3, ARPC4, CDC42, PAK1, PDGFRA, PIK3CA, PIK3R1, RAC1, WASL | 14 | ACTR2(1), ARPC2(8), CDC42(1), PAK1(2), PDGFRA(5), PIK3CA(10), PIK3R1(2), WASL(6) | 8954221 | 35 | 35 | 26 | 2 | 0 | 7 | 2 | 13 | 13 | 0 | 0.012 | 0.000252 | 0.0172 |
| 10 | P53HYPOXIAPATHWAY | Hypoxia induces p53 accumulation and consequent apoptosis with p53-mediated cell cycle arrest, which is present under conditions of DNA damage. | ABCB1, AKT1, ATM, BAX, CDKN1A, CPB2, CSNK1A1, CSNK1D, FHL2, GADD45A, HIC1, HIF1A, HSPA1A, HSPCA, IGFBP3, MAPK8, MDM2, NFKBIB, NQO1, TP53 | 17 | ABCB1(4), AKT1(1), ATM(15), CDKN1A(1), CPB2(5), CSNK1A1(2), FHL2(1), HIF1A(3), IGFBP3(1), NFKBIB(1), TP53(15) | 13158403 | 49 | 43 | 44 | 3 | 1 | 6 | 5 | 14 | 21 | 2 | 0.006 | 0.000386 | 0.0238 |
Table 6. Get Full Table A Ranked List of Significantly Mutated Genesets (Excluding Significantly Mutated Genes). Number of significant genesets found: 0. Number of genesets displayed: 10
| rank | geneset | description | genes | N_genes | mut_tally | N | n | npat | nsite | nsil | n1 | n2 | n3 | n4 | n5 | n6 | p_ns_s | p | q |
|---|---|---|---|---|---|---|---|---|---|---|---|---|---|---|---|---|---|---|---|
| 1 | HSA00950_ALKALOID_BIOSYNTHESIS_I | Genes involved in alkaloid biosynthesis I | DDC, GOT1, GOT2, TAT, TYR | 5 | DDC(2), GOT1(3), GOT2(2), TAT(1), TYR(5) | 3135385 | 13 | 13 | 13 | 1 | 1 | 0 | 3 | 4 | 5 | 0 | 0.27 | 0.0041 | 1 |
| 2 | CHREBPPATHWAY | Carbohydrate responsive element binding protein (chREBP) is a transcription factor inhibited by cAMP and activated by high carbohydrate levels. | ADCY1, BG1, BUCS1, GNAS, GNB1, GNGT1, PPP2CA, PRKAA1, PRKAA2, PRKAB1, PRKAB2, PRKACB, PRKACG, PRKAG1, PRKAG2, PRKAR1A, PRKAR1B, PRKAR2A, PRKAR2B, WBSCR14 | 16 | ADCY1(2), GNAS(5), GNB1(2), PPP2CA(1), PRKAB1(1), PRKACB(2), PRKACG(2), PRKAG1(4), PRKAG2(4), PRKAR1A(2), PRKAR2B(2) | 9130690 | 27 | 27 | 27 | 1 | 3 | 3 | 2 | 12 | 7 | 0 | 0.015 | 0.0086 | 1 |
| 3 | EEA1PATHWAY | The FYVE-finger proteins EEA1 and HRS are localized to endosome membranes and regulate sorting and ubiquitination in the vesicle transport system. | EEA1, EGF, EGFR, HGS, RAB5A, TF, TFRC | 7 | EEA1(6), EGF(4), EGFR(9), HGS(2), RAB5A(1), TFRC(2) | 8444563 | 24 | 23 | 22 | 0 | 4 | 1 | 5 | 6 | 8 | 0 | 0.0056 | 0.011 | 1 |
| 4 | SA_TRKA_RECEPTOR | The TrkA receptor binds nerve growth factor to activate MAP kinase pathways and promote cell growth. | AKT1, AKT2, AKT3, ARHA, CDKN1A, ELK1, GRB2, HRAS, MAP2K1, MAP2K2, NGFB, NGFR, NTRK1, PIK3CA, PIK3CD, SHC1, SOS1 | 14 | AKT1(1), AKT2(3), AKT3(1), CDKN1A(1), ELK1(1), GRB2(2), HRAS(1), NGFR(1), NTRK1(5), PIK3CD(1), SHC1(3), SOS1(5) | 8805146 | 25 | 24 | 24 | 1 | 2 | 6 | 2 | 12 | 3 | 0 | 0.01 | 0.015 | 1 |
| 5 | CYSTEINE_METABOLISM | CARS, CTH, GOT1, GOT2, LDHA, LDHB, LDHC, MPST | 8 | CARS(6), CTH(1), GOT1(3), GOT2(2), LDHB(1), LDHC(3), MPST(2) | 4479216 | 18 | 18 | 16 | 2 | 1 | 0 | 2 | 5 | 10 | 0 | 0.39 | 0.017 | 1 | |
| 6 | HSA00750_VITAMIN_B6_METABOLISM | Genes involved in vitamin B6 metabolism | AOX1, PDXK, PDXP, PNPO, PSAT1 | 5 | AOX1(7), PDXK(2), PDXP(1), PSAT1(1) | 3151763 | 11 | 11 | 11 | 0 | 2 | 1 | 0 | 6 | 2 | 0 | 0.094 | 0.018 | 1 |
| 7 | UREACYCLEPATHWAY | Ammonia released from amino acid deamination is used to produce carbamoyl phosphate, which is used to convert ornithine to citrulline, from which urea is eventually formed. | ARG1, ASL, ASS, CPS1, GLS, GLUD1, GOT1 | 6 | ARG1(1), ASL(4), CPS1(4), GLS(3), GOT1(3) | 5133932 | 15 | 15 | 15 | 1 | 0 | 3 | 1 | 6 | 5 | 0 | 0.18 | 0.041 | 1 |
| 8 | HSA00720_REDUCTIVE_CARBOXYLATE_CYCLE | Genes involved in reductive carboxylate cycle (CO2 fixation) | ACLY, ACO1, ACO2, ACSS1, ACSS2, FH, IDH1, IDH2, LOC441996, MDH1, MDH2, SUCLA2 | 11 | ACLY(6), ACO1(4), ACSS1(2), ACSS2(7), IDH1(2), IDH2(5), MDH1(1), SUCLA2(1) | 8812773 | 28 | 23 | 24 | 2 | 1 | 5 | 3 | 8 | 10 | 1 | 0.048 | 0.058 | 1 |
| 9 | GSPATHWAY | Activated G-protein coupled receptors stimulate cAMP production and thus activate protein kinase A, involved in a number of signal transduction pathways. | ADCY1, GNAS, GNB1, GNGT1, PRKACA, PRKAR1A | 6 | ADCY1(2), GNAS(5), GNB1(2), PRKACA(1), PRKAR1A(2) | 4071859 | 12 | 12 | 12 | 1 | 1 | 1 | 0 | 9 | 1 | 0 | 0.29 | 0.063 | 1 |
| 10 | ACETAMINOPHENPATHWAY | Acetaminophen selectively inhibits Cox-3, which is localized to the brain, and yields the toxic metabolite NAPQI when processed by CAR in the liver. | CYP1A2, CYP2E1, CYP3A, NR1I3, PTGS1, PTGS2 | 5 | CYP1A2(3), CYP2E1(1), NR1I3(1), PTGS1(2), PTGS2(4) | 3459591 | 11 | 11 | 11 | 2 | 1 | 1 | 1 | 4 | 3 | 1 | 0.53 | 0.065 | 1 |
In brief, we tabulate the number of mutations and the number of covered bases for each gene. The counts are broken down by mutation context category: four context categories that are discovered by MutSig, and one for indel and 'null' mutations, which include indels, nonsense mutations, splice-site mutations, and non-stop (read-through) mutations. For each gene, we calculate the probability of seeing the observed constellation of mutations, i.e. the product P1 x P2 x ... x Pm, or a more extreme one, given the background mutation rates calculated across the dataset. [1]
In addition to the links below, the full results of the analysis summarized in this report can also be downloaded programmatically using firehose_get, or interactively from either the Broad GDAC website or TCGA Data Coordination Center Portal.