This pipeline computes the correlation between significant arm-level copy number variations (cnvs) and selected clinical features.
Testing the association between copy number variation 32 arm-level events and 5 clinical features across 191 patients, 8 significant findings detected with Q value < 0.25.
-
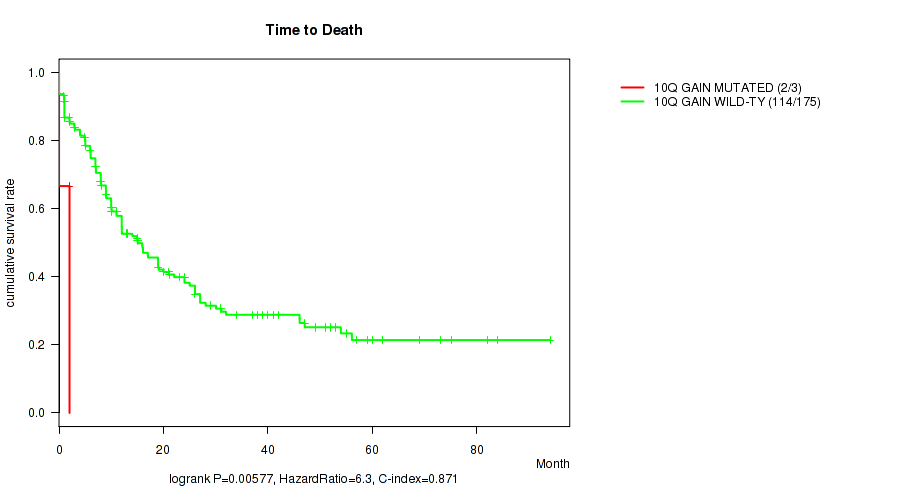
10q gain cnv correlated to 'Time to Death'.
-
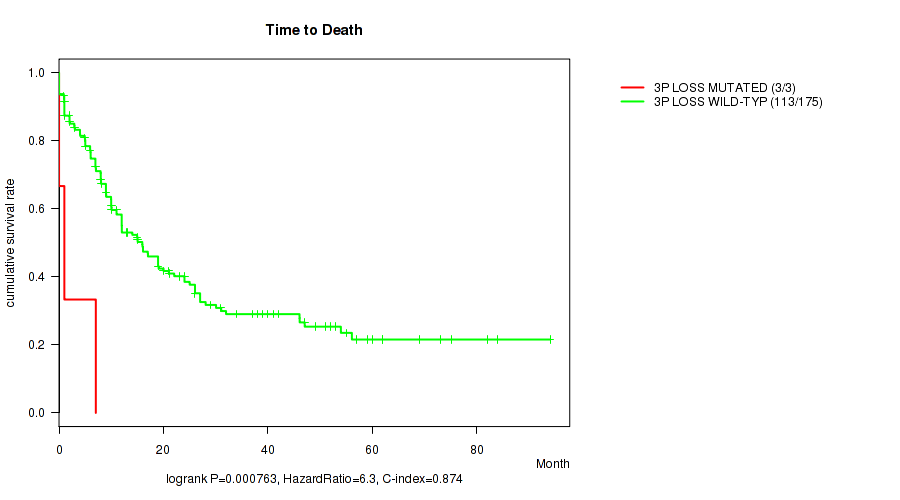
3p loss cnv correlated to 'Time to Death'.
-
3q loss cnv correlated to 'Time to Death'.
-
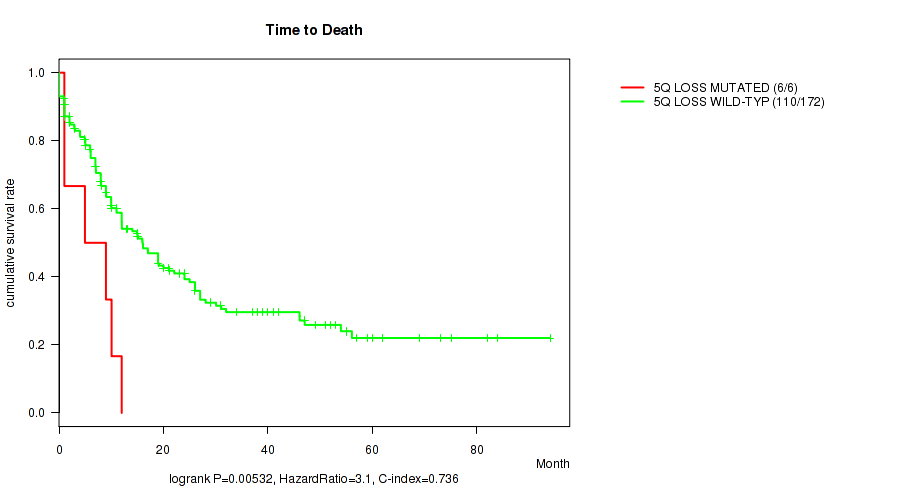
5q loss cnv correlated to 'Time to Death'.
-
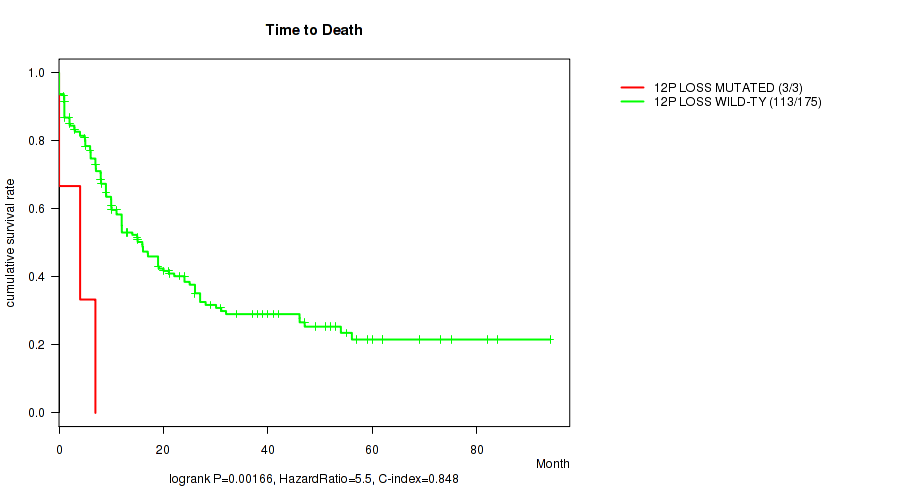
12p loss cnv correlated to 'Time to Death'.
-
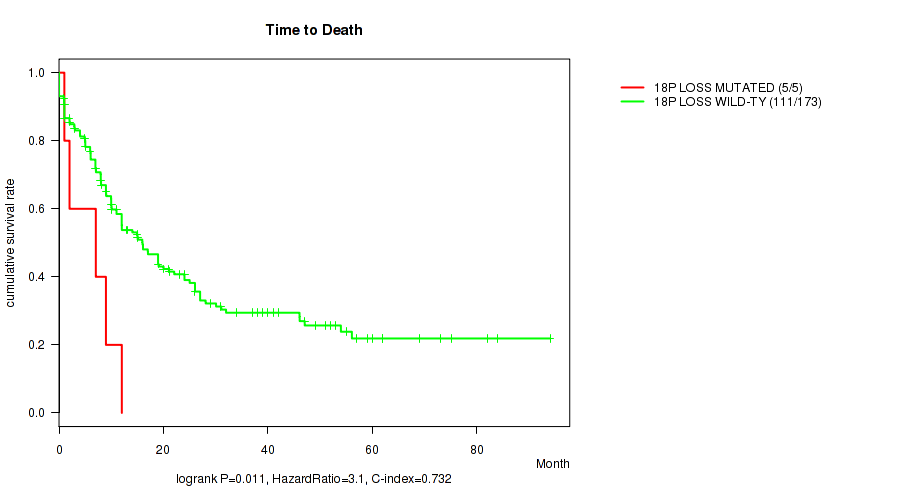
18p loss cnv correlated to 'Time to Death'.
-
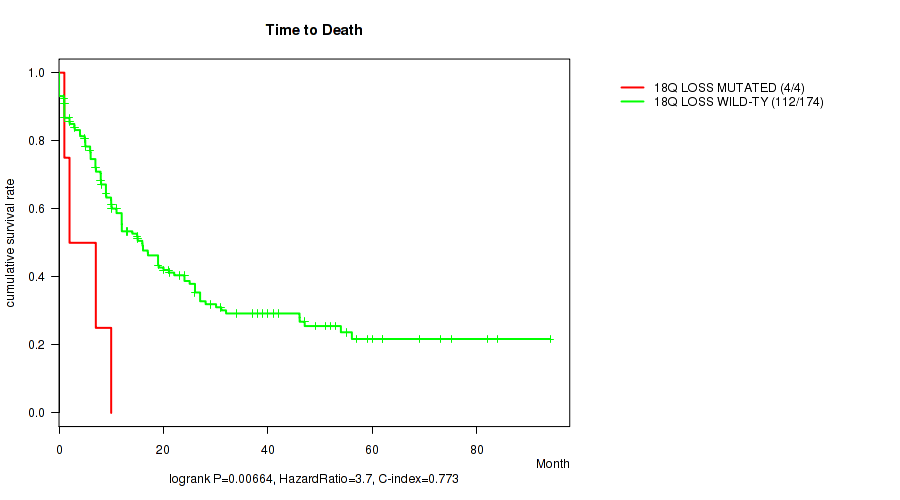
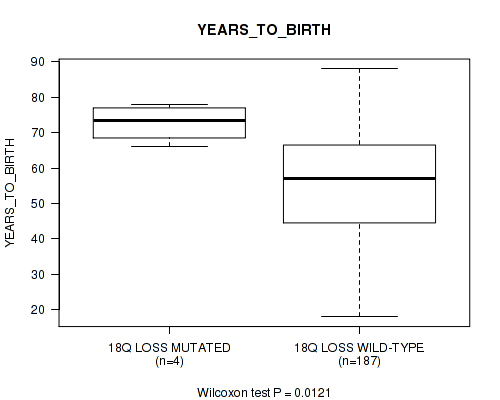
18q loss cnv correlated to 'Time to Death' and 'YEARS_TO_BIRTH'.
Table 1. Get Full Table Overview of the association between significant copy number variation of 32 arm-level events and 5 clinical features. Shown in the table are P values (Q values). Thresholded by Q value < 0.25, 8 significant findings detected.
|
Clinical Features |
Time to Death |
YEARS TO BIRTH |
GENDER | RACE | ETHNICITY | ||
| nCNV (%) | nWild-Type | logrank test | Wilcoxon-test | Fisher's exact test | Fisher's exact test | Fisher's exact test | |
| 18q loss | 4 (2%) | 187 |
0.00664 (0.177) |
0.0121 (0.241) |
0.127 (0.521) |
1 (1.00) |
1 (1.00) |
| 10q gain | 3 (2%) | 188 |
0.00577 (0.177) |
0.654 (1.00) |
0.252 (0.823) |
0.233 (0.809) |
1 (1.00) |
| 3p loss | 3 (2%) | 188 |
0.000763 (0.061) |
0.0208 (0.3) |
0.252 (0.823) |
1 (1.00) |
1 (1.00) |
| 3q loss | 3 (2%) | 188 |
0.000763 (0.061) |
0.0208 (0.3) |
0.252 (0.823) |
1 (1.00) |
1 (1.00) |
| 5q loss | 6 (3%) | 185 |
0.00532 (0.177) |
0.0519 (0.463) |
0.0325 (0.346) |
0.415 (1.00) |
1 (1.00) |
| 12p loss | 4 (2%) | 187 |
0.00166 (0.0886) |
0.869 (1.00) |
0.627 (1.00) |
1 (1.00) |
1 (1.00) |
| 18p loss | 5 (3%) | 186 |
0.011 (0.241) |
0.367 (1.00) |
0.0642 (0.463) |
0.361 (1.00) |
1 (1.00) |
| 1p gain | 3 (2%) | 188 |
0.115 (0.513) |
0.592 (1.00) |
1 (1.00) |
1 (1.00) |
|
| 4p gain | 4 (2%) | 187 |
0.506 (1.00) |
0.328 (0.972) |
0.627 (1.00) |
1 (1.00) |
1 (1.00) |
| 4q gain | 4 (2%) | 187 |
0.506 (1.00) |
0.328 (0.972) |
0.627 (1.00) |
1 (1.00) |
1 (1.00) |
| 8p gain | 22 (12%) | 169 |
0.412 (1.00) |
0.112 (0.513) |
0.0734 (0.463) |
1 (1.00) |
0.313 (0.972) |
| 8q gain | 23 (12%) | 168 |
0.464 (1.00) |
0.167 (0.621) |
0.0723 (0.463) |
1 (1.00) |
0.325 (0.972) |
| 11p gain | 5 (3%) | 186 |
0.792 (1.00) |
0.123 (0.519) |
1 (1.00) |
1 (1.00) |
0.0781 (0.463) |
| 11q gain | 7 (4%) | 184 |
0.37 (1.00) |
0.047 (0.463) |
1 (1.00) |
1 (1.00) |
0.108 (0.513) |
| 13q gain | 6 (3%) | 185 |
0.582 (1.00) |
0.12 (0.519) |
0.69 (1.00) |
1 (1.00) |
1 (1.00) |
| 17q gain | 3 (2%) | 188 |
0.856 (1.00) |
0.113 (0.513) |
1 (1.00) |
1 (1.00) |
1 (1.00) |
| 19p gain | 5 (3%) | 186 |
0.91 (1.00) |
0.715 (1.00) |
0.378 (1.00) |
1 (1.00) |
1 (1.00) |
| 19q gain | 5 (3%) | 186 |
0.91 (1.00) |
0.715 (1.00) |
0.378 (1.00) |
1 (1.00) |
1 (1.00) |
| 21q gain | 8 (4%) | 183 |
0.0661 (0.463) |
0.401 (1.00) |
0.0732 (0.463) |
0.185 (0.672) |
1 (1.00) |
| 22q gain | 9 (5%) | 182 |
0.564 (1.00) |
0.0629 (0.463) |
0.513 (1.00) |
1 (1.00) |
1 (1.00) |
| xp gain | 3 (2%) | 188 |
0.452 (1.00) |
0.108 (0.513) |
1 (1.00) |
1 (1.00) |
1 (1.00) |
| xq gain | 3 (2%) | 188 |
0.452 (1.00) |
0.108 (0.513) |
1 (1.00) |
1 (1.00) |
1 (1.00) |
| 7p loss | 17 (9%) | 174 |
0.0916 (0.505) |
0.458 (1.00) |
0.802 (1.00) |
1 (1.00) |
1 (1.00) |
| 7q loss | 20 (10%) | 171 |
0.0225 (0.3) |
0.513 (1.00) |
1 (1.00) |
0.721 (1.00) |
1 (1.00) |
| 15q loss | 4 (2%) | 187 |
0.8 (1.00) |
0.677 (1.00) |
1 (1.00) |
1 (1.00) |
1 (1.00) |
| 16q loss | 4 (2%) | 187 |
0.0189 (0.3) |
0.388 (1.00) |
0.627 (1.00) |
1 (1.00) |
1 (1.00) |
| 17p loss | 13 (7%) | 178 |
0.112 (0.513) |
0.765 (1.00) |
0.147 (0.574) |
0.654 (1.00) |
1 (1.00) |
| 17q loss | 7 (4%) | 184 |
0.274 (0.878) |
0.196 (0.697) |
0.458 (1.00) |
1 (1.00) |
1 (1.00) |
| 19p loss | 3 (2%) | 188 |
0.151 (0.574) |
0.592 (1.00) |
1 (1.00) |
1 (1.00) |
|
| 19q loss | 3 (2%) | 188 |
0.151 (0.574) |
0.592 (1.00) |
1 (1.00) |
1 (1.00) |
|
| xp loss | 5 (3%) | 186 |
0.081 (0.463) |
0.0283 (0.323) |
0.0642 (0.463) |
1 (1.00) |
1 (1.00) |
| xq loss | 5 (3%) | 186 |
0.081 (0.463) |
0.0283 (0.323) |
0.0642 (0.463) |
1 (1.00) |
1 (1.00) |
P value = 0.00577 (logrank test), Q value = 0.18
Table S1. Gene #6: '10q gain' versus Clinical Feature #1: 'Time to Death'
| nPatients | nDeath | Duration Range (Median), Month | |
|---|---|---|---|
| ALL | 178 | 116 | 0.0 - 94.1 (11.0) |
| 10Q GAIN MUTATED | 3 | 2 | 0.0 - 2.0 (1.9) |
| 10Q GAIN WILD-TYPE | 175 | 114 | 0.0 - 94.1 (12.0) |
Figure S1. Get High-res Image Gene #6: '10q gain' versus Clinical Feature #1: 'Time to Death'
P value = 0.000763 (logrank test), Q value = 0.061
Table S2. Gene #17: '3p loss' versus Clinical Feature #1: 'Time to Death'
| nPatients | nDeath | Duration Range (Median), Month | |
|---|---|---|---|
| ALL | 178 | 116 | 0.0 - 94.1 (11.0) |
| 3P LOSS MUTATED | 3 | 3 | 0.0 - 7.0 (1.0) |
| 3P LOSS WILD-TYPE | 175 | 113 | 0.0 - 94.1 (12.0) |
Figure S2. Get High-res Image Gene #17: '3p loss' versus Clinical Feature #1: 'Time to Death'
P value = 0.000763 (logrank test), Q value = 0.061
Table S3. Gene #18: '3q loss' versus Clinical Feature #1: 'Time to Death'
| nPatients | nDeath | Duration Range (Median), Month | |
|---|---|---|---|
| ALL | 178 | 116 | 0.0 - 94.1 (11.0) |
| 3Q LOSS MUTATED | 3 | 3 | 0.0 - 7.0 (1.0) |
| 3Q LOSS WILD-TYPE | 175 | 113 | 0.0 - 94.1 (12.0) |
Figure S3. Get High-res Image Gene #18: '3q loss' versus Clinical Feature #1: 'Time to Death'

P value = 0.00532 (logrank test), Q value = 0.18
Table S4. Gene #19: '5q loss' versus Clinical Feature #1: 'Time to Death'
| nPatients | nDeath | Duration Range (Median), Month | |
|---|---|---|---|
| ALL | 178 | 116 | 0.0 - 94.1 (11.0) |
| 5Q LOSS MUTATED | 6 | 6 | 1.0 - 12.0 (7.0) |
| 5Q LOSS WILD-TYPE | 172 | 110 | 0.0 - 94.1 (12.0) |
Figure S4. Get High-res Image Gene #19: '5q loss' versus Clinical Feature #1: 'Time to Death'
P value = 0.00166 (logrank test), Q value = 0.089
Table S5. Gene #22: '12p loss' versus Clinical Feature #1: 'Time to Death'
| nPatients | nDeath | Duration Range (Median), Month | |
|---|---|---|---|
| ALL | 178 | 116 | 0.0 - 94.1 (11.0) |
| 12P LOSS MUTATED | 3 | 3 | 0.0 - 7.0 (4.0) |
| 12P LOSS WILD-TYPE | 175 | 113 | 0.0 - 94.1 (12.0) |
Figure S5. Get High-res Image Gene #22: '12p loss' versus Clinical Feature #1: 'Time to Death'
P value = 0.011 (logrank test), Q value = 0.24
Table S6. Gene #27: '18p loss' versus Clinical Feature #1: 'Time to Death'
| nPatients | nDeath | Duration Range (Median), Month | |
|---|---|---|---|
| ALL | 178 | 116 | 0.0 - 94.1 (11.0) |
| 18P LOSS MUTATED | 5 | 5 | 1.0 - 12.0 (7.0) |
| 18P LOSS WILD-TYPE | 173 | 111 | 0.0 - 94.1 (12.0) |
Figure S6. Get High-res Image Gene #27: '18p loss' versus Clinical Feature #1: 'Time to Death'
P value = 0.00664 (logrank test), Q value = 0.18
Table S7. Gene #28: '18q loss' versus Clinical Feature #1: 'Time to Death'
| nPatients | nDeath | Duration Range (Median), Month | |
|---|---|---|---|
| ALL | 178 | 116 | 0.0 - 94.1 (11.0) |
| 18Q LOSS MUTATED | 4 | 4 | 1.0 - 10.0 (4.5) |
| 18Q LOSS WILD-TYPE | 174 | 112 | 0.0 - 94.1 (12.0) |
Figure S7. Get High-res Image Gene #28: '18q loss' versus Clinical Feature #1: 'Time to Death'
P value = 0.0121 (Wilcoxon-test), Q value = 0.24
Table S8. Gene #28: '18q loss' versus Clinical Feature #2: 'YEARS_TO_BIRTH'
| nPatients | Mean (Std.Dev) | |
|---|---|---|
| ALL | 191 | 55.2 (16.1) |
| 18Q LOSS MUTATED | 4 | 72.8 (5.4) |
| 18Q LOSS WILD-TYPE | 187 | 54.9 (16.0) |
Figure S8. Get High-res Image Gene #28: '18q loss' versus Clinical Feature #2: 'YEARS_TO_BIRTH'
-
Copy number data file = broad_values_by_arm.txt from GISTIC pipeline
-
Processed Copy number data file = /xchip/cga/gdac-prod/tcga-gdac/jobResults/GDAC_Correlate_Genomic_Events_Preprocess/LAML-TB/22529564/transformed.cor.cli.txt
-
Clinical data file = /xchip/cga/gdac-prod/tcga-gdac/jobResults/Append_Data/LAML-TB/22506504/LAML-TB.merged_data.txt
-
Number of patients = 191
-
Number of significantly arm-level cnvs = 32
-
Number of selected clinical features = 5
-
Exclude regions that fewer than K tumors have mutations, K = 3
For binary or multi-class clinical features (nominal or ordinal), two-tailed Fisher's exact tests (Fisher 1922) were used to estimate the P values using the 'fisher.test' function in R
For survival clinical features, the Kaplan-Meier survival curves of tumors with and without gene mutations were plotted and the statistical significance P values were estimated by logrank test (Bland and Altman 2004) using the 'survdiff' function in R
For multiple hypothesis correction, Q value is the False Discovery Rate (FDR) analogue of the P value (Benjamini and Hochberg 1995), defined as the minimum FDR at which the test may be called significant. We used the 'Benjamini and Hochberg' method of 'p.adjust' function in R to convert P values into Q values.
In addition to the links below, the full results of the analysis summarized in this report can also be downloaded programmatically using firehose_get, or interactively from either the Broad GDAC website or TCGA Data Coordination Center Portal.