This report serves to describe the mutational landscape and properties of a given individual set, as well as rank genes and genesets according to mutational significance. MutSig v2.0 was used to generate the results found in this report.
-
Working with individual set: LIHC-TP
-
Number of patients in set: 372
The input for this pipeline is a set of individuals with the following files associated for each:
-
An annotated .maf file describing the mutations called for the respective individual, and their properties.
-
A .wig file that contains information about the coverage of the sample.
-
MAF used for this analysis:LIHC-TP.final_analysis_set.maf
-
Blacklist used for this analysis: pancan_mutation_blacklist.v14.hg19.txt
-
Significantly mutated genes (q ≤ 0.1): 76
-
Mutations seen in COSMIC: 331
-
Significantly mutated genes in COSMIC territory: 14
-
Significantly mutated genesets: 45
-
Significantly mutated genesets: (excluding sig. mutated genes):0
-
Read 373 MAFs of type "maf1"
-
Total number of mutations in input MAFs: 53406
-
After removing 202 mutations outside chr1-24: 53204
-
After removing 178 blacklisted mutations: 53026
-
After removing 1113 noncoding mutations: 51913
-
After collapsing adjacent/redundant mutations: 51877
-
Number of mutations before filtering: 51877
-
After removing 732 mutations outside patient set: 51145
-
After removing 2751 mutations outside gene set: 48394
-
After removing 190 mutations outside category set: 48204
-
After removing 1 "impossible" mutations in
-
gene-patient-category bins of zero coverage: 44530
Table 1. Get Full Table Table representing breakdown of mutations by type.
| type | count |
|---|---|
| De_novo_Start_InFrame | 4 |
| De_novo_Start_OutOfFrame | 4 |
| Frame_Shift_Del | 3936 |
| Frame_Shift_Ins | 608 |
| In_Frame_Del | 313 |
| In_Frame_Ins | 96 |
| Missense_Mutation | 28575 |
| Nonsense_Mutation | 1628 |
| Nonstop_Mutation | 51 |
| Silent | 10707 |
| Splice_Site | 2198 |
| Start_Codon_Del | 9 |
| Start_Codon_Ins | 2 |
| Start_Codon_SNP | 56 |
| Stop_Codon_Del | 17 |
| Total | 48204 |
Table 2. Get Full Table A breakdown of mutation rates per category discovered for this individual set.
| category | n | N | rate | rate_per_mb | relative_rate | exp_ns_s_ratio |
|---|---|---|---|---|---|---|
| *CpG->T | 2557 | 691387354 | 3.7e-06 | 3.7 | 1.2 | 2.1 |
| A->G | 8533 | 5788472151 | 1.5e-06 | 1.5 | 0.47 | 2.4 |
| *Cp(A/C/T)->T | 4227 | 5433163909 | 7.8e-07 | 0.78 | 0.25 | 1.7 |
| transver | 13313 | 11913023414 | 1.1e-06 | 1.1 | 0.36 | 5 |
| indel+null | 8682 | 11913023414 | 7.3e-07 | 0.73 | 0.23 | NaN |
| double_null | 184 | 11913023414 | 1.5e-08 | 0.015 | 0.0049 | NaN |
| Total | 37496 | 11913023414 | 3.1e-06 | 3.1 | 1 | 3.5 |
The x axis represents the samples. The y axis represents the exons, one row per exon, and they are sorted by average coverage across samples. For exons with exactly the same average coverage, they are sorted next by the %GC of the exon. (The secondary sort is especially useful for the zero-coverage exons at the bottom). If the figure is unpopulated, then full coverage is assumed (e.g. MutSig CV doesn't use WIGs and assumes full coverage).
Figure 1.
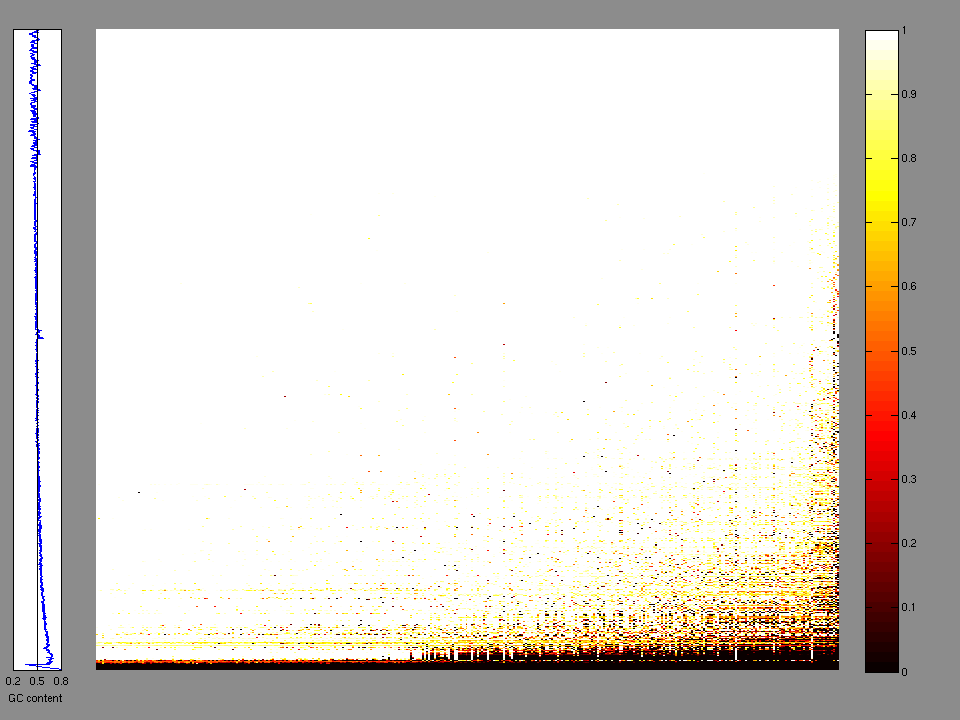
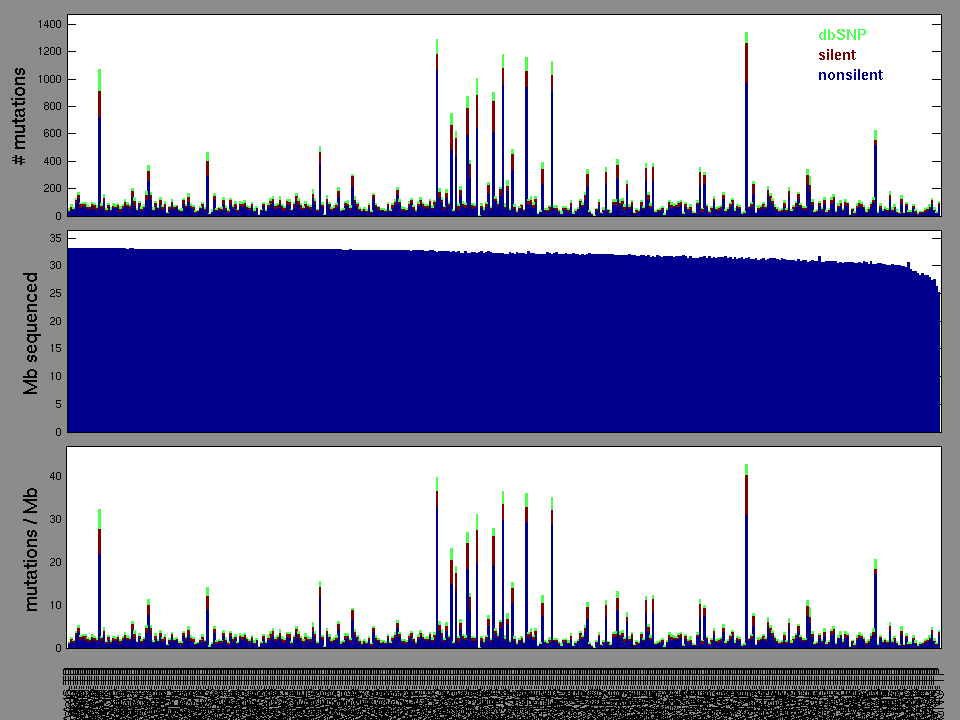
Figure 2. Patients counts and rates file used to generate this plot: LIHC-TP.patients.counts_and_rates.txt
The mutation spectrum is depicted in the lego plots below in which the 96 possible mutation types are subdivided into six large blocks, color-coded to reflect the base substitution type. Each large block is further subdivided into the 16 possible pairs of 5' and 3' neighbors, as listed in the 4x4 trinucleotide context legend. The height of each block corresponds to the mutation frequency for that kind of mutation (counts of mutations normalized by the base coverage in a given bin). The shape of the spectrum is a signature for dominant mutational mechanisms in different tumor types.
Figure 3. Get High-res Image SNV Mutation rate lego plot for entire set. Each bin is normalized by base coverage for that bin. Colors represent the six SNV types on the upper right. The three-base context for each mutation is labeled in the 4x4 legend on the lower right. The fractional breakdown of SNV counts is shown in the pie chart on the upper left. If this figure is blank, not enough information was provided in the MAF to generate it.
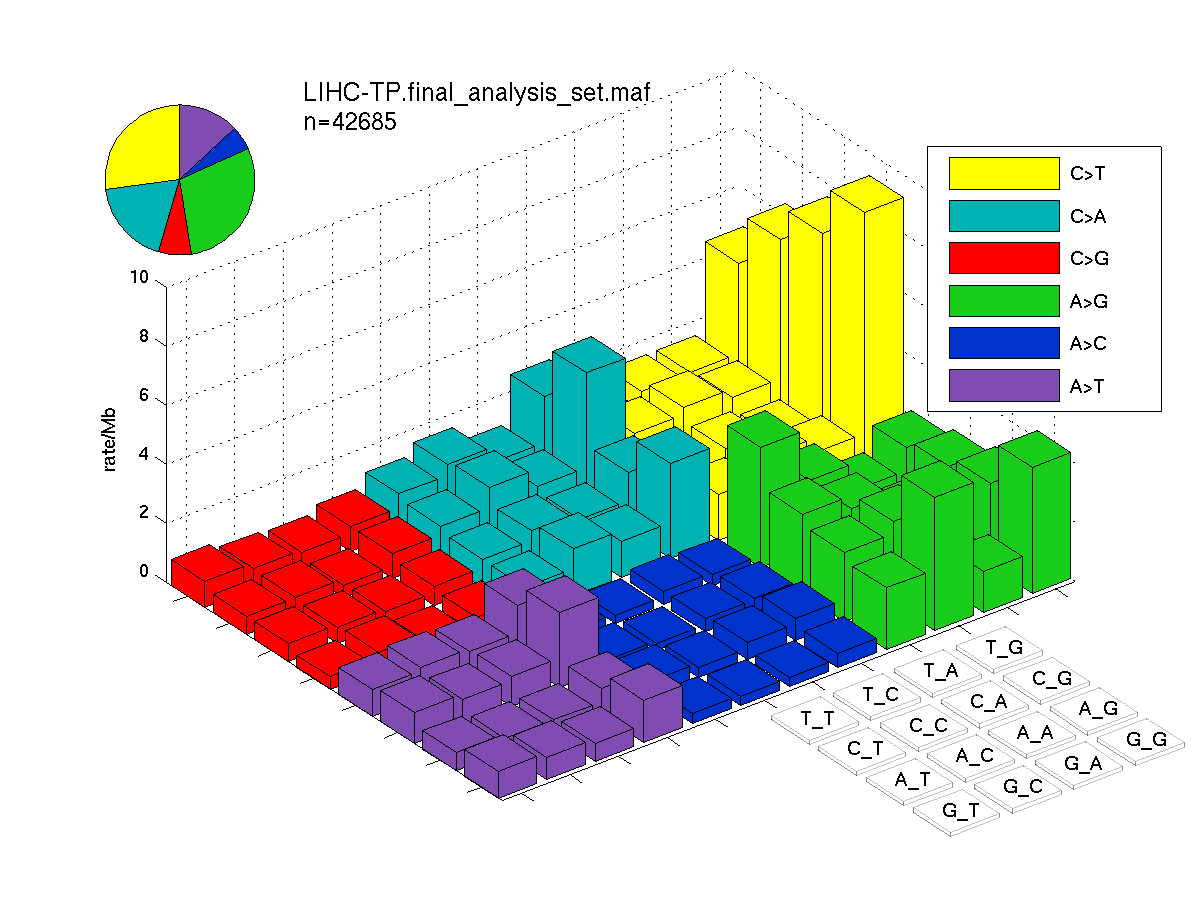
Figure 4. Get High-res Image SNV Mutation rate lego plots for 4 slices of mutation allele fraction (0<=AF<0.1, 0.1<=AF<0.25, 0.25<=AF<0.5, & 0.5<=AF) . The color code and three-base context legends are the same as the previous figure. If this figure is blank, not enough information was provided in the MAF to generate it.

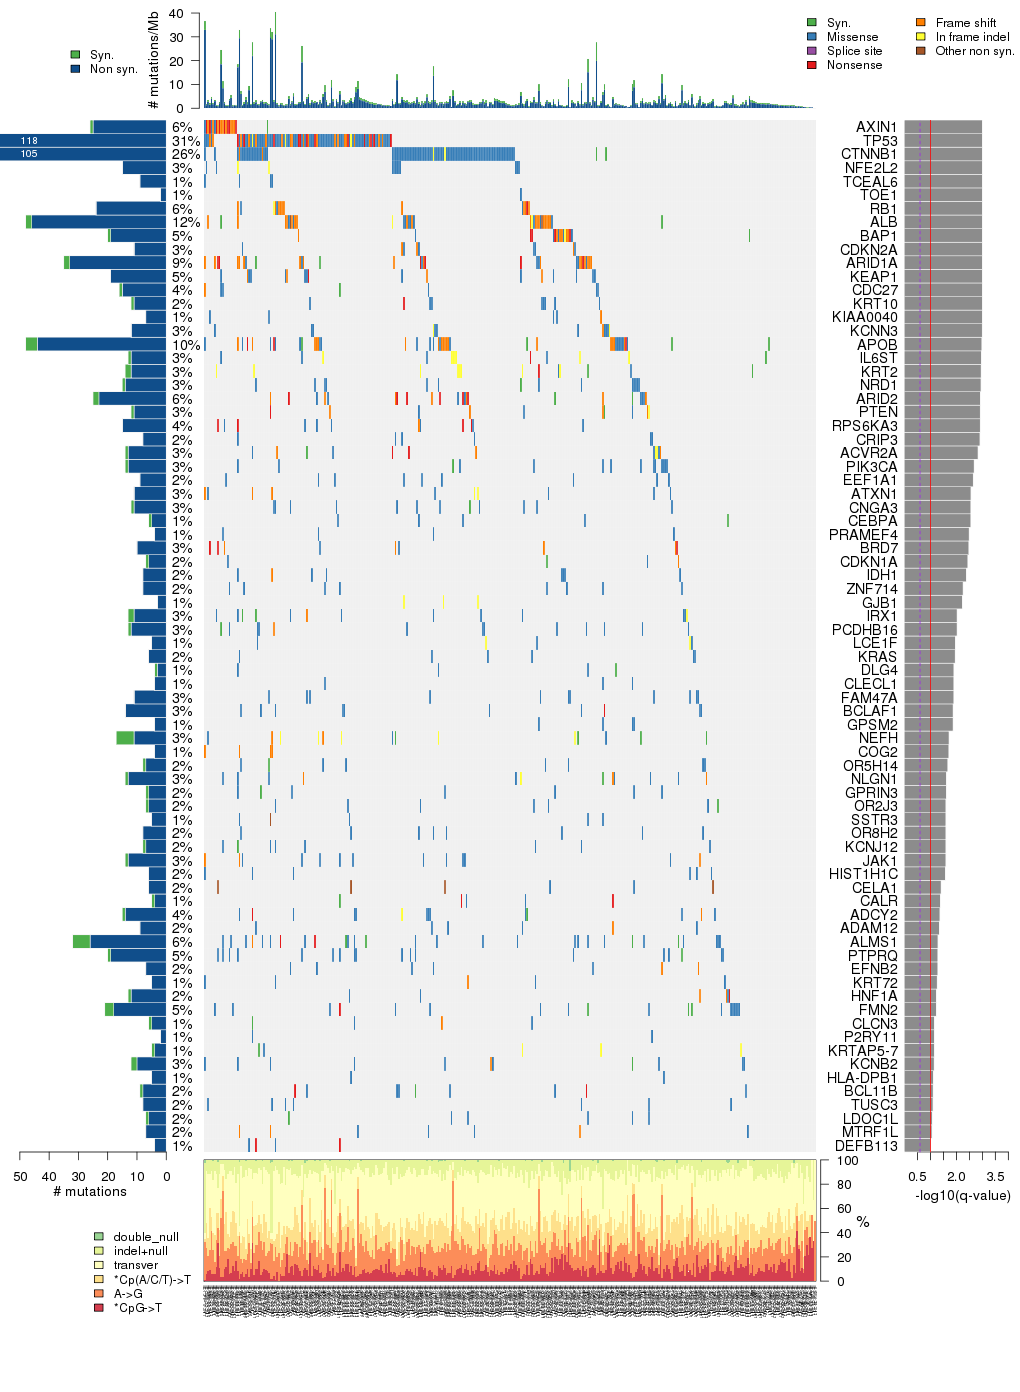
Figure 5. Get High-res Image The matrix in the center of the figure represents individual mutations in patient samples, color-coded by type of mutation, for the significantly mutated genes. The rate of synonymous and non-synonymous mutations is displayed at the top of the matrix. The barplot on the left of the matrix shows the number of mutations in each gene. The percentages represent the fraction of tumors with at least one mutation in the specified gene. The barplot to the right of the matrix displays the q-values for the most significantly mutated genes. The purple boxplots below the matrix (only displayed if required columns are present in the provided MAF) represent the distributions of allelic fractions observed in each sample. The plot at the bottom represents the base substitution distribution of individual samples, using the same categories that were used to calculate significance.
Column Descriptions:
-
N = number of sequenced bases in this gene across the individual set
-
n = number of (nonsilent) mutations in this gene across the individual set
-
npat = number of patients (individuals) with at least one nonsilent mutation
-
nsite = number of unique sites having a non-silent mutation
-
nsil = number of silent mutations in this gene across the individual set
-
n1 = number of nonsilent mutations of type: *CpG->T
-
n2 = number of nonsilent mutations of type: A->G
-
n3 = number of nonsilent mutations of type: *Cp(A/C/T)->T
-
n4 = number of nonsilent mutations of type: transver
-
n5 = number of nonsilent mutations of type: indel+null
-
n6 = number of nonsilent mutations of type: double_null
-
p_classic = p-value for the observed amount of nonsilent mutations being elevated in this gene
-
p_ns_s = p-value for the observed nonsilent/silent ratio being elevated in this gene
-
p_cons = p-value for enrichment of mutations at evolutionarily most-conserved sites in gene
-
p_joint = p-value for clustering + conservation
-
p = p-value (overall)
-
q = q-value, False Discovery Rate (Benjamini-Hochberg procedure)
Table 3. Get Full Table A Ranked List of Significantly Mutated Genes. Number of significant genes found: 76. Number of genes displayed: 35. Click on a gene name to display its stick figure depicting the distribution of mutations and mutation types across the chosen gene (this feature may not be available for all significant genes).
| rank | gene | description | N | n | npat | nsite | nsil | n1 | n2 | n3 | n4 | n5 | n6 | p_classic | p_ns_s | p_clust | p_cons | p_joint | p | q |
|---|---|---|---|---|---|---|---|---|---|---|---|---|---|---|---|---|---|---|---|---|
| 1 | AXIN1 | axin 1 | 865916 | 25 | 24 | 24 | 1 | 0 | 1 | 0 | 3 | 21 | 0 | 8.6e-15 | 0.042 | 0.004 | 0.03 | 0.0016 | 5.55e-16 | 3.12e-12 |
| 2 | TP53 | tumor protein p53 | 478886 | 117 | 114 | 85 | 1 | 7 | 15 | 7 | 38 | 50 | 0 | 2.9e-15 | 9.3e-11 | 0 | 0.00028 | 0 | <1.00e-15 | <3.12e-12 |
| 3 | CTNNB1 | catenin (cadherin-associated protein), beta 1, 88kDa | 891774 | 102 | 96 | 27 | 3 | 0 | 30 | 18 | 50 | 4 | 0 | 3.2e-15 | 1.3e-10 | 0 | 0.0012 | 0 | <1.00e-15 | <3.12e-12 |
| 4 | NFE2L2 | nuclear factor (erythroid-derived 2)-like 2 | 679322 | 15 | 13 | 12 | 0 | 0 | 3 | 1 | 9 | 2 | 0 | 2.6e-08 | 0.043 | 0 | 0.00054 | 0 | <1.00e-15 | <3.12e-12 |
| 5 | TCEAL6 | transcription elongation factor A (SII)-like 6 | 206636 | 9 | 4 | 4 | 0 | 0 | 3 | 4 | 2 | 0 | 0 | 0.0015 | 0.048 | 0 | 0.048 | 0 | <1.00e-15 | <3.12e-12 |
| 6 | TOE1 | target of EGR1, member 1 (nuclear) | 580488 | 2 | 2 | 2 | 0 | 0 | 0 | 1 | 0 | 1 | 0 | 0.44 | 0.46 | 1 | 0 | 0 | <1.00e-15 | <3.12e-12 |
| 7 | RB1 | retinoblastoma 1 (including osteosarcoma) | 1020253 | 24 | 21 | 23 | 0 | 0 | 0 | 0 | 5 | 18 | 1 | 2.6e-14 | 0.044 | 0.05 | 0.68 | 0.087 | 7.76e-14 | 2.07e-10 |
| 8 | ALB | albumin | 699495 | 46 | 43 | 40 | 2 | 0 | 3 | 2 | 7 | 28 | 6 | 5.8e-15 | 0.16 | 0.54 | 0.89 | 0.73 | 1.44e-13 | 3.37e-10 |
| 9 | BAP1 | BRCA1 associated protein-1 (ubiquitin carboxy-terminal hydrolase) | 830020 | 19 | 19 | 19 | 1 | 0 | 0 | 0 | 5 | 13 | 1 | 7.9e-14 | 0.17 | 0.31 | 0.1 | 0.2 | 5.07e-13 | 1.05e-09 |
| 10 | CDKN2A | cyclin-dependent kinase inhibitor 2A (melanoma, p16, inhibits CDK4) | 261198 | 11 | 11 | 11 | 0 | 0 | 1 | 0 | 5 | 5 | 0 | 4.8e-10 | 0.16 | 0.07 | 0.000011 | 0.000064 | 9.93e-13 | 1.86e-09 |
| 11 | ARID1A | AT rich interactive domain 1A (SWI-like) | 2224562 | 33 | 32 | 31 | 2 | 0 | 2 | 1 | 5 | 24 | 1 | 4e-13 | 0.12 | 0.96 | 0.7 | 1 | 1.17e-11 | 1.99e-08 |
| 12 | KEAP1 | kelch-like ECH-associated protein 1 | 686886 | 19 | 17 | 19 | 0 | 3 | 4 | 0 | 7 | 5 | 0 | 1.1e-11 | 0.03 | 0.14 | 0.28 | 0.22 | 6.79e-11 | 1.06e-07 |
| 13 | CDC27 | cell division cycle 27 homolog (S. cerevisiae) | 879104 | 15 | 15 | 8 | 1 | 1 | 1 | 1 | 2 | 10 | 0 | 9.4e-09 | 0.43 | 0.00063 | 0.91 | 0.0017 | 4.15e-10 | 5.97e-07 |
| 14 | KRT10 | keratin 10 (epidermolytic hyperkeratosis; keratosis palmaris et plantaris) | 569280 | 11 | 9 | 4 | 1 | 7 | 0 | 0 | 3 | 1 | 0 | 4.4e-06 | 0.083 | 9.4e-06 | 0.09 | 0.000013 | 1.38e-09 | 1.85e-06 |
| 15 | KIAA0040 | KIAA0040 | 113088 | 7 | 5 | 4 | 0 | 0 | 0 | 3 | 3 | 1 | 0 | 9.4e-07 | 0.092 | 0.000029 | 0.92 | 0.0001 | 2.32e-09 | 2.89e-06 |
| 16 | KCNN3 | potassium intermediate/small conductance calcium-activated channel, subfamily N, member 3 | 824020 | 12 | 12 | 9 | 0 | 0 | 1 | 0 | 8 | 3 | 0 | 6.2e-06 | 0.17 | 0.000014 | 0.99 | 0.000046 | 6.55e-09 | 7.66e-06 |
| 17 | APOB | apolipoprotein B (including Ag(x) antigen) | 5087988 | 44 | 39 | 42 | 4 | 1 | 8 | 3 | 10 | 22 | 0 | 1.2e-08 | 0.1 | 0.19 | 0.26 | 0.21 | 5.09e-08 | 5.60e-05 |
| 18 | IL6ST | interleukin 6 signal transducer (gp130, oncostatin M receptor) | 1045882 | 12 | 12 | 12 | 1 | 0 | 2 | 0 | 2 | 8 | 0 | 0.000012 | 0.46 | 0.00016 | 0.39 | 0.00034 | 8.04e-08 | 8.35e-05 |
| 19 | KRT2 | keratin 2 (epidermal ichthyosis bullosa of Siemens) | 699702 | 12 | 12 | 11 | 2 | 1 | 0 | 0 | 1 | 10 | 0 | 4.3e-06 | 0.74 | 0.00051 | 0.36 | 0.0014 | 1.17e-07 | 0.000115 |
| 20 | NRD1 | nardilysin (N-arginine dibasic convertase) | 1406365 | 14 | 13 | 7 | 1 | 0 | 3 | 0 | 11 | 0 | 0 | 0.00011 | 0.2 | 0.000014 | 1 | 0.000064 | 1.44e-07 | 0.000134 |
| 21 | ARID2 | AT rich interactive domain 2 (ARID, RFX-like) | 2069493 | 23 | 22 | 23 | 2 | 0 | 1 | 1 | 5 | 14 | 2 | 1.4e-08 | 0.16 | 0.53 | 0.84 | 0.79 | 2.07e-07 | 0.000185 |
| 22 | PTEN | phosphatase and tensin homolog (mutated in multiple advanced cancers 1) | 454915 | 11 | 11 | 11 | 1 | 0 | 0 | 1 | 2 | 8 | 0 | 2.8e-08 | 0.62 | 0.27 | 0.72 | 0.46 | 2.48e-07 | 0.000203 |
| 23 | RPS6KA3 | ribosomal protein S6 kinase, 90kDa, polypeptide 3 | 828758 | 15 | 14 | 14 | 0 | 0 | 2 | 1 | 5 | 7 | 0 | 1.8e-08 | 0.034 | 0.72 | 0.53 | 0.72 | 2.49e-07 | 0.000203 |
| 24 | CRIP3 | cysteine-rich protein 3 | 239794 | 8 | 6 | 5 | 0 | 1 | 0 | 3 | 4 | 0 | 0 | 0.000025 | 0.079 | 0.00033 | 0.18 | 0.00066 | 3.13e-07 | 0.000244 |
| 25 | ACVR2A | activin A receptor, type IIA | 583880 | 13 | 11 | 13 | 1 | 0 | 2 | 0 | 2 | 8 | 1 | 3.5e-08 | 0.32 | 0.54 | 0.9 | 1 | 6.31e-07 | 0.000472 |
| 26 | PIK3CA | phosphoinositide-3-kinase, catalytic, alpha polypeptide | 1217832 | 13 | 13 | 8 | 1 | 1 | 3 | 3 | 6 | 0 | 0 | 0.000013 | 0.12 | 0.06 | 0.0099 | 0.0068 | 1.49e-06 | 0.00107 |
| 27 | EEF1A1 | eukaryotic translation elongation factor 1 alpha 1 | 421755 | 9 | 9 | 7 | 0 | 0 | 1 | 4 | 4 | 0 | 0 | 2.7e-07 | 0.066 | 0.41 | 0.15 | 0.39 | 1.79e-06 | 0.00124 |
| 28 | ATXN1 | ataxin 1 | 840496 | 11 | 10 | 8 | 0 | 1 | 0 | 0 | 5 | 5 | 0 | 0.0009 | 0.19 | 0.000047 | 1 | 0.00018 | 2.64e-06 | 0.00176 |
| 29 | CNGA3 | cyclic nucleotide gated channel alpha 3 | 781898 | 11 | 11 | 9 | 1 | 3 | 2 | 2 | 4 | 0 | 0 | 5.3e-06 | 0.12 | 0.16 | 0.0095 | 0.033 | 2.86e-06 | 0.00184 |
| 30 | CEBPA | CCAAT/enhancer binding protein (C/EBP), alpha | 262947 | 5 | 4 | 4 | 1 | 0 | 1 | 1 | 3 | 0 | 0 | 0.0036 | 0.5 | 8.8e-06 | 0.96 | 0.000051 | 2.97e-06 | 0.00185 |
| 31 | PRAMEF4 | PRAME family member 4 | 370377 | 4 | 4 | 1 | 0 | 0 | 0 | 0 | 4 | 0 | 0 | 0.016 | 0.49 | 1.4e-06 | 0.32 | 0.000014 | 3.67e-06 | 0.00222 |
| 32 | BRD7 | bromodomain containing 7 | 733628 | 10 | 10 | 10 | 0 | 0 | 1 | 0 | 1 | 8 | 0 | 3.5e-06 | 0.32 | 0.032 | 0.93 | 0.072 | 4.11e-06 | 0.00240 |
| 33 | CDKN1A | cyclin-dependent kinase inhibitor 1A (p21, Cip1) | 174836 | 6 | 6 | 6 | 1 | 0 | 0 | 0 | 4 | 2 | 0 | 5.4e-06 | 0.56 | 0.59 | 0.013 | 0.055 | 4.76e-06 | 0.00270 |
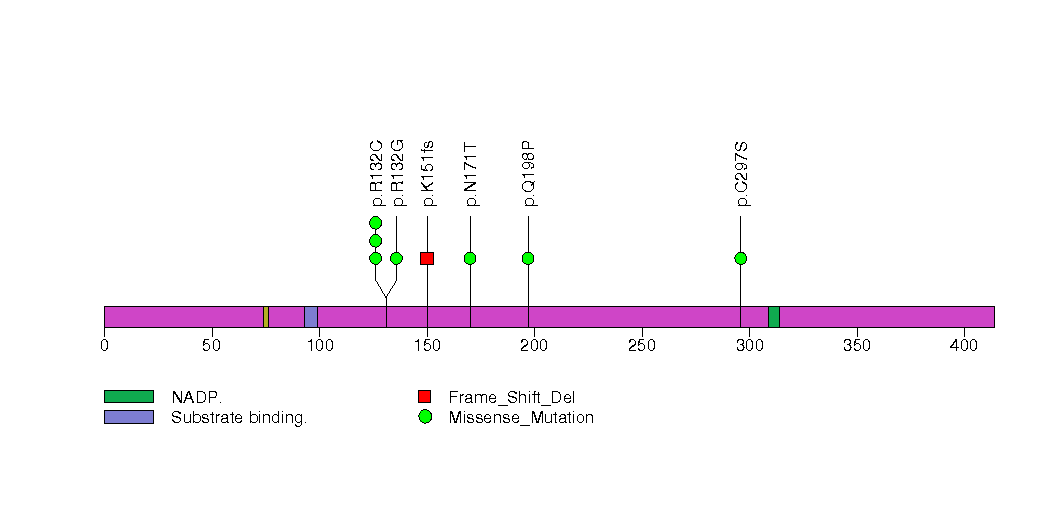
| 34 | IDH1 | isocitrate dehydrogenase 1 (NADP+), soluble | 473849 | 8 | 8 | 5 | 0 | 3 | 0 | 0 | 4 | 1 | 0 | 3e-05 | 0.18 | 0.006 | 0.85 | 0.012 | 5.64e-06 | 0.00311 |
| 35 | ZNF714 | zinc finger protein 714 | 550670 | 8 | 8 | 7 | 0 | 0 | 2 | 2 | 4 | 0 | 0 | 0.000078 | 0.12 | 0.0035 | 0.93 | 0.007 | 8.44e-06 | 0.00451 |
Figure S1. This figure depicts the distribution of mutations and mutation types across the TP53 significant gene.
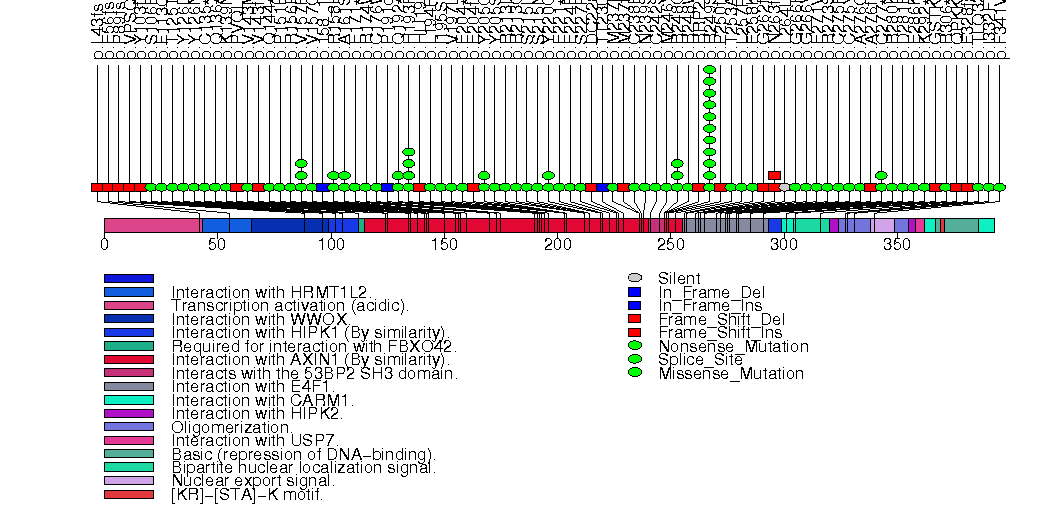
Figure S2. This figure depicts the distribution of mutations and mutation types across the CTNNB1 significant gene.
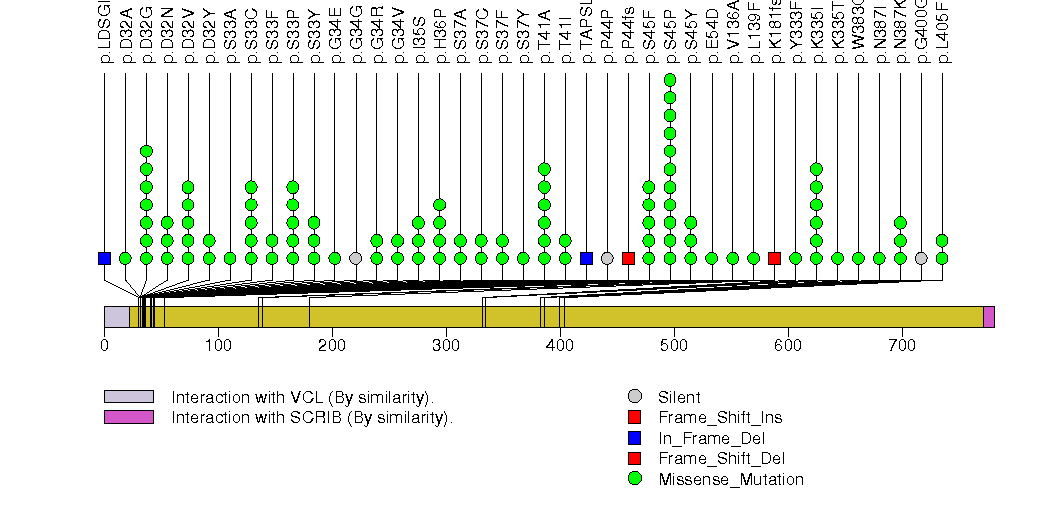
Figure S3. This figure depicts the distribution of mutations and mutation types across the NFE2L2 significant gene.
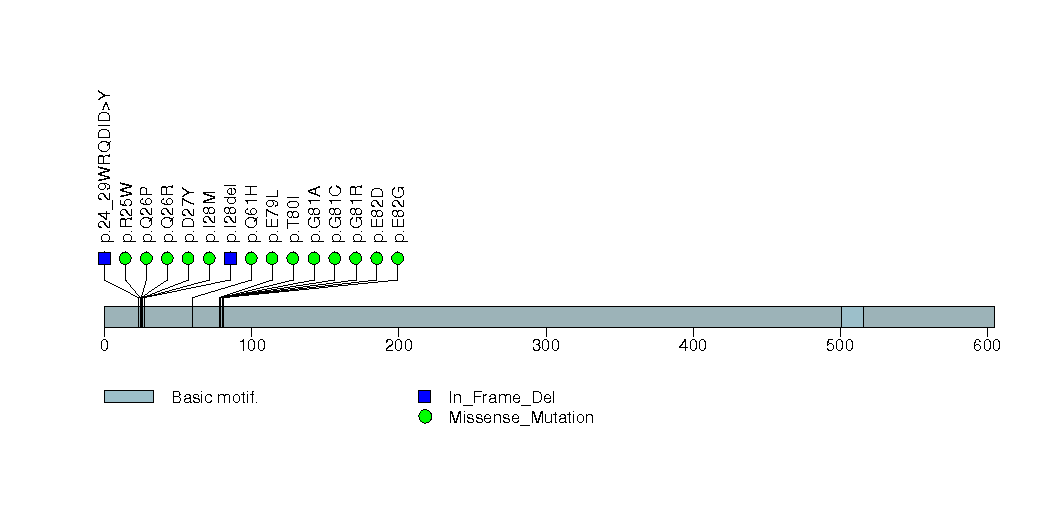
Figure S4. This figure depicts the distribution of mutations and mutation types across the TCEAL6 significant gene.
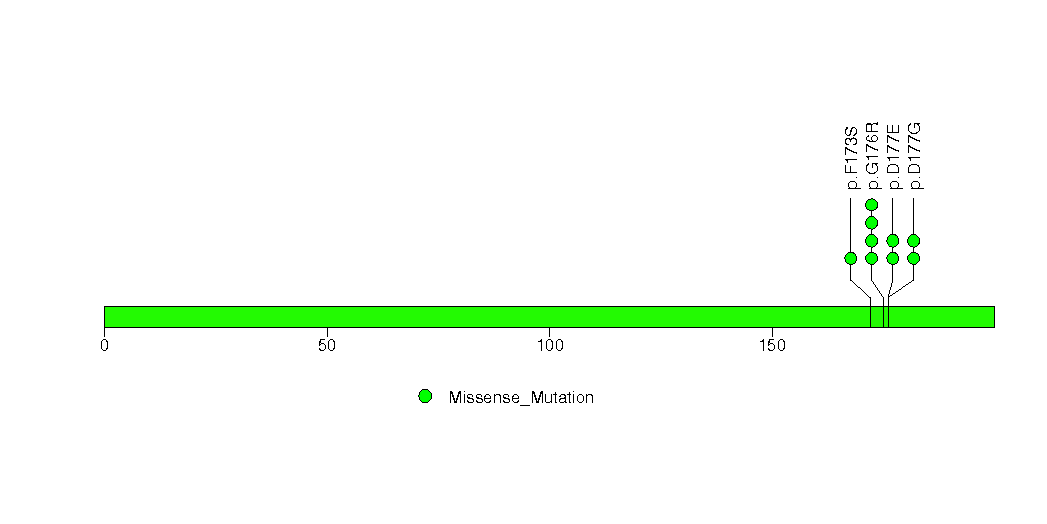
Figure S5. This figure depicts the distribution of mutations and mutation types across the TOE1 significant gene.
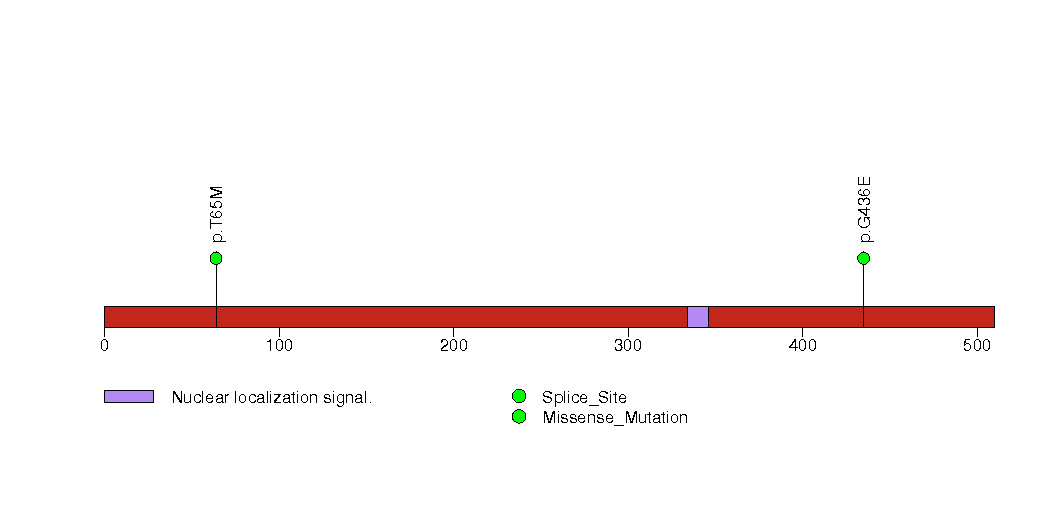
Figure S6. This figure depicts the distribution of mutations and mutation types across the RB1 significant gene.
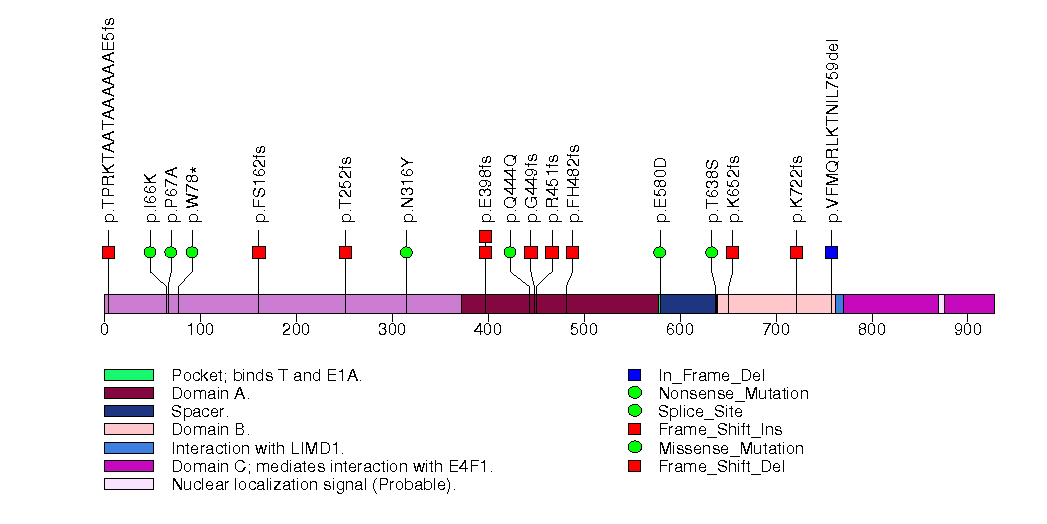
Figure S7. This figure depicts the distribution of mutations and mutation types across the ALB significant gene.
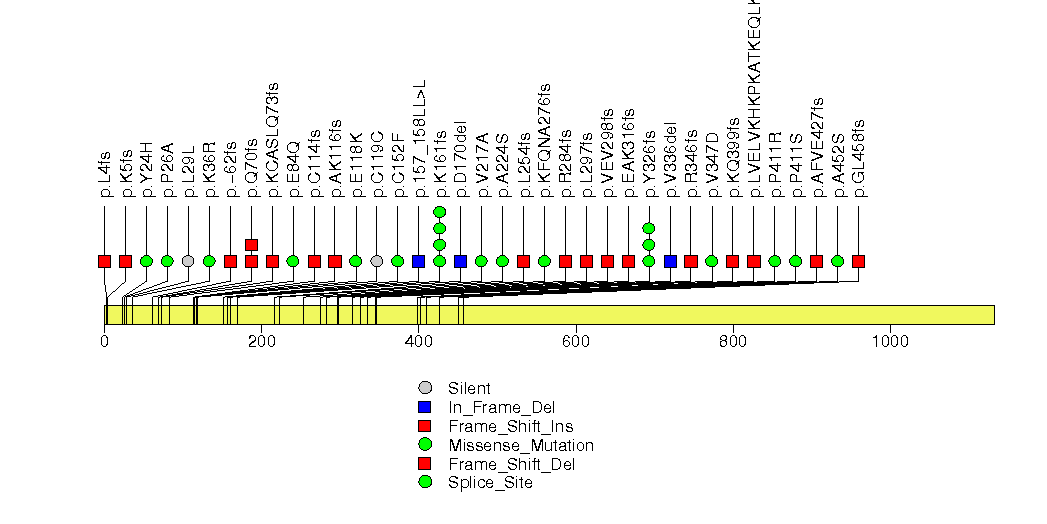
Figure S8. This figure depicts the distribution of mutations and mutation types across the BAP1 significant gene.
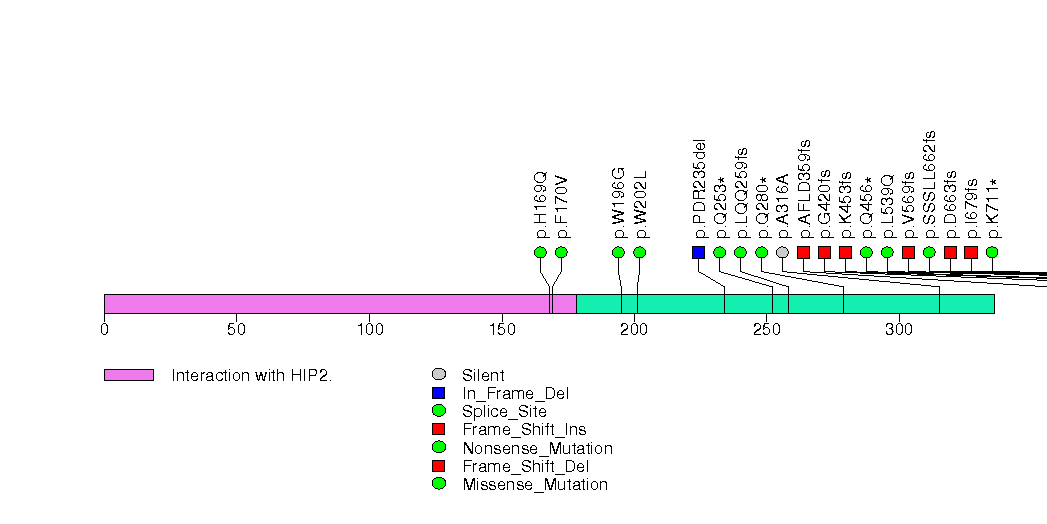
Figure S9. This figure depicts the distribution of mutations and mutation types across the CDKN2A significant gene.
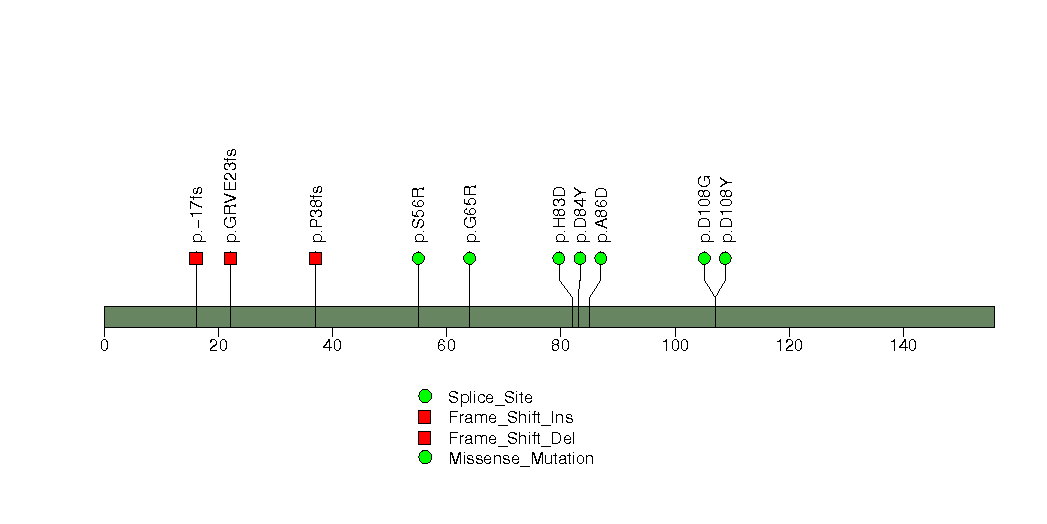
Figure S10. This figure depicts the distribution of mutations and mutation types across the ARID1A significant gene.
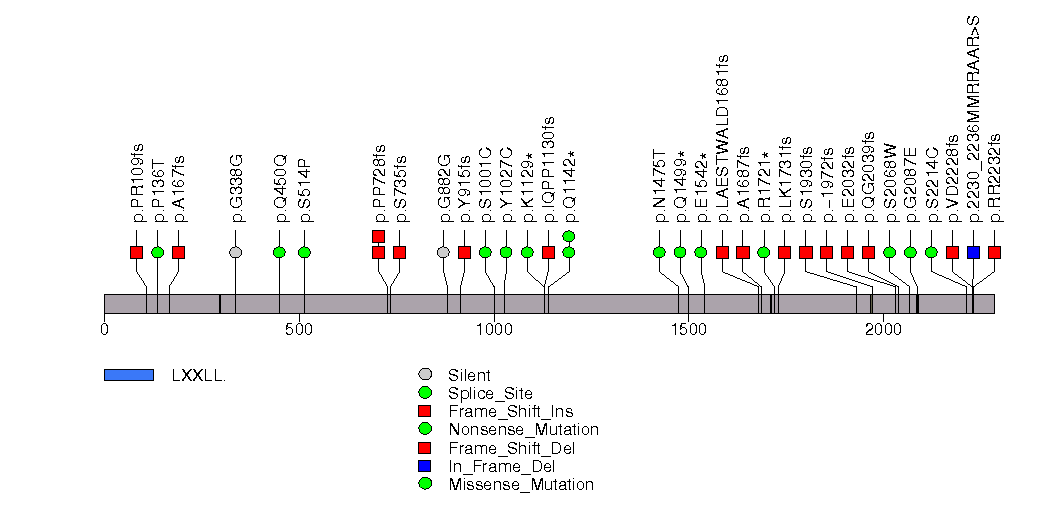
Figure S11. This figure depicts the distribution of mutations and mutation types across the KEAP1 significant gene.
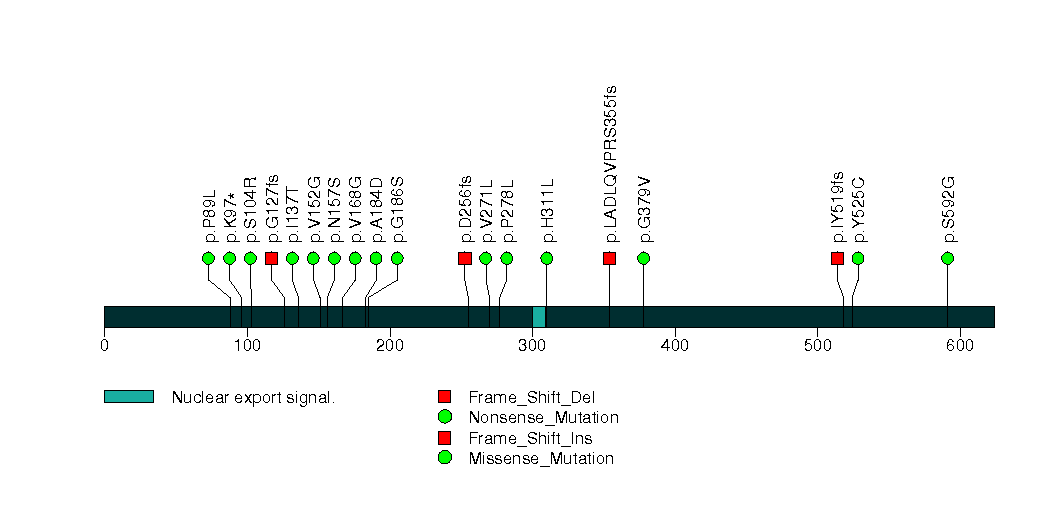
Figure S12. This figure depicts the distribution of mutations and mutation types across the CDC27 significant gene.
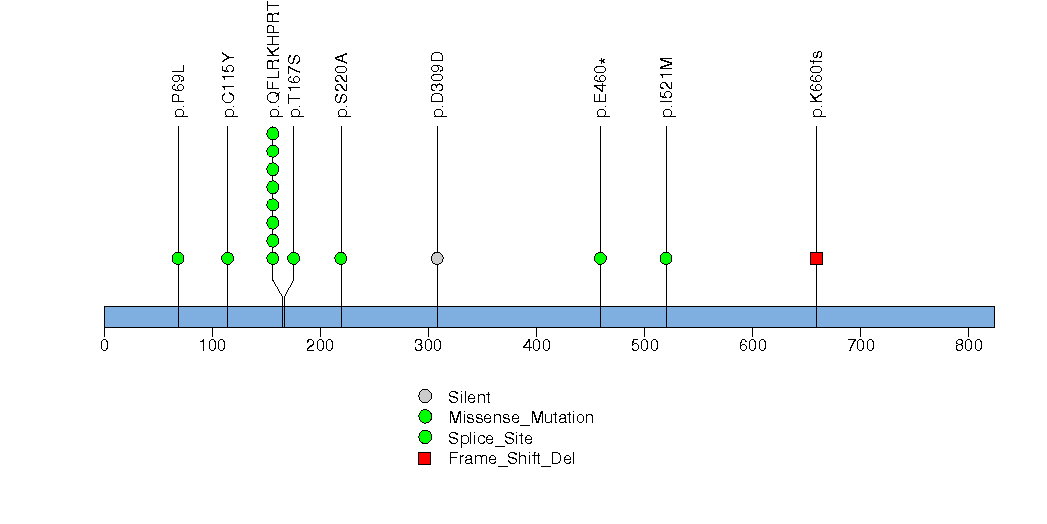
Figure S13. This figure depicts the distribution of mutations and mutation types across the KRT10 significant gene.

Figure S14. This figure depicts the distribution of mutations and mutation types across the KIAA0040 significant gene.
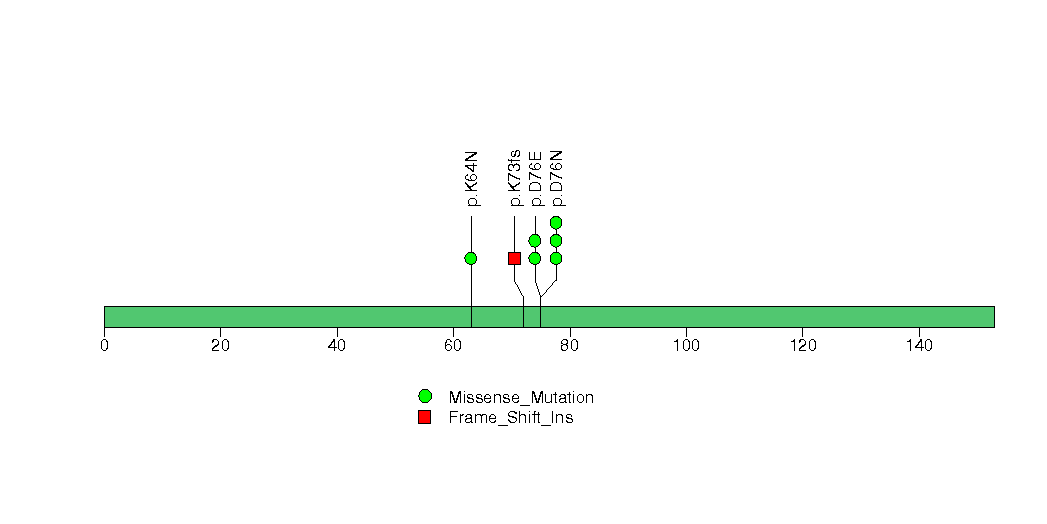
Figure S15. This figure depicts the distribution of mutations and mutation types across the KCNN3 significant gene.
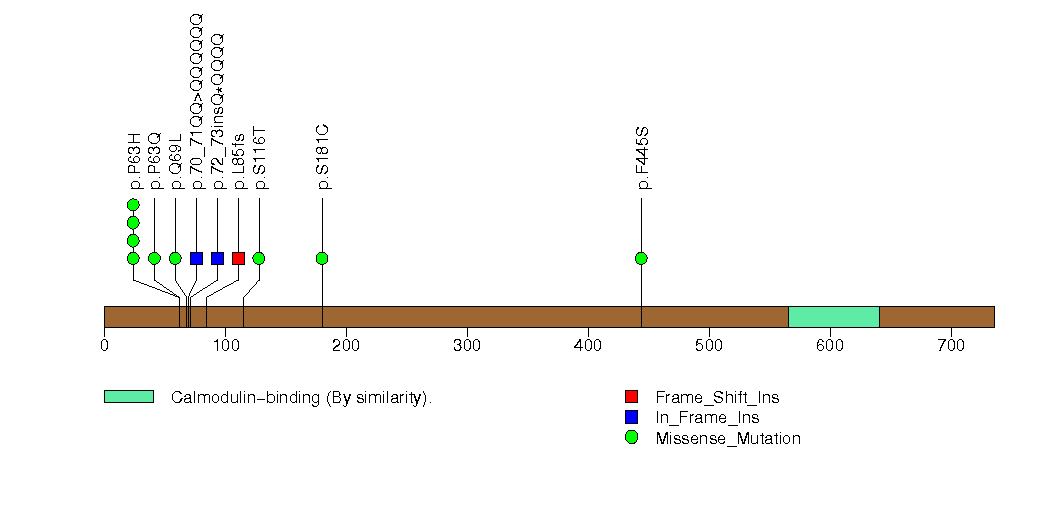
Figure S16. This figure depicts the distribution of mutations and mutation types across the APOB significant gene.

Figure S17. This figure depicts the distribution of mutations and mutation types across the IL6ST significant gene.
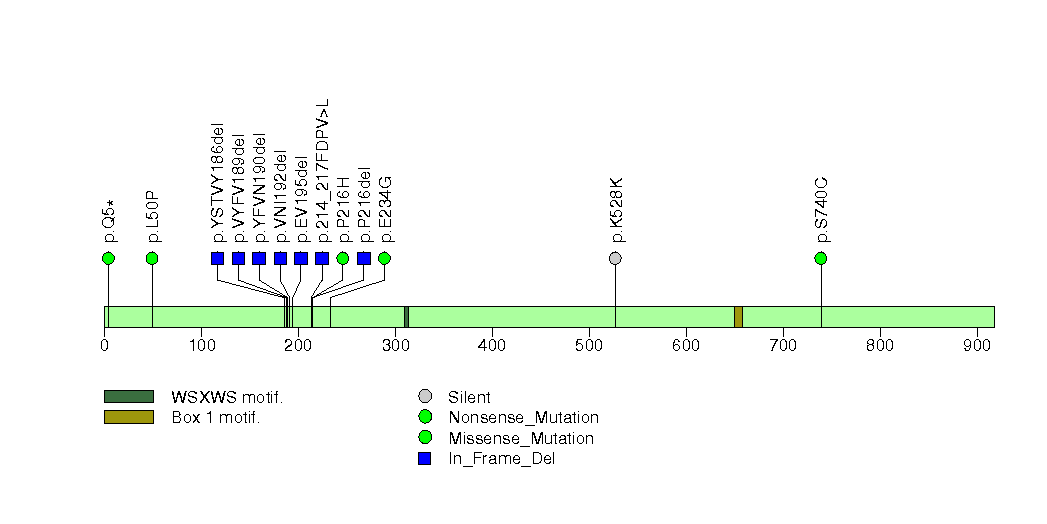
Figure S18. This figure depicts the distribution of mutations and mutation types across the KRT2 significant gene.
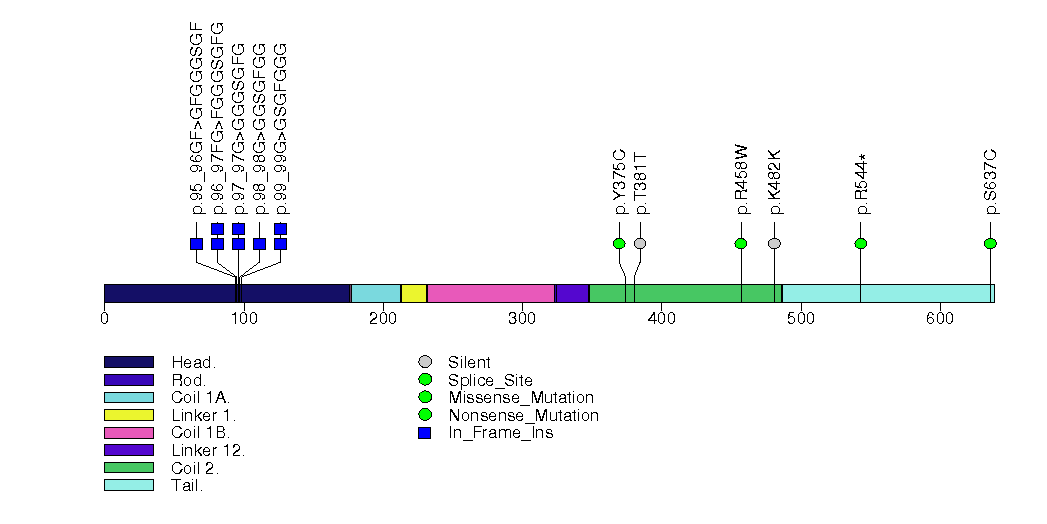
Figure S19. This figure depicts the distribution of mutations and mutation types across the NRD1 significant gene.
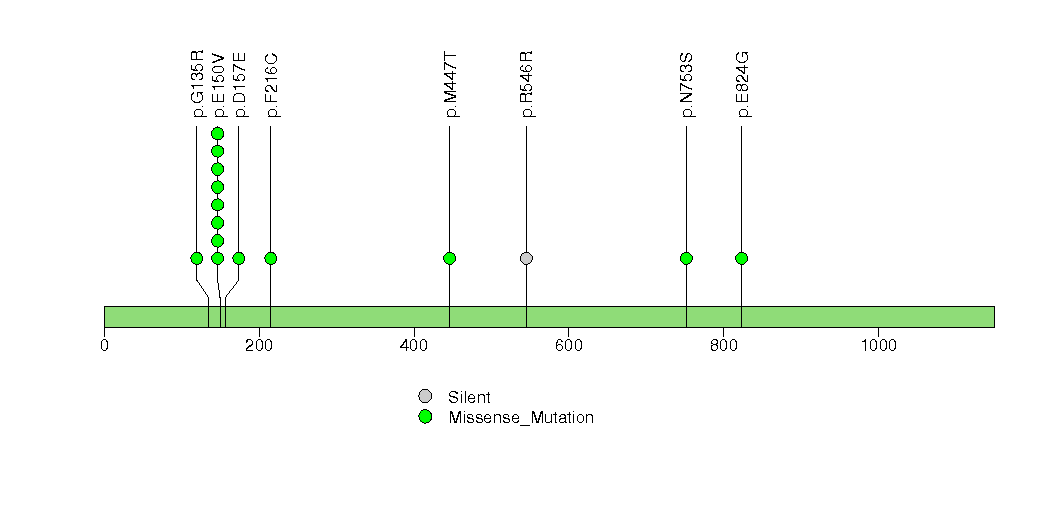
Figure S20. This figure depicts the distribution of mutations and mutation types across the ARID2 significant gene.
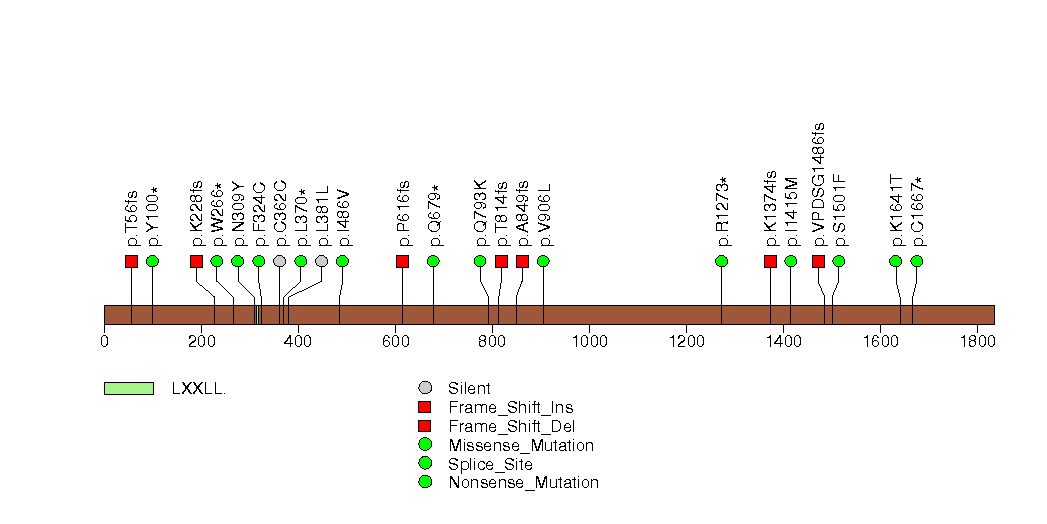
Figure S21. This figure depicts the distribution of mutations and mutation types across the PTEN significant gene.
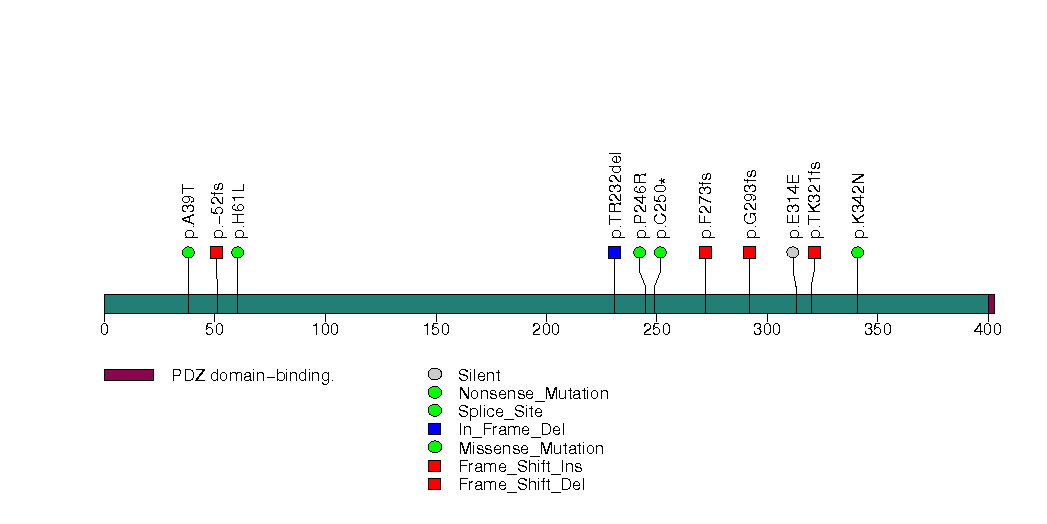
Figure S22. This figure depicts the distribution of mutations and mutation types across the RPS6KA3 significant gene.
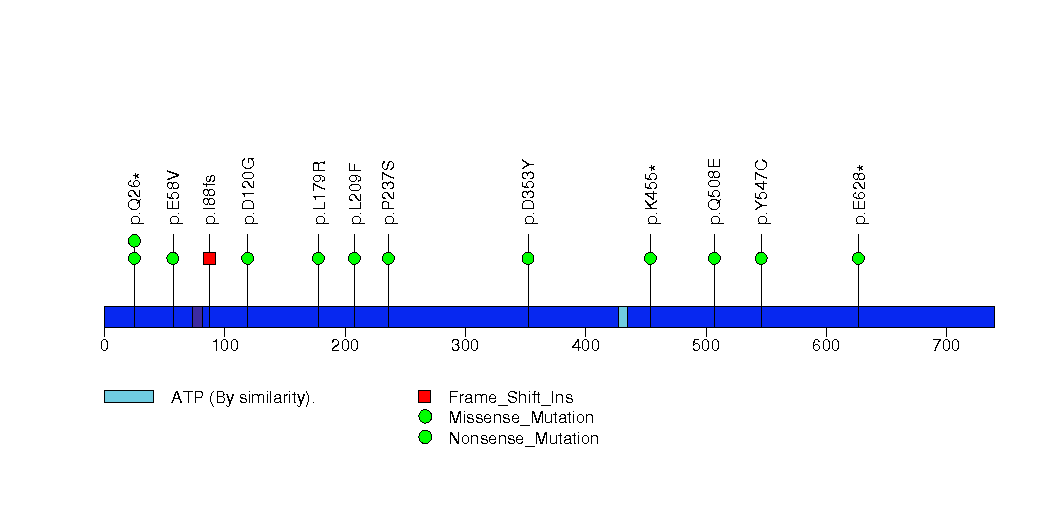
Figure S23. This figure depicts the distribution of mutations and mutation types across the CRIP3 significant gene.
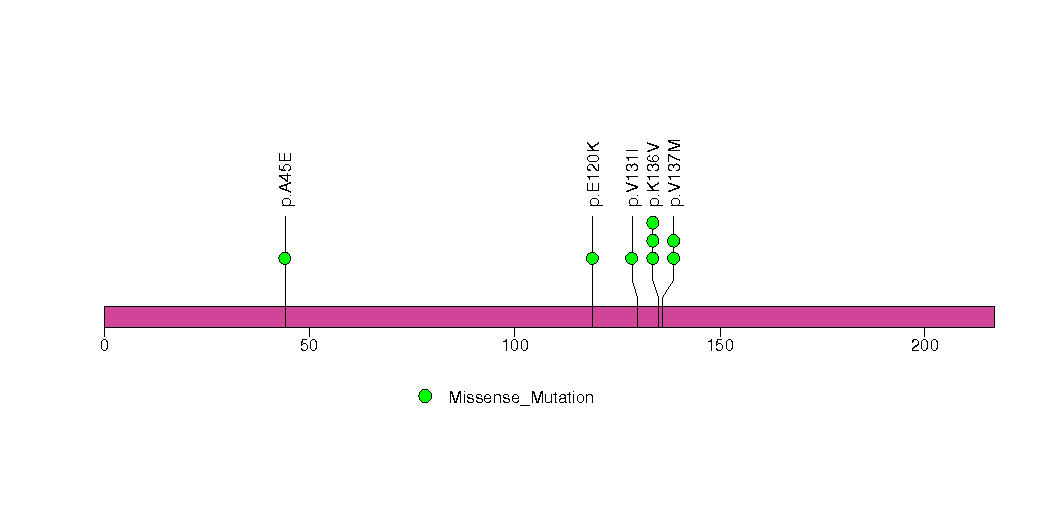
Figure S24. This figure depicts the distribution of mutations and mutation types across the ACVR2A significant gene.
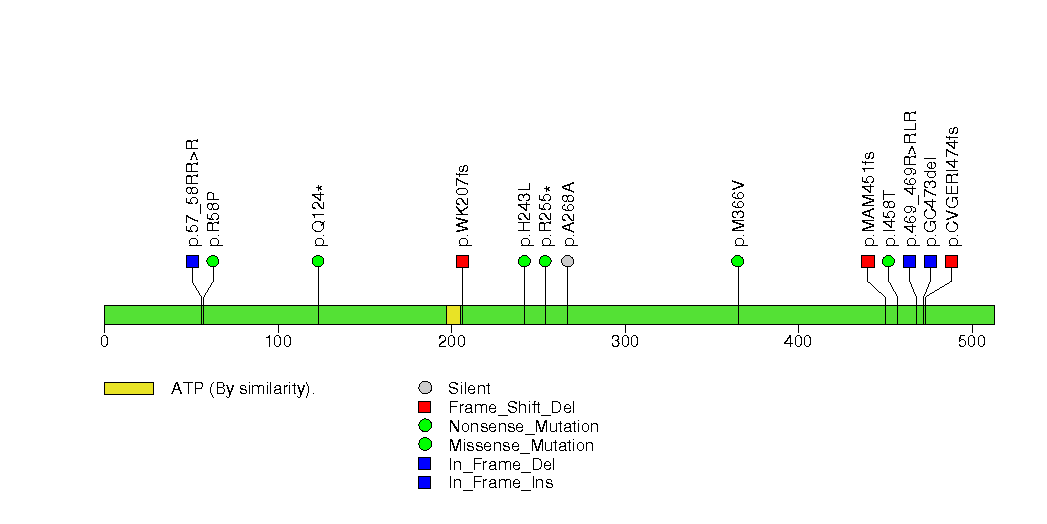
Figure S25. This figure depicts the distribution of mutations and mutation types across the PIK3CA significant gene.
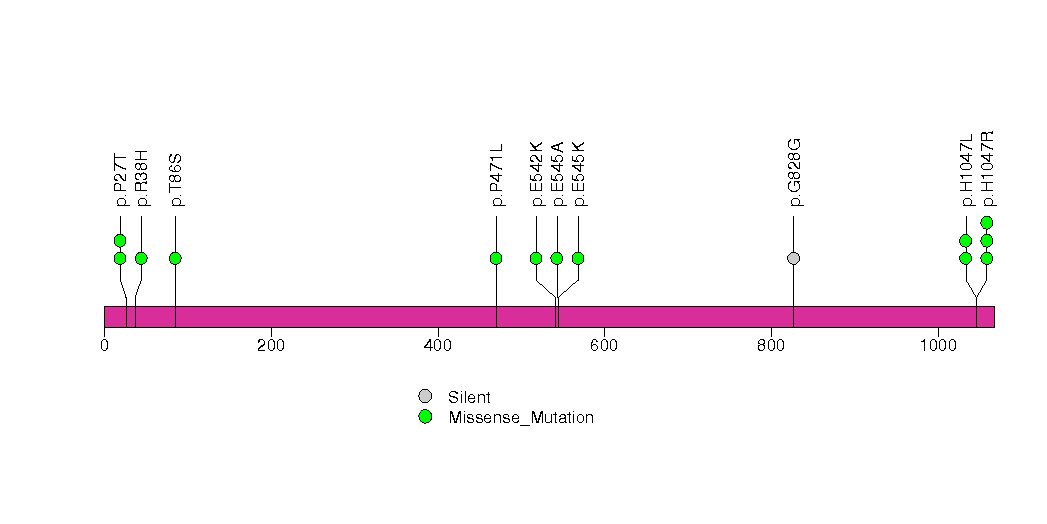
Figure S26. This figure depicts the distribution of mutations and mutation types across the EEF1A1 significant gene.
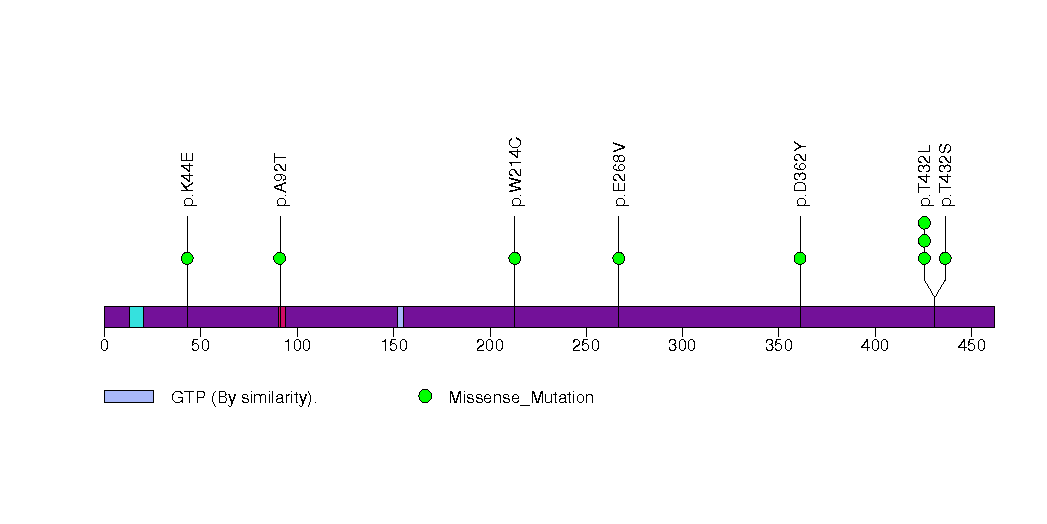
Figure S27. This figure depicts the distribution of mutations and mutation types across the ATXN1 significant gene.
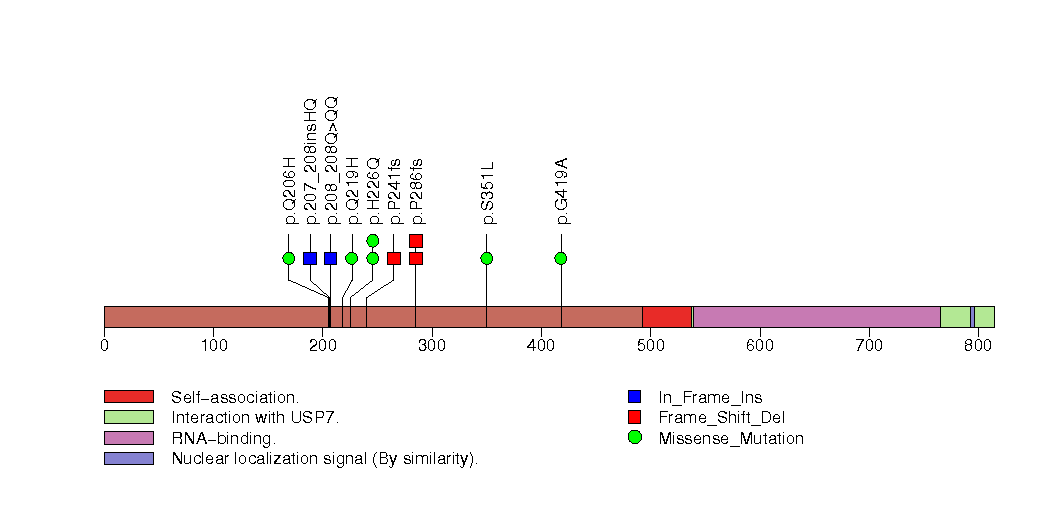
Figure S28. This figure depicts the distribution of mutations and mutation types across the CNGA3 significant gene.
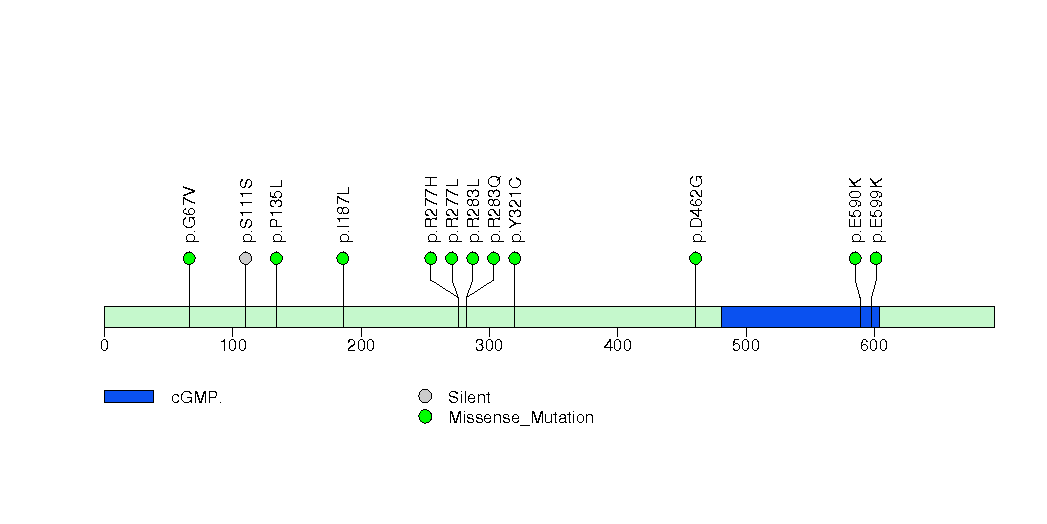
Figure S29. This figure depicts the distribution of mutations and mutation types across the CEBPA significant gene.
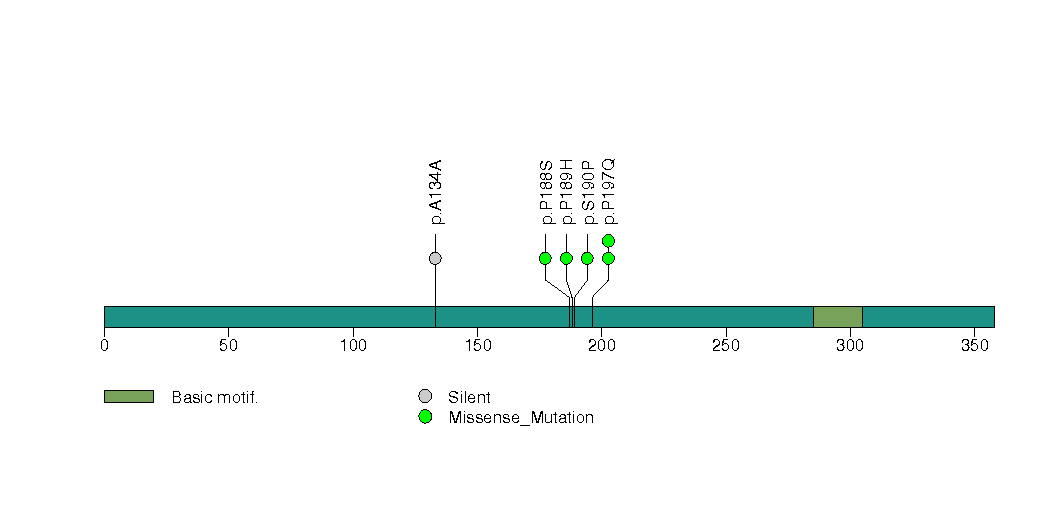
Figure S30. This figure depicts the distribution of mutations and mutation types across the PRAMEF4 significant gene.
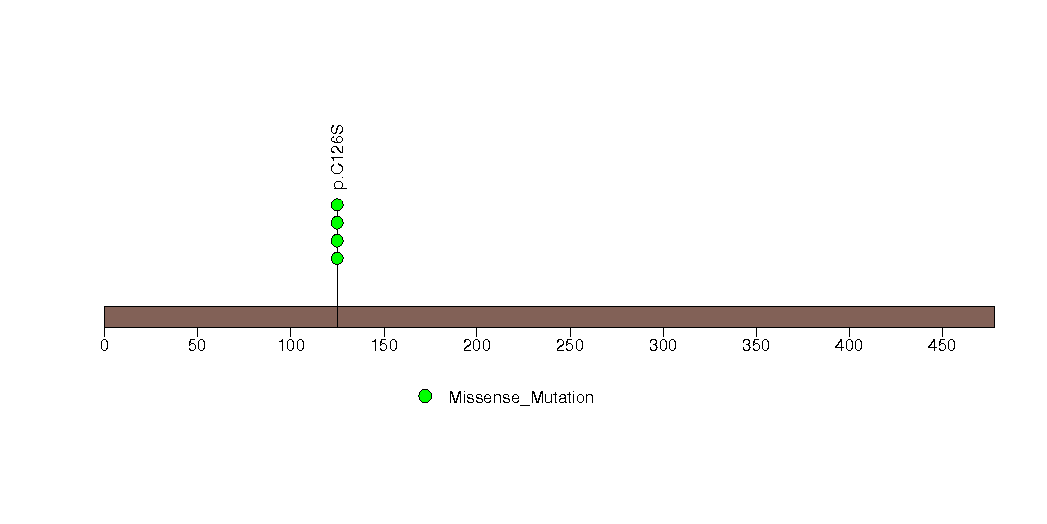
Figure S31. This figure depicts the distribution of mutations and mutation types across the BRD7 significant gene.
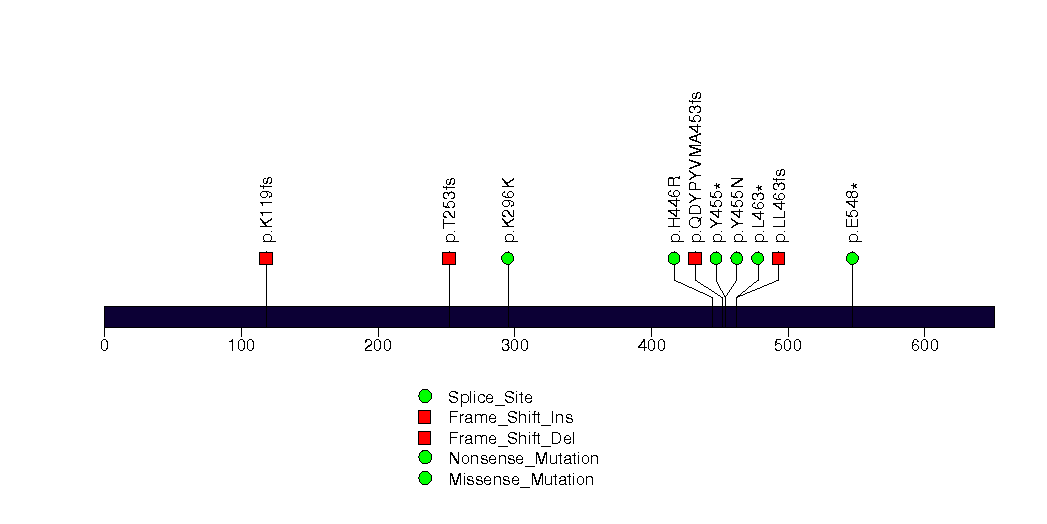
Figure S32. This figure depicts the distribution of mutations and mutation types across the CDKN1A significant gene.
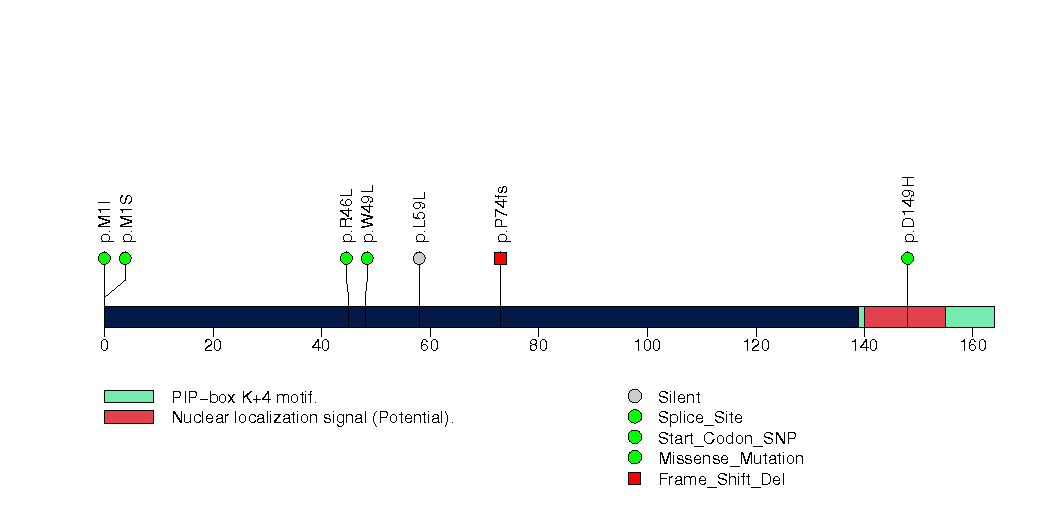
Figure S33. This figure depicts the distribution of mutations and mutation types across the IDH1 significant gene.
In this analysis, COSMIC is used as a filter to increase power by restricting the territory of each gene. Cosmic version: v48.
Table 4. Get Full Table Significantly mutated genes (COSMIC territory only). To access the database please go to: COSMIC. Number of significant genes found: 14. Number of genes displayed: 10
| rank | gene | description | n | cos | n_cos | N_cos | cos_ev | p | q |
|---|---|---|---|---|---|---|---|---|---|
| 1 | CTNNB1 | catenin (cadherin-associated protein), beta 1, 88kDa | 102 | 138 | 91 | 51336 | 32233 | 0 | 0 |
| 2 | TP53 | tumor protein p53 | 117 | 356 | 106 | 132432 | 16489 | 0 | 0 |
| 3 | RB1 | retinoblastoma 1 (including osteosarcoma) | 24 | 267 | 15 | 99324 | 28 | 0 | 0 |
| 4 | PIK3CA | phosphoinositide-3-kinase, catalytic, alpha polypeptide | 13 | 220 | 9 | 81840 | 6579 | 9.9e-12 | 1.1e-08 |
| 5 | CDKN2A | cyclin-dependent kinase inhibitor 2A (melanoma, p16, inhibits CDK4) | 11 | 332 | 10 | 123504 | 197 | 1.4e-11 | 1.3e-08 |
| 6 | IDH1 | isocitrate dehydrogenase 1 (NADP+), soluble | 8 | 5 | 4 | 1860 | 5968 | 4.9e-11 | 3.7e-08 |
| 7 | GNAS | GNAS complex locus | 10 | 7 | 4 | 2604 | 840 | 1.9e-10 | 1.2e-07 |
| 8 | PTEN | phosphatase and tensin homolog (mutated in multiple advanced cancers 1) | 11 | 767 | 11 | 285324 | 195 | 3.4e-09 | 1.9e-06 |
| 9 | KRAS | v-Ki-ras2 Kirsten rat sarcoma viral oncogene homolog | 6 | 52 | 5 | 19344 | 45832 | 6.6e-09 | 3.3e-06 |
| 10 | RPTOR | regulatory associated protein of MTOR, complex 1 | 4 | 4 | 2 | 1488 | 2 | 0.000011 | 0.005 |
Note:
n - number of (nonsilent) mutations in this gene across the individual set.
cos = number of unique mutated sites in this gene in COSMIC
n_cos = overlap between n and cos.
N_cos = number of individuals times cos.
cos_ev = total evidence: number of reports in COSMIC for mutations seen in this gene.
p = p-value for seeing the observed amount of overlap in this gene)
q = q-value, False Discovery Rate (Benjamini-Hochberg procedure)
Table 5. Get Full Table A Ranked List of Significantly Mutated Genesets. (Source: MSigDB GSEA Cannonical Pathway Set).Number of significant genesets found: 45. Number of genesets displayed: 10
| rank | geneset | description | genes | N_genes | mut_tally | N | n | npat | nsite | nsil | n1 | n2 | n3 | n4 | n5 | n6 | p_ns_s | p | q |
|---|---|---|---|---|---|---|---|---|---|---|---|---|---|---|---|---|---|---|---|
| 1 | ARFPATHWAY | Cyclin-dependent kinase inhibitor 2A is a tumor suppressor that induces G1 arrest and can activate the p53 pathway, leading to G2/M arrest. | ABL1, CDKN2A, E2F1, MDM2, MYC, PIK3CA, PIK3R1, POLR1A, POLR1B, POLR1C, POLR1D, RAC1, RB1, TBX2, TP53, TWIST1 | 16 | ABL1(2), CDKN2A(11), E2F1(3), MDM2(1), MYC(2), PIK3CA(13), PIK3R1(4), POLR1A(7), POLR1B(2), POLR1C(1), RB1(24), TBX2(2), TP53(117), TWIST1(2) | 11429598 | 191 | 151 | 153 | 6 | 11 | 22 | 10 | 63 | 84 | 1 | 8.1e-12 | <1.00e-15 | <1.14e-13 |
| 2 | WNTPATHWAY | The Wnt glycoprotein binds to membrane-bound receptors such as Frizzled to activate a number of signaling pathways, including that of beta-catenin. | APC, AXIN1, BTRC, CCND1, CREBBP, CSNK1A1, CSNK1D, CSNK2A1, CTBP1, CTNNB1, DVL1, FRAT1, FZD1, GSK3B, HDAC1, MADH4, MAP3K7, MAP3K7IP1, MYC, NLK, PPARD, PPP2CA, TCF1, TLE1, WIF1, WNT1 | 23 | APC(12), AXIN1(25), BTRC(5), CCND1(1), CREBBP(6), CSNK1A1(2), CSNK2A1(2), CTBP1(1), CTNNB1(102), DVL1(3), FZD1(2), GSK3B(3), MAP3K7(3), MYC(2), NLK(2), PPP2CA(2), TLE1(6), WIF1(6), WNT1(2) | 17083595 | 187 | 151 | 110 | 14 | 2 | 47 | 21 | 75 | 41 | 1 | 3e-09 | <1.00e-15 | <1.14e-13 |
| 3 | CHEMICALPATHWAY | DNA damage promotes Bid cleavage, which stimulates mitochondrial cytochrome c release and consequent caspase activation, resulting in apoptosis. | ADPRT, AKT1, APAF1, ATM, BAD, BAX, BCL2, BCL2L1, BID, CASP3, CASP6, CASP7, CASP9, CYCS, EIF2S1, PRKCA, PRKCB1, PTK2, PXN, STAT1, TLN1, TP53 | 20 | AKT1(2), APAF1(9), ATM(9), BAX(3), BCL2(1), CASP3(3), CASP6(2), CASP9(1), PRKCA(1), PTK2(9), PXN(2), STAT1(5), TLN1(10), TP53(117) | 15287002 | 174 | 142 | 141 | 7 | 12 | 33 | 10 | 57 | 62 | 0 | 4.6e-11 | <1.00e-15 | <1.14e-13 |
| 4 | PMLPATHWAY | Ring-shaped PML nuclear bodies regulate transcription and are required co-activators in p53- and DAXX-mediated apoptosis. | CREBBP, DAXX, HRAS, PAX3, PML, PRAM-1, RARA, RB1, SIRT1, SP100, TNF, TNFRSF1A, TNFRSF1B, TNFRSF6, TNFSF6, TP53, UBL1 | 13 | CREBBP(6), DAXX(1), PAX3(4), PML(2), RARA(1), RB1(24), SIRT1(2), SP100(1), TNF(1), TNFRSF1A(1), TNFRSF1B(1), TP53(117) | 10745023 | 161 | 135 | 128 | 11 | 7 | 21 | 8 | 51 | 73 | 1 | 8.3e-07 | <1.00e-15 | <1.14e-13 |
| 5 | SA_G1_AND_S_PHASES | Cdk2, 4, and 6 bind cyclin D in G1, while cdk2/cyclin E promotes the G1/S transition. | ARF1, ARF3, CCND1, CDK2, CDK4, CDKN1A, CDKN1B, CDKN2A, CFL1, E2F1, E2F2, MDM2, NXT1, PRB1, TP53 | 15 | ARF1(1), CCND1(1), CDKN1A(6), CDKN1B(5), CDKN2A(11), CFL1(1), E2F1(3), MDM2(1), TP53(117) | 4705549 | 146 | 134 | 113 | 4 | 7 | 17 | 7 | 54 | 61 | 0 | 2.6e-10 | <1.00e-15 | <1.14e-13 |
| 6 | ATMPATHWAY | The tumor-suppressing protein kinase ATM responds to radiation-induced DNA damage by blocking cell-cycle progression and activating DNA repair. | ABL1, ATM, BRCA1, CDKN1A, CHEK1, CHEK2, GADD45A, JUN, MAPK8, MDM2, MRE11A, NBS1, NFKB1, NFKBIA, RAD50, RAD51, RBBP8, RELA, TP53, TP73 | 19 | ABL1(2), ATM(9), BRCA1(9), CDKN1A(6), CHEK1(5), CHEK2(5), JUN(2), MAPK8(1), MDM2(1), NFKB1(3), NFKBIA(2), RAD50(6), RAD51(2), RBBP8(3), RELA(4), TP53(117), TP73(2) | 16637482 | 179 | 147 | 147 | 14 | 11 | 25 | 13 | 62 | 67 | 1 | 1.4e-06 | 1.11e-15 | 1.14e-13 |
| 7 | RNAPATHWAY | dsRNA-activated protein kinase phosphorylates elF2a, which generally inhibits translation, and activates NF-kB to provoke inflammation. | CHUK, DNAJC3, EIF2S1, EIF2S2, MAP3K14, NFKB1, NFKBIA, PRKR, RELA, TP53 | 9 | CHUK(8), EIF2S2(1), NFKB1(3), NFKBIA(2), RELA(4), TP53(117) | 5747826 | 135 | 122 | 103 | 8 | 7 | 20 | 10 | 44 | 54 | 0 | 7.6e-07 | 1.67e-15 | 1.18e-13 |
| 8 | TELPATHWAY | Telomerase is a ribonucleotide protein that adds telomeric repeats to the 3' ends of chromosomes. | AKT1, BCL2, EGFR, G22P1, HSPCA, IGF1R, KRAS2, MYC, POLR2A, PPP2CA, PRKCA, RB1, TEP1, TERF1, TERT, TNKS, TP53, XRCC5 | 15 | AKT1(2), BCL2(1), EGFR(6), IGF1R(11), MYC(2), POLR2A(7), PPP2CA(2), PRKCA(1), RB1(24), TEP1(13), TERF1(5), TERT(2), TNKS(3), TP53(117), XRCC5(4) | 15748769 | 200 | 159 | 166 | 15 | 9 | 31 | 10 | 64 | 85 | 1 | 1.4e-07 | 1.78e-15 | 1.18e-13 |
| 9 | G1PATHWAY | CDK4/6-cyclin D and CDK2-cyclin E phosphorylate Rb, which allows the transcription of genes needed for the G1/S cell cycle transition. | ABL1, ATM, ATR, CCNA1, CCND1, CCNE1, CDC2, CDC25A, CDK2, CDK4, CDK6, CDKN1A, CDKN1B, CDKN2A, CDKN2B, DHFR, E2F1, GSK3B, HDAC1, MADH3, MADH4, RB1, SKP2, TFDP1, TGFB1, TGFB2, TGFB3, TP53 | 25 | ABL1(2), ATM(9), ATR(15), CCNA1(3), CCND1(1), CCNE1(1), CDK6(1), CDKN1A(6), CDKN1B(5), CDKN2A(11), CDKN2B(1), E2F1(3), GSK3B(3), RB1(24), SKP2(1), TFDP1(2), TGFB1(1), TGFB2(4), TGFB3(2), TP53(117) | 17015204 | 212 | 161 | 178 | 12 | 9 | 25 | 9 | 80 | 87 | 2 | 4.2e-09 | 1.89e-15 | 1.18e-13 |
| 10 | G2PATHWAY | Activated Cdc2-cyclin B kinase regulates the G2/M transition; DNA damage stimulates the DNA-PK/ATM/ATR kinases, which inactivate Cdc2. | ATM, ATR, BRCA1, CCNB1, CDC2, CDC25A, CDC25B, CDC25C, CDC34, CDKN1A, CDKN2D, CHEK1, CHEK2, EP300, GADD45A, MDM2, MYT1, PLK, PRKDC, RPS6KA1, TP53, WEE1, YWHAH, YWHAQ | 22 | ATM(9), ATR(15), BRCA1(9), CCNB1(2), CDC25B(2), CDC25C(3), CDC34(1), CDKN1A(6), CHEK1(5), CHEK2(5), EP300(11), MDM2(1), MYT1(2), PRKDC(6), RPS6KA1(1), TP53(117), WEE1(2) | 24294020 | 197 | 162 | 164 | 16 | 11 | 25 | 15 | 73 | 71 | 2 | 2.9e-07 | 2.11e-15 | 1.18e-13 |
Table 6. Get Full Table A Ranked List of Significantly Mutated Genesets (Excluding Significantly Mutated Genes). Number of significant genesets found: 0. Number of genesets displayed: 10
| rank | geneset | description | genes | N_genes | mut_tally | N | n | npat | nsite | nsil | n1 | n2 | n3 | n4 | n5 | n6 | p_ns_s | p | q |
|---|---|---|---|---|---|---|---|---|---|---|---|---|---|---|---|---|---|---|---|
| 1 | HSA00472_D_ARGININE_AND_D_ORNITHINE_METABOLISM | Genes involved in D-arginine and D-ornithine metabolism | DAO | 1 | DAO(7) | 395753 | 7 | 7 | 7 | 0 | 1 | 2 | 0 | 4 | 0 | 0 | 0.19 | 0.00058 | 0.36 |
| 2 | MTA3PATHWAY | The estrogen receptor regulates proliferation in mammary epithelia via MTA3 activation; loss of either protein is implicated in breast cancer. | ALDOA, CTSD, ESR1, GAPD, GREB1, HSPB1, HSPB2, MTA1, MTA3, PDZK1, TUBA1, TUBA2, TUBA3, TUBA4, TUBA6, TUBA8 | 10 | CTSD(1), ESR1(6), GREB1(12), HSPB1(1), HSPB2(1), MTA1(6), PDZK1(4), TUBA8(2) | 6506963 | 33 | 32 | 31 | 2 | 3 | 13 | 6 | 7 | 4 | 0 | 0.00099 | 0.0023 | 0.71 |
| 3 | CCR3PATHWAY | CCR3 is a G-protein coupled receptor that recruits eosinophils to inflammation sites via chemokine ligands. | ARHA, CCL11, CCR3, CFL1, GNAQ, GNAS, GNB1, GNGT1, HRAS, LIMK1, MAP2K1, MAPK1, MAPK3, MYL2, NOX1, PIK3C2G, PLCB1, PPP1R12B, PRKCA, PRKCB1, PTK2, RAF1, ROCK2 | 21 | CCL11(1), CCR3(3), CFL1(1), GNAQ(1), GNAS(10), GNB1(2), LIMK1(4), MAPK1(3), NOX1(3), PIK3C2G(7), PLCB1(8), PPP1R12B(4), PRKCA(1), PTK2(9), RAF1(2), ROCK2(3) | 14537713 | 62 | 52 | 59 | 2 | 7 | 16 | 7 | 22 | 10 | 0 | 0.000023 | 0.0098 | 1 |
| 4 | STILBENE_COUMARINE_AND_LIGNIN_BIOSYNTHESIS | EPX, GBA3, LPO, MPO, PRDX1, PRDX2, PRDX5, PRDX6, TPO, TYR | 10 | EPX(3), LPO(4), MPO(5), PRDX1(1), PRDX2(2), PRDX6(1), TPO(13), TYR(5) | 5528691 | 34 | 31 | 34 | 3 | 2 | 6 | 8 | 11 | 7 | 0 | 0.0076 | 0.0098 | 1 | |
| 5 | METHANE_METABOLISM | ADH5, ATP6V0C, SHMT1, CAT, EPX, LPO, MPO, PRDX1, PRDX2, PRDX5, PRDX6, SHMT1, SHMT2, TPO | 13 | ADH5(2), ATP6V0C(2), CAT(1), EPX(3), LPO(4), MPO(5), PRDX1(1), PRDX2(2), PRDX6(1), SHMT1(2), SHMT2(4), TPO(13) | 6710725 | 40 | 34 | 40 | 3 | 2 | 9 | 6 | 11 | 12 | 0 | 0.0059 | 0.017 | 1 | |
| 6 | TUBBYPATHWAY | Tubby is activated by phospholipase C activity and hydrolysis of PIP2, after which it enters the nucleus and regulates transcription. | CHRM1, GNAQ, GNB1, GNGT1, HTR2C, PLCB1, TUB | 7 | CHRM1(3), GNAQ(1), GNB1(2), HTR2C(3), PLCB1(8), TUB(3) | 3981712 | 20 | 18 | 20 | 1 | 1 | 3 | 2 | 6 | 8 | 0 | 0.064 | 0.027 | 1 |
| 7 | HBXPATHWAY | Hbx is a hepatitis B protein that activates a number of transcription factors, possibly by inducing calcium release from the mitochondrion to the cytoplasm. | CREB1, GRB2, HBXIP, HRAS, PTK2B, SHC1, SOS1, SRC | 8 | CREB1(1), PTK2B(5), SHC1(3), SOS1(8), SRC(3) | 4901533 | 20 | 20 | 20 | 1 | 2 | 6 | 4 | 4 | 3 | 1 | 0.018 | 0.03 | 1 |
| 8 | PROTEASOME | PSMA1, PSMA2, PSMA3, PSMA4, PSMA5, PSMA6, PSMA7, PSMB1, PSMB10, PSMB2, PSMB3, PSMB4, PSMB5, PSMB6, PSMB7, PSMB8, PSMB9 | 17 | PSMA1(2), PSMA3(1), PSMA4(2), PSMA5(3), PSMA7(3), PSMB1(1), PSMB10(2), PSMB2(2), PSMB3(1), PSMB5(3), PSMB6(1), PSMB7(1), PSMB9(1) | 4919552 | 23 | 21 | 23 | 1 | 0 | 7 | 4 | 8 | 4 | 0 | 0.014 | 0.037 | 1 | |
| 9 | IL18PATHWAY | Pro-inflammatory IL-18 is activated in macrophages by caspase-1 cleavage and, in conjunction with IL-12, stimulates Th1 cell differentiation. | CASP1, IFNG, IL12A, IL12B, IL18, IL2 | 6 | IFNG(3), IL12A(6), IL12B(2), IL18(2) | 1718224 | 13 | 12 | 13 | 2 | 0 | 1 | 3 | 7 | 2 | 0 | 0.34 | 0.038 | 1 |
| 10 | HSA00750_VITAMIN_B6_METABOLISM | Genes involved in vitamin B6 metabolism | AOX1, PDXK, PDXP, PNPO, PSAT1 | 5 | AOX1(11), PDXK(1), PNPO(1), PSAT1(2) | 2699768 | 15 | 13 | 15 | 1 | 0 | 8 | 1 | 3 | 3 | 0 | 0.072 | 0.046 | 1 |
In brief, we tabulate the number of mutations and the number of covered bases for each gene. The counts are broken down by mutation context category: four context categories that are discovered by MutSig, and one for indel and 'null' mutations, which include indels, nonsense mutations, splice-site mutations, and non-stop (read-through) mutations. For each gene, we calculate the probability of seeing the observed constellation of mutations, i.e. the product P1 x P2 x ... x Pm, or a more extreme one, given the background mutation rates calculated across the dataset. [1]
In addition to the links below, the full results of the analysis summarized in this report can also be downloaded programmatically using firehose_get, or interactively from either the Broad GDAC website or TCGA Data Coordination Center Portal.