This pipeline inspects significant overlapping pathway gene sets for a given gene list using a hypergeometric test. For the gene set database, we uses GSEA MSigDB Class2: Canonical Pathways DB as a gene set data. Further details about the MsigDB gene sets, please visit The Broad Institute GSEA MsigDB
For a given gene list, a hypergeometric test was tried to find significant overlapping canonical pathways using 1320 gene sets. In terms of FDR adjusted p.values, top 5 significant overlapping gene sets are listed as below.
-
REACTOME_DEVELOPMENTAL_BIOLOGY, REACTOME_AXON_GUIDANCE, REACTOME_CELL_CYCLE, KEGG_AXON_GUIDANCE, PID_INTEGRIN3_PATHWAY
Table 1. Get Full Table This table shows significant gene sets in which at least one gene is found and its FDR adjusted p.value is smaller than 0.3. the hypergeometric p-value is a probability of randomly drawing x or more successes(gene overlaps in gene set database) from the population (gene universe consisting of N number of genes) in k total draws(the number of input genes). The hypergeometric test is identical to the corresponding one-tailed version of Fisher's exact test. That is, P(X=x) = f(x| N,m,k). The FDR q.value was obtained for 1320 multiple comparison.
| GS(gene set) pathway name | gene.list | GS size (m) | n.NotInGS (n) | Gene universe (N) | n.drawn (k) | n.found (x) | p.value (p(X>=x)) | FDR (q.value) |
|---|---|---|---|---|---|---|---|---|
| REACTOME DEVELOPMENTAL BIOLOGY | gene.list | 396 | 45560 | 45956 | 759 | 29 | 3.543e-11 | 4.677e-08 |
| REACTOME AXON GUIDANCE | gene.list | 251 | 45705 | 45956 | 759 | 21 | 1.685e-09 | 1.112e-06 |
| REACTOME CELL CYCLE | gene.list | 421 | 45535 | 45956 | 759 | 27 | 3.042e-09 | 1.338e-06 |
| KEGG AXON GUIDANCE | gene.list | 129 | 45827 | 45956 | 759 | 14 | 3.388e-08 | 8.944e-06 |
| PID INTEGRIN3 PATHWAY | gene.list | 43 | 45913 | 45956 | 759 | 9 | 2.978e-08 | 8.944e-06 |
| REACTOME MEIOSIS | gene.list | 116 | 45840 | 45956 | 759 | 13 | 7.108e-08 | 1.564e-05 |
| REACTOME TRANSMEMBRANE TRANSPORT OF SMALL MOLECULES | gene.list | 413 | 45543 | 45956 | 759 | 24 | 1.432e-07 | 2.700e-05 |
| KEGG PATHWAYS IN CANCER | gene.list | 328 | 45628 | 45956 | 759 | 21 | 1.747e-07 | 2.882e-05 |
| KEGG CALCIUM SIGNALING PATHWAY | gene.list | 178 | 45778 | 45956 | 759 | 15 | 3.209e-07 | 4.707e-05 |
| KEGG MAPK SIGNALING PATHWAY | gene.list | 267 | 45689 | 45956 | 759 | 18 | 6.200e-07 | 8.185e-05 |
| REACTOME HEMOSTASIS | gene.list | 466 | 45490 | 45956 | 759 | 24 | 1.242e-06 | 1.490e-04 |
| PID INTEGRIN1 PATHWAY | gene.list | 66 | 45890 | 45956 | 759 | 9 | 1.394e-06 | 1.533e-04 |
| PID FRA PATHWAY | gene.list | 37 | 45919 | 45956 | 759 | 7 | 2.182e-06 | 2.057e-04 |
| REACTOME GENERIC TRANSCRIPTION PATHWAY | gene.list | 352 | 45604 | 45956 | 759 | 20 | 2.175e-06 | 2.057e-04 |
| REACTOME MEIOTIC SYNAPSIS | gene.list | 73 | 45883 | 45956 | 759 | 9 | 3.299e-06 | 2.903e-04 |
| BIOCARTA TEL PATHWAY | gene.list | 18 | 45938 | 45956 | 759 | 5 | 8.693e-06 | 7.172e-04 |
| PID SYNDECAN 4 PATHWAY | gene.list | 32 | 45924 | 45956 | 759 | 6 | 1.250e-05 | 9.708e-04 |
| PID ATM PATHWAY | gene.list | 34 | 45922 | 45956 | 759 | 6 | 1.804e-05 | 1.253e-03 |
| PID MAPKTRKPATHWAY | gene.list | 34 | 45922 | 45956 | 759 | 6 | 1.804e-05 | 1.253e-03 |
| PID AR TF PATHWAY | gene.list | 53 | 45903 | 45956 | 759 | 7 | 2.598e-05 | 1.715e-03 |
Figure 1. Get High-res Image This figure is an event heatmap indicating gene matches across gene sets
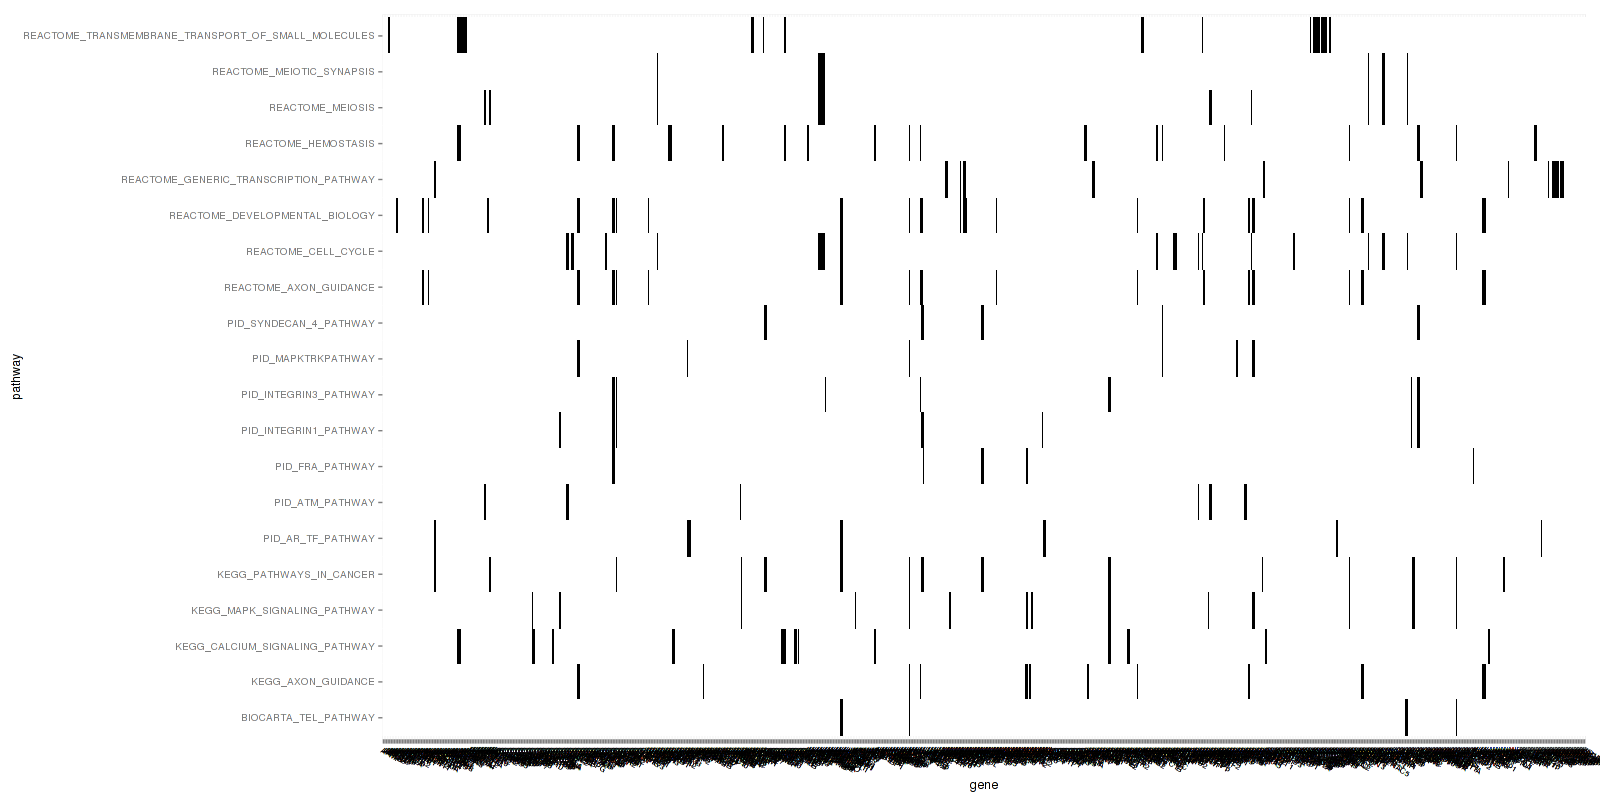
-
Gene set database = c2.cp.v4.0.symbols.gmt
-
Input gene list = MutSig2CV.input.genenames.txt
For a given gene list, it uses a hypergeometric test to get a significance of each overlapping pathway gene set. The hypergeometric p-value is obtained by R library function phyper() and is defined as a probability of randomly drawing x or more successes(gene matches) from the population consisting N genes in k(the input genes) total draws.
-
a cumulative p-value using the R function phyper():
-
ex). a probability to see at least x genes in the group is defined as p(X>=x) = 1 - p(X<=x)= 1 - phyper(x-1, m, n, k, lower.tail=FALSE, log.p=FALSE) that is, f(x| N, m, k) = (m) C (k) * ((N-m) C (n-k)) / ((N) C (n))
-
The hypergeometric test is identical to the corresponding one-tailed version of Fisher's exact test.
-
ex). Fisher' exact test = matrix(c(n.Found, n.GS-n.Found, n.drawn-n.Found, n.NotGS- (n.drawn-n.Found)), nrow=2, dimnames = list(inputGenes = c("Found", "NotFound"),GeneUniverse = c("GS", "nonGS")) )
In addition to the links below, the full results of the analysis summarized in this report can also be downloaded programmatically using firehose_get, or interactively from either the Broad GDAC website or TCGA Data Coordination Center Portal.