This pipeline computes the correlation between APOBRC groups and selected clinical features.
Testing the association between APOBEC groups identified by 2 different apobec score and 14 clinical features across 290 patients, 6 significant findings detected with Q value < 0.25.
-
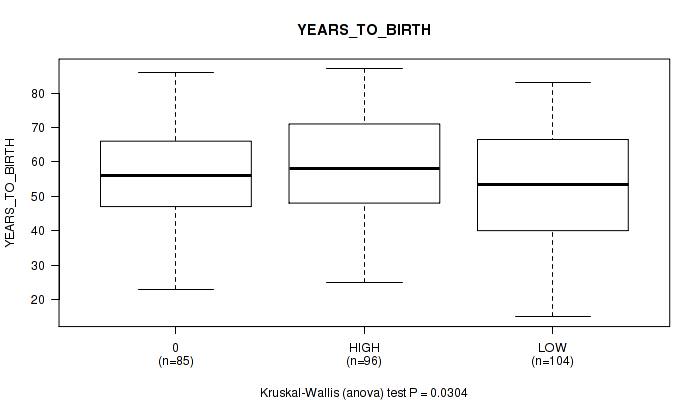
3 subtypes identified in current cancer cohort by 'APOBEC MUTLOAD MINESTIMATE'. These subtypes correlate to 'YEARS_TO_BIRTH', 'MELANOMA_ULCERATION', 'GENDER', and 'RACE'.
-
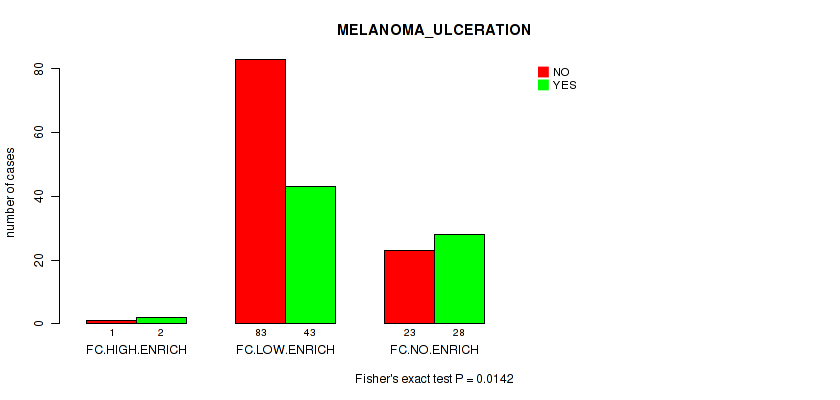
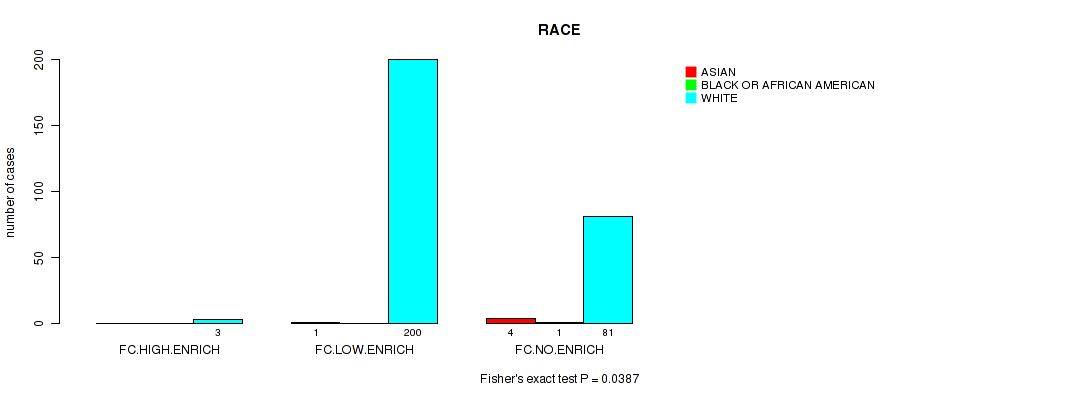
3 subtypes identified in current cancer cohort by 'APOBEC ENRICH'. These subtypes correlate to 'MELANOMA_ULCERATION' and 'RACE'.
Table 1. Get Full Table Overview of the association between APOBEC groups by 2 different APOBEC scores and 14 clinical features. Shown in the table are P values (Q values). Thresholded by Q value < 0.25, 6 significant findings detected.
|
Clinical Features |
Statistical Tests |
APOBEC MUTLOAD MINESTIMATE |
APOBEC ENRICH |
| Time from Specimen Diagnosis to Death | logrank test |
0.171 (0.439) |
0.157 (0.439) |
| Time to Death | logrank test |
0.183 (0.439) |
0.189 (0.439) |
| YEARS TO BIRTH | Kruskal-Wallis (anova) |
0.0304 (0.213) |
0.51 (0.679) |
| PATHOLOGIC STAGE | Fisher's exact test |
0.386 (0.568) |
0.48 (0.672) |
| PATHOLOGY T STAGE | Fisher's exact test |
0.63 (0.763) |
0.267 (0.499) |
| PATHOLOGY N STAGE | Fisher's exact test |
0.374 (0.568) |
0.356 (0.568) |
| PATHOLOGY M STAGE | Fisher's exact test |
0.819 (0.85) |
0.633 (0.763) |
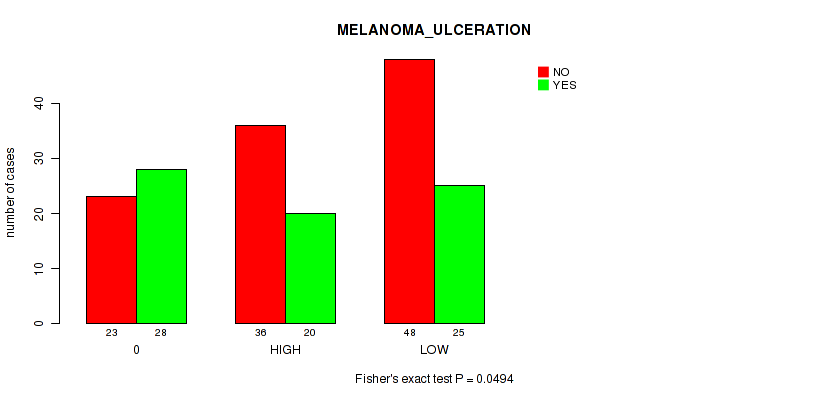
| MELANOMA ULCERATION | Fisher's exact test |
0.0494 (0.23) |
0.0142 (0.193) |
| MELANOMA PRIMARY KNOWN | Fisher's exact test |
0.295 (0.516) |
0.713 (0.782) |
| BRESLOW THICKNESS | Kruskal-Wallis (anova) |
0.654 (0.763) |
0.193 (0.439) |
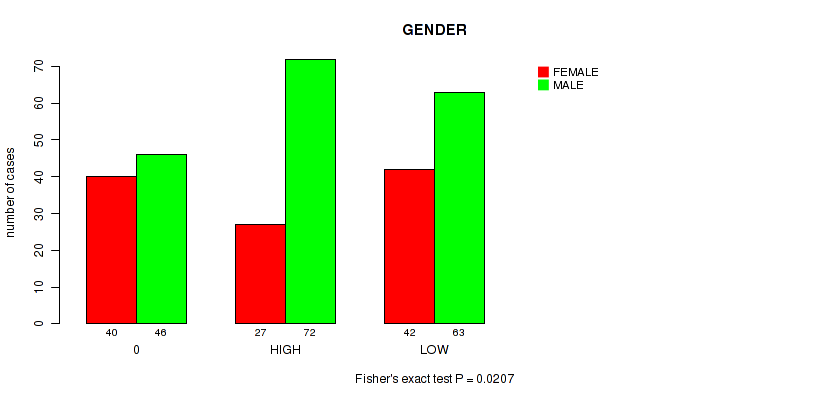
| GENDER | Fisher's exact test |
0.0207 (0.193) |
0.116 (0.439) |
| RADIATION THERAPY | Fisher's exact test |
0.726 (0.782) |
1 (1.00) |
| RACE | Fisher's exact test |
0.02 (0.193) |
0.0387 (0.217) |
| ETHNICITY | Fisher's exact test |
0.204 (0.439) |
0.235 (0.47) |
Table S1. Description of APOBEC group #1: 'APOBEC MUTLOAD MINESTIMATE'
| Cluster Labels | 0 | HIGH | LOW |
|---|---|---|---|
| Number of samples | 86 | 99 | 105 |
P value = 0.0304 (Kruskal-Wallis (anova)), Q value = 0.21
Table S2. Clustering Approach #1: 'APOBEC MUTLOAD MINESTIMATE' versus Clinical Feature #3: 'YEARS_TO_BIRTH'
| nPatients | Mean (Std.Dev) | |
|---|---|---|
| ALL | 285 | 55.9 (15.5) |
| 0 | 85 | 56.6 (14.3) |
| HIGH | 96 | 59.1 (14.6) |
| LOW | 104 | 52.5 (16.7) |
Figure S1. Get High-res Image Clustering Approach #1: 'APOBEC MUTLOAD MINESTIMATE' versus Clinical Feature #3: 'YEARS_TO_BIRTH'
P value = 0.0494 (Fisher's exact test), Q value = 0.23
Table S3. Clustering Approach #1: 'APOBEC MUTLOAD MINESTIMATE' versus Clinical Feature #8: 'MELANOMA_ULCERATION'
| nPatients | NO | YES |
|---|---|---|
| ALL | 107 | 73 |
| 0 | 23 | 28 |
| HIGH | 36 | 20 |
| LOW | 48 | 25 |
Figure S2. Get High-res Image Clustering Approach #1: 'APOBEC MUTLOAD MINESTIMATE' versus Clinical Feature #8: 'MELANOMA_ULCERATION'
P value = 0.0207 (Fisher's exact test), Q value = 0.19
Table S4. Clustering Approach #1: 'APOBEC MUTLOAD MINESTIMATE' versus Clinical Feature #11: 'GENDER'
| nPatients | FEMALE | MALE |
|---|---|---|
| ALL | 109 | 181 |
| 0 | 40 | 46 |
| HIGH | 27 | 72 |
| LOW | 42 | 63 |
Figure S3. Get High-res Image Clustering Approach #1: 'APOBEC MUTLOAD MINESTIMATE' versus Clinical Feature #11: 'GENDER'
P value = 0.02 (Fisher's exact test), Q value = 0.19
Table S5. Clustering Approach #1: 'APOBEC MUTLOAD MINESTIMATE' versus Clinical Feature #13: 'RACE'
| nPatients | ASIAN | BLACK OR AFRICAN AMERICAN | WHITE |
|---|---|---|---|
| ALL | 5 | 1 | 284 |
| 0 | 4 | 1 | 81 |
| HIGH | 0 | 0 | 99 |
| LOW | 1 | 0 | 104 |
Figure S4. Get High-res Image Clustering Approach #1: 'APOBEC MUTLOAD MINESTIMATE' versus Clinical Feature #13: 'RACE'
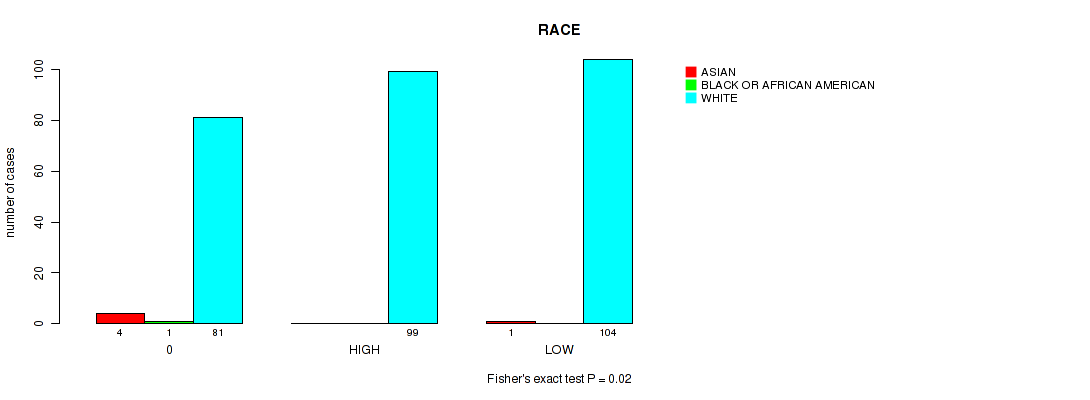
Table S6. Description of APOBEC group #2: 'APOBEC ENRICH'
| Cluster Labels | FC.HIGH.ENRICH | FC.LOW.ENRICH | FC.NO.ENRICH |
|---|---|---|---|
| Number of samples | 3 | 201 | 86 |
P value = 0.0142 (Fisher's exact test), Q value = 0.19
Table S7. Clustering Approach #2: 'APOBEC ENRICH' versus Clinical Feature #8: 'MELANOMA_ULCERATION'
| nPatients | NO | YES |
|---|---|---|
| ALL | 107 | 73 |
| FC.HIGH.ENRICH | 1 | 2 |
| FC.LOW.ENRICH | 83 | 43 |
| FC.NO.ENRICH | 23 | 28 |
Figure S5. Get High-res Image Clustering Approach #2: 'APOBEC ENRICH' versus Clinical Feature #8: 'MELANOMA_ULCERATION'
P value = 0.0387 (Fisher's exact test), Q value = 0.22
Table S8. Clustering Approach #2: 'APOBEC ENRICH' versus Clinical Feature #13: 'RACE'
| nPatients | ASIAN | BLACK OR AFRICAN AMERICAN | WHITE |
|---|---|---|---|
| ALL | 5 | 1 | 284 |
| FC.HIGH.ENRICH | 0 | 0 | 3 |
| FC.LOW.ENRICH | 1 | 0 | 200 |
| FC.NO.ENRICH | 4 | 1 | 81 |
Figure S6. Get High-res Image Clustering Approach #2: 'APOBEC ENRICH' versus Clinical Feature #13: 'RACE'
-
APOBEC groups file = /xchip/cga/gdac-prod/tcga-gdac/jobResults/APOBEC_Pipelines/SKCM-TM/22541894/__DELETED__1436046:APOBEC_clinical_corr_input_22563710/APOBEC_for_clinical.correlaion.input.categorical.txt
-
Clinical data file = /xchip/cga/gdac-prod/tcga-gdac/jobResults/Append_Data/SKCM-TM/22507034/SKCM-TM.merged_data.txt
-
Number of patients = 290
-
Number of selected clinical features = 14
APOBEC classification based on APOBEC_MutLoad_MinEstimate : a. APOBEC non group -- samples with zero value, b. APOBEC high group -- samples above median value in non zero samples, c. APOBEC low group -- samples below median value in non zero samples.
APOBEC classification based on APOBEC_enrich : a. No Enrichmment group -- all samples with BH_Fisher_p-value_tCw > 0.05, b. Low enrichment group -- samples with BH_Fisher_p-value_tCw = < 0.05 and APOBEC_enrich=<2, c. High enrichment group -- samples with BH_Fisher_p-value_tCw =< 0.05 and APOBEC_enrich>2.
For survival clinical features, the Kaplan-Meier survival curves of tumors with and without gene mutations were plotted and the statistical significance P values were estimated by logrank test (Bland and Altman 2004) using the 'survdiff' function in R
For binary clinical features, two-tailed Fisher's exact tests (Fisher 1922) were used to estimate the P values using the 'fisher.test' function in R
For multiple hypothesis correction, Q value is the False Discovery Rate (FDR) analogue of the P value (Benjamini and Hochberg 1995), defined as the minimum FDR at which the test may be called significant. We used the 'Benjamini and Hochberg' method of 'p.adjust' function in R to convert P values into Q values.
In addition to the links below, the full results of the analysis summarized in this report can also be downloaded programmatically using firehose_get, or interactively from either the Broad GDAC website or TCGA Data Coordination Center Portal.