This pipeline computes the correlation between APOBRC groups and selected clinical features.
Testing the association between APOBEC groups identified by 2 different apobec score and 12 clinical features across 578 patients, 10 significant findings detected with Q value < 0.25.
-
3 subtypes identified in current cancer cohort by 'APOBEC MUTLOAD MINESTIMATE'. These subtypes correlate to 'YEARS_TO_BIRTH', 'PATHOLOGIC_STAGE', 'PATHOLOGY_N_STAGE', 'GENDER', and 'RADIATION_THERAPY'.
-
3 subtypes identified in current cancer cohort by 'APOBEC ENRICH'. These subtypes correlate to 'YEARS_TO_BIRTH', 'PATHOLOGIC_STAGE', 'PATHOLOGY_N_STAGE', 'GENDER', and 'RADIATION_THERAPY'.
Table 1. Get Full Table Overview of the association between APOBEC groups by 2 different APOBEC scores and 12 clinical features. Shown in the table are P values (Q values). Thresholded by Q value < 0.25, 10 significant findings detected.
|
Clinical Features |
Statistical Tests |
APOBEC MUTLOAD MINESTIMATE |
APOBEC ENRICH |
| Time to Death | logrank test |
0.972 (1.00) |
0.964 (1.00) |
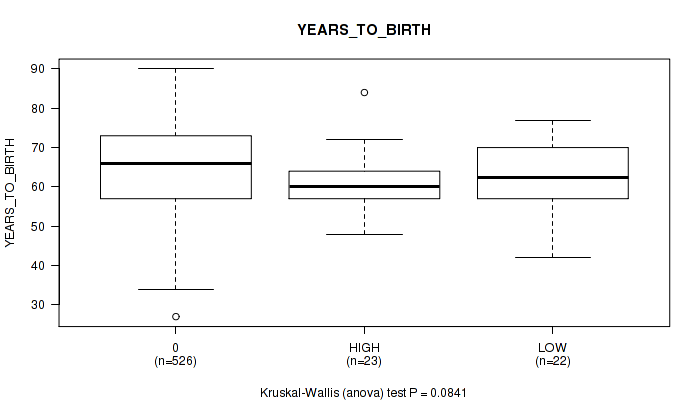
| YEARS TO BIRTH | Kruskal-Wallis (anova) |
0.0841 (0.202) |
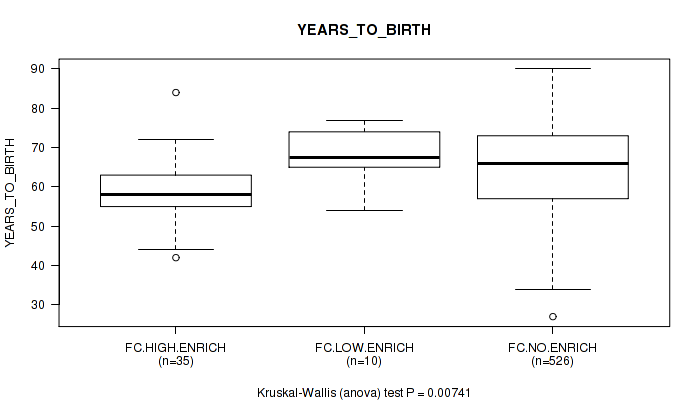
0.00741 (0.0759) |
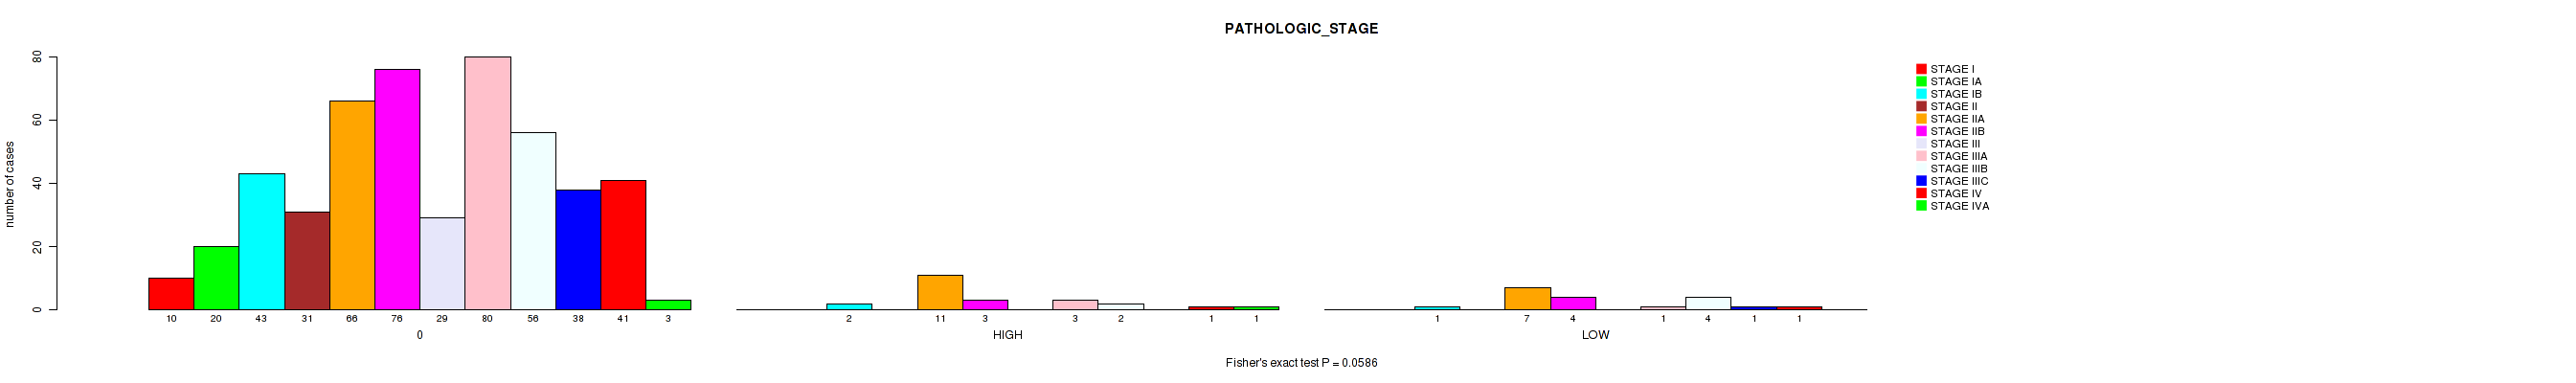
| PATHOLOGIC STAGE | Fisher's exact test |
0.0586 (0.197) |
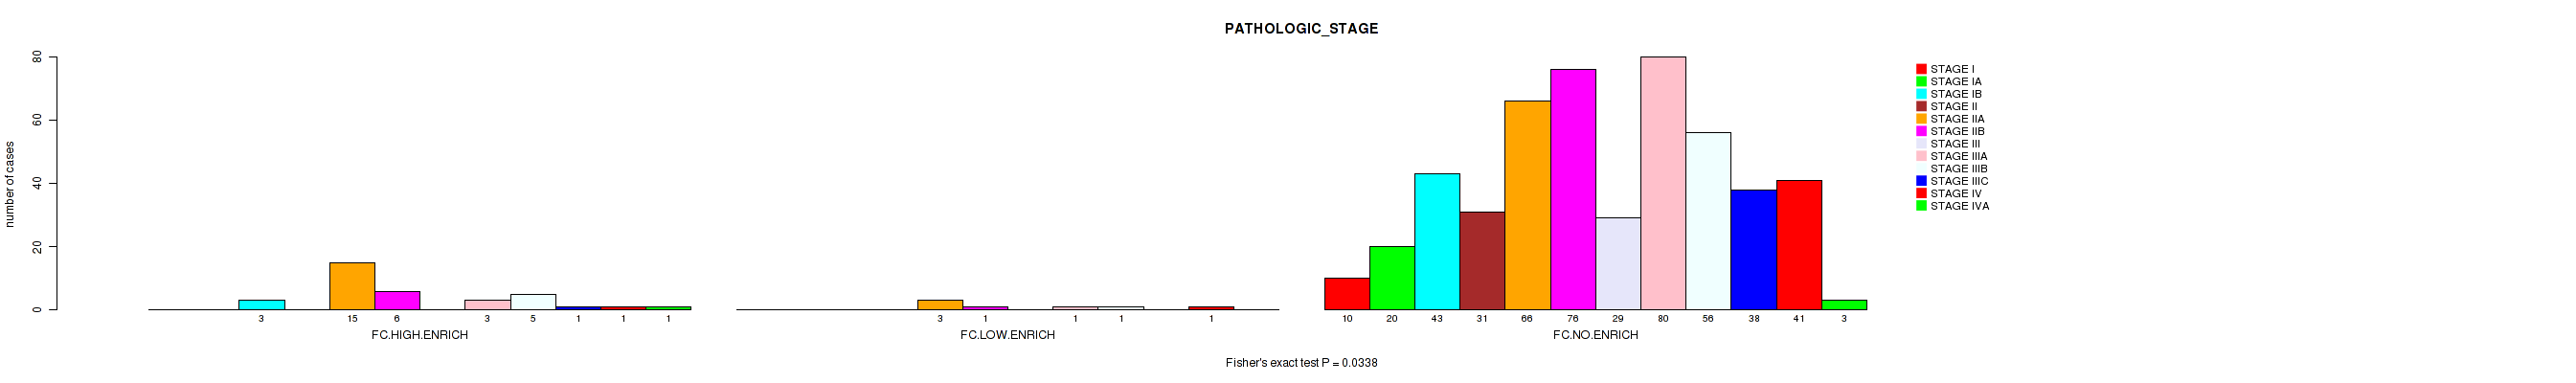
0.0338 (0.135) |
| PATHOLOGY T STAGE | Fisher's exact test |
0.392 (0.672) |
0.296 (0.647) |
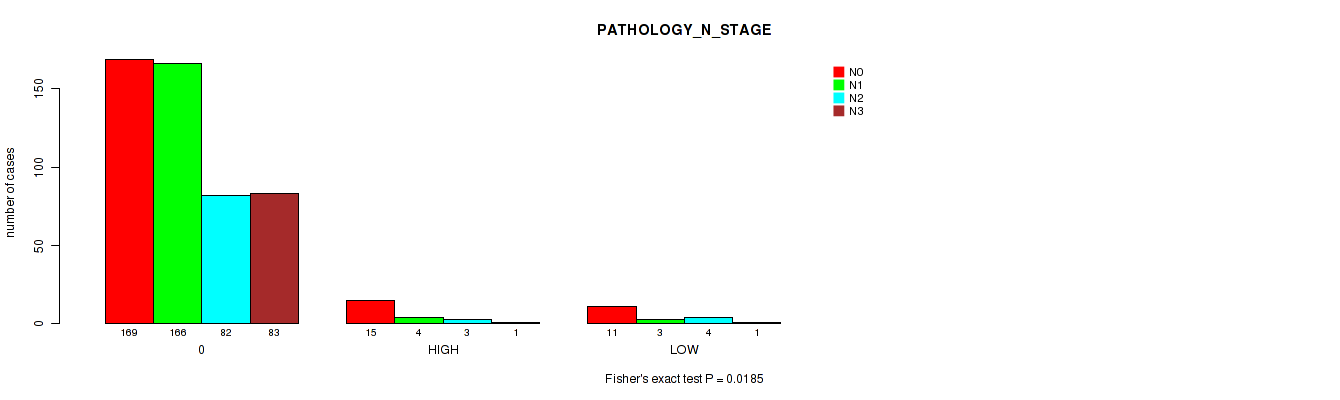
| PATHOLOGY N STAGE | Fisher's exact test |
0.0185 (0.0887) |
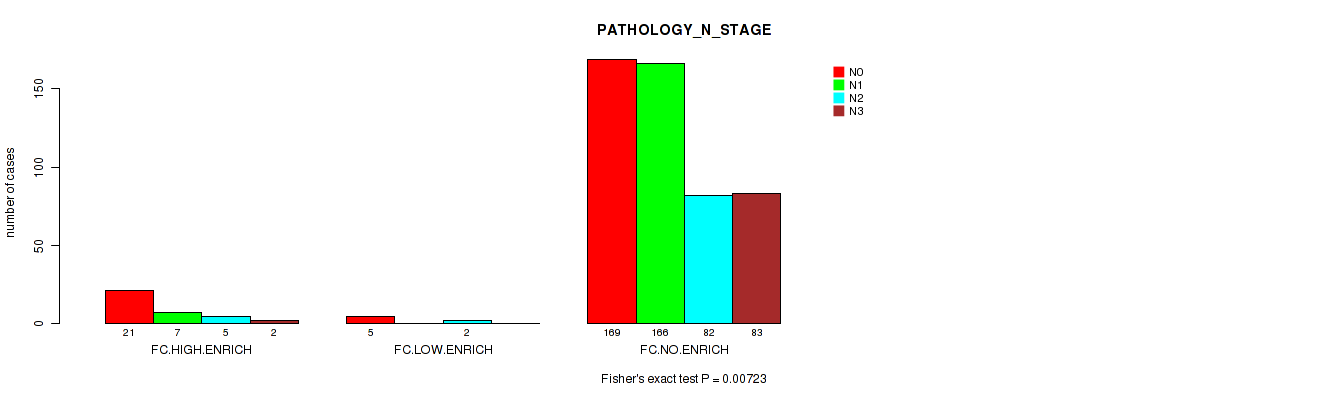
0.00723 (0.0759) |
| PATHOLOGY M STAGE | Fisher's exact test |
0.873 (1.00) |
0.547 (0.755) |
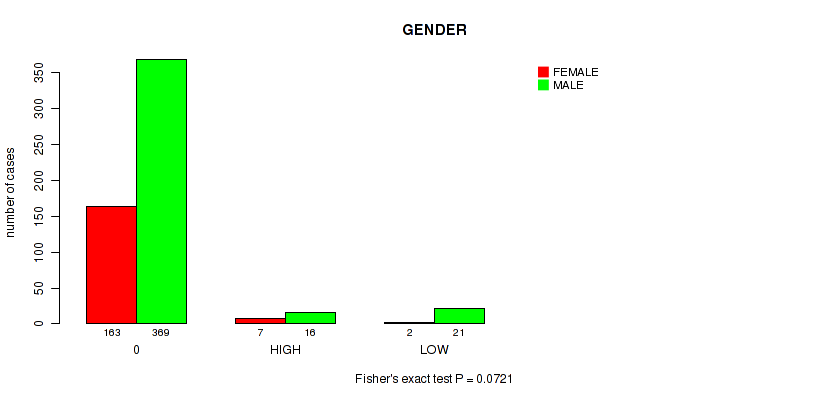
| GENDER | Fisher's exact test |
0.0721 (0.197) |
0.0739 (0.197) |
| RADIATION THERAPY | Fisher's exact test |
0.00949 (0.0759) |
0.0135 (0.0813) |
| KARNOFSKY PERFORMANCE SCORE | Kruskal-Wallis (anova) |
0.752 (0.95) |
0.448 (0.717) |
| NUMBER PACK YEARS SMOKED | Kruskal-Wallis (anova) |
0.566 (0.755) |
0.523 (0.755) |
| RACE | Fisher's exact test |
0.384 (0.672) |
0.378 (0.672) |
| ETHNICITY | Fisher's exact test |
1 (1.00) |
1 (1.00) |
Table S1. Description of APOBEC group #1: 'APOBEC MUTLOAD MINESTIMATE'
| Cluster Labels | 0 | HIGH | LOW |
|---|---|---|---|
| Number of samples | 532 | 23 | 23 |
P value = 0.0841 (Kruskal-Wallis (anova)), Q value = 0.2
Table S2. Clustering Approach #1: 'APOBEC MUTLOAD MINESTIMATE' versus Clinical Feature #2: 'YEARS_TO_BIRTH'
| nPatients | Mean (Std.Dev) | |
|---|---|---|
| ALL | 571 | 64.6 (11.2) |
| 0 | 526 | 64.9 (11.4) |
| HIGH | 23 | 61.0 (8.4) |
| LOW | 22 | 62.0 (9.8) |
Figure S1. Get High-res Image Clustering Approach #1: 'APOBEC MUTLOAD MINESTIMATE' versus Clinical Feature #2: 'YEARS_TO_BIRTH'
P value = 0.0586 (Fisher's exact test), Q value = 0.2
Table S3. Clustering Approach #1: 'APOBEC MUTLOAD MINESTIMATE' versus Clinical Feature #3: 'PATHOLOGIC_STAGE'
| nPatients | STAGE I | STAGE IA | STAGE IB | STAGE II | STAGE IIA | STAGE IIB | STAGE III | STAGE IIIA | STAGE IIIB | STAGE IIIC | STAGE IV | STAGE IVA |
|---|---|---|---|---|---|---|---|---|---|---|---|---|
| ALL | 10 | 20 | 46 | 31 | 84 | 83 | 29 | 84 | 62 | 39 | 43 | 4 |
| 0 | 10 | 20 | 43 | 31 | 66 | 76 | 29 | 80 | 56 | 38 | 41 | 3 |
| HIGH | 0 | 0 | 2 | 0 | 11 | 3 | 0 | 3 | 2 | 0 | 1 | 1 |
| LOW | 0 | 0 | 1 | 0 | 7 | 4 | 0 | 1 | 4 | 1 | 1 | 0 |
Figure S2. Get High-res Image Clustering Approach #1: 'APOBEC MUTLOAD MINESTIMATE' versus Clinical Feature #3: 'PATHOLOGIC_STAGE'
P value = 0.0185 (Fisher's exact test), Q value = 0.089
Table S4. Clustering Approach #1: 'APOBEC MUTLOAD MINESTIMATE' versus Clinical Feature #5: 'PATHOLOGY_N_STAGE'
| nPatients | N0 | N1 | N2 | N3 |
|---|---|---|---|---|
| ALL | 195 | 173 | 89 | 85 |
| 0 | 169 | 166 | 82 | 83 |
| HIGH | 15 | 4 | 3 | 1 |
| LOW | 11 | 3 | 4 | 1 |
Figure S3. Get High-res Image Clustering Approach #1: 'APOBEC MUTLOAD MINESTIMATE' versus Clinical Feature #5: 'PATHOLOGY_N_STAGE'
P value = 0.0721 (Fisher's exact test), Q value = 0.2
Table S5. Clustering Approach #1: 'APOBEC MUTLOAD MINESTIMATE' versus Clinical Feature #7: 'GENDER'
| nPatients | FEMALE | MALE |
|---|---|---|
| ALL | 172 | 406 |
| 0 | 163 | 369 |
| HIGH | 7 | 16 |
| LOW | 2 | 21 |
Figure S4. Get High-res Image Clustering Approach #1: 'APOBEC MUTLOAD MINESTIMATE' versus Clinical Feature #7: 'GENDER'
P value = 0.00949 (Fisher's exact test), Q value = 0.076
Table S6. Clustering Approach #1: 'APOBEC MUTLOAD MINESTIMATE' versus Clinical Feature #8: 'RADIATION_THERAPY'
| nPatients | NO | YES |
|---|---|---|
| ALL | 416 | 102 |
| 0 | 389 | 87 |
| HIGH | 16 | 6 |
| LOW | 11 | 9 |
Figure S5. Get High-res Image Clustering Approach #1: 'APOBEC MUTLOAD MINESTIMATE' versus Clinical Feature #8: 'RADIATION_THERAPY'
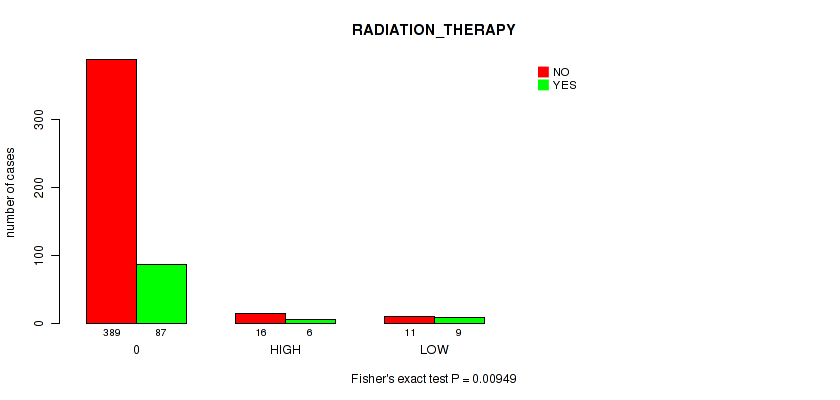
Table S7. Description of APOBEC group #2: 'APOBEC ENRICH'
| Cluster Labels | FC.HIGH.ENRICH | FC.LOW.ENRICH | FC.NO.ENRICH |
|---|---|---|---|
| Number of samples | 36 | 10 | 532 |
P value = 0.00741 (Kruskal-Wallis (anova)), Q value = 0.076
Table S8. Clustering Approach #2: 'APOBEC ENRICH' versus Clinical Feature #2: 'YEARS_TO_BIRTH'
| nPatients | Mean (Std.Dev) | |
|---|---|---|
| ALL | 571 | 64.6 (11.2) |
| FC.HIGH.ENRICH | 35 | 59.6 (8.7) |
| FC.LOW.ENRICH | 10 | 68.1 (7.0) |
| FC.NO.ENRICH | 526 | 64.9 (11.4) |
Figure S6. Get High-res Image Clustering Approach #2: 'APOBEC ENRICH' versus Clinical Feature #2: 'YEARS_TO_BIRTH'
P value = 0.0338 (Fisher's exact test), Q value = 0.14
Table S9. Clustering Approach #2: 'APOBEC ENRICH' versus Clinical Feature #3: 'PATHOLOGIC_STAGE'
| nPatients | STAGE I | STAGE IA | STAGE IB | STAGE II | STAGE IIA | STAGE IIB | STAGE III | STAGE IIIA | STAGE IIIB | STAGE IIIC | STAGE IV | STAGE IVA |
|---|---|---|---|---|---|---|---|---|---|---|---|---|
| ALL | 10 | 20 | 46 | 31 | 84 | 83 | 29 | 84 | 62 | 39 | 43 | 4 |
| FC.HIGH.ENRICH | 0 | 0 | 3 | 0 | 15 | 6 | 0 | 3 | 5 | 1 | 1 | 1 |
| FC.LOW.ENRICH | 0 | 0 | 0 | 0 | 3 | 1 | 0 | 1 | 1 | 0 | 1 | 0 |
| FC.NO.ENRICH | 10 | 20 | 43 | 31 | 66 | 76 | 29 | 80 | 56 | 38 | 41 | 3 |
Figure S7. Get High-res Image Clustering Approach #2: 'APOBEC ENRICH' versus Clinical Feature #3: 'PATHOLOGIC_STAGE'
P value = 0.00723 (Fisher's exact test), Q value = 0.076
Table S10. Clustering Approach #2: 'APOBEC ENRICH' versus Clinical Feature #5: 'PATHOLOGY_N_STAGE'
| nPatients | N0 | N1 | N2 | N3 |
|---|---|---|---|---|
| ALL | 195 | 173 | 89 | 85 |
| FC.HIGH.ENRICH | 21 | 7 | 5 | 2 |
| FC.LOW.ENRICH | 5 | 0 | 2 | 0 |
| FC.NO.ENRICH | 169 | 166 | 82 | 83 |
Figure S8. Get High-res Image Clustering Approach #2: 'APOBEC ENRICH' versus Clinical Feature #5: 'PATHOLOGY_N_STAGE'
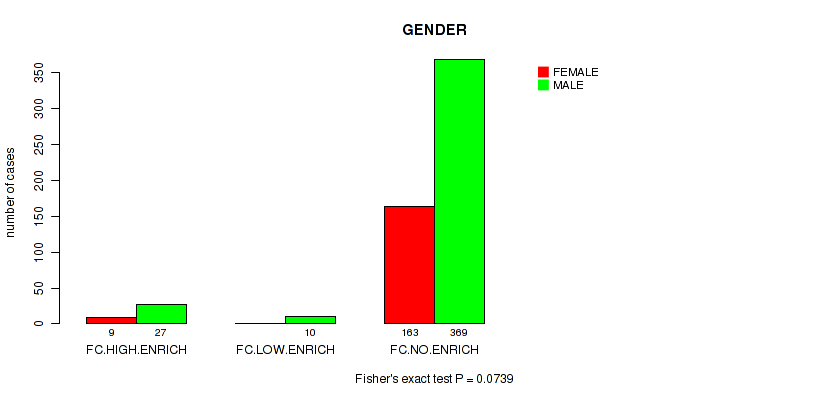
P value = 0.0739 (Fisher's exact test), Q value = 0.2
Table S11. Clustering Approach #2: 'APOBEC ENRICH' versus Clinical Feature #7: 'GENDER'
| nPatients | FEMALE | MALE |
|---|---|---|
| ALL | 172 | 406 |
| FC.HIGH.ENRICH | 9 | 27 |
| FC.LOW.ENRICH | 0 | 10 |
| FC.NO.ENRICH | 163 | 369 |
Figure S9. Get High-res Image Clustering Approach #2: 'APOBEC ENRICH' versus Clinical Feature #7: 'GENDER'
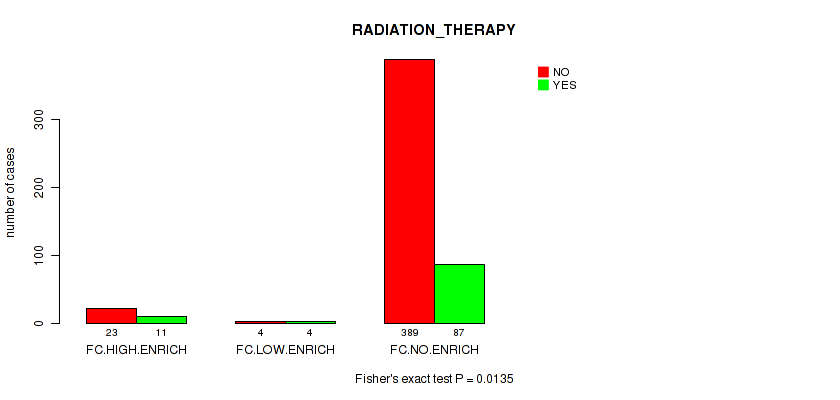
P value = 0.0135 (Fisher's exact test), Q value = 0.081
Table S12. Clustering Approach #2: 'APOBEC ENRICH' versus Clinical Feature #8: 'RADIATION_THERAPY'
| nPatients | NO | YES |
|---|---|---|
| ALL | 416 | 102 |
| FC.HIGH.ENRICH | 23 | 11 |
| FC.LOW.ENRICH | 4 | 4 |
| FC.NO.ENRICH | 389 | 87 |
Figure S10. Get High-res Image Clustering Approach #2: 'APOBEC ENRICH' versus Clinical Feature #8: 'RADIATION_THERAPY'
-
APOBEC groups file = /xchip/cga/gdac-prod/tcga-gdac/jobResults/APOBEC_Pipelines/STES-TP/22542964/__DELETED__1436046:APOBEC_clinical_corr_input_22571996/APOBEC_for_clinical.correlaion.input.categorical.txt
-
Clinical data file = /xchip/cga/gdac-prod/tcga-gdac/jobResults/Append_Data/STES-TP/22507048/STES-TP.merged_data.txt
-
Number of patients = 578
-
Number of selected clinical features = 12
APOBEC classification based on APOBEC_MutLoad_MinEstimate : a. APOBEC non group -- samples with zero value, b. APOBEC high group -- samples above median value in non zero samples, c. APOBEC low group -- samples below median value in non zero samples.
APOBEC classification based on APOBEC_enrich : a. No Enrichmment group -- all samples with BH_Fisher_p-value_tCw > 0.05, b. Low enrichment group -- samples with BH_Fisher_p-value_tCw = < 0.05 and APOBEC_enrich=<2, c. High enrichment group -- samples with BH_Fisher_p-value_tCw =< 0.05 and APOBEC_enrich>2.
For survival clinical features, the Kaplan-Meier survival curves of tumors with and without gene mutations were plotted and the statistical significance P values were estimated by logrank test (Bland and Altman 2004) using the 'survdiff' function in R
For binary clinical features, two-tailed Fisher's exact tests (Fisher 1922) were used to estimate the P values using the 'fisher.test' function in R
For multiple hypothesis correction, Q value is the False Discovery Rate (FDR) analogue of the P value (Benjamini and Hochberg 1995), defined as the minimum FDR at which the test may be called significant. We used the 'Benjamini and Hochberg' method of 'p.adjust' function in R to convert P values into Q values.
In addition to the links below, the full results of the analysis summarized in this report can also be downloaded programmatically using firehose_get, or interactively from either the Broad GDAC website or TCGA Data Coordination Center Portal.