This report serves to describe the mutational landscape and properties of a given individual set, as well as rank genes and genesets according to mutational significance. MutSig v2.0 was used to generate the results found in this report.
-
Working with individual set: THYM-TP
-
Number of patients in set: 123
The input for this pipeline is a set of individuals with the following files associated for each:
-
An annotated .maf file describing the mutations called for the respective individual, and their properties.
-
A .wig file that contains information about the coverage of the sample.
-
MAF used for this analysis:THYM-TP.final_analysis_set.maf
-
Blacklist used for this analysis: pancan_mutation_blacklist.v14.hg19.txt
-
Significantly mutated genes (q ≤ 0.1): 10
-
Mutations seen in COSMIC: 25
-
Significantly mutated genes in COSMIC territory: 3
-
Significantly mutated genesets: 80
-
Significantly mutated genesets: (excluding sig. mutated genes):0
-
Read 123 MAFs of type "maf1"
-
Total number of mutations in input MAFs: 3057
-
After removing 59 mutations outside chr1-24: 2998
-
After removing 55 blacklisted mutations: 2943
-
After removing 455 noncoding mutations: 2488
-
Number of mutations before filtering: 2488
-
After removing 192 mutations outside gene set: 2296
-
After removing 4 mutations outside category set: 2292
Table 1. Get Full Table Table representing breakdown of mutations by type.
| type | count |
|---|---|
| De_novo_Start_OutOfFrame | 1 |
| Frame_Shift_Del | 137 |
| Frame_Shift_Ins | 55 |
| In_Frame_Del | 58 |
| In_Frame_Ins | 8 |
| Missense_Mutation | 1380 |
| Nonsense_Mutation | 89 |
| Nonstop_Mutation | 5 |
| Silent | 478 |
| Splice_Site | 78 |
| Start_Codon_SNP | 2 |
| Stop_Codon_Del | 1 |
| Total | 2292 |
Table 2. Get Full Table A breakdown of mutation rates per category discovered for this individual set.
| category | n | N | rate | rate_per_mb | relative_rate | exp_ns_s_ratio |
|---|---|---|---|---|---|---|
| *CpG->T | 451 | 201268466 | 2.2e-06 | 2.2 | 4.6 | 2.1 |
| *Cp(A/C/T)->T | 254 | 1676188437 | 1.5e-07 | 0.15 | 0.31 | 1.7 |
| A->G | 201 | 1820038090 | 1.1e-07 | 0.11 | 0.23 | 2.3 |
| transver | 476 | 3697494993 | 1.3e-07 | 0.13 | 0.26 | 5 |
| indel+null | 428 | 3697494993 | 1.2e-07 | 0.12 | 0.24 | NaN |
| double_null | 4 | 3697494993 | 1.1e-09 | 0.0011 | 0.0022 | NaN |
| Total | 1814 | 3697494993 | 4.9e-07 | 0.49 | 1 | 3.5 |
The x axis represents the samples. The y axis represents the exons, one row per exon, and they are sorted by average coverage across samples. For exons with exactly the same average coverage, they are sorted next by the %GC of the exon. (The secondary sort is especially useful for the zero-coverage exons at the bottom). If the figure is unpopulated, then full coverage is assumed (e.g. MutSig CV doesn't use WIGs and assumes full coverage).
Figure 1.
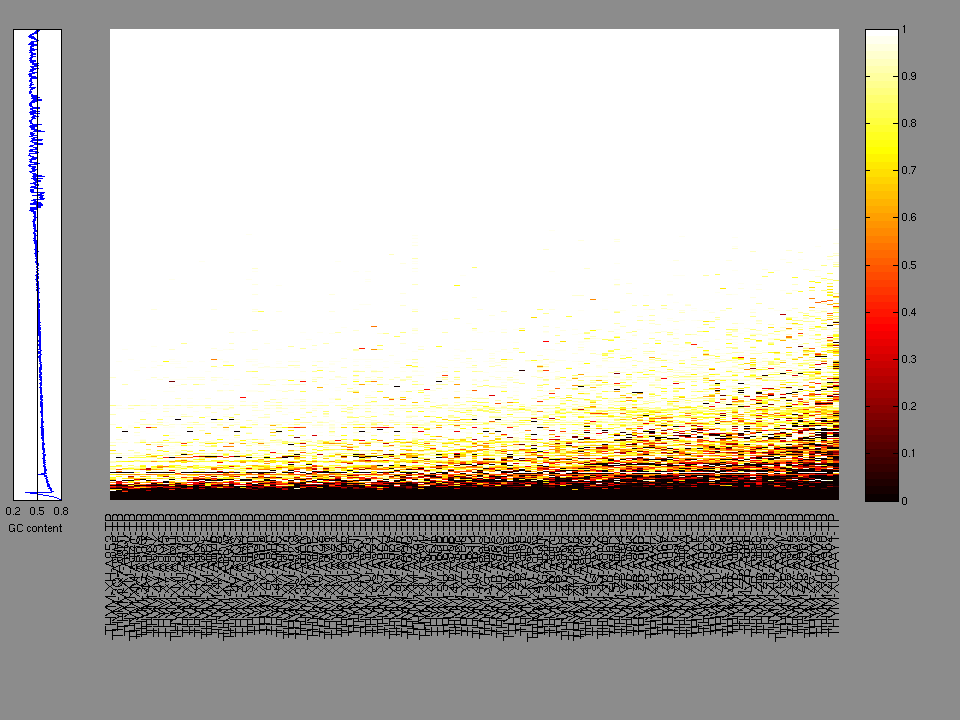
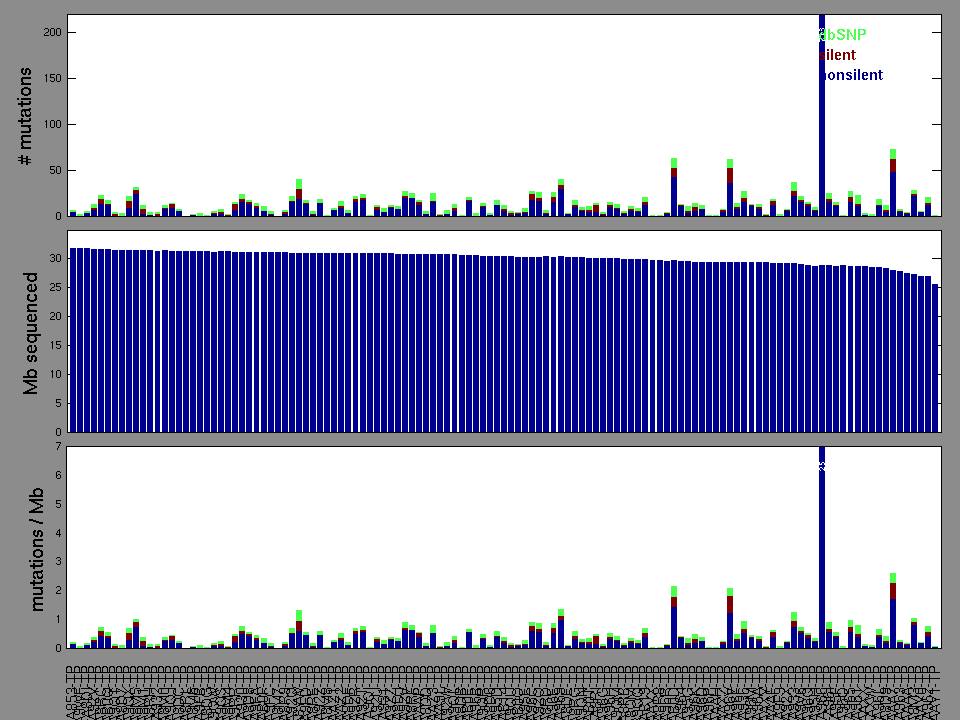
Figure 2. Patients counts and rates file used to generate this plot: THYM-TP.patients.counts_and_rates.txt
The mutation spectrum is depicted in the lego plots below in which the 96 possible mutation types are subdivided into six large blocks, color-coded to reflect the base substitution type. Each large block is further subdivided into the 16 possible pairs of 5' and 3' neighbors, as listed in the 4x4 trinucleotide context legend. The height of each block corresponds to the mutation frequency for that kind of mutation (counts of mutations normalized by the base coverage in a given bin). The shape of the spectrum is a signature for dominant mutational mechanisms in different tumor types.
Figure 3. Get High-res Image SNV Mutation rate lego plot for entire set. Each bin is normalized by base coverage for that bin. Colors represent the six SNV types on the upper right. The three-base context for each mutation is labeled in the 4x4 legend on the lower right. The fractional breakdown of SNV counts is shown in the pie chart on the upper left. If this figure is blank, not enough information was provided in the MAF to generate it.
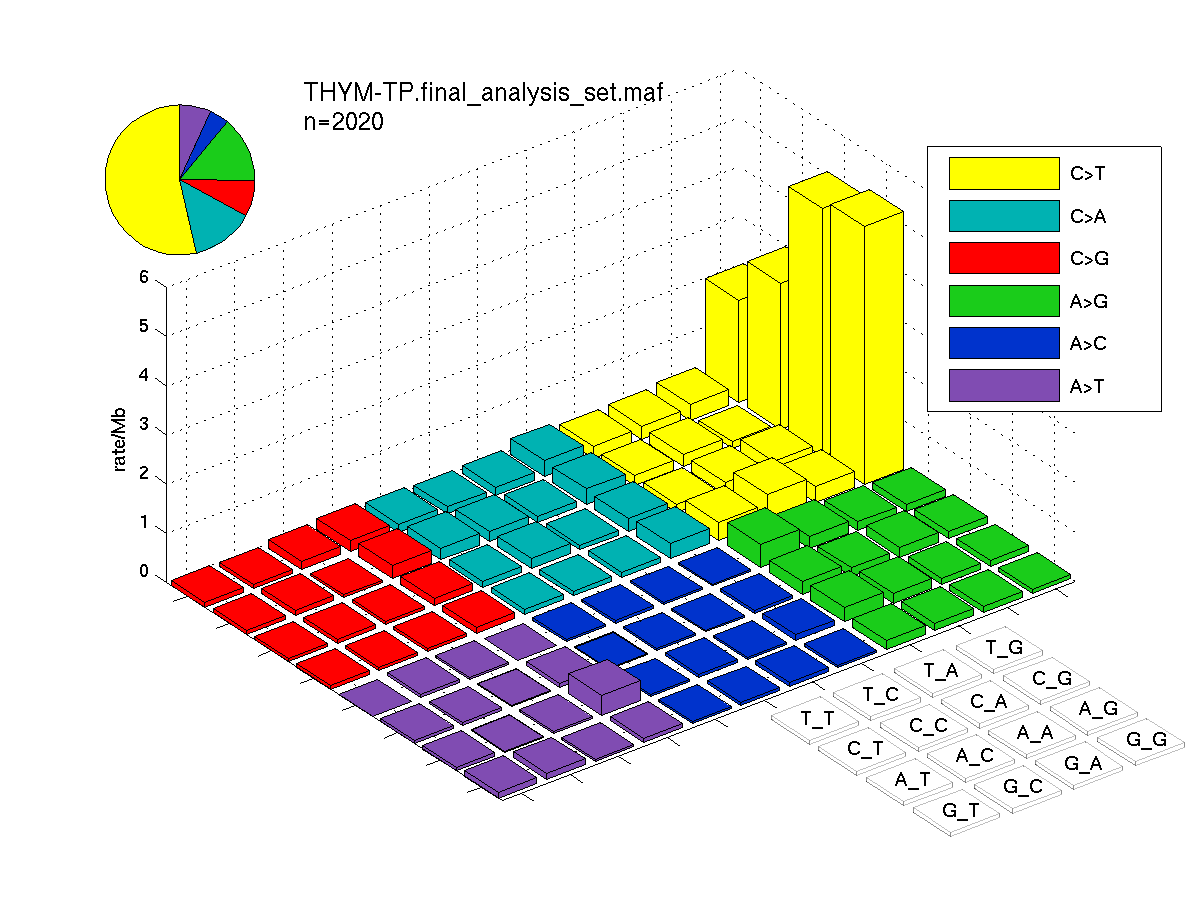
Figure 4. Get High-res Image SNV Mutation rate lego plots for 4 slices of mutation allele fraction (0<=AF<0.1, 0.1<=AF<0.25, 0.25<=AF<0.5, & 0.5<=AF) . The color code and three-base context legends are the same as the previous figure. If this figure is blank, not enough information was provided in the MAF to generate it.

Column Descriptions:
-
N = number of sequenced bases in this gene across the individual set
-
n = number of (nonsilent) mutations in this gene across the individual set
-
npat = number of patients (individuals) with at least one nonsilent mutation
-
nsite = number of unique sites having a non-silent mutation
-
nsil = number of silent mutations in this gene across the individual set
-
n1 = number of nonsilent mutations of type: *CpG->T
-
n2 = number of nonsilent mutations of type: *Cp(A/C/T)->T
-
n3 = number of nonsilent mutations of type: A->G
-
n4 = number of nonsilent mutations of type: transver
-
n5 = number of nonsilent mutations of type: indel+null
-
n6 = number of nonsilent mutations of type: double_null
-
p_classic = p-value for the observed amount of nonsilent mutations being elevated in this gene
-
p_ns_s = p-value for the observed nonsilent/silent ratio being elevated in this gene
-
p_cons = p-value for enrichment of mutations at evolutionarily most-conserved sites in gene
-
p_joint = p-value for clustering + conservation
-
p = p-value (overall)
-
q = q-value, False Discovery Rate (Benjamini-Hochberg procedure)
Table 3. Get Full Table A Ranked List of Significantly Mutated Genes. Number of significant genes found: 10. Number of genes displayed: 35. Click on a gene name to display its stick figure depicting the distribution of mutations and mutation types across the chosen gene (this feature may not be available for all significant genes).
| rank | gene | description | N | n | npat | nsite | nsil | n1 | n2 | n3 | n4 | n5 | n6 | p_classic | p_ns_s | p_clust | p_cons | p_joint | p | q |
|---|---|---|---|---|---|---|---|---|---|---|---|---|---|---|---|---|---|---|---|---|
| 1 | GTF2I | general transcription factor II, i | 269255 | 49 | 49 | 2 | 0 | 0 | 0 | 0 | 48 | 1 | 0 | <1.00e-15 | 0.00028 | 0 | 1e-06 | 0 | <1.00e-15 | <1.84e-11 |
| 2 | HRAS | v-Ha-ras Harvey rat sarcoma viral oncogene homolog | 75629 | 10 | 10 | 8 | 0 | 0 | 0 | 2 | 7 | 1 | 0 | 6.55e-15 | 0.2 | 0.017 | 0.54 | 0.035 | 8.55e-15 | 7.88e-11 |
| 3 | UNC93B1 | unc-93 homolog B1 (C. elegans) | 178091 | 5 | 5 | 2 | 0 | 0 | 5 | 0 | 0 | 0 | 0 | 9.72e-10 | 0.04 | 0.0011 | 1 | 0.0022 | 6.09e-11 | 3.74e-07 |
| 4 | CAPNS1 | calpain, small subunit 1 | 83653 | 3 | 3 | 1 | 0 | 0 | 0 | 0 | 0 | 3 | 0 | 4.73e-07 | 1 | 0.00011 | 0.7 | 0.00053 | 5.80e-09 | 2.67e-05 |
| 5 | MUC4 | mucin 4, cell surface associated | 406625 | 5 | 5 | 5 | 1 | 0 | 2 | 0 | 3 | 0 | 0 | 3.50e-08 | 0.51 | NaN | NaN | NaN | 3.50e-08 | 0.000129 |
| 6 | TP53 | tumor protein p53 | 146078 | 4 | 4 | 4 | 0 | 1 | 0 | 0 | 2 | 1 | 0 | 5.07e-07 | 0.5 | 0.034 | 0.02 | 0.015 | 1.54e-07 | 0.000473 |
| 7 | NRAS | neuroblastoma RAS viral (v-ras) oncogene homolog | 72078 | 3 | 3 | 3 | 0 | 0 | 0 | 1 | 2 | 0 | 0 | 5.75e-07 | 0.49 | 0.14 | 0.64 | 0.24 | 2.30e-06 | 0.00607 |
| 8 | BACH1 | BTB and CNC homology 1, basic leucine zipper transcription factor 1 | 258464 | 9 | 1 | 9 | 0 | 0 | 4 | 0 | 4 | 1 | 0 | 0.0478 | 0.11 | 0.000081 | 0.0037 | 0.000011 | 8.13e-06 | 0.0187 |
| 9 | ATRN | attractin | 483826 | 3 | 3 | 2 | 0 | 0 | 0 | 0 | 0 | 3 | 0 | 0.000264 | 1 | 0.00063 | 0.96 | 0.0031 | 1.23e-05 | 0.0252 |
| 10 | FOXD1 | forkhead box D1 | 75470 | 2 | 2 | 1 | 0 | 0 | 0 | 0 | 0 | 2 | 0 | 2.22e-05 | 1 | 0.02 | 0.37 | 0.082 | 2.59e-05 | 0.0478 |
| 11 | NF1 | neurofibromin 1 (neurofibromatosis, von Recklinghausen disease, Watson disease) | 1069864 | 3 | 3 | 3 | 0 | 0 | 1 | 0 | 1 | 1 | 0 | 0.00363 | 0.49 | 0.019 | 0.054 | 0.0074 | 0.000311 | 0.522 |
| 12 | OPALIN | oligodendrocytic myelin paranodal and inner loop protein | 56820 | 1 | 1 | 1 | 0 | 1 | 0 | 0 | 0 | 0 | 0 | 0.000386 | 0.67 | NaN | NaN | NaN | 0.000386 | 0.592 |
| 13 | REG1A | regenerating islet-derived 1 alpha (pancreatic stone protein, pancreatic thread protein) | 64043 | 1 | 1 | 1 | 0 | 1 | 0 | 0 | 0 | 0 | 0 | 0.000452 | 0.86 | NaN | NaN | NaN | 0.000452 | 0.641 |
| 14 | TMEM63B | transmembrane protein 63B | 283908 | 2 | 2 | 2 | 0 | 0 | 1 | 0 | 0 | 1 | 0 | 0.00128 | 0.52 | 0.75 | 0.011 | 0.034 | 0.000487 | 0.641 |
| 15 | CEBPA | CCAAT/enhancer binding protein (C/EBP), alpha | 41139 | 2 | 2 | 2 | 0 | 0 | 0 | 0 | 0 | 2 | 0 | 5.74e-05 | 1 | 0.83 | 0.79 | 1 | 0.000618 | 0.702 |
| 16 | LGALS3BP | lectin, galactoside-binding, soluble, 3 binding protein | 188150 | 2 | 2 | 2 | 0 | 0 | 1 | 0 | 1 | 0 | 0 | 0.000199 | 0.43 | 0.083 | 0.57 | 0.29 | 0.000624 | 0.702 |
| 17 | MUC21 | mucin 21, cell surface associated | 207776 | 2 | 2 | 1 | 1 | 0 | 0 | 2 | 0 | 0 | 0 | 0.000181 | 0.79 | 0.0099 | 0.94 | 0.35 | 0.000675 | 0.702 |
| 18 | KRTAP4-8 | keratin associated protein 4-8 | 69125 | 2 | 2 | 2 | 0 | 0 | 0 | 0 | 1 | 1 | 0 | 0.000119 | 0.86 | 0.14 | 0.58 | 0.54 | 0.000685 | 0.702 |
| 19 | CCL25 | chemokine (C-C motif) ligand 25 | 57624 | 1 | 1 | 1 | 0 | 0 | 0 | 1 | 0 | 0 | 0 | 0.000816 | 0.79 | NaN | NaN | NaN | 0.000816 | 0.792 |
| 20 | GAGE13 | G antigen 13 | 16895 | 1 | 1 | 1 | 0 | 0 | 0 | 0 | 0 | 1 | 0 | 0.00105 | 1 | NaN | NaN | NaN | 0.00105 | 0.967 |
| 21 | KRAS | v-Ki-ras2 Kirsten rat sarcoma viral oncogene homolog | 86652 | 1 | 1 | 1 | 0 | 0 | 1 | 0 | 0 | 0 | 0 | 0.00135 | 0.73 | NaN | NaN | NaN | 0.00135 | 1.000 |
| 22 | OR2D2 | olfactory receptor, family 2, subfamily D, member 2 | 112327 | 1 | 1 | 1 | 0 | 1 | 0 | 0 | 0 | 0 | 0 | 0.00148 | 0.76 | NaN | NaN | NaN | 0.00148 | 1.000 |
| 23 | CCDC3 | coiled-coil domain containing 3 | 79577 | 1 | 1 | 1 | 0 | 0 | 0 | 0 | 1 | 0 | 0 | 0.00149 | 0.84 | NaN | NaN | NaN | 0.00149 | 1.000 |
| 24 | FNBP4 | formin binding protein 4 | 356486 | 2 | 2 | 1 | 0 | 0 | 0 | 0 | 0 | 2 | 0 | 0.000868 | 1 | 0.01 | 0.11 | 0.19 | 0.00157 | 1.000 |
| 25 | BCOR | BCL6 co-repressor | 575158 | 3 | 3 | 3 | 1 | 0 | 0 | 0 | 1 | 1 | 1 | 0.000261 | 0.79 | 0.91 | 0.26 | 0.67 | 0.00169 | 1.000 |
| 26 | MED6 | mediator complex subunit 6 | 94787 | 1 | 1 | 1 | 0 | 0 | 1 | 0 | 0 | 0 | 0 | 0.00185 | 0.72 | NaN | NaN | NaN | 0.00185 | 1.000 |
| 27 | OCIAD2 | OCIA domain containing 2 | 60147 | 1 | 1 | 1 | 0 | 0 | 0 | 0 | 1 | 0 | 0 | 0.00186 | 0.86 | NaN | NaN | NaN | 0.00186 | 1.000 |
| 28 | EIF1AX | eukaryotic translation initiation factor 1A, X-linked | 56920 | 1 | 1 | 1 | 0 | 0 | 0 | 1 | 0 | 0 | 0 | 0.00197 | 0.64 | NaN | NaN | NaN | 0.00197 | 1.000 |
| 29 | NUDCD2 | NudC domain containing 2 | 59811 | 1 | 1 | 1 | 0 | 0 | 0 | 0 | 0 | 1 | 0 | 0.00213 | 1 | NaN | NaN | NaN | 0.00213 | 1.000 |
| 30 | SF3B1 | splicing factor 3b, subunit 1, 155kDa | 494214 | 2 | 2 | 1 | 1 | 0 | 0 | 2 | 0 | 0 | 0 | 0.00188 | 0.73 | 0.01 | 0.17 | 0.12 | 0.00214 | 1.000 |
| 31 | OR4C3 | olfactory receptor, family 4, subfamily C, member 3 | 122004 | 1 | 1 | 1 | 0 | 0 | 1 | 0 | 0 | 0 | 0 | 0.00215 | 0.6 | NaN | NaN | NaN | 0.00215 | 1.000 |
| 32 | LBH | limb bud and heart development homolog (mouse) | 39703 | 1 | 1 | 1 | 0 | 0 | 0 | 1 | 0 | 0 | 0 | 0.00215 | 0.82 | NaN | NaN | NaN | 0.00215 | 1.000 |
| 33 | RPL23A | ribosomal protein L23a | 59582 | 1 | 1 | 1 | 0 | 0 | 0 | 1 | 0 | 0 | 0 | 0.00222 | 0.73 | NaN | NaN | NaN | 0.00222 | 1.000 |
| 34 | CIRBP | cold inducible RNA binding protein | 56211 | 1 | 1 | 1 | 0 | 0 | 1 | 0 | 0 | 0 | 0 | 0.00225 | 0.64 | NaN | NaN | NaN | 0.00225 | 1.000 |
| 35 | PRB2 | proline-rich protein BstNI subfamily 2 | 155338 | 1 | 1 | 1 | 0 | 1 | 0 | 0 | 0 | 0 | 0 | 0.00229 | 1 | NaN | NaN | NaN | 0.00229 | 1.000 |
Figure S1. This figure depicts the distribution of mutations and mutation types across the GTF2I significant gene.
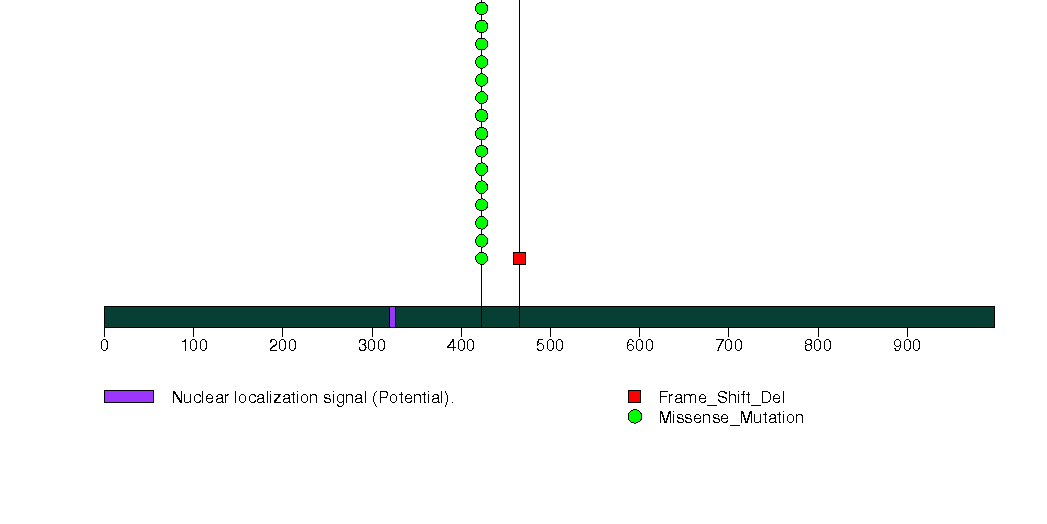
Figure S2. This figure depicts the distribution of mutations and mutation types across the HRAS significant gene.
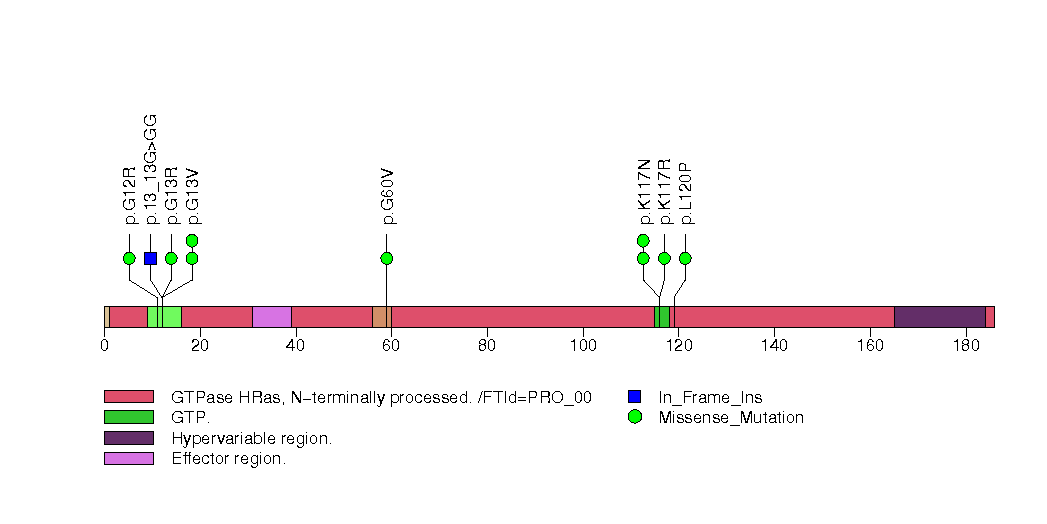
Figure S3. This figure depicts the distribution of mutations and mutation types across the UNC93B1 significant gene.
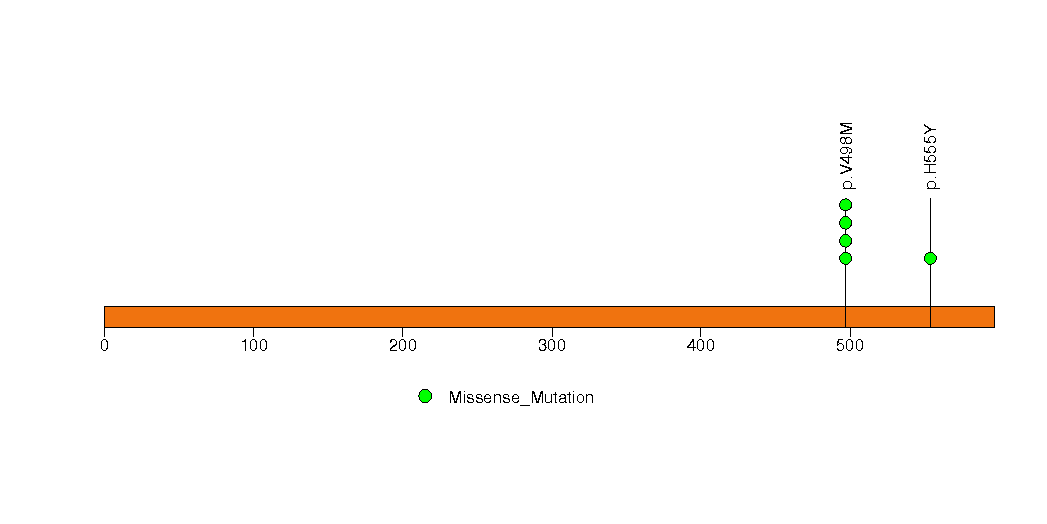
Figure S4. This figure depicts the distribution of mutations and mutation types across the CAPNS1 significant gene.
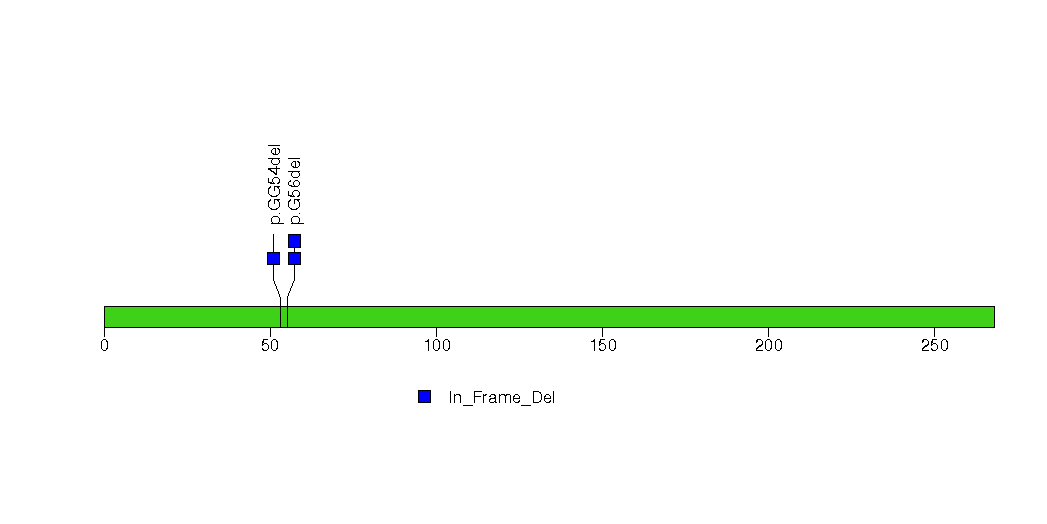
Figure S5. This figure depicts the distribution of mutations and mutation types across the MUC4 significant gene.
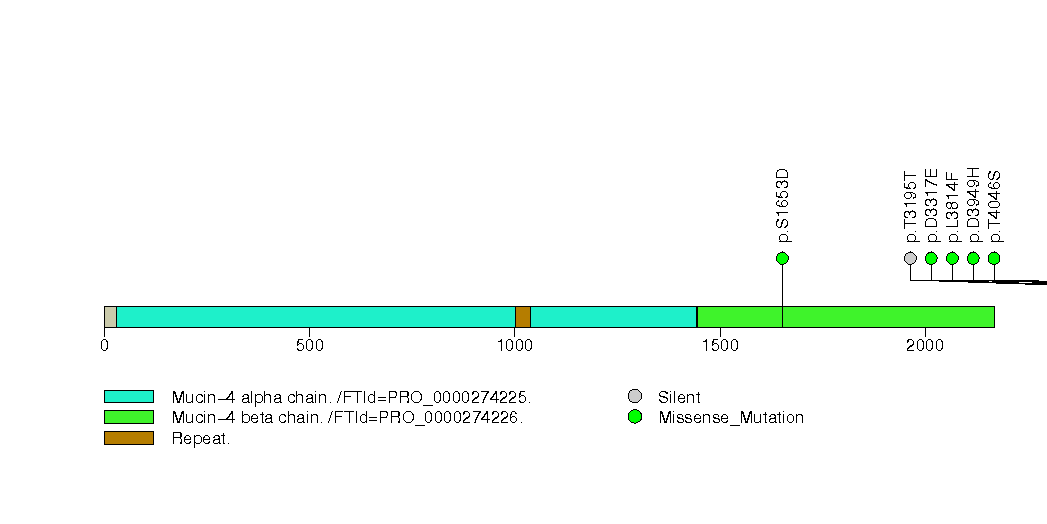
Figure S6. This figure depicts the distribution of mutations and mutation types across the TP53 significant gene.
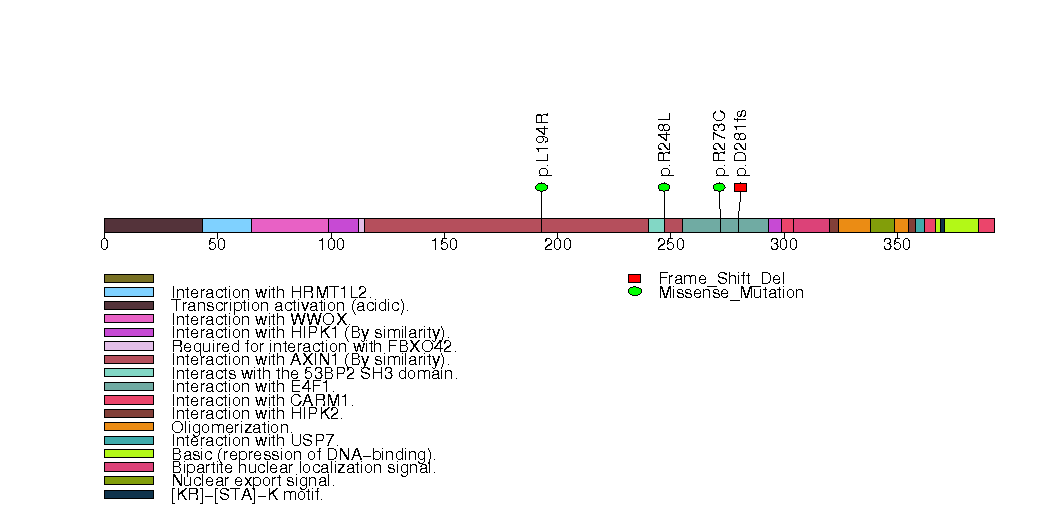
Figure S7. This figure depicts the distribution of mutations and mutation types across the NRAS significant gene.
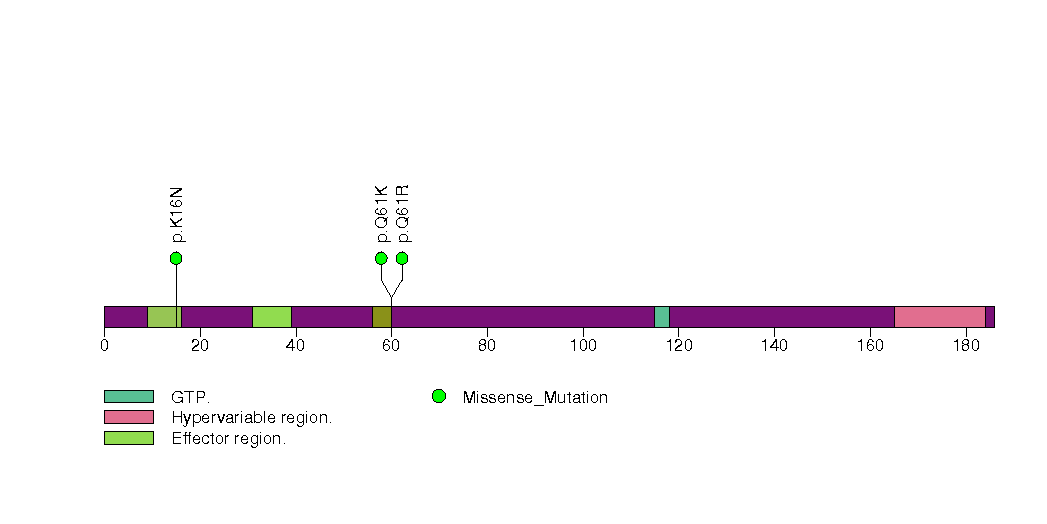
Figure S8. This figure depicts the distribution of mutations and mutation types across the BACH1 significant gene.
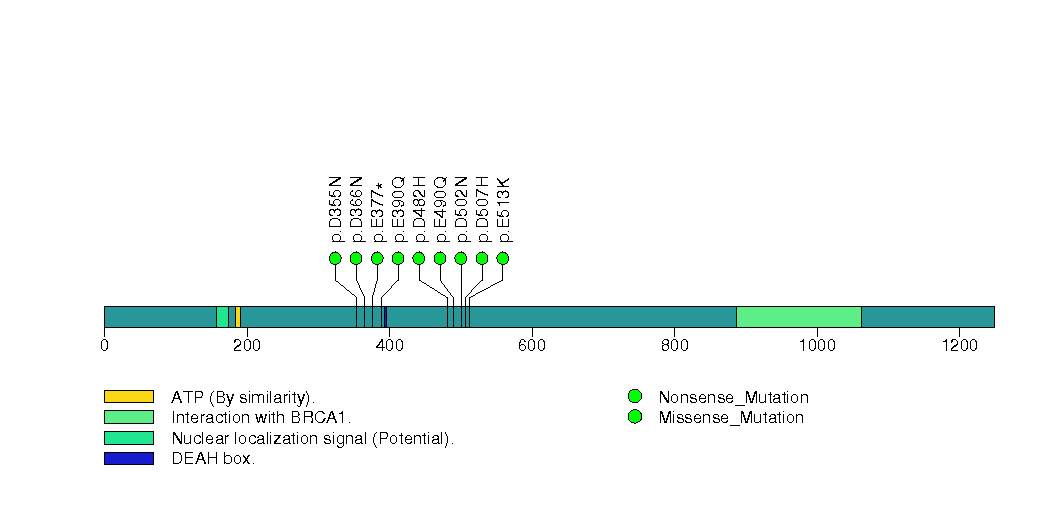
Figure S9. This figure depicts the distribution of mutations and mutation types across the ATRN significant gene.
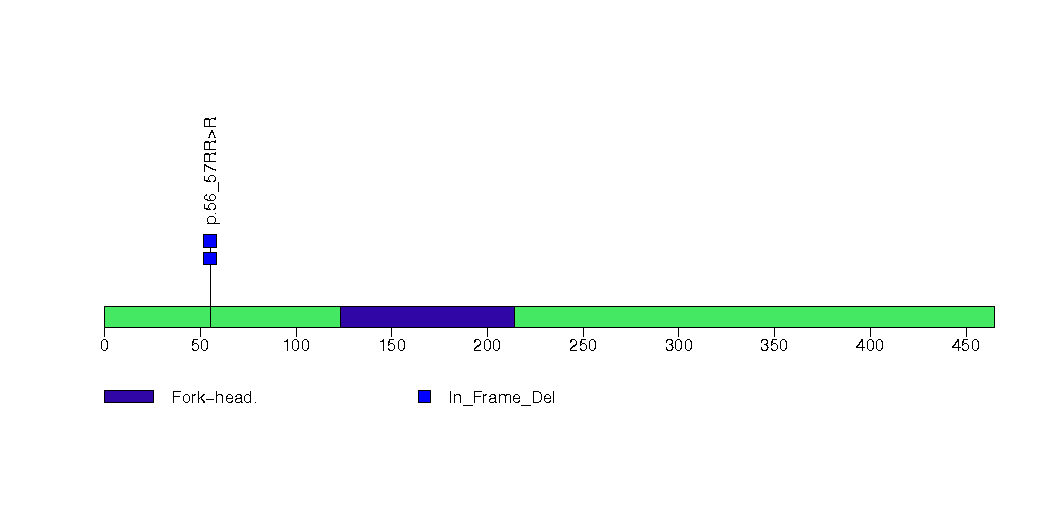
Figure S10. This figure depicts the distribution of mutations and mutation types across the FOXD1 significant gene.
In this analysis, COSMIC is used as a filter to increase power by restricting the territory of each gene. Cosmic version: v48.
Table 4. Get Full Table Significantly mutated genes (COSMIC territory only). To access the database please go to: COSMIC. Number of significant genes found: 3. Number of genes displayed: 10
| rank | gene | description | n | cos | n_cos | N_cos | cos_ev | p | q |
|---|---|---|---|---|---|---|---|---|---|
| 1 | HRAS | v-Ha-ras Harvey rat sarcoma viral oncogene homolog | 10 | 19 | 9 | 2337 | 887 | 0 | 0 |
| 2 | NRAS | neuroblastoma RAS viral (v-ras) oncogene homolog | 3 | 33 | 3 | 4059 | 2597 | 1.3e-09 | 3e-06 |
| 3 | TP53 | tumor protein p53 | 4 | 356 | 4 | 43788 | 2290 | 8.7e-09 | 0.000013 |
| 4 | IDH1 | isocitrate dehydrogenase 1 (NADP+), soluble | 1 | 5 | 1 | 615 | 1492 | 0.0003 | 0.34 |
| 5 | AXL | AXL receptor tyrosine kinase | 2 | 7 | 1 | 861 | 1 | 0.00042 | 0.38 |
| 6 | CYLD | cylindromatosis (turban tumor syndrome) | 2 | 18 | 1 | 2214 | 1 | 0.0011 | 0.82 |
| 7 | PRKDC | protein kinase, DNA-activated, catalytic polypeptide | 1 | 22 | 1 | 2706 | 1 | 0.0013 | 0.86 |
| 8 | KRAS | v-Ki-ras2 Kirsten rat sarcoma viral oncogene homolog | 1 | 52 | 1 | 6396 | 14604 | 0.0031 | 1 |
| 9 | KIT | v-kit Hardy-Zuckerman 4 feline sarcoma viral oncogene homolog | 1 | 240 | 1 | 29520 | 467 | 0.014 | 1 |
| 10 | CDKN2A | cyclin-dependent kinase inhibitor 2A (melanoma, p16, inhibits CDK4) | 1 | 332 | 1 | 40836 | 24 | 0.02 | 1 |
Note:
n - number of (nonsilent) mutations in this gene across the individual set.
cos = number of unique mutated sites in this gene in COSMIC
n_cos = overlap between n and cos.
N_cos = number of individuals times cos.
cos_ev = total evidence: number of reports in COSMIC for mutations seen in this gene.
p = p-value for seeing the observed amount of overlap in this gene)
q = q-value, False Discovery Rate (Benjamini-Hochberg procedure)
Table 5. Get Full Table A Ranked List of Significantly Mutated Genesets. (Source: MSigDB GSEA Cannonical Pathway Set).Number of significant genesets found: 80. Number of genesets displayed: 10
| rank | geneset | description | genes | N_genes | mut_tally | N | n | npat | nsite | nsil | n1 | n2 | n3 | n4 | n5 | n6 | p_ns_s | p | q |
|---|---|---|---|---|---|---|---|---|---|---|---|---|---|---|---|---|---|---|---|
| 1 | HSA03022_BASAL_TRANSCRIPTION_FACTORS | Genes involved in basal transcription factors | GTF2A1, GTF2A1L, GTF2A2, GTF2B, GTF2E1, GTF2E2, GTF2F1, GTF2F2, GTF2H1, GTF2H2, GTF2H3, GTF2H4, GTF2I, GTF2IRD1, LOC391764, STON1, TAF1, TAF10, TAF12, TAF13, TAF1L, TAF2, TAF4, TAF4B, TAF5, TAF5L, TAF6, TAF6L, TAF7, TAF7L, TAF9, TAF9B, TBPL1, TBPL2 | 33 | GTF2B(1), GTF2F1(1), GTF2I(49), TAF1L(1) | 6593929 | 52 | 51 | 5 | 0 | 1 | 0 | 1 | 49 | 1 | 0 | 0.000085 | 4.9e-15 | 3e-12 |
| 2 | RASPATHWAY | Ras activation stimulates many signaling cascades, including PI3K/AKT activation to inhibit apoptosis. | AKT1, ARHA, BAD, BCL2L1, CASP9, CDC42, CHUK, ELK1, H2AFX, HRAS, MAP2K1, MAPK3, MLLT7, NFKB1, PIK3CA, PIK3R1, RAC1, RAF1, RALA, RALBP1, RALGDS, RELA, RHOA | 21 | AKT1(1), HRAS(10), MAP2K1(1), PIK3R1(2), RALA(1) | 3578670 | 15 | 15 | 13 | 1 | 0 | 1 | 3 | 8 | 3 | 0 | 0.14 | 3.7e-12 | 1.1e-09 |
| 3 | LONGEVITYPATHWAY | Caloric restriction in animals often increases lifespan, which may occur via decreased IGF receptor expression and consequent expression of stress-resistance proteins. | AKT1, CAT, FOXO3A, GH1, GHR, HRAS, IGF1, IGF1R, PIK3CA, PIK3R1, SHC1, SOD1, SOD2, SOD3 | 12 | AKT1(1), HRAS(10), PIK3R1(2) | 2360634 | 13 | 13 | 11 | 0 | 0 | 1 | 2 | 7 | 3 | 0 | 0.06 | 6.4e-12 | 1.3e-09 |
| 4 | IGF1RPATHWAY | Insulin-like growth factor receptor IGF-1R promotes cell growth and inhibits apoptosis on binding of ligands IGF-1 and 2 via Ras activation and the AKT pathway. | AKT1, BAD, GRB2, HRAS, IGF1R, IRS1, MAP2K1, MAPK1, MAPK3, PIK3CA, PIK3R1, RAF1, SHC1, SOS1, YWHAH | 15 | AKT1(1), HRAS(10), IRS1(1), MAP2K1(1), PIK3R1(2) | 3422142 | 15 | 15 | 13 | 0 | 0 | 1 | 2 | 8 | 4 | 0 | 0.047 | 2e-11 | 3.1e-09 |
| 5 | TRKAPATHWAY | Nerve growth factor (NGF) promotes neuronal survival and proliferation by binding its receptor TrkA, which activates PI3K/AKT, Ras, and the MAP kinase pathway. | AKT1, DPM2, GRB2, HRAS, KLK2, NGFB, NTRK1, PIK3CA, PIK3R1, PLCG1, PRKCA, PRKCB1, SHC1, SOS1 | 12 | AKT1(1), HRAS(10), PIK3R1(2) | 2748870 | 13 | 13 | 11 | 0 | 0 | 1 | 2 | 7 | 3 | 0 | 0.059 | 3.6e-11 | 4.3e-09 |
| 6 | CDK5PATHWAY | Cdk5, a regulatory kinase implicated in neuronal development, represses Mek1, which downregulates the MAP kinase pathway. | CDK5, CDK5R1, DPM2, EGR1, HRAS, KLK2, MAP2K1, MAP2K2, MAPK1, MAPK3, NGFB, NGFR, RAF1 | 12 | HRAS(10), MAP2K1(1) | 1503463 | 11 | 11 | 9 | 0 | 0 | 0 | 2 | 8 | 1 | 0 | 0.13 | 4.2e-11 | 4.3e-09 |
| 7 | RACCYCDPATHWAY | Ras, Rac, and Rho coordinate to induce cyclin D1 expression and activate cdk2 to promote the G1/S transition. | AKT1, ARHA, CCND1, CCNE1, CDK2, CDK4, CDK6, CDKN1A, CDKN1B, E2F1, HRAS, MAPK1, MAPK3, NFKB1, NFKBIA, PAK1, PIK3CA, PIK3R1, RAC1, RAF1, RB1, RELA, TFDP1 | 22 | AKT1(1), CDK6(1), HRAS(10), PIK3R1(2) | 3678499 | 14 | 14 | 12 | 0 | 0 | 2 | 2 | 7 | 3 | 0 | 0.035 | 5.6e-11 | 5e-09 |
| 8 | RECKPATHWAY | RECK is a membrane-anchored inhibitor of matrix metalloproteinases, which are expressed by tumor cells and promote metastasis. | HRAS, MMP14, MMP2, MMP9, RECK, TIMP1, TIMP2, TIMP3, TIMP4 | 9 | HRAS(10), TIMP3(1) | 1366578 | 11 | 11 | 9 | 0 | 0 | 0 | 2 | 7 | 2 | 0 | 0.11 | 6.5e-11 | 5e-09 |
| 9 | GLEEVECPATHWAY | The drug Gleevec specifically targets the abnormal bcr-abl protein, an apoptosis inhibitor present in chronic myeloid leukemia. | AKT1, BCL2, BCR, CRKL, FOS, GRB2, HRAS, JAK2, JUN, MAP2K1, MAP2K4, MAP3K1, MAPK3, MAPK8, MYC, PIK3CA, PIK3R1, RAF1, SOS1, STAT1, STAT5A, STAT5B | 22 | AKT1(1), HRAS(10), MAP2K1(1), MAP3K1(1), PIK3R1(2), STAT5B(1) | 5136298 | 16 | 16 | 14 | 0 | 0 | 1 | 3 | 9 | 3 | 0 | 0.03 | 1.8e-10 | 1.2e-08 |
| 10 | PMLPATHWAY | Ring-shaped PML nuclear bodies regulate transcription and are required co-activators in p53- and DAXX-mediated apoptosis. | CREBBP, DAXX, HRAS, PAX3, PML, PRAM-1, RARA, RB1, SIRT1, SP100, TNF, TNFRSF1A, TNFRSF1B, TNFRSF6, TNFSF6, TP53, UBL1 | 13 | HRAS(10), TP53(4) | 3285463 | 14 | 14 | 12 | 0 | 1 | 0 | 2 | 9 | 2 | 0 | 0.065 | 2e-10 | 1.3e-08 |
Table 6. Get Full Table A Ranked List of Significantly Mutated Genesets (Excluding Significantly Mutated Genes). Number of significant genesets found: 0. Number of genesets displayed: 10
| rank | geneset | description | genes | N_genes | mut_tally | N | n | npat | nsite | nsil | n1 | n2 | n3 | n4 | n5 | n6 | p_ns_s | p | q |
|---|---|---|---|---|---|---|---|---|---|---|---|---|---|---|---|---|---|---|---|
| 1 | BADPATHWAY | When phosphorylated, BAD is inhibited by sequestration; when non-phosphorylated, it promotes apoptosis by inactivating pro-survival BCL-XL and BCL-2. | ADCY1, AKT1, BAD, BAX, BCL2, BCL2L1, CSF2RB, IGF1, IGF1R, IL3, IL3RA, KIT, KITLG, PIK3CA, PIK3R1, PRKACB, PRKACG, PRKAR1A, PRKAR1B, PRKAR2A, PRKAR2B, YWHAH | 22 | AKT1(1), CSF2RB(1), KIT(1), PIK3R1(2), PRKAR2B(1) | 3947301 | 6 | 6 | 6 | 0 | 1 | 1 | 0 | 2 | 2 | 0 | 0.17 | 0.002 | 0.5 |
| 2 | RASPATHWAY | Ras activation stimulates many signaling cascades, including PI3K/AKT activation to inhibit apoptosis. | AKT1, ARHA, BAD, BCL2L1, CASP9, CDC42, CHUK, ELK1, H2AFX, HRAS, MAP2K1, MAPK3, MLLT7, NFKB1, PIK3CA, PIK3R1, RAC1, RAF1, RALA, RALBP1, RALGDS, RELA, RHOA | 20 | AKT1(1), MAP2K1(1), PIK3R1(2), RALA(1) | 3503041 | 5 | 5 | 5 | 1 | 0 | 1 | 1 | 1 | 2 | 0 | 0.58 | 0.0026 | 0.5 |
| 3 | HCMVPATHWAY | Cytomegalovirus activates MAP kinase pathways in the host cell, inducing transcription of viral genes. | AKT1, CREB1, MAP2K1, MAP2K2, MAP2K3, MAP2K6, MAP3K1, MAPK1, MAPK14, MAPK3, NFKB1, PIK3CA, PIK3R1, RB1, RELA, SP1 | 16 | AKT1(1), MAP2K1(1), MAP3K1(1), PIK3R1(2) | 3586945 | 5 | 5 | 5 | 0 | 0 | 1 | 1 | 1 | 2 | 0 | 0.24 | 0.0027 | 0.5 |
| 4 | NFATPATHWAY | Cardiac hypertrophy is induced by NF-ATc4 and GATA4, which are stimulated through calcineurin activated by CaMK. | ACTA1, AGT, AKT1, CALM1, CALM2, CALM3, CALR, CAMK1, CAMK1G, CAMK4, CREBBP, CSNK1A1, CTF1, DTR, EDN1, ELSPBP1, F2, FGF2, FKBP1A, GATA4, GSK3B, HAND1, HAND2, HRAS, IGF1, LIF, MAP2K1, MAPK1, MAPK14, MAPK3, MAPK8, MEF2C, MYH2, NFATC1, NFATC2, NFATC3, NFATC4, NKX2-5, NPPA, PIK3CA, PIK3R1, PPP3CA, PPP3CB, PPP3CC, PRKACB, PRKACG, PRKAR1A, PRKAR1B, PRKAR2A, PRKAR2B, RAF1, RPS6KB1, SYT1 | 51 | AKT1(1), CALM3(1), HAND2(1), MAP2K1(1), NFATC1(1), NFATC4(1), NKX2-5(1), PIK3R1(2), PRKAR2B(1) | 8869101 | 10 | 9 | 10 | 0 | 2 | 2 | 0 | 2 | 4 | 0 | 0.078 | 0.0033 | 0.5 |
| 5 | CTLA4PATHWAY | T cell activation requires interaction with an antigen-MHC-I complex on an antigen-presenting cell (APC), as well as CD28 interaction with the APC's CD80 or 86. | CD28, CD3D, CD3E, CD3G, CD3Z, CD80, CD86, CTLA4, GRB2, HLA-DRA, HLA-DRB1, ICOS, ICOSL, IL2, ITK, LCK, PIK3CA, PIK3R1, PTPN11, TRA@, TRB@ | 17 | CD3E(1), HLA-DRB1(1), PIK3R1(2) | 2330360 | 4 | 4 | 4 | 0 | 0 | 0 | 0 | 1 | 3 | 0 | 0.54 | 0.004 | 0.5 |
| 6 | MTORPATHWAY | Mammalian target of rapamycin (mTOR) senses mitogenic factors and nutrients, including ATP, and induces cell proliferation. | AKT1, EIF3S10, EIF4A1, EIF4A2, EIF4B, EIF4E, EIF4EBP1, EIF4G1, EIF4G2, EIF4G3, FKBP1A, FRAP1, MKNK1, PDK2, PDPK1, PIK3CA, PIK3R1, PPP2CA, PTEN, RPS6, RPS6KB1, TSC1, TSC2 | 21 | AKT1(1), EIF4G3(1), MKNK1(1), PIK3R1(2), TSC2(1) | 5043319 | 6 | 6 | 6 | 0 | 0 | 2 | 0 | 0 | 4 | 0 | 0.22 | 0.0067 | 0.59 |
| 7 | GLEEVECPATHWAY | The drug Gleevec specifically targets the abnormal bcr-abl protein, an apoptosis inhibitor present in chronic myeloid leukemia. | AKT1, BCL2, BCR, CRKL, FOS, GRB2, HRAS, JAK2, JUN, MAP2K1, MAP2K4, MAP3K1, MAPK3, MAPK8, MYC, PIK3CA, PIK3R1, RAF1, SOS1, STAT1, STAT5A, STAT5B | 21 | AKT1(1), MAP2K1(1), MAP3K1(1), PIK3R1(2), STAT5B(1) | 5060669 | 6 | 6 | 6 | 0 | 0 | 1 | 1 | 2 | 2 | 0 | 0.2 | 0.0068 | 0.59 |
| 8 | IGF1RPATHWAY | Insulin-like growth factor receptor IGF-1R promotes cell growth and inhibits apoptosis on binding of ligands IGF-1 and 2 via Ras activation and the AKT pathway. | AKT1, BAD, GRB2, HRAS, IGF1R, IRS1, MAP2K1, MAPK1, MAPK3, PIK3CA, PIK3R1, RAF1, SHC1, SOS1, YWHAH | 14 | AKT1(1), IRS1(1), MAP2K1(1), PIK3R1(2) | 3346513 | 5 | 5 | 5 | 0 | 0 | 1 | 0 | 1 | 3 | 0 | 0.33 | 0.0087 | 0.67 |
| 9 | BBCELLPATHWAY | Fas ligand expression by T cells induces apoptosis in Fas-expressing, inactive B cells. | CD28, CD4, HLA-DRA, HLA-DRB1, TNFRSF5, TNFRSF6, TNFSF5, TNFSF6 | 4 | CD4(1), HLA-DRB1(1) | 427975 | 2 | 2 | 2 | 0 | 0 | 0 | 0 | 0 | 2 | 0 | 1 | 0.011 | 0.69 |
| 10 | RACCYCDPATHWAY | Ras, Rac, and Rho coordinate to induce cyclin D1 expression and activate cdk2 to promote the G1/S transition. | AKT1, ARHA, CCND1, CCNE1, CDK2, CDK4, CDK6, CDKN1A, CDKN1B, E2F1, HRAS, MAPK1, MAPK3, NFKB1, NFKBIA, PAK1, PIK3CA, PIK3R1, RAC1, RAF1, RB1, RELA, TFDP1 | 21 | AKT1(1), CDK6(1), PIK3R1(2) | 3602870 | 4 | 4 | 4 | 0 | 0 | 2 | 0 | 0 | 2 | 0 | 0.25 | 0.012 | 0.69 |
In brief, we tabulate the number of mutations and the number of covered bases for each gene. The counts are broken down by mutation context category: four context categories that are discovered by MutSig, and one for indel and 'null' mutations, which include indels, nonsense mutations, splice-site mutations, and non-stop (read-through) mutations. For each gene, we calculate the probability of seeing the observed constellation of mutations, i.e. the product P1 x P2 x ... x Pm, or a more extreme one, given the background mutation rates calculated across the dataset. [1]
In addition to the links below, the full results of the analysis summarized in this report can also be downloaded programmatically using firehose_get, or interactively from either the Broad GDAC website or TCGA Data Coordination Center Portal.