This pipeline computes the correlation between significant copy number variation (cnv focal) genes and selected clinical features.
Testing the association between copy number variation 101 focal events and 4 clinical features across 539 patients, 255 significant findings detected with Q value < 0.25.
-
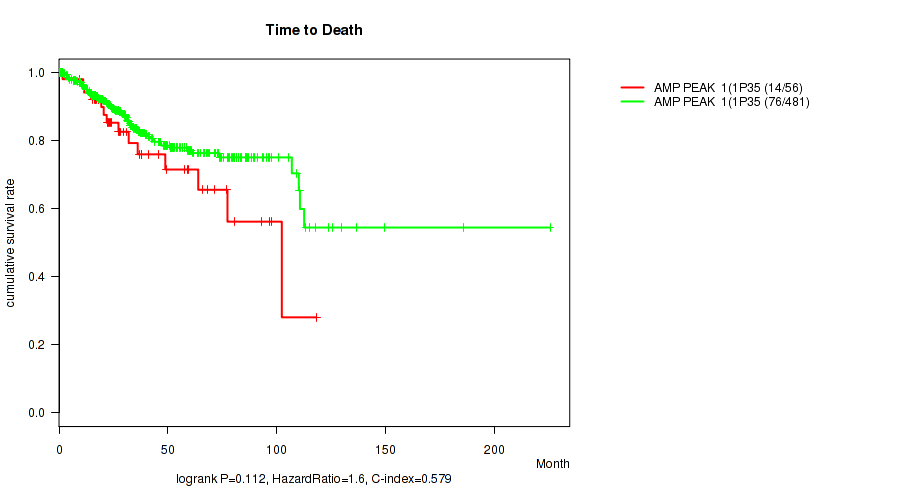
amp_1p35.2 cnv correlated to 'Time to Death' and 'HISTOLOGICAL_TYPE'.
-
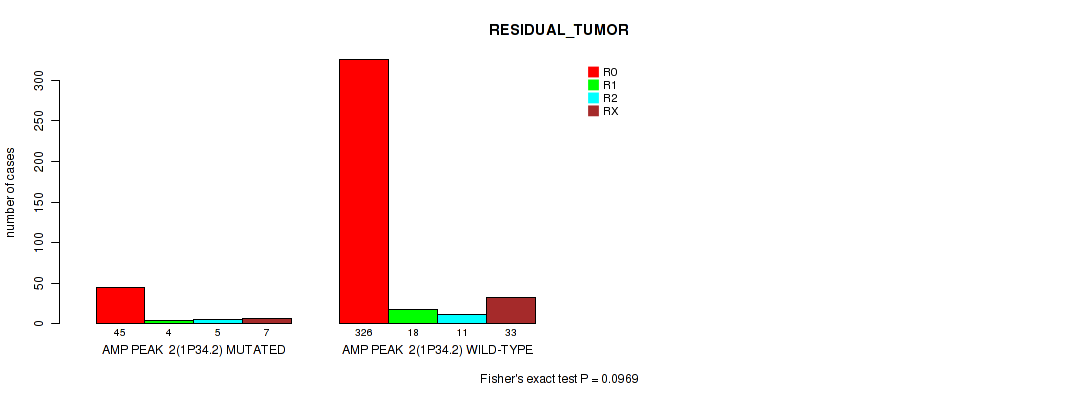
amp_1p34.2 cnv correlated to 'Time to Death', 'HISTOLOGICAL_TYPE', and 'RESIDUAL_TUMOR'.
-
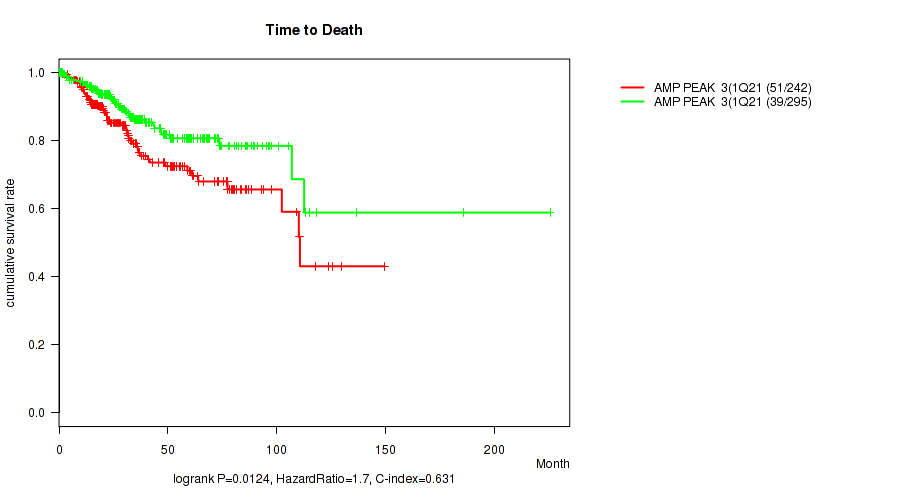
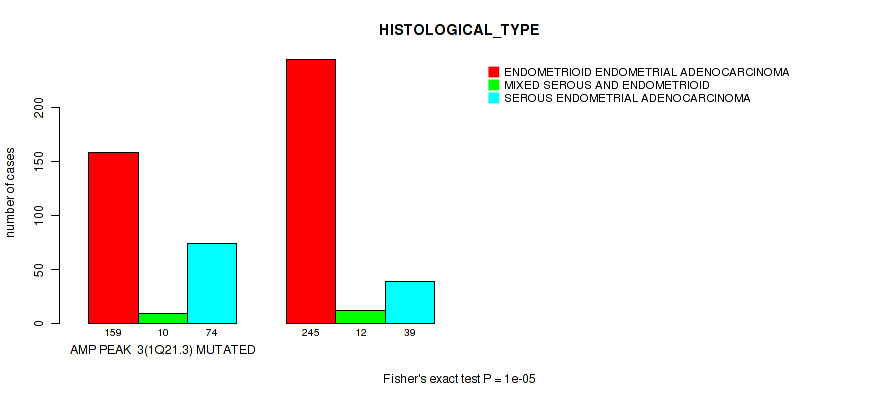
amp_1q21.3 cnv correlated to 'Time to Death' and 'HISTOLOGICAL_TYPE'.
-
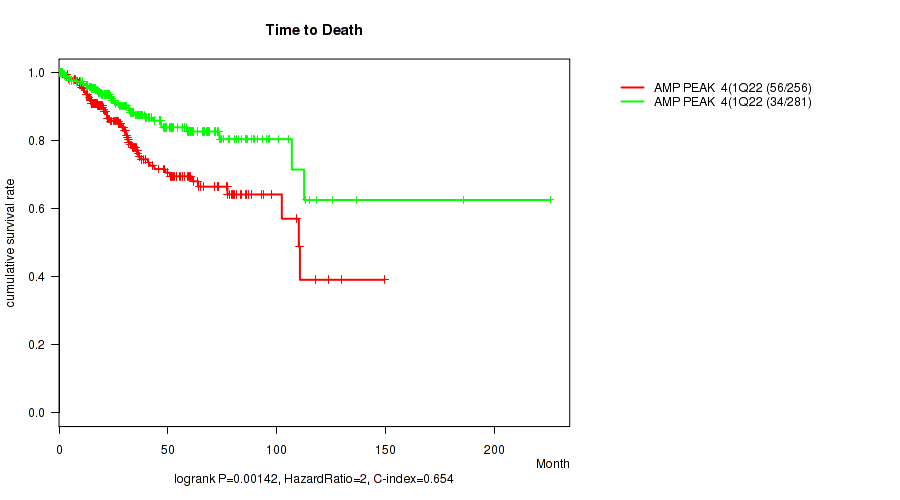
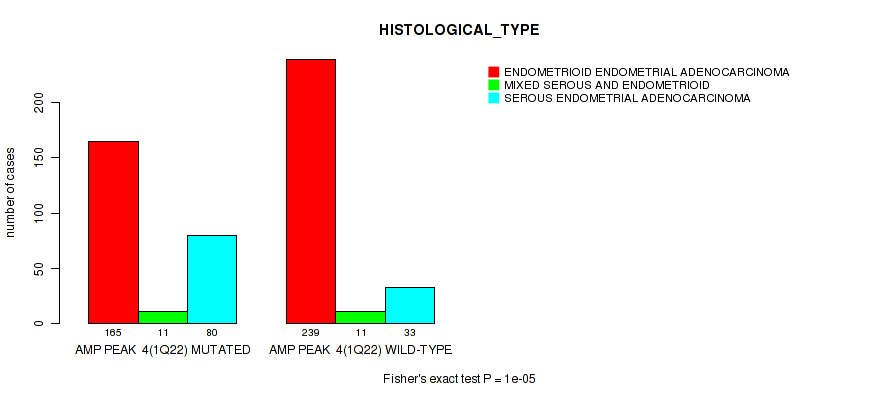
amp_1q22 cnv correlated to 'Time to Death' and 'HISTOLOGICAL_TYPE'.
-
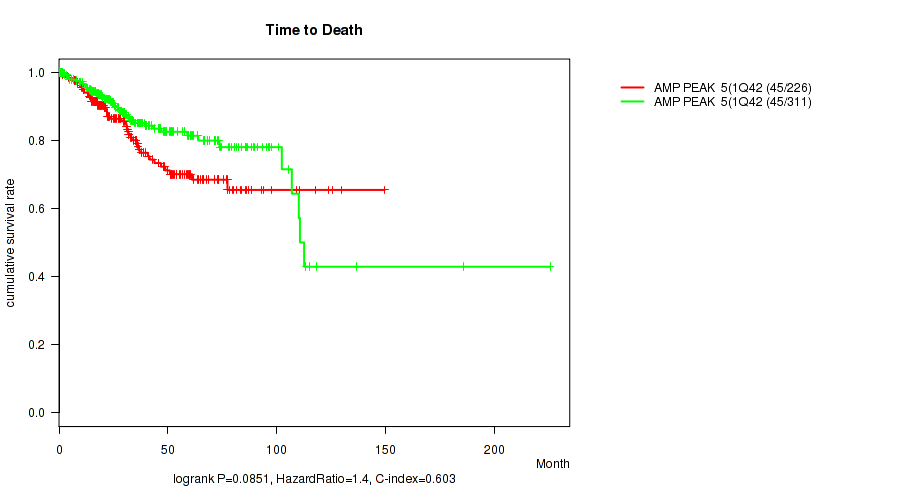
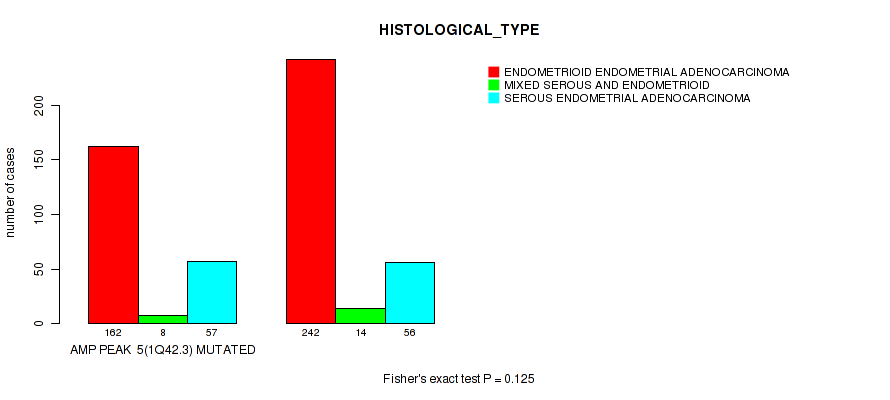
amp_1q42.3 cnv correlated to 'Time to Death' and 'HISTOLOGICAL_TYPE'.
-
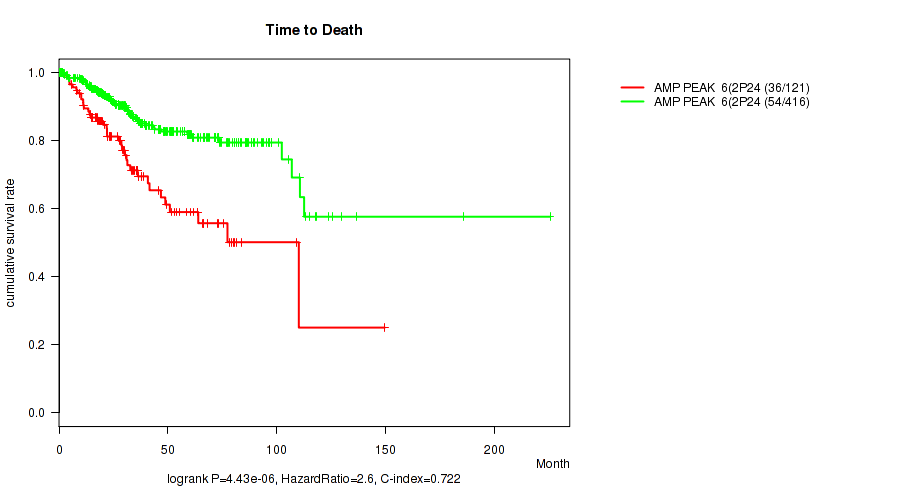
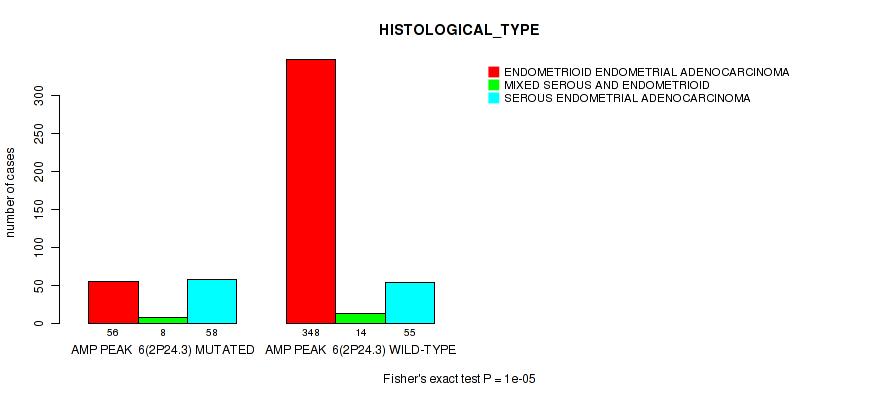
amp_2p24.3 cnv correlated to 'Time to Death' and 'HISTOLOGICAL_TYPE'.
-
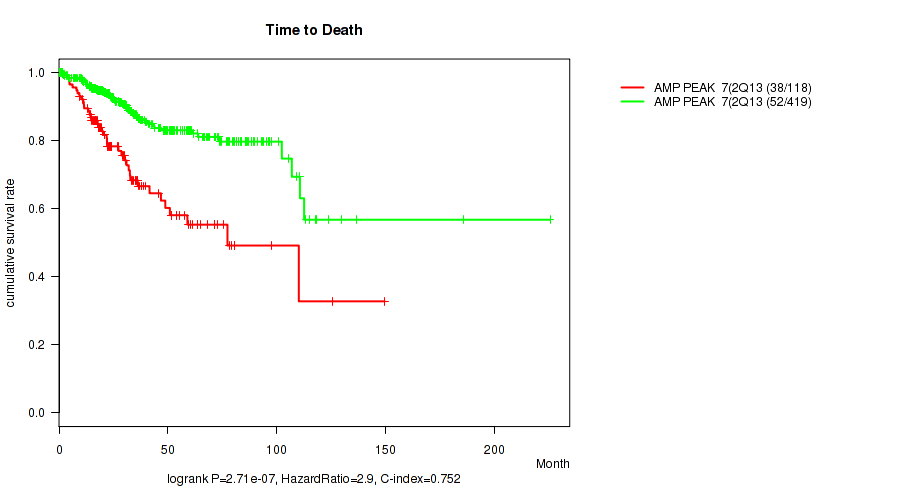
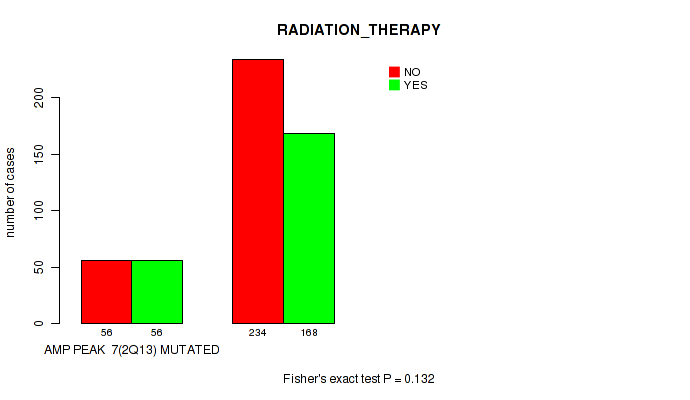
amp_2q13 cnv correlated to 'Time to Death', 'RADIATION_THERAPY', and 'HISTOLOGICAL_TYPE'.
-
amp_3p25.1 cnv correlated to 'Time to Death' and 'HISTOLOGICAL_TYPE'.
-
amp_3p14.1 cnv correlated to 'Time to Death' and 'HISTOLOGICAL_TYPE'.
-
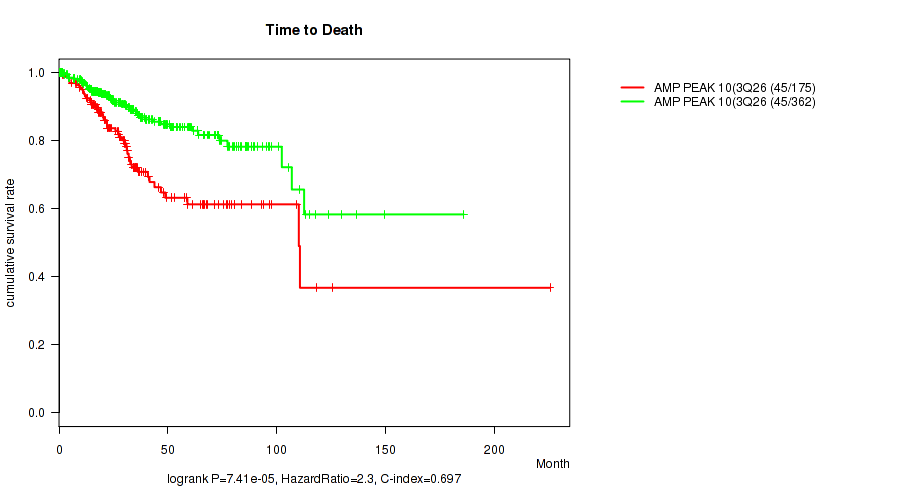
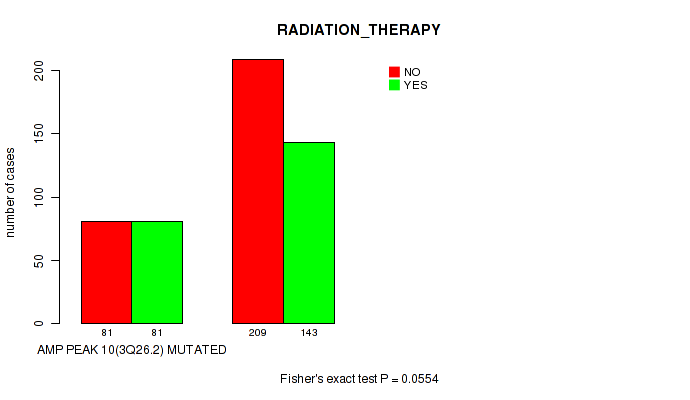
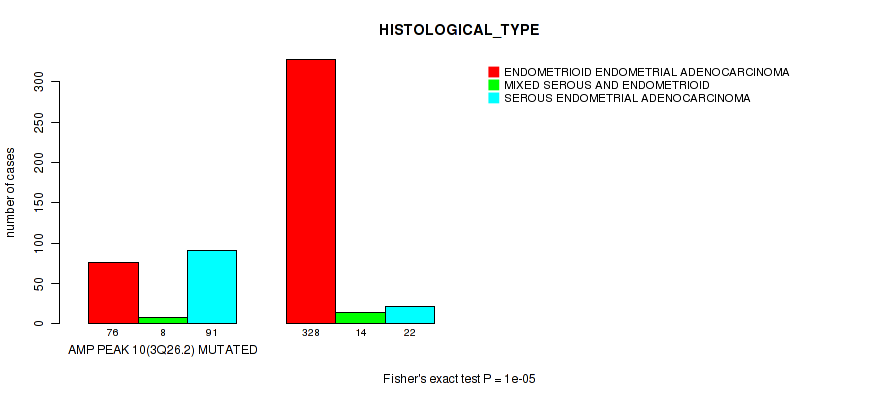
amp_3q26.2 cnv correlated to 'Time to Death', 'RADIATION_THERAPY', and 'HISTOLOGICAL_TYPE'.
-
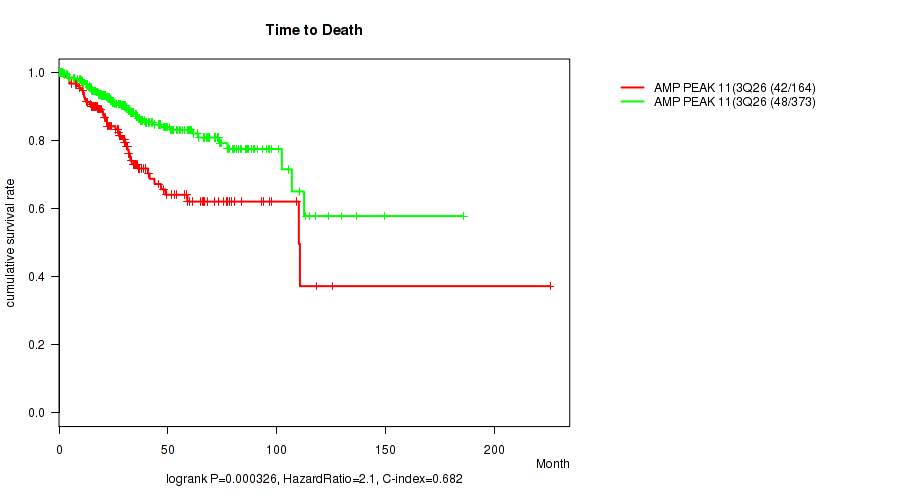
amp_3q26.2 cnv correlated to 'Time to Death', 'RADIATION_THERAPY', 'HISTOLOGICAL_TYPE', and 'RESIDUAL_TUMOR'.
-
amp_4p16.3 cnv correlated to 'Time to Death', 'HISTOLOGICAL_TYPE', and 'RESIDUAL_TUMOR'.
-
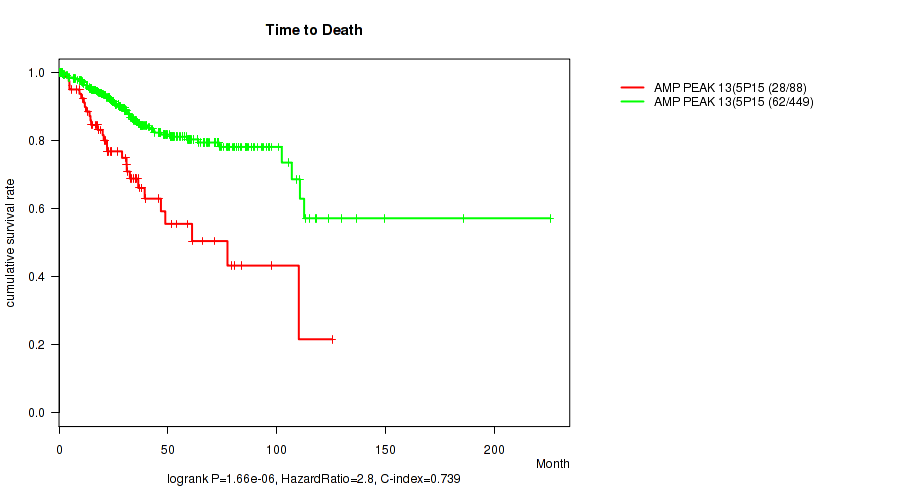
amp_5p15.33 cnv correlated to 'Time to Death', 'HISTOLOGICAL_TYPE', and 'RESIDUAL_TUMOR'.
-
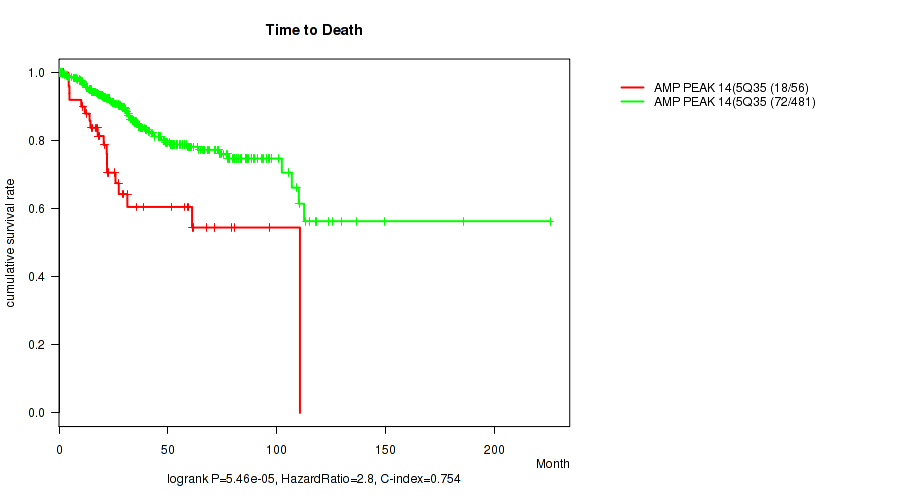
amp_5q35.3 cnv correlated to 'Time to Death' and 'HISTOLOGICAL_TYPE'.
-
amp_6p24.2 cnv correlated to 'Time to Death' and 'HISTOLOGICAL_TYPE'.
-
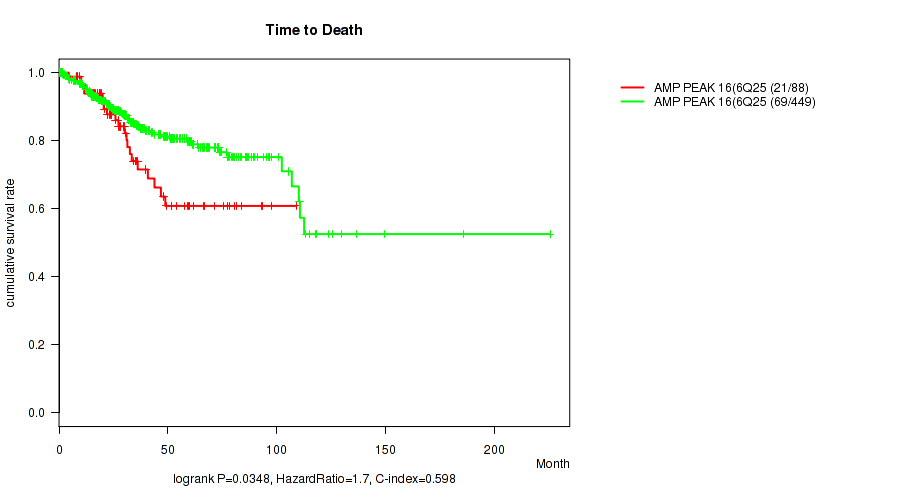
amp_6q25.1 cnv correlated to 'Time to Death', 'HISTOLOGICAL_TYPE', and 'RESIDUAL_TUMOR'.
-
amp_7q31.2 cnv correlated to 'Time to Death' and 'HISTOLOGICAL_TYPE'.
-
amp_8p11.22 cnv correlated to 'Time to Death'.
-
amp_8p11.21 cnv correlated to 'Time to Death', 'HISTOLOGICAL_TYPE', and 'RESIDUAL_TUMOR'.
-
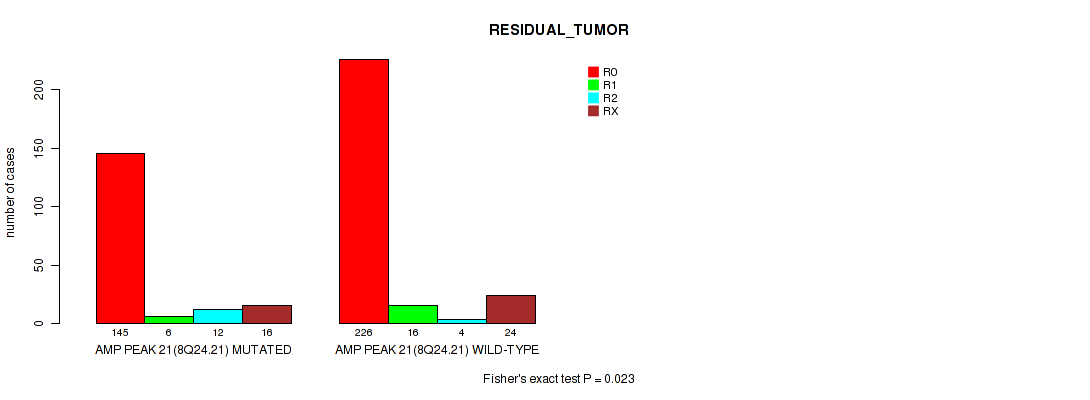
amp_8q24.21 cnv correlated to 'Time to Death', 'HISTOLOGICAL_TYPE', and 'RESIDUAL_TUMOR'.
-
amp_8q24.21 cnv correlated to 'Time to Death', 'HISTOLOGICAL_TYPE', and 'RESIDUAL_TUMOR'.
-
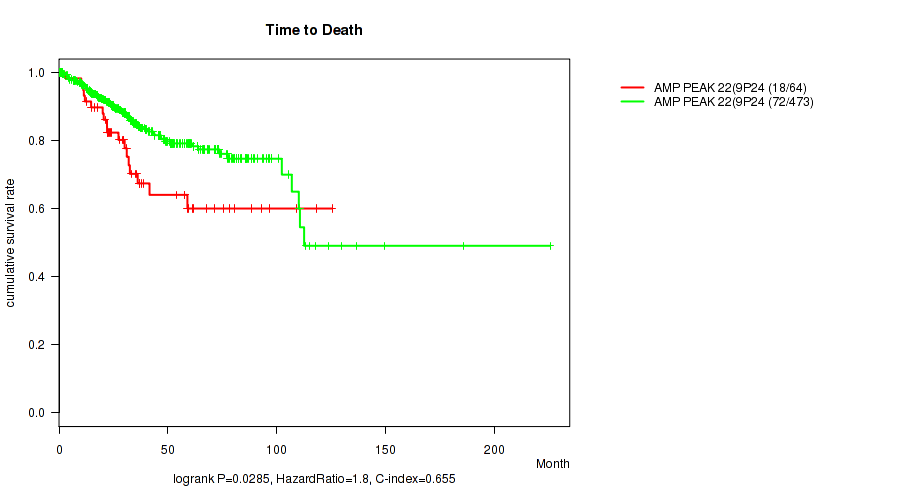
amp_9p24.2 cnv correlated to 'Time to Death', 'HISTOLOGICAL_TYPE', and 'RESIDUAL_TUMOR'.
-
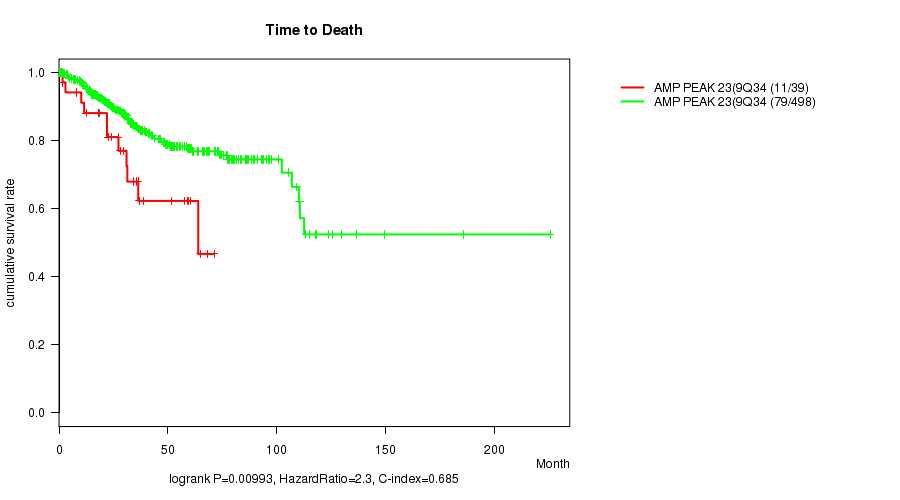
amp_9q34.3 cnv correlated to 'Time to Death' and 'HISTOLOGICAL_TYPE'.
-
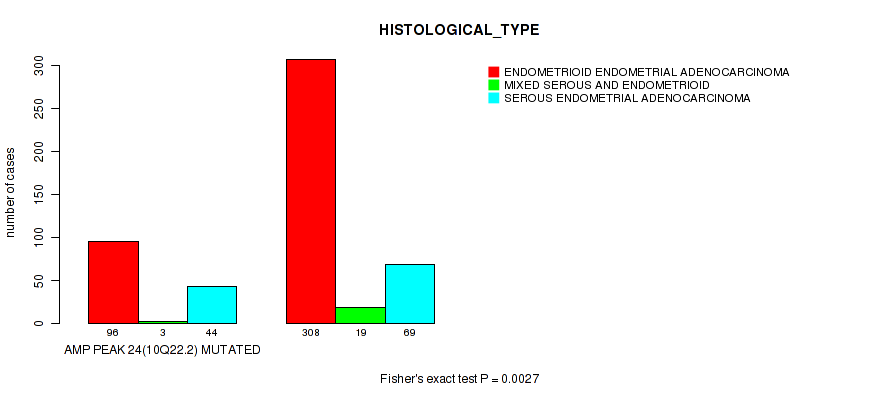
amp_10q22.2 cnv correlated to 'HISTOLOGICAL_TYPE'.
-
amp_11p11.2 cnv correlated to 'Time to Death' and 'HISTOLOGICAL_TYPE'.
-
amp_11q13.2 cnv correlated to 'Time to Death', 'HISTOLOGICAL_TYPE', and 'RESIDUAL_TUMOR'.
-
amp_11q14.1 cnv correlated to 'Time to Death', 'HISTOLOGICAL_TYPE', and 'RESIDUAL_TUMOR'.
-
amp_12p12.1 cnv correlated to 'RADIATION_THERAPY' and 'HISTOLOGICAL_TYPE'.
-
amp_12q13.11 cnv correlated to 'HISTOLOGICAL_TYPE'.
-
amp_12q13.2 cnv correlated to 'HISTOLOGICAL_TYPE' and 'RESIDUAL_TUMOR'.
-
amp_13q34 cnv correlated to 'Time to Death', 'RADIATION_THERAPY', 'HISTOLOGICAL_TYPE', and 'RESIDUAL_TUMOR'.
-
amp_14q24.3 cnv correlated to 'Time to Death' and 'HISTOLOGICAL_TYPE'.
-
amp_14q32.33 cnv correlated to 'Time to Death' and 'HISTOLOGICAL_TYPE'.
-
amp_15q26.3 cnv correlated to 'Time to Death', 'RADIATION_THERAPY', 'HISTOLOGICAL_TYPE', and 'RESIDUAL_TUMOR'.
-
amp_16p11.2 cnv correlated to 'Time to Death', 'HISTOLOGICAL_TYPE', and 'RESIDUAL_TUMOR'.
-
amp_17q11.2 cnv correlated to 'Time to Death', 'HISTOLOGICAL_TYPE', and 'RESIDUAL_TUMOR'.
-
amp_17q12 cnv correlated to 'Time to Death' and 'HISTOLOGICAL_TYPE'.
-
amp_17q25.1 cnv correlated to 'Time to Death', 'HISTOLOGICAL_TYPE', and 'RESIDUAL_TUMOR'.
-
amp_18p11.31 cnv correlated to 'Time to Death', 'HISTOLOGICAL_TYPE', and 'RESIDUAL_TUMOR'.
-
amp_18q11.2 cnv correlated to 'Time to Death', 'RADIATION_THERAPY', 'HISTOLOGICAL_TYPE', and 'RESIDUAL_TUMOR'.
-
amp_19p13.2 cnv correlated to 'Time to Death' and 'HISTOLOGICAL_TYPE'.
-
amp_19p13.12 cnv correlated to 'Time to Death' and 'HISTOLOGICAL_TYPE'.
-
amp_19q12 cnv correlated to 'Time to Death', 'RADIATION_THERAPY', 'HISTOLOGICAL_TYPE', and 'RESIDUAL_TUMOR'.
-
amp_20p13 cnv correlated to 'Time to Death' and 'HISTOLOGICAL_TYPE'.
-
amp_20q11.21 cnv correlated to 'Time to Death', 'HISTOLOGICAL_TYPE', and 'RESIDUAL_TUMOR'.
-
amp_20q13.12 cnv correlated to 'Time to Death', 'HISTOLOGICAL_TYPE', and 'RESIDUAL_TUMOR'.
-
amp_20q13.33 cnv correlated to 'Time to Death', 'HISTOLOGICAL_TYPE', and 'RESIDUAL_TUMOR'.
-
amp_22q12.2 cnv correlated to 'Time to Death', 'HISTOLOGICAL_TYPE', and 'RESIDUAL_TUMOR'.
-
amp_xp11.23 cnv correlated to 'HISTOLOGICAL_TYPE'.
-
amp_xq28 cnv correlated to 'Time to Death', 'HISTOLOGICAL_TYPE', and 'RESIDUAL_TUMOR'.
-
del_1p36.21 cnv correlated to 'Time to Death' and 'HISTOLOGICAL_TYPE'.
-
del_1p36.11 cnv correlated to 'Time to Death', 'HISTOLOGICAL_TYPE', and 'RESIDUAL_TUMOR'.
-
del_2p25.3 cnv correlated to 'Time to Death', 'RADIATION_THERAPY', and 'HISTOLOGICAL_TYPE'.
-
del_2q22.1 cnv correlated to 'Time to Death', 'HISTOLOGICAL_TYPE', and 'RESIDUAL_TUMOR'.
-
del_2q37.3 cnv correlated to 'HISTOLOGICAL_TYPE' and 'RESIDUAL_TUMOR'.
-
del_3p14.2 cnv correlated to 'Time to Death' and 'HISTOLOGICAL_TYPE'.
-
del_3q13.31 cnv correlated to 'HISTOLOGICAL_TYPE'.
-
del_4p16.3 cnv correlated to 'Time to Death' and 'HISTOLOGICAL_TYPE'.
-
del_4p15.31 cnv correlated to 'Time to Death' and 'HISTOLOGICAL_TYPE'.
-
del_4q22.1 cnv correlated to 'Time to Death', 'HISTOLOGICAL_TYPE', and 'RESIDUAL_TUMOR'.
-
del_4q34.3 cnv correlated to 'Time to Death', 'HISTOLOGICAL_TYPE', and 'RESIDUAL_TUMOR'.
-
del_5q12.1 cnv correlated to 'Time to Death' and 'HISTOLOGICAL_TYPE'.
-
del_6q26 cnv correlated to 'Time to Death', 'RADIATION_THERAPY', and 'HISTOLOGICAL_TYPE'.
-
del_7p22.3 cnv correlated to 'Time to Death', 'HISTOLOGICAL_TYPE', and 'RESIDUAL_TUMOR'.
-
del_7q11.22 cnv correlated to 'HISTOLOGICAL_TYPE'.
-
del_7q31.1 cnv correlated to 'Time to Death', 'HISTOLOGICAL_TYPE', and 'RESIDUAL_TUMOR'.
-
del_7q36.1 cnv correlated to 'Time to Death' and 'HISTOLOGICAL_TYPE'.
-
del_8p23.2 cnv correlated to 'Time to Death', 'HISTOLOGICAL_TYPE', and 'RESIDUAL_TUMOR'.
-
del_8p21.2 cnv correlated to 'Time to Death', 'HISTOLOGICAL_TYPE', and 'RESIDUAL_TUMOR'.
-
del_9p23 cnv correlated to 'Time to Death' and 'HISTOLOGICAL_TYPE'.
-
del_9q21.2 cnv correlated to 'Time to Death', 'HISTOLOGICAL_TYPE', and 'RESIDUAL_TUMOR'.
-
del_9q34.2 cnv correlated to 'Time to Death', 'HISTOLOGICAL_TYPE', and 'RESIDUAL_TUMOR'.
-
del_10q21.1 cnv correlated to 'HISTOLOGICAL_TYPE'.
-
del_10q23.31 cnv correlated to 'Time to Death', 'HISTOLOGICAL_TYPE', and 'RESIDUAL_TUMOR'.
-
del_11p15.5 cnv correlated to 'Time to Death', 'HISTOLOGICAL_TYPE', and 'RESIDUAL_TUMOR'.
-
del_11q14.1 cnv correlated to 'Time to Death' and 'HISTOLOGICAL_TYPE'.
-
del_11q25 cnv correlated to 'Time to Death' and 'HISTOLOGICAL_TYPE'.
-
del_12q23.1 cnv correlated to 'Time to Death', 'HISTOLOGICAL_TYPE', and 'RESIDUAL_TUMOR'.
-
del_12q24.33 cnv correlated to 'Time to Death', 'HISTOLOGICAL_TYPE', and 'RESIDUAL_TUMOR'.
-
del_13q11 cnv correlated to 'Time to Death' and 'HISTOLOGICAL_TYPE'.
-
del_13q14.2 cnv correlated to 'Time to Death' and 'HISTOLOGICAL_TYPE'.
-
del_14q13.1 cnv correlated to 'Time to Death' and 'HISTOLOGICAL_TYPE'.
-
del_15q15.1 cnv correlated to 'Time to Death', 'HISTOLOGICAL_TYPE', and 'RESIDUAL_TUMOR'.
-
del_15q23 cnv correlated to 'Time to Death' and 'HISTOLOGICAL_TYPE'.
-
del_16p13.3 cnv correlated to 'Time to Death' and 'HISTOLOGICAL_TYPE'.
-
del_16q21 cnv correlated to 'Time to Death' and 'HISTOLOGICAL_TYPE'.
-
del_16q22.3 cnv correlated to 'Time to Death' and 'HISTOLOGICAL_TYPE'.
-
del_16q23.1 cnv correlated to 'Time to Death', 'HISTOLOGICAL_TYPE', and 'RESIDUAL_TUMOR'.
-
del_17p13.3 cnv correlated to 'Time to Death', 'HISTOLOGICAL_TYPE', and 'RESIDUAL_TUMOR'.
-
del_17p11.2 cnv correlated to 'Time to Death' and 'HISTOLOGICAL_TYPE'.
-
del_17q11.2 cnv correlated to 'Time to Death', 'HISTOLOGICAL_TYPE', and 'RESIDUAL_TUMOR'.
-
del_17q21.31 cnv correlated to 'Time to Death', 'HISTOLOGICAL_TYPE', and 'RESIDUAL_TUMOR'.
-
del_18q21.2 cnv correlated to 'Time to Death', 'HISTOLOGICAL_TYPE', and 'RESIDUAL_TUMOR'.
-
del_18q23 cnv correlated to 'Time to Death', 'HISTOLOGICAL_TYPE', and 'RESIDUAL_TUMOR'.
-
del_19p13.3 cnv correlated to 'Time to Death', 'HISTOLOGICAL_TYPE', and 'RESIDUAL_TUMOR'.
-
del_19p12 cnv correlated to 'Time to Death', 'HISTOLOGICAL_TYPE', and 'RESIDUAL_TUMOR'.
-
del_19q13.43 cnv correlated to 'Time to Death', 'HISTOLOGICAL_TYPE', and 'RESIDUAL_TUMOR'.
-
del_20p12.1 cnv correlated to 'Time to Death', 'HISTOLOGICAL_TYPE', and 'RESIDUAL_TUMOR'.
-
del_22q12.1 cnv correlated to 'Time to Death', 'HISTOLOGICAL_TYPE', and 'RESIDUAL_TUMOR'.
-
del_22q13.32 cnv correlated to 'Time to Death' and 'HISTOLOGICAL_TYPE'.
-
del_xp21.1 cnv correlated to 'Time to Death', 'HISTOLOGICAL_TYPE', and 'RESIDUAL_TUMOR'.
Table 1. Get Full Table Overview of the association between significant copy number variation of 101 focal events and 4 clinical features. Shown in the table are P values (Q values). Thresholded by Q value < 0.25, 255 significant findings detected.
|
Clinical Features |
Time to Death |
RADIATION THERAPY |
HISTOLOGICAL TYPE |
RESIDUAL TUMOR |
||
| nCNV (%) | nWild-Type | logrank test | Fisher's exact test | Fisher's exact test | Fisher's exact test | |
| amp 3q26 2 | 164 (30%) | 375 |
0.000326 (0.000963) |
0.0413 (0.0814) |
1e-05 (4.04e-05) |
0.124 (0.206) |
| amp 13q34 | 58 (11%) | 481 |
0.0799 (0.148) |
0.00677 (0.0159) |
1e-05 (4.04e-05) |
0.0128 (0.0285) |
| amp 15q26 3 | 38 (7%) | 501 |
0.0456 (0.0886) |
0.118 (0.199) |
0.0001 (0.000337) |
0.00573 (0.0137) |
| amp 18q11 2 | 69 (13%) | 470 |
0.0264 (0.0552) |
0.146 (0.234) |
1e-05 (4.04e-05) |
0.0557 (0.106) |
| amp 19q12 | 121 (22%) | 418 |
3.14e-05 (0.000119) |
0.13 (0.213) |
1e-05 (4.04e-05) |
0.0832 (0.153) |
| amp 1p34 2 | 73 (14%) | 466 |
0.000233 (0.000719) |
0.896 (0.948) |
1e-05 (4.04e-05) |
0.0969 (0.17) |
| amp 2q13 | 119 (22%) | 420 |
2.71e-07 (4.04e-05) |
0.132 (0.215) |
1e-05 (4.04e-05) |
0.198 (0.3) |
| amp 3q26 2 | 175 (32%) | 364 |
7.41e-05 (0.000256) |
0.0554 (0.106) |
1e-05 (4.04e-05) |
0.18 (0.28) |
| amp 4p16 3 | 52 (10%) | 487 |
0.132 (0.215) |
0.231 (0.342) |
1e-05 (4.04e-05) |
0.118 (0.199) |
| amp 5p15 33 | 89 (17%) | 450 |
1.66e-06 (4.04e-05) |
0.328 (0.449) |
1e-05 (4.04e-05) |
0.142 (0.23) |
| amp 6q25 1 | 88 (16%) | 451 |
0.0348 (0.0692) |
0.81 (0.889) |
1e-05 (4.04e-05) |
0.0422 (0.0827) |
| amp 8p11 21 | 162 (30%) | 377 |
8.94e-05 (0.000306) |
0.328 (0.449) |
1e-05 (4.04e-05) |
0.00419 (0.0103) |
| amp 8q24 21 | 209 (39%) | 330 |
0.000101 (0.000338) |
0.784 (0.877) |
1e-05 (4.04e-05) |
0.153 (0.244) |
| amp 8q24 21 | 215 (40%) | 324 |
3.82e-05 (0.00014) |
0.856 (0.927) |
1e-05 (4.04e-05) |
0.023 (0.0486) |
| amp 9p24 2 | 65 (12%) | 474 |
0.0285 (0.0587) |
0.48 (0.613) |
1e-05 (4.04e-05) |
0.0936 (0.166) |
| amp 11q13 2 | 74 (14%) | 465 |
0.00854 (0.0198) |
0.796 (0.883) |
1e-05 (4.04e-05) |
0.086 (0.156) |
| amp 11q14 1 | 60 (11%) | 479 |
1.2e-05 (4.79e-05) |
1 (1.00) |
1e-05 (4.04e-05) |
0.0283 (0.0587) |
| amp 16p11 2 | 66 (12%) | 473 |
0.0329 (0.0661) |
0.686 (0.799) |
1e-05 (4.04e-05) |
0.0604 (0.114) |
| amp 17q11 2 | 71 (13%) | 468 |
3.34e-05 (0.000125) |
0.895 (0.948) |
1e-05 (4.04e-05) |
0.00075 (0.00212) |
| amp 17q25 1 | 105 (19%) | 434 |
1.45e-05 (5.7e-05) |
0.427 (0.56) |
1e-05 (4.04e-05) |
0.0894 (0.16) |
| amp 18p11 31 | 96 (18%) | 443 |
0.0447 (0.0872) |
1 (1.00) |
1e-05 (4.04e-05) |
0.0713 (0.133) |
| amp 20q11 21 | 152 (28%) | 387 |
5.65e-07 (4.04e-05) |
0.485 (0.618) |
1e-05 (4.04e-05) |
0.046 (0.089) |
| amp 20q13 12 | 152 (28%) | 387 |
0.000346 (0.00101) |
0.92 (0.96) |
1e-05 (4.04e-05) |
0.0163 (0.036) |
| amp 20q13 33 | 153 (28%) | 386 |
0.00453 (0.0111) |
0.319 (0.443) |
1e-05 (4.04e-05) |
0.00257 (0.00657) |
| amp 22q12 2 | 62 (12%) | 477 |
0.000308 (0.000928) |
1 (1.00) |
1e-05 (4.04e-05) |
0.00172 (0.00454) |
| amp xq28 | 93 (17%) | 446 |
0.00767 (0.0179) |
0.407 (0.541) |
0.00032 (0.000951) |
0.158 (0.25) |
| del 1p36 11 | 83 (15%) | 456 |
0.000102 (0.000338) |
0.803 (0.884) |
1e-05 (4.04e-05) |
0.0498 (0.0959) |
| del 2p25 3 | 26 (5%) | 513 |
0.00503 (0.0122) |
0.0899 (0.16) |
0.00993 (0.0225) |
0.298 (0.416) |
| del 2q22 1 | 49 (9%) | 490 |
8.17e-09 (3.3e-06) |
0.538 (0.662) |
1e-05 (4.04e-05) |
0.00014 (0.000449) |
| del 4q22 1 | 106 (20%) | 433 |
0.000117 (0.00038) |
0.735 (0.837) |
1e-05 (4.04e-05) |
0.0328 (0.0661) |
| del 4q34 3 | 130 (24%) | 409 |
0.000499 (0.00144) |
0.754 (0.851) |
1e-05 (4.04e-05) |
0.0891 (0.16) |
| del 6q26 | 46 (9%) | 493 |
0.123 (0.206) |
0.0347 (0.0692) |
1e-05 (4.04e-05) |
0.871 (0.938) |
| del 7p22 3 | 72 (13%) | 467 |
0.000786 (0.00221) |
0.43 (0.562) |
1e-05 (4.04e-05) |
0.119 (0.2) |
| del 7q31 1 | 55 (10%) | 484 |
0.0218 (0.0465) |
0.188 (0.287) |
1e-05 (4.04e-05) |
0.145 (0.233) |
| del 8p23 2 | 119 (22%) | 420 |
1.25e-05 (4.97e-05) |
0.388 (0.522) |
1e-05 (4.04e-05) |
0.0316 (0.0641) |
| del 8p21 2 | 117 (22%) | 422 |
0.000314 (0.000939) |
0.449 (0.581) |
1e-05 (4.04e-05) |
0.0867 (0.157) |
| del 9q21 2 | 129 (24%) | 410 |
5.69e-06 (4.04e-05) |
1 (1.00) |
1e-05 (4.04e-05) |
0.102 (0.177) |
| del 9q34 2 | 132 (24%) | 407 |
3.37e-05 (0.000125) |
0.535 (0.661) |
1e-05 (4.04e-05) |
0.0712 (0.133) |
| del 10q23 31 | 78 (14%) | 461 |
0.000184 (0.00058) |
1 (1.00) |
1e-05 (4.04e-05) |
0.121 (0.203) |
| del 11p15 5 | 104 (19%) | 435 |
0.000665 (0.00189) |
0.817 (0.892) |
1e-05 (4.04e-05) |
0.0269 (0.056) |
| del 12q23 1 | 56 (10%) | 483 |
6.25e-05 (0.00022) |
0.306 (0.426) |
1e-05 (4.04e-05) |
0.0125 (0.0279) |
| del 12q24 33 | 66 (12%) | 473 |
0.00307 (0.00771) |
0.489 (0.619) |
1e-05 (4.04e-05) |
0.00903 (0.0208) |
| del 15q15 1 | 140 (26%) | 399 |
7e-05 (0.000244) |
0.539 (0.662) |
1e-05 (4.04e-05) |
0.0559 (0.106) |
| del 16q23 1 | 166 (31%) | 373 |
0.00123 (0.00334) |
0.771 (0.865) |
1e-05 (4.04e-05) |
0.0304 (0.062) |
| del 17p13 3 | 122 (23%) | 417 |
1.07e-06 (4.04e-05) |
0.517 (0.641) |
1e-05 (4.04e-05) |
0.0807 (0.149) |
| del 17q11 2 | 105 (19%) | 434 |
0.000896 (0.00248) |
0.495 (0.625) |
1e-05 (4.04e-05) |
0.115 (0.198) |
| del 17q21 31 | 114 (21%) | 425 |
0.00013 (0.000421) |
0.509 (0.637) |
1e-05 (4.04e-05) |
0.0206 (0.0443) |
| del 18q21 2 | 90 (17%) | 449 |
0.0899 (0.16) |
0.626 (0.748) |
1e-05 (4.04e-05) |
0.0378 (0.0749) |
| del 18q23 | 98 (18%) | 441 |
0.00106 (0.00292) |
0.238 (0.35) |
1e-05 (4.04e-05) |
0.00535 (0.0129) |
| del 19p13 3 | 157 (29%) | 382 |
5.21e-07 (4.04e-05) |
0.553 (0.675) |
1e-05 (4.04e-05) |
0.00313 (0.00781) |
| del 19p12 | 58 (11%) | 481 |
0.0946 (0.167) |
0.188 (0.287) |
1e-05 (4.04e-05) |
0.112 (0.193) |
| del 19q13 43 | 67 (12%) | 472 |
0.00293 (0.00741) |
0.677 (0.791) |
1e-05 (4.04e-05) |
0.0175 (0.0385) |
| del 20p12 1 | 35 (6%) | 504 |
0.000108 (0.000353) |
0.716 (0.824) |
0.0001 (0.000337) |
0.153 (0.244) |
| del 22q12 1 | 95 (18%) | 444 |
0.00109 (0.00297) |
0.635 (0.752) |
1e-05 (4.04e-05) |
0.129 (0.212) |
| del xp21 1 | 88 (16%) | 451 |
7.7e-06 (4.04e-05) |
0.628 (0.748) |
1e-05 (4.04e-05) |
0.111 (0.193) |
| amp 1p35 2 | 56 (10%) | 483 |
0.112 (0.193) |
0.882 (0.943) |
1e-05 (4.04e-05) |
0.222 (0.331) |
| amp 1q21 3 | 243 (45%) | 296 |
0.0124 (0.0277) |
0.655 (0.769) |
1e-05 (4.04e-05) |
0.566 (0.688) |
| amp 1q22 | 256 (47%) | 283 |
0.00142 (0.00381) |
0.929 (0.965) |
1e-05 (4.04e-05) |
0.378 (0.513) |
| amp 1q42 3 | 227 (42%) | 312 |
0.0851 (0.156) |
0.322 (0.444) |
0.125 (0.207) |
0.487 (0.618) |
| amp 2p24 3 | 122 (23%) | 417 |
4.43e-06 (4.04e-05) |
0.748 (0.846) |
1e-05 (4.04e-05) |
0.703 (0.812) |
| amp 3p25 1 | 82 (15%) | 457 |
0.0988 (0.173) |
1 (1.00) |
1e-05 (4.04e-05) |
0.541 (0.662) |
| amp 3p14 1 | 65 (12%) | 474 |
0.00381 (0.00945) |
0.889 (0.945) |
2e-05 (7.77e-05) |
0.229 (0.34) |
| amp 5q35 3 | 57 (11%) | 482 |
5.46e-05 (0.000193) |
0.768 (0.865) |
1e-05 (4.04e-05) |
0.411 (0.545) |
| amp 6p24 2 | 117 (22%) | 422 |
0.0197 (0.0427) |
0.829 (0.903) |
1e-05 (4.04e-05) |
0.57 (0.691) |
| amp 7q31 2 | 93 (17%) | 446 |
2.95e-05 (0.000112) |
0.812 (0.889) |
4e-05 (0.000146) |
0.696 (0.806) |
| amp 9q34 3 | 39 (7%) | 500 |
0.00993 (0.0225) |
0.86 (0.929) |
1e-05 (4.04e-05) |
0.405 (0.54) |
| amp 11p11 2 | 52 (10%) | 487 |
0.000305 (0.000926) |
0.881 (0.943) |
1e-05 (4.04e-05) |
0.513 (0.639) |
| amp 12p12 1 | 92 (17%) | 447 |
0.282 (0.398) |
0.126 (0.207) |
1e-05 (4.04e-05) |
0.74 (0.84) |
| amp 12q13 2 | 100 (19%) | 439 |
0.469 (0.605) |
0.73 (0.833) |
1e-05 (4.04e-05) |
0.117 (0.199) |
| amp 14q24 3 | 64 (12%) | 475 |
0.00213 (0.00553) |
0.339 (0.463) |
1e-05 (4.04e-05) |
0.509 (0.637) |
| amp 14q32 33 | 79 (15%) | 460 |
0.000664 (0.00189) |
0.801 (0.884) |
1e-05 (4.04e-05) |
0.206 (0.309) |
| amp 17q12 | 75 (14%) | 464 |
5.12e-05 (0.000183) |
0.247 (0.358) |
1e-05 (4.04e-05) |
0.238 (0.35) |
| amp 19p13 2 | 92 (17%) | 447 |
0.0523 (0.1) |
0.281 (0.397) |
1e-05 (4.04e-05) |
0.433 (0.565) |
| amp 19p13 12 | 99 (18%) | 440 |
0.0196 (0.0427) |
0.244 (0.356) |
1e-05 (4.04e-05) |
0.27 (0.388) |
| amp 20p13 | 117 (22%) | 422 |
0.0202 (0.0437) |
0.666 (0.78) |
1e-05 (4.04e-05) |
0.415 (0.548) |
| del 1p36 21 | 71 (13%) | 468 |
0.00987 (0.0225) |
0.793 (0.883) |
1e-05 (4.04e-05) |
0.637 (0.752) |
| del 2q37 3 | 52 (10%) | 487 |
0.165 (0.26) |
0.88 (0.943) |
0.00026 (0.000796) |
0.0291 (0.0596) |
| del 3p14 2 | 79 (15%) | 460 |
0.00185 (0.00485) |
0.376 (0.511) |
1e-05 (4.04e-05) |
0.636 (0.752) |
| del 4p16 3 | 94 (17%) | 445 |
0.0235 (0.0495) |
1 (1.00) |
1e-05 (4.04e-05) |
0.798 (0.883) |
| del 4p15 31 | 99 (18%) | 440 |
0.00572 (0.0137) |
0.909 (0.953) |
1e-05 (4.04e-05) |
0.288 (0.405) |
| del 5q12 1 | 111 (21%) | 428 |
0.000214 (0.000664) |
0.184 (0.284) |
1e-05 (4.04e-05) |
0.475 (0.61) |
| del 7q36 1 | 63 (12%) | 476 |
0.00254 (0.00654) |
0.279 (0.397) |
1e-05 (4.04e-05) |
0.28 (0.397) |
| del 9p23 | 80 (15%) | 459 |
0.000841 (0.00234) |
0.618 (0.741) |
1e-05 (4.04e-05) |
0.167 (0.262) |
| del 11q14 1 | 69 (13%) | 470 |
0.00663 (0.0157) |
0.426 (0.56) |
1e-05 (4.04e-05) |
0.591 (0.714) |
| del 11q25 | 94 (17%) | 445 |
0.000197 (0.000618) |
1 (1.00) |
1e-05 (4.04e-05) |
0.216 (0.324) |
| del 13q11 | 98 (18%) | 441 |
0.00144 (0.00385) |
0.908 (0.953) |
1e-05 (4.04e-05) |
0.272 (0.388) |
| del 13q14 2 | 106 (20%) | 433 |
0.00016 (0.000507) |
0.256 (0.369) |
1e-05 (4.04e-05) |
0.514 (0.639) |
| del 14q13 1 | 73 (14%) | 466 |
0.00158 (0.00419) |
1 (1.00) |
1e-05 (4.04e-05) |
0.985 (1.00) |
| del 15q23 | 115 (21%) | 424 |
0.00675 (0.0159) |
0.381 (0.515) |
1e-05 (4.04e-05) |
0.72 (0.826) |
| del 16p13 3 | 92 (17%) | 447 |
4.95e-05 (0.000179) |
0.905 (0.953) |
1e-05 (4.04e-05) |
0.162 (0.255) |
| del 16q21 | 154 (29%) | 385 |
0.00204 (0.00532) |
1 (1.00) |
1e-05 (4.04e-05) |
0.321 (0.444) |
| del 16q22 3 | 158 (29%) | 381 |
0.0207 (0.0443) |
0.922 (0.96) |
1e-05 (4.04e-05) |
0.248 (0.359) |
| del 17p11 2 | 128 (24%) | 411 |
5.76e-06 (4.04e-05) |
0.915 (0.958) |
1e-05 (4.04e-05) |
0.242 (0.354) |
| del 22q13 32 | 140 (26%) | 399 |
2.75e-05 (0.000106) |
0.838 (0.91) |
1e-05 (4.04e-05) |
0.199 (0.3) |
| amp 8p11 22 | 126 (23%) | 413 |
0.0116 (0.0263) |
0.598 (0.722) |
0.884 (0.943) |
0.692 (0.804) |
| amp 10q22 2 | 143 (27%) | 396 |
0.187 (0.287) |
0.618 (0.741) |
0.0027 (0.00686) |
0.249 (0.359) |
| amp 12q13 11 | 87 (16%) | 452 |
0.472 (0.607) |
0.177 (0.276) |
1e-05 (4.04e-05) |
0.193 (0.294) |
| amp xp11 23 | 90 (17%) | 449 |
0.199 (0.3) |
1 (1.00) |
0.00044 (0.00128) |
0.402 (0.538) |
| del 3q13 31 | 43 (8%) | 496 |
0.79 (0.881) |
1 (1.00) |
1e-05 (4.04e-05) |
0.729 (0.833) |
| del 7q11 22 | 41 (8%) | 498 |
0.966 (1.00) |
1 (1.00) |
1e-05 (4.04e-05) |
0.5 (0.629) |
| del 10q21 1 | 50 (9%) | 489 |
0.448 (0.581) |
0.641 (0.755) |
1e-05 (4.04e-05) |
0.401 (0.538) |
P value = 0.112 (logrank test), Q value = 0.19
Table S1. Gene #1: 'amp_1p35.2' versus Clinical Feature #1: 'Time to Death'
| nPatients | nDeath | Duration Range (Median), Month | |
|---|---|---|---|
| ALL | 537 | 90 | 0.1 - 225.5 (29.9) |
| AMP PEAK 1(1P35.2) MUTATED | 56 | 14 | 0.1 - 118.2 (28.0) |
| AMP PEAK 1(1P35.2) WILD-TYPE | 481 | 76 | 0.1 - 225.5 (30.0) |
Figure S1. Get High-res Image Gene #1: 'amp_1p35.2' versus Clinical Feature #1: 'Time to Death'
P value = 1e-05 (Fisher's exact test), Q value = 4e-05
Table S2. Gene #1: 'amp_1p35.2' versus Clinical Feature #3: 'HISTOLOGICAL_TYPE'
| nPatients | ENDOMETRIOID ENDOMETRIAL ADENOCARCINOMA | MIXED SEROUS AND ENDOMETRIOID | SEROUS ENDOMETRIAL ADENOCARCINOMA |
|---|---|---|---|
| ALL | 404 | 22 | 113 |
| AMP PEAK 1(1P35.2) MUTATED | 15 | 5 | 36 |
| AMP PEAK 1(1P35.2) WILD-TYPE | 389 | 17 | 77 |
Figure S2. Get High-res Image Gene #1: 'amp_1p35.2' versus Clinical Feature #3: 'HISTOLOGICAL_TYPE'

P value = 0.000233 (logrank test), Q value = 0.00072
Table S3. Gene #2: 'amp_1p34.2' versus Clinical Feature #1: 'Time to Death'
| nPatients | nDeath | Duration Range (Median), Month | |
|---|---|---|---|
| ALL | 537 | 90 | 0.1 - 225.5 (29.9) |
| AMP PEAK 2(1P34.2) MUTATED | 73 | 22 | 0.1 - 125.4 (23.9) |
| AMP PEAK 2(1P34.2) WILD-TYPE | 464 | 68 | 0.1 - 225.5 (30.1) |
Figure S3. Get High-res Image Gene #2: 'amp_1p34.2' versus Clinical Feature #1: 'Time to Death'

P value = 1e-05 (Fisher's exact test), Q value = 4e-05
Table S4. Gene #2: 'amp_1p34.2' versus Clinical Feature #3: 'HISTOLOGICAL_TYPE'
| nPatients | ENDOMETRIOID ENDOMETRIAL ADENOCARCINOMA | MIXED SEROUS AND ENDOMETRIOID | SEROUS ENDOMETRIAL ADENOCARCINOMA |
|---|---|---|---|
| ALL | 404 | 22 | 113 |
| AMP PEAK 2(1P34.2) MUTATED | 21 | 7 | 45 |
| AMP PEAK 2(1P34.2) WILD-TYPE | 383 | 15 | 68 |
Figure S4. Get High-res Image Gene #2: 'amp_1p34.2' versus Clinical Feature #3: 'HISTOLOGICAL_TYPE'

P value = 0.0969 (Fisher's exact test), Q value = 0.17
Table S5. Gene #2: 'amp_1p34.2' versus Clinical Feature #4: 'RESIDUAL_TUMOR'
| nPatients | R0 | R1 | R2 | RX |
|---|---|---|---|---|
| ALL | 371 | 22 | 16 | 40 |
| AMP PEAK 2(1P34.2) MUTATED | 45 | 4 | 5 | 7 |
| AMP PEAK 2(1P34.2) WILD-TYPE | 326 | 18 | 11 | 33 |
Figure S5. Get High-res Image Gene #2: 'amp_1p34.2' versus Clinical Feature #4: 'RESIDUAL_TUMOR'
P value = 0.0124 (logrank test), Q value = 0.028
Table S6. Gene #3: 'amp_1q21.3' versus Clinical Feature #1: 'Time to Death'
| nPatients | nDeath | Duration Range (Median), Month | |
|---|---|---|---|
| ALL | 537 | 90 | 0.1 - 225.5 (29.9) |
| AMP PEAK 3(1Q21.3) MUTATED | 242 | 51 | 0.1 - 149.6 (27.5) |
| AMP PEAK 3(1Q21.3) WILD-TYPE | 295 | 39 | 0.2 - 225.5 (30.7) |
Figure S6. Get High-res Image Gene #3: 'amp_1q21.3' versus Clinical Feature #1: 'Time to Death'
P value = 1e-05 (Fisher's exact test), Q value = 4e-05
Table S7. Gene #3: 'amp_1q21.3' versus Clinical Feature #3: 'HISTOLOGICAL_TYPE'
| nPatients | ENDOMETRIOID ENDOMETRIAL ADENOCARCINOMA | MIXED SEROUS AND ENDOMETRIOID | SEROUS ENDOMETRIAL ADENOCARCINOMA |
|---|---|---|---|
| ALL | 404 | 22 | 113 |
| AMP PEAK 3(1Q21.3) MUTATED | 159 | 10 | 74 |
| AMP PEAK 3(1Q21.3) WILD-TYPE | 245 | 12 | 39 |
Figure S7. Get High-res Image Gene #3: 'amp_1q21.3' versus Clinical Feature #3: 'HISTOLOGICAL_TYPE'
P value = 0.00142 (logrank test), Q value = 0.0038
Table S8. Gene #4: 'amp_1q22' versus Clinical Feature #1: 'Time to Death'
| nPatients | nDeath | Duration Range (Median), Month | |
|---|---|---|---|
| ALL | 537 | 90 | 0.1 - 225.5 (29.9) |
| AMP PEAK 4(1Q22) MUTATED | 256 | 56 | 0.1 - 149.6 (28.0) |
| AMP PEAK 4(1Q22) WILD-TYPE | 281 | 34 | 0.2 - 225.5 (31.1) |
Figure S8. Get High-res Image Gene #4: 'amp_1q22' versus Clinical Feature #1: 'Time to Death'
P value = 1e-05 (Fisher's exact test), Q value = 4e-05
Table S9. Gene #4: 'amp_1q22' versus Clinical Feature #3: 'HISTOLOGICAL_TYPE'
| nPatients | ENDOMETRIOID ENDOMETRIAL ADENOCARCINOMA | MIXED SEROUS AND ENDOMETRIOID | SEROUS ENDOMETRIAL ADENOCARCINOMA |
|---|---|---|---|
| ALL | 404 | 22 | 113 |
| AMP PEAK 4(1Q22) MUTATED | 165 | 11 | 80 |
| AMP PEAK 4(1Q22) WILD-TYPE | 239 | 11 | 33 |
Figure S9. Get High-res Image Gene #4: 'amp_1q22' versus Clinical Feature #3: 'HISTOLOGICAL_TYPE'
P value = 0.0851 (logrank test), Q value = 0.16
Table S10. Gene #5: 'amp_1q42.3' versus Clinical Feature #1: 'Time to Death'
| nPatients | nDeath | Duration Range (Median), Month | |
|---|---|---|---|
| ALL | 537 | 90 | 0.1 - 225.5 (29.9) |
| AMP PEAK 5(1Q42.3) MUTATED | 226 | 45 | 0.1 - 149.6 (29.9) |
| AMP PEAK 5(1Q42.3) WILD-TYPE | 311 | 45 | 0.2 - 225.5 (29.9) |
Figure S10. Get High-res Image Gene #5: 'amp_1q42.3' versus Clinical Feature #1: 'Time to Death'
P value = 0.125 (Fisher's exact test), Q value = 0.21
Table S11. Gene #5: 'amp_1q42.3' versus Clinical Feature #3: 'HISTOLOGICAL_TYPE'
| nPatients | ENDOMETRIOID ENDOMETRIAL ADENOCARCINOMA | MIXED SEROUS AND ENDOMETRIOID | SEROUS ENDOMETRIAL ADENOCARCINOMA |
|---|---|---|---|
| ALL | 404 | 22 | 113 |
| AMP PEAK 5(1Q42.3) MUTATED | 162 | 8 | 57 |
| AMP PEAK 5(1Q42.3) WILD-TYPE | 242 | 14 | 56 |
Figure S11. Get High-res Image Gene #5: 'amp_1q42.3' versus Clinical Feature #3: 'HISTOLOGICAL_TYPE'
P value = 4.43e-06 (logrank test), Q value = 4e-05
Table S12. Gene #6: 'amp_2p24.3' versus Clinical Feature #1: 'Time to Death'
| nPatients | nDeath | Duration Range (Median), Month | |
|---|---|---|---|
| ALL | 537 | 90 | 0.1 - 225.5 (29.9) |
| AMP PEAK 6(2P24.3) MUTATED | 121 | 36 | 0.1 - 149.6 (28.1) |
| AMP PEAK 6(2P24.3) WILD-TYPE | 416 | 54 | 0.1 - 225.5 (30.7) |
Figure S12. Get High-res Image Gene #6: 'amp_2p24.3' versus Clinical Feature #1: 'Time to Death'
P value = 1e-05 (Fisher's exact test), Q value = 4e-05
Table S13. Gene #6: 'amp_2p24.3' versus Clinical Feature #3: 'HISTOLOGICAL_TYPE'
| nPatients | ENDOMETRIOID ENDOMETRIAL ADENOCARCINOMA | MIXED SEROUS AND ENDOMETRIOID | SEROUS ENDOMETRIAL ADENOCARCINOMA |
|---|---|---|---|
| ALL | 404 | 22 | 113 |
| AMP PEAK 6(2P24.3) MUTATED | 56 | 8 | 58 |
| AMP PEAK 6(2P24.3) WILD-TYPE | 348 | 14 | 55 |
Figure S13. Get High-res Image Gene #6: 'amp_2p24.3' versus Clinical Feature #3: 'HISTOLOGICAL_TYPE'
P value = 2.71e-07 (logrank test), Q value = 4e-05
Table S14. Gene #7: 'amp_2q13' versus Clinical Feature #1: 'Time to Death'
| nPatients | nDeath | Duration Range (Median), Month | |
|---|---|---|---|
| ALL | 537 | 90 | 0.1 - 225.5 (29.9) |
| AMP PEAK 7(2Q13) MUTATED | 118 | 38 | 0.3 - 149.6 (27.0) |
| AMP PEAK 7(2Q13) WILD-TYPE | 419 | 52 | 0.1 - 225.5 (30.4) |
Figure S14. Get High-res Image Gene #7: 'amp_2q13' versus Clinical Feature #1: 'Time to Death'
P value = 0.132 (Fisher's exact test), Q value = 0.21
Table S15. Gene #7: 'amp_2q13' versus Clinical Feature #2: 'RADIATION_THERAPY'
| nPatients | NO | YES |
|---|---|---|
| ALL | 290 | 224 |
| AMP PEAK 7(2Q13) MUTATED | 56 | 56 |
| AMP PEAK 7(2Q13) WILD-TYPE | 234 | 168 |
Figure S15. Get High-res Image Gene #7: 'amp_2q13' versus Clinical Feature #2: 'RADIATION_THERAPY'
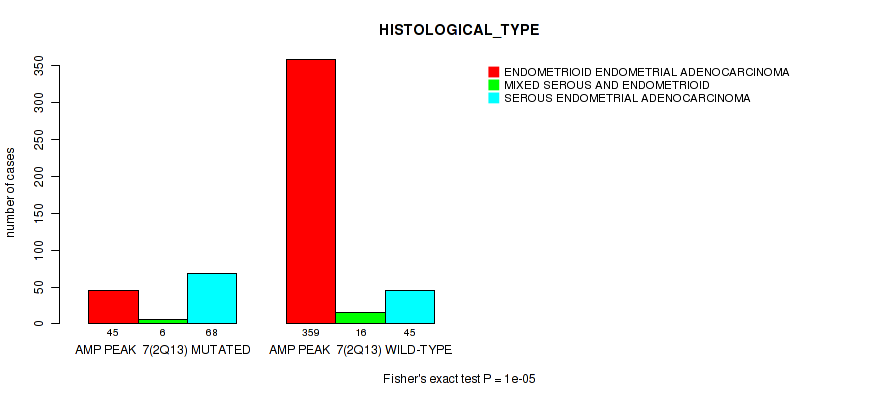
P value = 1e-05 (Fisher's exact test), Q value = 4e-05
Table S16. Gene #7: 'amp_2q13' versus Clinical Feature #3: 'HISTOLOGICAL_TYPE'
| nPatients | ENDOMETRIOID ENDOMETRIAL ADENOCARCINOMA | MIXED SEROUS AND ENDOMETRIOID | SEROUS ENDOMETRIAL ADENOCARCINOMA |
|---|---|---|---|
| ALL | 404 | 22 | 113 |
| AMP PEAK 7(2Q13) MUTATED | 45 | 6 | 68 |
| AMP PEAK 7(2Q13) WILD-TYPE | 359 | 16 | 45 |
Figure S16. Get High-res Image Gene #7: 'amp_2q13' versus Clinical Feature #3: 'HISTOLOGICAL_TYPE'
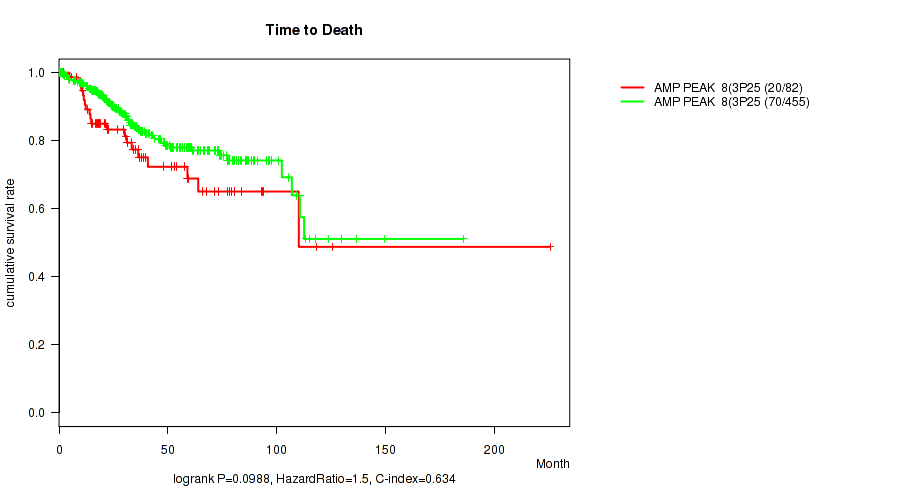
P value = 0.0988 (logrank test), Q value = 0.17
Table S17. Gene #8: 'amp_3p25.1' versus Clinical Feature #1: 'Time to Death'
| nPatients | nDeath | Duration Range (Median), Month | |
|---|---|---|---|
| ALL | 537 | 90 | 0.1 - 225.5 (29.9) |
| AMP PEAK 8(3P25.1) MUTATED | 82 | 20 | 0.1 - 225.5 (31.2) |
| AMP PEAK 8(3P25.1) WILD-TYPE | 455 | 70 | 0.1 - 185.8 (29.6) |
Figure S17. Get High-res Image Gene #8: 'amp_3p25.1' versus Clinical Feature #1: 'Time to Death'
P value = 1e-05 (Fisher's exact test), Q value = 4e-05
Table S18. Gene #8: 'amp_3p25.1' versus Clinical Feature #3: 'HISTOLOGICAL_TYPE'
| nPatients | ENDOMETRIOID ENDOMETRIAL ADENOCARCINOMA | MIXED SEROUS AND ENDOMETRIOID | SEROUS ENDOMETRIAL ADENOCARCINOMA |
|---|---|---|---|
| ALL | 404 | 22 | 113 |
| AMP PEAK 8(3P25.1) MUTATED | 36 | 2 | 44 |
| AMP PEAK 8(3P25.1) WILD-TYPE | 368 | 20 | 69 |
Figure S18. Get High-res Image Gene #8: 'amp_3p25.1' versus Clinical Feature #3: 'HISTOLOGICAL_TYPE'

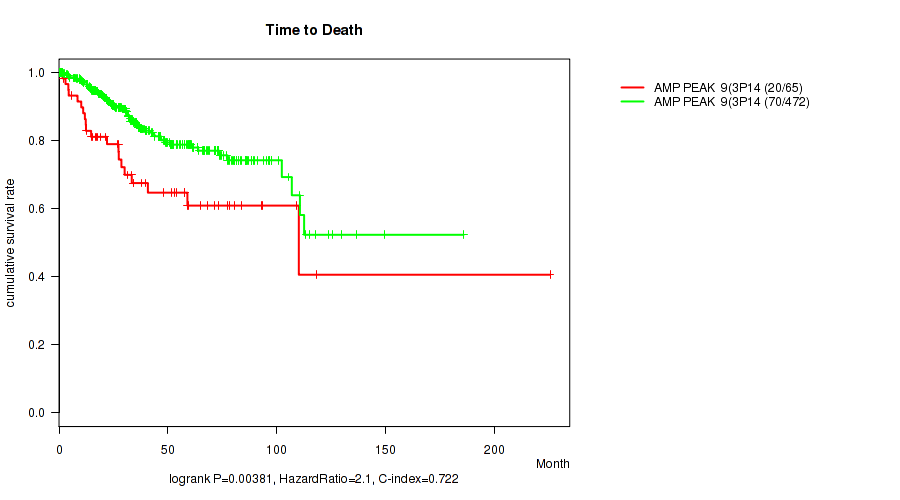
P value = 0.00381 (logrank test), Q value = 0.0094
Table S19. Gene #9: 'amp_3p14.1' versus Clinical Feature #1: 'Time to Death'
| nPatients | nDeath | Duration Range (Median), Month | |
|---|---|---|---|
| ALL | 537 | 90 | 0.1 - 225.5 (29.9) |
| AMP PEAK 9(3P14.1) MUTATED | 65 | 20 | 0.1 - 225.5 (28.6) |
| AMP PEAK 9(3P14.1) WILD-TYPE | 472 | 70 | 0.1 - 185.8 (29.9) |
Figure S19. Get High-res Image Gene #9: 'amp_3p14.1' versus Clinical Feature #1: 'Time to Death'
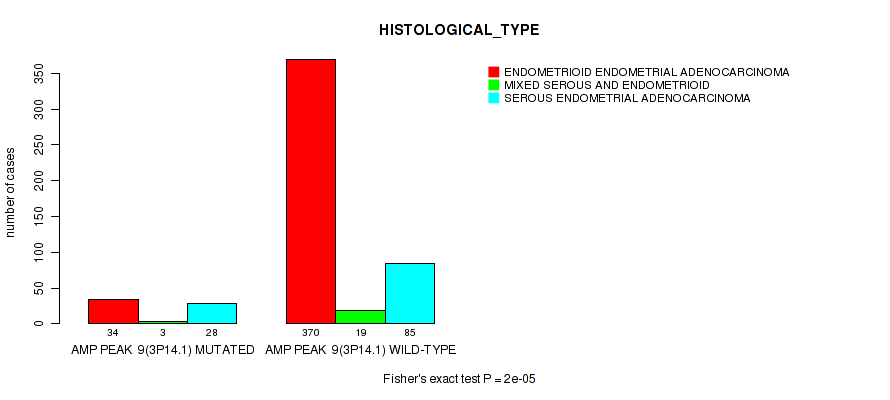
P value = 2e-05 (Fisher's exact test), Q value = 7.8e-05
Table S20. Gene #9: 'amp_3p14.1' versus Clinical Feature #3: 'HISTOLOGICAL_TYPE'
| nPatients | ENDOMETRIOID ENDOMETRIAL ADENOCARCINOMA | MIXED SEROUS AND ENDOMETRIOID | SEROUS ENDOMETRIAL ADENOCARCINOMA |
|---|---|---|---|
| ALL | 404 | 22 | 113 |
| AMP PEAK 9(3P14.1) MUTATED | 34 | 3 | 28 |
| AMP PEAK 9(3P14.1) WILD-TYPE | 370 | 19 | 85 |
Figure S20. Get High-res Image Gene #9: 'amp_3p14.1' versus Clinical Feature #3: 'HISTOLOGICAL_TYPE'
P value = 7.41e-05 (logrank test), Q value = 0.00026
Table S21. Gene #10: 'amp_3q26.2' versus Clinical Feature #1: 'Time to Death'
| nPatients | nDeath | Duration Range (Median), Month | |
|---|---|---|---|
| ALL | 537 | 90 | 0.1 - 225.5 (29.9) |
| AMP PEAK 10(3Q26.2) MUTATED | 175 | 45 | 0.1 - 225.5 (28.9) |
| AMP PEAK 10(3Q26.2) WILD-TYPE | 362 | 45 | 0.2 - 185.8 (30.3) |
Figure S21. Get High-res Image Gene #10: 'amp_3q26.2' versus Clinical Feature #1: 'Time to Death'
P value = 0.0554 (Fisher's exact test), Q value = 0.11
Table S22. Gene #10: 'amp_3q26.2' versus Clinical Feature #2: 'RADIATION_THERAPY'
| nPatients | NO | YES |
|---|---|---|
| ALL | 290 | 224 |
| AMP PEAK 10(3Q26.2) MUTATED | 81 | 81 |
| AMP PEAK 10(3Q26.2) WILD-TYPE | 209 | 143 |
Figure S22. Get High-res Image Gene #10: 'amp_3q26.2' versus Clinical Feature #2: 'RADIATION_THERAPY'
P value = 1e-05 (Fisher's exact test), Q value = 4e-05
Table S23. Gene #10: 'amp_3q26.2' versus Clinical Feature #3: 'HISTOLOGICAL_TYPE'
| nPatients | ENDOMETRIOID ENDOMETRIAL ADENOCARCINOMA | MIXED SEROUS AND ENDOMETRIOID | SEROUS ENDOMETRIAL ADENOCARCINOMA |
|---|---|---|---|
| ALL | 404 | 22 | 113 |
| AMP PEAK 10(3Q26.2) MUTATED | 76 | 8 | 91 |
| AMP PEAK 10(3Q26.2) WILD-TYPE | 328 | 14 | 22 |
Figure S23. Get High-res Image Gene #10: 'amp_3q26.2' versus Clinical Feature #3: 'HISTOLOGICAL_TYPE'
P value = 0.000326 (logrank test), Q value = 0.00096
Table S24. Gene #11: 'amp_3q26.2' versus Clinical Feature #1: 'Time to Death'
| nPatients | nDeath | Duration Range (Median), Month | |
|---|---|---|---|
| ALL | 537 | 90 | 0.1 - 225.5 (29.9) |
| AMP PEAK 11(3Q26.2) MUTATED | 164 | 42 | 0.1 - 225.5 (29.2) |
| AMP PEAK 11(3Q26.2) WILD-TYPE | 373 | 48 | 0.2 - 185.8 (30.0) |
Figure S24. Get High-res Image Gene #11: 'amp_3q26.2' versus Clinical Feature #1: 'Time to Death'
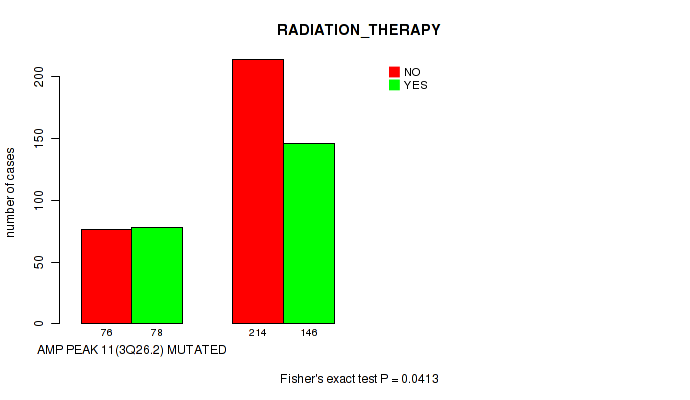
P value = 0.0413 (Fisher's exact test), Q value = 0.081
Table S25. Gene #11: 'amp_3q26.2' versus Clinical Feature #2: 'RADIATION_THERAPY'
| nPatients | NO | YES |
|---|---|---|
| ALL | 290 | 224 |
| AMP PEAK 11(3Q26.2) MUTATED | 76 | 78 |
| AMP PEAK 11(3Q26.2) WILD-TYPE | 214 | 146 |
Figure S25. Get High-res Image Gene #11: 'amp_3q26.2' versus Clinical Feature #2: 'RADIATION_THERAPY'
P value = 1e-05 (Fisher's exact test), Q value = 4e-05
Table S26. Gene #11: 'amp_3q26.2' versus Clinical Feature #3: 'HISTOLOGICAL_TYPE'
| nPatients | ENDOMETRIOID ENDOMETRIAL ADENOCARCINOMA | MIXED SEROUS AND ENDOMETRIOID | SEROUS ENDOMETRIAL ADENOCARCINOMA |
|---|---|---|---|
| ALL | 404 | 22 | 113 |
| AMP PEAK 11(3Q26.2) MUTATED | 68 | 8 | 88 |
| AMP PEAK 11(3Q26.2) WILD-TYPE | 336 | 14 | 25 |
Figure S26. Get High-res Image Gene #11: 'amp_3q26.2' versus Clinical Feature #3: 'HISTOLOGICAL_TYPE'

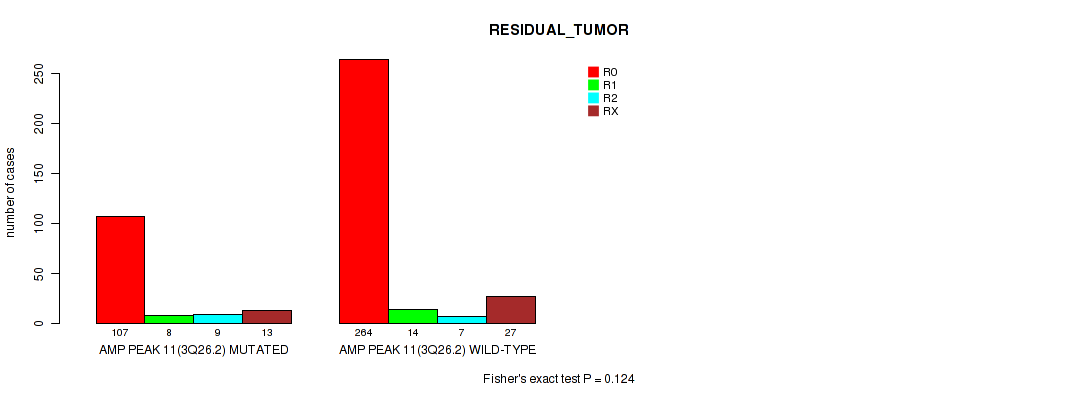
P value = 0.124 (Fisher's exact test), Q value = 0.21
Table S27. Gene #11: 'amp_3q26.2' versus Clinical Feature #4: 'RESIDUAL_TUMOR'
| nPatients | R0 | R1 | R2 | RX |
|---|---|---|---|---|
| ALL | 371 | 22 | 16 | 40 |
| AMP PEAK 11(3Q26.2) MUTATED | 107 | 8 | 9 | 13 |
| AMP PEAK 11(3Q26.2) WILD-TYPE | 264 | 14 | 7 | 27 |
Figure S27. Get High-res Image Gene #11: 'amp_3q26.2' versus Clinical Feature #4: 'RESIDUAL_TUMOR'
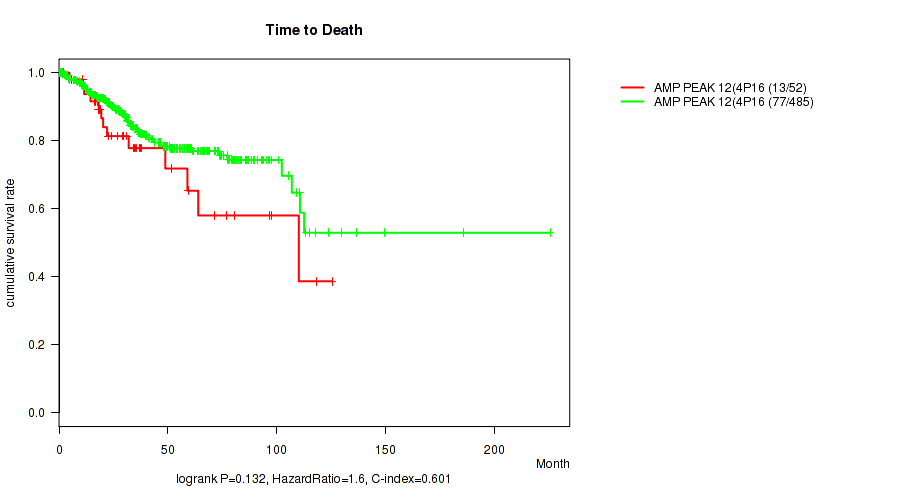
P value = 0.132 (logrank test), Q value = 0.21
Table S28. Gene #12: 'amp_4p16.3' versus Clinical Feature #1: 'Time to Death'
| nPatients | nDeath | Duration Range (Median), Month | |
|---|---|---|---|
| ALL | 537 | 90 | 0.1 - 225.5 (29.9) |
| AMP PEAK 12(4P16.3) MUTATED | 52 | 13 | 0.6 - 125.4 (29.2) |
| AMP PEAK 12(4P16.3) WILD-TYPE | 485 | 77 | 0.1 - 225.5 (30.0) |
Figure S28. Get High-res Image Gene #12: 'amp_4p16.3' versus Clinical Feature #1: 'Time to Death'
P value = 1e-05 (Fisher's exact test), Q value = 4e-05
Table S29. Gene #12: 'amp_4p16.3' versus Clinical Feature #3: 'HISTOLOGICAL_TYPE'
| nPatients | ENDOMETRIOID ENDOMETRIAL ADENOCARCINOMA | MIXED SEROUS AND ENDOMETRIOID | SEROUS ENDOMETRIAL ADENOCARCINOMA |
|---|---|---|---|
| ALL | 404 | 22 | 113 |
| AMP PEAK 12(4P16.3) MUTATED | 14 | 2 | 36 |
| AMP PEAK 12(4P16.3) WILD-TYPE | 390 | 20 | 77 |
Figure S29. Get High-res Image Gene #12: 'amp_4p16.3' versus Clinical Feature #3: 'HISTOLOGICAL_TYPE'

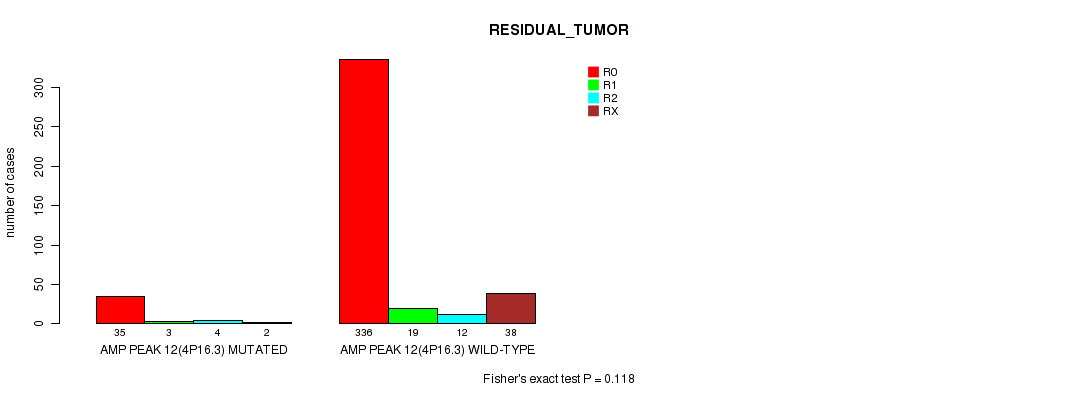
P value = 0.118 (Fisher's exact test), Q value = 0.2
Table S30. Gene #12: 'amp_4p16.3' versus Clinical Feature #4: 'RESIDUAL_TUMOR'
| nPatients | R0 | R1 | R2 | RX |
|---|---|---|---|---|
| ALL | 371 | 22 | 16 | 40 |
| AMP PEAK 12(4P16.3) MUTATED | 35 | 3 | 4 | 2 |
| AMP PEAK 12(4P16.3) WILD-TYPE | 336 | 19 | 12 | 38 |
Figure S30. Get High-res Image Gene #12: 'amp_4p16.3' versus Clinical Feature #4: 'RESIDUAL_TUMOR'
P value = 1.66e-06 (logrank test), Q value = 4e-05
Table S31. Gene #13: 'amp_5p15.33' versus Clinical Feature #1: 'Time to Death'
| nPatients | nDeath | Duration Range (Median), Month | |
|---|---|---|---|
| ALL | 537 | 90 | 0.1 - 225.5 (29.9) |
| AMP PEAK 13(5P15.33) MUTATED | 88 | 28 | 0.2 - 125.4 (23.2) |
| AMP PEAK 13(5P15.33) WILD-TYPE | 449 | 62 | 0.1 - 225.5 (30.1) |
Figure S31. Get High-res Image Gene #13: 'amp_5p15.33' versus Clinical Feature #1: 'Time to Death'
P value = 1e-05 (Fisher's exact test), Q value = 4e-05
Table S32. Gene #13: 'amp_5p15.33' versus Clinical Feature #3: 'HISTOLOGICAL_TYPE'
| nPatients | ENDOMETRIOID ENDOMETRIAL ADENOCARCINOMA | MIXED SEROUS AND ENDOMETRIOID | SEROUS ENDOMETRIAL ADENOCARCINOMA |
|---|---|---|---|
| ALL | 404 | 22 | 113 |
| AMP PEAK 13(5P15.33) MUTATED | 30 | 3 | 56 |
| AMP PEAK 13(5P15.33) WILD-TYPE | 374 | 19 | 57 |
Figure S32. Get High-res Image Gene #13: 'amp_5p15.33' versus Clinical Feature #3: 'HISTOLOGICAL_TYPE'

P value = 0.142 (Fisher's exact test), Q value = 0.23
Table S33. Gene #13: 'amp_5p15.33' versus Clinical Feature #4: 'RESIDUAL_TUMOR'
| nPatients | R0 | R1 | R2 | RX |
|---|---|---|---|---|
| ALL | 371 | 22 | 16 | 40 |
| AMP PEAK 13(5P15.33) MUTATED | 58 | 3 | 6 | 8 |
| AMP PEAK 13(5P15.33) WILD-TYPE | 313 | 19 | 10 | 32 |
Figure S33. Get High-res Image Gene #13: 'amp_5p15.33' versus Clinical Feature #4: 'RESIDUAL_TUMOR'

P value = 5.46e-05 (logrank test), Q value = 0.00019
Table S34. Gene #14: 'amp_5q35.3' versus Clinical Feature #1: 'Time to Death'
| nPatients | nDeath | Duration Range (Median), Month | |
|---|---|---|---|
| ALL | 537 | 90 | 0.1 - 225.5 (29.9) |
| AMP PEAK 14(5Q35.3) MUTATED | 56 | 18 | 0.4 - 110.6 (22.0) |
| AMP PEAK 14(5Q35.3) WILD-TYPE | 481 | 72 | 0.1 - 225.5 (30.7) |
Figure S34. Get High-res Image Gene #14: 'amp_5q35.3' versus Clinical Feature #1: 'Time to Death'
P value = 1e-05 (Fisher's exact test), Q value = 4e-05
Table S35. Gene #14: 'amp_5q35.3' versus Clinical Feature #3: 'HISTOLOGICAL_TYPE'
| nPatients | ENDOMETRIOID ENDOMETRIAL ADENOCARCINOMA | MIXED SEROUS AND ENDOMETRIOID | SEROUS ENDOMETRIAL ADENOCARCINOMA |
|---|---|---|---|
| ALL | 404 | 22 | 113 |
| AMP PEAK 14(5Q35.3) MUTATED | 22 | 3 | 32 |
| AMP PEAK 14(5Q35.3) WILD-TYPE | 382 | 19 | 81 |
Figure S35. Get High-res Image Gene #14: 'amp_5q35.3' versus Clinical Feature #3: 'HISTOLOGICAL_TYPE'

P value = 0.0197 (logrank test), Q value = 0.043
Table S36. Gene #15: 'amp_6p24.2' versus Clinical Feature #1: 'Time to Death'
| nPatients | nDeath | Duration Range (Median), Month | |
|---|---|---|---|
| ALL | 537 | 90 | 0.1 - 225.5 (29.9) |
| AMP PEAK 15(6P24.2) MUTATED | 117 | 30 | 0.1 - 125.4 (32.0) |
| AMP PEAK 15(6P24.2) WILD-TYPE | 420 | 60 | 0.2 - 225.5 (28.5) |
Figure S36. Get High-res Image Gene #15: 'amp_6p24.2' versus Clinical Feature #1: 'Time to Death'

P value = 1e-05 (Fisher's exact test), Q value = 4e-05
Table S37. Gene #15: 'amp_6p24.2' versus Clinical Feature #3: 'HISTOLOGICAL_TYPE'
| nPatients | ENDOMETRIOID ENDOMETRIAL ADENOCARCINOMA | MIXED SEROUS AND ENDOMETRIOID | SEROUS ENDOMETRIAL ADENOCARCINOMA |
|---|---|---|---|
| ALL | 404 | 22 | 113 |
| AMP PEAK 15(6P24.2) MUTATED | 47 | 5 | 65 |
| AMP PEAK 15(6P24.2) WILD-TYPE | 357 | 17 | 48 |
Figure S37. Get High-res Image Gene #15: 'amp_6p24.2' versus Clinical Feature #3: 'HISTOLOGICAL_TYPE'

P value = 0.0348 (logrank test), Q value = 0.069
Table S38. Gene #16: 'amp_6q25.1' versus Clinical Feature #1: 'Time to Death'
| nPatients | nDeath | Duration Range (Median), Month | |
|---|---|---|---|
| ALL | 537 | 90 | 0.1 - 225.5 (29.9) |
| AMP PEAK 16(6Q25.1) MUTATED | 88 | 21 | 0.1 - 109.1 (28.9) |
| AMP PEAK 16(6Q25.1) WILD-TYPE | 449 | 69 | 0.2 - 225.5 (29.9) |
Figure S38. Get High-res Image Gene #16: 'amp_6q25.1' versus Clinical Feature #1: 'Time to Death'
P value = 1e-05 (Fisher's exact test), Q value = 4e-05
Table S39. Gene #16: 'amp_6q25.1' versus Clinical Feature #3: 'HISTOLOGICAL_TYPE'
| nPatients | ENDOMETRIOID ENDOMETRIAL ADENOCARCINOMA | MIXED SEROUS AND ENDOMETRIOID | SEROUS ENDOMETRIAL ADENOCARCINOMA |
|---|---|---|---|
| ALL | 404 | 22 | 113 |
| AMP PEAK 16(6Q25.1) MUTATED | 47 | 3 | 38 |
| AMP PEAK 16(6Q25.1) WILD-TYPE | 357 | 19 | 75 |
Figure S39. Get High-res Image Gene #16: 'amp_6q25.1' versus Clinical Feature #3: 'HISTOLOGICAL_TYPE'

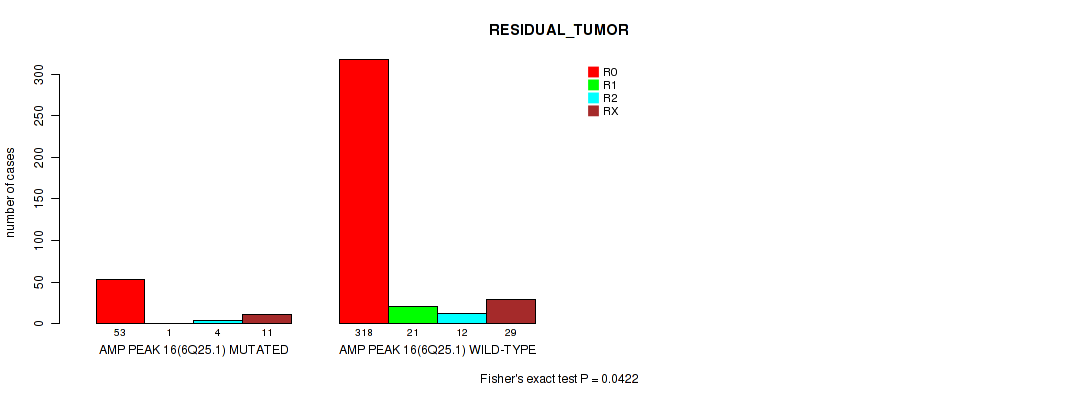
P value = 0.0422 (Fisher's exact test), Q value = 0.083
Table S40. Gene #16: 'amp_6q25.1' versus Clinical Feature #4: 'RESIDUAL_TUMOR'
| nPatients | R0 | R1 | R2 | RX |
|---|---|---|---|---|
| ALL | 371 | 22 | 16 | 40 |
| AMP PEAK 16(6Q25.1) MUTATED | 53 | 1 | 4 | 11 |
| AMP PEAK 16(6Q25.1) WILD-TYPE | 318 | 21 | 12 | 29 |
Figure S40. Get High-res Image Gene #16: 'amp_6q25.1' versus Clinical Feature #4: 'RESIDUAL_TUMOR'
P value = 2.95e-05 (logrank test), Q value = 0.00011
Table S41. Gene #17: 'amp_7q31.2' versus Clinical Feature #1: 'Time to Death'
| nPatients | nDeath | Duration Range (Median), Month | |
|---|---|---|---|
| ALL | 537 | 90 | 0.1 - 225.5 (29.9) |
| AMP PEAK 17(7Q31.2) MUTATED | 92 | 27 | 0.2 - 125.4 (22.6) |
| AMP PEAK 17(7Q31.2) WILD-TYPE | 445 | 63 | 0.1 - 225.5 (31.0) |
Figure S41. Get High-res Image Gene #17: 'amp_7q31.2' versus Clinical Feature #1: 'Time to Death'

P value = 4e-05 (Fisher's exact test), Q value = 0.00015
Table S42. Gene #17: 'amp_7q31.2' versus Clinical Feature #3: 'HISTOLOGICAL_TYPE'
| nPatients | ENDOMETRIOID ENDOMETRIAL ADENOCARCINOMA | MIXED SEROUS AND ENDOMETRIOID | SEROUS ENDOMETRIAL ADENOCARCINOMA |
|---|---|---|---|
| ALL | 404 | 22 | 113 |
| AMP PEAK 17(7Q31.2) MUTATED | 53 | 5 | 35 |
| AMP PEAK 17(7Q31.2) WILD-TYPE | 351 | 17 | 78 |
Figure S42. Get High-res Image Gene #17: 'amp_7q31.2' versus Clinical Feature #3: 'HISTOLOGICAL_TYPE'

P value = 0.0116 (logrank test), Q value = 0.026
Table S43. Gene #18: 'amp_8p11.22' versus Clinical Feature #1: 'Time to Death'
| nPatients | nDeath | Duration Range (Median), Month | |
|---|---|---|---|
| ALL | 537 | 90 | 0.1 - 225.5 (29.9) |
| AMP PEAK 18(8P11.22) MUTATED | 126 | 30 | 0.1 - 136.6 (30.1) |
| AMP PEAK 18(8P11.22) WILD-TYPE | 411 | 60 | 0.1 - 225.5 (29.9) |
Figure S43. Get High-res Image Gene #18: 'amp_8p11.22' versus Clinical Feature #1: 'Time to Death'
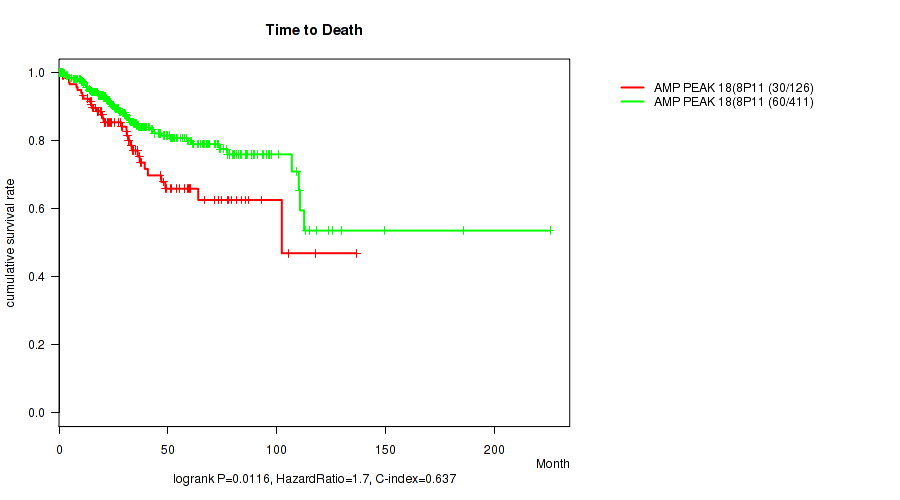
P value = 8.94e-05 (logrank test), Q value = 0.00031
Table S44. Gene #19: 'amp_8p11.21' versus Clinical Feature #1: 'Time to Death'
| nPatients | nDeath | Duration Range (Median), Month | |
|---|---|---|---|
| ALL | 537 | 90 | 0.1 - 225.5 (29.9) |
| AMP PEAK 19(8P11.21) MUTATED | 162 | 42 | 0.1 - 136.6 (27.5) |
| AMP PEAK 19(8P11.21) WILD-TYPE | 375 | 48 | 0.2 - 225.5 (30.1) |
Figure S44. Get High-res Image Gene #19: 'amp_8p11.21' versus Clinical Feature #1: 'Time to Death'

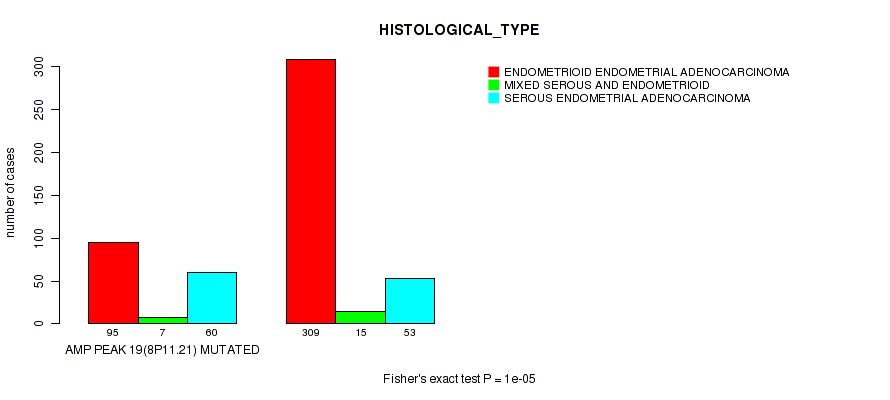
P value = 1e-05 (Fisher's exact test), Q value = 4e-05
Table S45. Gene #19: 'amp_8p11.21' versus Clinical Feature #3: 'HISTOLOGICAL_TYPE'
| nPatients | ENDOMETRIOID ENDOMETRIAL ADENOCARCINOMA | MIXED SEROUS AND ENDOMETRIOID | SEROUS ENDOMETRIAL ADENOCARCINOMA |
|---|---|---|---|
| ALL | 404 | 22 | 113 |
| AMP PEAK 19(8P11.21) MUTATED | 95 | 7 | 60 |
| AMP PEAK 19(8P11.21) WILD-TYPE | 309 | 15 | 53 |
Figure S45. Get High-res Image Gene #19: 'amp_8p11.21' versus Clinical Feature #3: 'HISTOLOGICAL_TYPE'
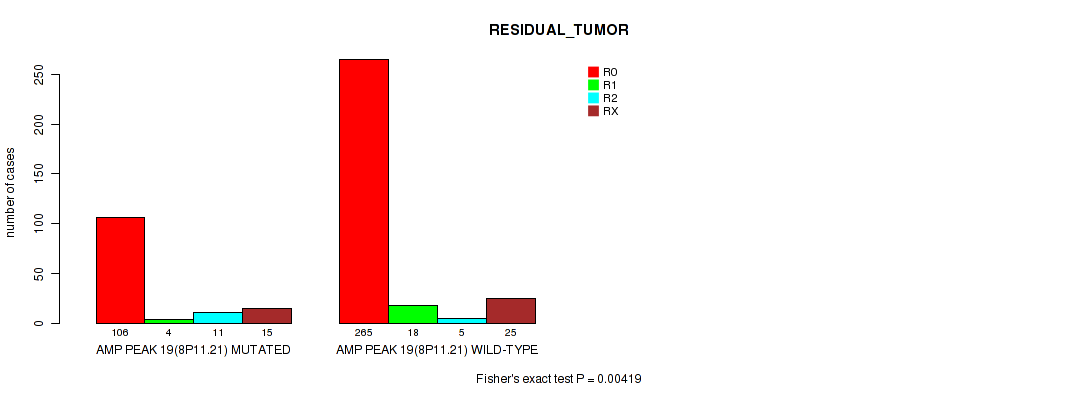
P value = 0.00419 (Fisher's exact test), Q value = 0.01
Table S46. Gene #19: 'amp_8p11.21' versus Clinical Feature #4: 'RESIDUAL_TUMOR'
| nPatients | R0 | R1 | R2 | RX |
|---|---|---|---|---|
| ALL | 371 | 22 | 16 | 40 |
| AMP PEAK 19(8P11.21) MUTATED | 106 | 4 | 11 | 15 |
| AMP PEAK 19(8P11.21) WILD-TYPE | 265 | 18 | 5 | 25 |
Figure S46. Get High-res Image Gene #19: 'amp_8p11.21' versus Clinical Feature #4: 'RESIDUAL_TUMOR'
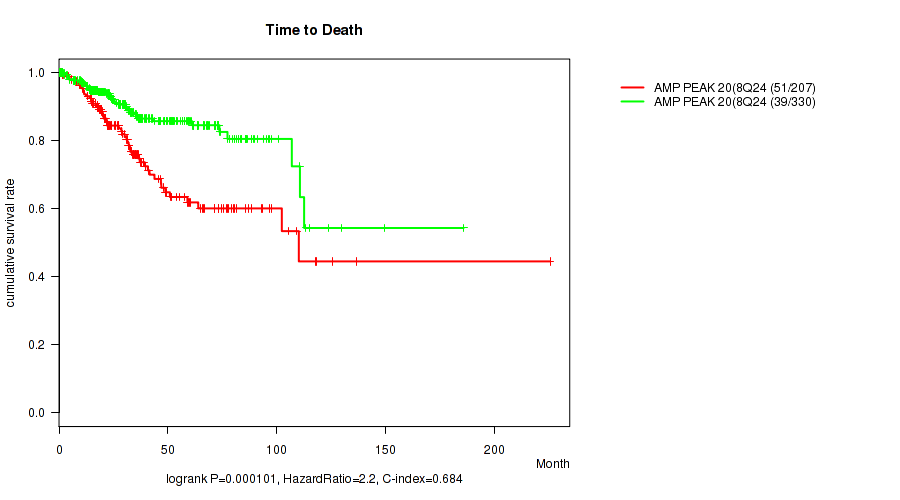
P value = 0.000101 (logrank test), Q value = 0.00034
Table S47. Gene #20: 'amp_8q24.21' versus Clinical Feature #1: 'Time to Death'
| nPatients | nDeath | Duration Range (Median), Month | |
|---|---|---|---|
| ALL | 537 | 90 | 0.1 - 225.5 (29.9) |
| AMP PEAK 20(8Q24.21) MUTATED | 207 | 51 | 0.1 - 225.5 (27.4) |
| AMP PEAK 20(8Q24.21) WILD-TYPE | 330 | 39 | 0.2 - 185.8 (30.6) |
Figure S47. Get High-res Image Gene #20: 'amp_8q24.21' versus Clinical Feature #1: 'Time to Death'
P value = 1e-05 (Fisher's exact test), Q value = 4e-05
Table S48. Gene #20: 'amp_8q24.21' versus Clinical Feature #3: 'HISTOLOGICAL_TYPE'
| nPatients | ENDOMETRIOID ENDOMETRIAL ADENOCARCINOMA | MIXED SEROUS AND ENDOMETRIOID | SEROUS ENDOMETRIAL ADENOCARCINOMA |
|---|---|---|---|
| ALL | 404 | 22 | 113 |
| AMP PEAK 20(8Q24.21) MUTATED | 118 | 11 | 80 |
| AMP PEAK 20(8Q24.21) WILD-TYPE | 286 | 11 | 33 |
Figure S48. Get High-res Image Gene #20: 'amp_8q24.21' versus Clinical Feature #3: 'HISTOLOGICAL_TYPE'
P value = 0.153 (Fisher's exact test), Q value = 0.24
Table S49. Gene #20: 'amp_8q24.21' versus Clinical Feature #4: 'RESIDUAL_TUMOR'
| nPatients | R0 | R1 | R2 | RX |
|---|---|---|---|---|
| ALL | 371 | 22 | 16 | 40 |
| AMP PEAK 20(8Q24.21) MUTATED | 140 | 6 | 10 | 17 |
| AMP PEAK 20(8Q24.21) WILD-TYPE | 231 | 16 | 6 | 23 |
Figure S49. Get High-res Image Gene #20: 'amp_8q24.21' versus Clinical Feature #4: 'RESIDUAL_TUMOR'
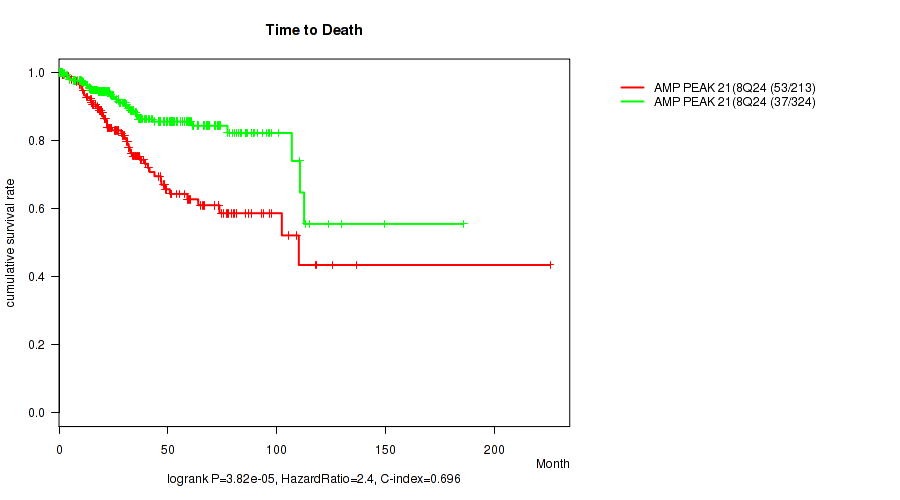
P value = 3.82e-05 (logrank test), Q value = 0.00014
Table S50. Gene #21: 'amp_8q24.21' versus Clinical Feature #1: 'Time to Death'
| nPatients | nDeath | Duration Range (Median), Month | |
|---|---|---|---|
| ALL | 537 | 90 | 0.1 - 225.5 (29.9) |
| AMP PEAK 21(8Q24.21) MUTATED | 213 | 53 | 0.1 - 225.5 (27.2) |
| AMP PEAK 21(8Q24.21) WILD-TYPE | 324 | 37 | 0.2 - 185.8 (30.7) |
Figure S50. Get High-res Image Gene #21: 'amp_8q24.21' versus Clinical Feature #1: 'Time to Death'
P value = 1e-05 (Fisher's exact test), Q value = 4e-05
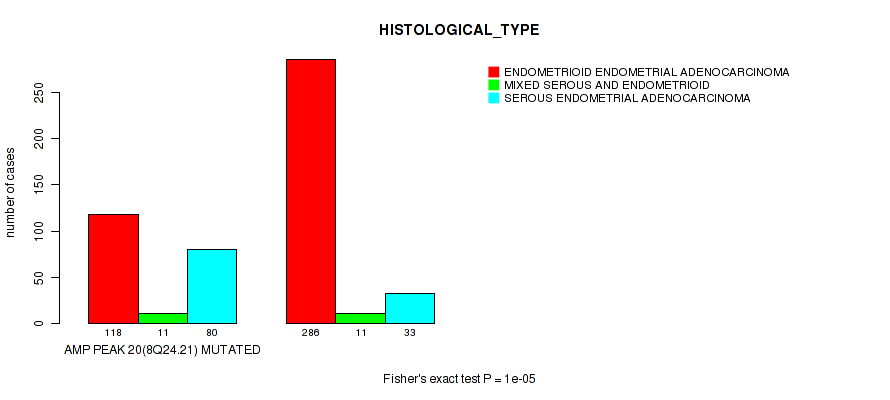
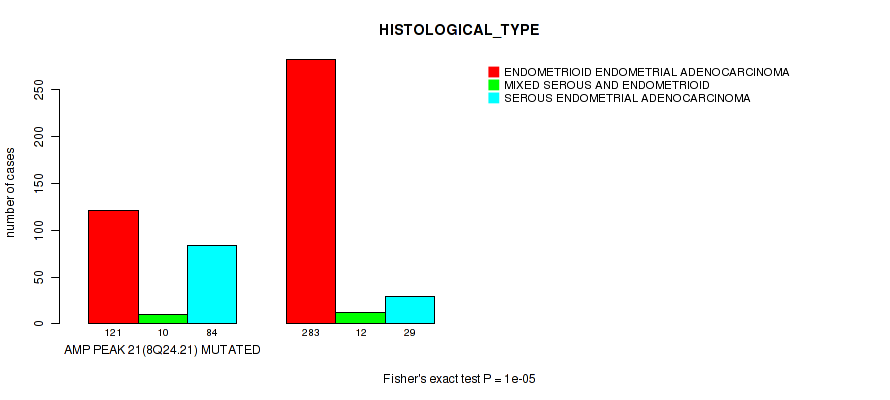
Table S51. Gene #21: 'amp_8q24.21' versus Clinical Feature #3: 'HISTOLOGICAL_TYPE'
| nPatients | ENDOMETRIOID ENDOMETRIAL ADENOCARCINOMA | MIXED SEROUS AND ENDOMETRIOID | SEROUS ENDOMETRIAL ADENOCARCINOMA |
|---|---|---|---|
| ALL | 404 | 22 | 113 |
| AMP PEAK 21(8Q24.21) MUTATED | 121 | 10 | 84 |
| AMP PEAK 21(8Q24.21) WILD-TYPE | 283 | 12 | 29 |
Figure S51. Get High-res Image Gene #21: 'amp_8q24.21' versus Clinical Feature #3: 'HISTOLOGICAL_TYPE'
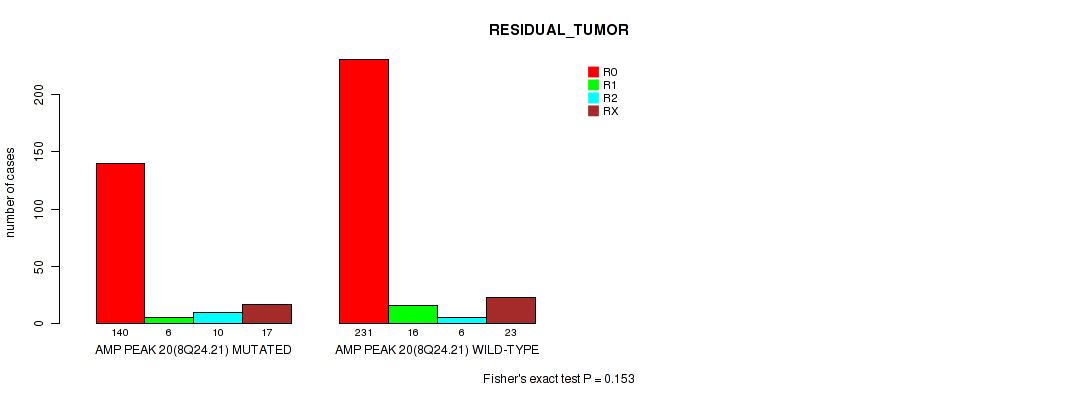
P value = 0.023 (Fisher's exact test), Q value = 0.049
Table S52. Gene #21: 'amp_8q24.21' versus Clinical Feature #4: 'RESIDUAL_TUMOR'
| nPatients | R0 | R1 | R2 | RX |
|---|---|---|---|---|
| ALL | 371 | 22 | 16 | 40 |
| AMP PEAK 21(8Q24.21) MUTATED | 145 | 6 | 12 | 16 |
| AMP PEAK 21(8Q24.21) WILD-TYPE | 226 | 16 | 4 | 24 |
Figure S52. Get High-res Image Gene #21: 'amp_8q24.21' versus Clinical Feature #4: 'RESIDUAL_TUMOR'
P value = 0.0285 (logrank test), Q value = 0.059
Table S53. Gene #22: 'amp_9p24.2' versus Clinical Feature #1: 'Time to Death'
| nPatients | nDeath | Duration Range (Median), Month | |
|---|---|---|---|
| ALL | 537 | 90 | 0.1 - 225.5 (29.9) |
| AMP PEAK 22(9P24.2) MUTATED | 64 | 18 | 0.1 - 125.4 (30.6) |
| AMP PEAK 22(9P24.2) WILD-TYPE | 473 | 72 | 0.1 - 225.5 (29.9) |
Figure S53. Get High-res Image Gene #22: 'amp_9p24.2' versus Clinical Feature #1: 'Time to Death'
P value = 1e-05 (Fisher's exact test), Q value = 4e-05
Table S54. Gene #22: 'amp_9p24.2' versus Clinical Feature #3: 'HISTOLOGICAL_TYPE'
| nPatients | ENDOMETRIOID ENDOMETRIAL ADENOCARCINOMA | MIXED SEROUS AND ENDOMETRIOID | SEROUS ENDOMETRIAL ADENOCARCINOMA |
|---|---|---|---|
| ALL | 404 | 22 | 113 |
| AMP PEAK 22(9P24.2) MUTATED | 26 | 3 | 36 |
| AMP PEAK 22(9P24.2) WILD-TYPE | 378 | 19 | 77 |
Figure S54. Get High-res Image Gene #22: 'amp_9p24.2' versus Clinical Feature #3: 'HISTOLOGICAL_TYPE'

P value = 0.0936 (Fisher's exact test), Q value = 0.17
Table S55. Gene #22: 'amp_9p24.2' versus Clinical Feature #4: 'RESIDUAL_TUMOR'
| nPatients | R0 | R1 | R2 | RX |
|---|---|---|---|---|
| ALL | 371 | 22 | 16 | 40 |
| AMP PEAK 22(9P24.2) MUTATED | 39 | 3 | 3 | 9 |
| AMP PEAK 22(9P24.2) WILD-TYPE | 332 | 19 | 13 | 31 |
Figure S55. Get High-res Image Gene #22: 'amp_9p24.2' versus Clinical Feature #4: 'RESIDUAL_TUMOR'

P value = 0.00993 (logrank test), Q value = 0.023
Table S56. Gene #23: 'amp_9q34.3' versus Clinical Feature #1: 'Time to Death'
| nPatients | nDeath | Duration Range (Median), Month | |
|---|---|---|---|
| ALL | 537 | 90 | 0.1 - 225.5 (29.9) |
| AMP PEAK 23(9Q34.3) MUTATED | 39 | 11 | 0.1 - 71.2 (27.3) |
| AMP PEAK 23(9Q34.3) WILD-TYPE | 498 | 79 | 0.1 - 225.5 (30.0) |
Figure S56. Get High-res Image Gene #23: 'amp_9q34.3' versus Clinical Feature #1: 'Time to Death'
P value = 1e-05 (Fisher's exact test), Q value = 4e-05
Table S57. Gene #23: 'amp_9q34.3' versus Clinical Feature #3: 'HISTOLOGICAL_TYPE'
| nPatients | ENDOMETRIOID ENDOMETRIAL ADENOCARCINOMA | MIXED SEROUS AND ENDOMETRIOID | SEROUS ENDOMETRIAL ADENOCARCINOMA |
|---|---|---|---|
| ALL | 404 | 22 | 113 |
| AMP PEAK 23(9Q34.3) MUTATED | 13 | 5 | 21 |
| AMP PEAK 23(9Q34.3) WILD-TYPE | 391 | 17 | 92 |
Figure S57. Get High-res Image Gene #23: 'amp_9q34.3' versus Clinical Feature #3: 'HISTOLOGICAL_TYPE'

P value = 0.0027 (Fisher's exact test), Q value = 0.0069
Table S58. Gene #24: 'amp_10q22.2' versus Clinical Feature #3: 'HISTOLOGICAL_TYPE'
| nPatients | ENDOMETRIOID ENDOMETRIAL ADENOCARCINOMA | MIXED SEROUS AND ENDOMETRIOID | SEROUS ENDOMETRIAL ADENOCARCINOMA |
|---|---|---|---|
| ALL | 404 | 22 | 113 |
| AMP PEAK 24(10Q22.2) MUTATED | 96 | 3 | 44 |
| AMP PEAK 24(10Q22.2) WILD-TYPE | 308 | 19 | 69 |
Figure S58. Get High-res Image Gene #24: 'amp_10q22.2' versus Clinical Feature #3: 'HISTOLOGICAL_TYPE'
P value = 0.000305 (logrank test), Q value = 0.00093
Table S59. Gene #25: 'amp_11p11.2' versus Clinical Feature #1: 'Time to Death'
| nPatients | nDeath | Duration Range (Median), Month | |
|---|---|---|---|
| ALL | 537 | 90 | 0.1 - 225.5 (29.9) |
| AMP PEAK 25(11P11.2) MUTATED | 52 | 18 | 1.4 - 110.6 (27.1) |
| AMP PEAK 25(11P11.2) WILD-TYPE | 485 | 72 | 0.1 - 225.5 (30.0) |
Figure S59. Get High-res Image Gene #25: 'amp_11p11.2' versus Clinical Feature #1: 'Time to Death'

P value = 1e-05 (Fisher's exact test), Q value = 4e-05
Table S60. Gene #25: 'amp_11p11.2' versus Clinical Feature #3: 'HISTOLOGICAL_TYPE'
| nPatients | ENDOMETRIOID ENDOMETRIAL ADENOCARCINOMA | MIXED SEROUS AND ENDOMETRIOID | SEROUS ENDOMETRIAL ADENOCARCINOMA |
|---|---|---|---|
| ALL | 404 | 22 | 113 |
| AMP PEAK 25(11P11.2) MUTATED | 17 | 4 | 31 |
| AMP PEAK 25(11P11.2) WILD-TYPE | 387 | 18 | 82 |
Figure S60. Get High-res Image Gene #25: 'amp_11p11.2' versus Clinical Feature #3: 'HISTOLOGICAL_TYPE'

P value = 0.00854 (logrank test), Q value = 0.02
Table S61. Gene #26: 'amp_11q13.2' versus Clinical Feature #1: 'Time to Death'
| nPatients | nDeath | Duration Range (Median), Month | |
|---|---|---|---|
| ALL | 537 | 90 | 0.1 - 225.5 (29.9) |
| AMP PEAK 26(11Q13.2) MUTATED | 74 | 20 | 0.1 - 109.1 (30.6) |
| AMP PEAK 26(11Q13.2) WILD-TYPE | 463 | 70 | 0.1 - 225.5 (29.7) |
Figure S61. Get High-res Image Gene #26: 'amp_11q13.2' versus Clinical Feature #1: 'Time to Death'

P value = 1e-05 (Fisher's exact test), Q value = 4e-05
Table S62. Gene #26: 'amp_11q13.2' versus Clinical Feature #3: 'HISTOLOGICAL_TYPE'
| nPatients | ENDOMETRIOID ENDOMETRIAL ADENOCARCINOMA | MIXED SEROUS AND ENDOMETRIOID | SEROUS ENDOMETRIAL ADENOCARCINOMA |
|---|---|---|---|
| ALL | 404 | 22 | 113 |
| AMP PEAK 26(11Q13.2) MUTATED | 36 | 4 | 34 |
| AMP PEAK 26(11Q13.2) WILD-TYPE | 368 | 18 | 79 |
Figure S62. Get High-res Image Gene #26: 'amp_11q13.2' versus Clinical Feature #3: 'HISTOLOGICAL_TYPE'

P value = 0.086 (Fisher's exact test), Q value = 0.16
Table S63. Gene #26: 'amp_11q13.2' versus Clinical Feature #4: 'RESIDUAL_TUMOR'
| nPatients | R0 | R1 | R2 | RX |
|---|---|---|---|---|
| ALL | 371 | 22 | 16 | 40 |
| AMP PEAK 26(11Q13.2) MUTATED | 43 | 2 | 3 | 10 |
| AMP PEAK 26(11Q13.2) WILD-TYPE | 328 | 20 | 13 | 30 |
Figure S63. Get High-res Image Gene #26: 'amp_11q13.2' versus Clinical Feature #4: 'RESIDUAL_TUMOR'

P value = 1.2e-05 (logrank test), Q value = 4.8e-05
Table S64. Gene #27: 'amp_11q14.1' versus Clinical Feature #1: 'Time to Death'
| nPatients | nDeath | Duration Range (Median), Month | |
|---|---|---|---|
| ALL | 537 | 90 | 0.1 - 225.5 (29.9) |
| AMP PEAK 27(11Q14.1) MUTATED | 60 | 21 | 0.4 - 109.1 (25.9) |
| AMP PEAK 27(11Q14.1) WILD-TYPE | 477 | 69 | 0.1 - 225.5 (30.1) |
Figure S64. Get High-res Image Gene #27: 'amp_11q14.1' versus Clinical Feature #1: 'Time to Death'

P value = 1e-05 (Fisher's exact test), Q value = 4e-05
Table S65. Gene #27: 'amp_11q14.1' versus Clinical Feature #3: 'HISTOLOGICAL_TYPE'
| nPatients | ENDOMETRIOID ENDOMETRIAL ADENOCARCINOMA | MIXED SEROUS AND ENDOMETRIOID | SEROUS ENDOMETRIAL ADENOCARCINOMA |
|---|---|---|---|
| ALL | 404 | 22 | 113 |
| AMP PEAK 27(11Q14.1) MUTATED | 24 | 1 | 35 |
| AMP PEAK 27(11Q14.1) WILD-TYPE | 380 | 21 | 78 |
Figure S65. Get High-res Image Gene #27: 'amp_11q14.1' versus Clinical Feature #3: 'HISTOLOGICAL_TYPE'

P value = 0.0283 (Fisher's exact test), Q value = 0.059
Table S66. Gene #27: 'amp_11q14.1' versus Clinical Feature #4: 'RESIDUAL_TUMOR'
| nPatients | R0 | R1 | R2 | RX |
|---|---|---|---|---|
| ALL | 371 | 22 | 16 | 40 |
| AMP PEAK 27(11Q14.1) MUTATED | 33 | 1 | 3 | 9 |
| AMP PEAK 27(11Q14.1) WILD-TYPE | 338 | 21 | 13 | 31 |
Figure S66. Get High-res Image Gene #27: 'amp_11q14.1' versus Clinical Feature #4: 'RESIDUAL_TUMOR'

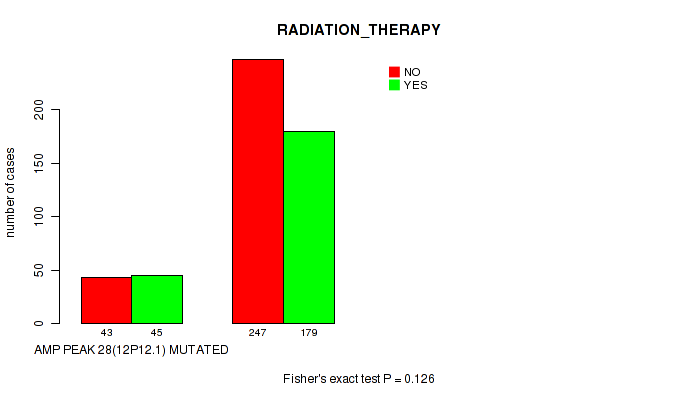
P value = 0.126 (Fisher's exact test), Q value = 0.21
Table S67. Gene #28: 'amp_12p12.1' versus Clinical Feature #2: 'RADIATION_THERAPY'
| nPatients | NO | YES |
|---|---|---|
| ALL | 290 | 224 |
| AMP PEAK 28(12P12.1) MUTATED | 43 | 45 |
| AMP PEAK 28(12P12.1) WILD-TYPE | 247 | 179 |
Figure S67. Get High-res Image Gene #28: 'amp_12p12.1' versus Clinical Feature #2: 'RADIATION_THERAPY'
P value = 1e-05 (Fisher's exact test), Q value = 4e-05
Table S68. Gene #28: 'amp_12p12.1' versus Clinical Feature #3: 'HISTOLOGICAL_TYPE'
| nPatients | ENDOMETRIOID ENDOMETRIAL ADENOCARCINOMA | MIXED SEROUS AND ENDOMETRIOID | SEROUS ENDOMETRIAL ADENOCARCINOMA |
|---|---|---|---|
| ALL | 404 | 22 | 113 |
| AMP PEAK 28(12P12.1) MUTATED | 44 | 4 | 44 |
| AMP PEAK 28(12P12.1) WILD-TYPE | 360 | 18 | 69 |
Figure S68. Get High-res Image Gene #28: 'amp_12p12.1' versus Clinical Feature #3: 'HISTOLOGICAL_TYPE'

P value = 1e-05 (Fisher's exact test), Q value = 4e-05
Table S69. Gene #29: 'amp_12q13.11' versus Clinical Feature #3: 'HISTOLOGICAL_TYPE'
| nPatients | ENDOMETRIOID ENDOMETRIAL ADENOCARCINOMA | MIXED SEROUS AND ENDOMETRIOID | SEROUS ENDOMETRIAL ADENOCARCINOMA |
|---|---|---|---|
| ALL | 404 | 22 | 113 |
| AMP PEAK 29(12Q13.11) MUTATED | 41 | 4 | 42 |
| AMP PEAK 29(12Q13.11) WILD-TYPE | 363 | 18 | 71 |
Figure S69. Get High-res Image Gene #29: 'amp_12q13.11' versus Clinical Feature #3: 'HISTOLOGICAL_TYPE'

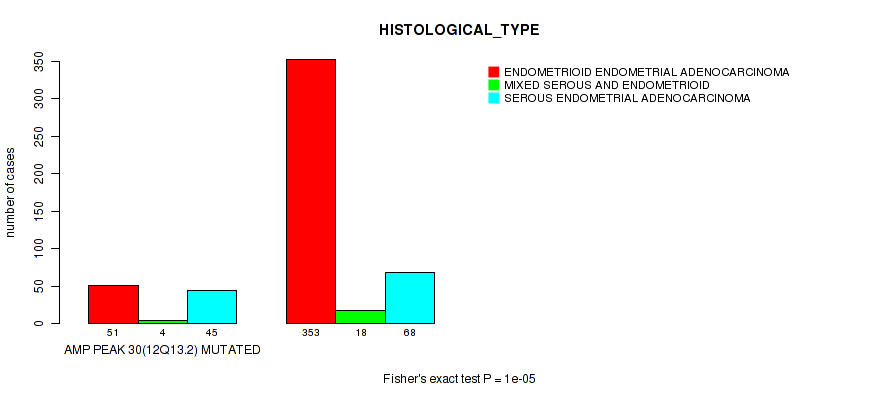
P value = 1e-05 (Fisher's exact test), Q value = 4e-05
Table S70. Gene #30: 'amp_12q13.2' versus Clinical Feature #3: 'HISTOLOGICAL_TYPE'
| nPatients | ENDOMETRIOID ENDOMETRIAL ADENOCARCINOMA | MIXED SEROUS AND ENDOMETRIOID | SEROUS ENDOMETRIAL ADENOCARCINOMA |
|---|---|---|---|
| ALL | 404 | 22 | 113 |
| AMP PEAK 30(12Q13.2) MUTATED | 51 | 4 | 45 |
| AMP PEAK 30(12Q13.2) WILD-TYPE | 353 | 18 | 68 |
Figure S70. Get High-res Image Gene #30: 'amp_12q13.2' versus Clinical Feature #3: 'HISTOLOGICAL_TYPE'
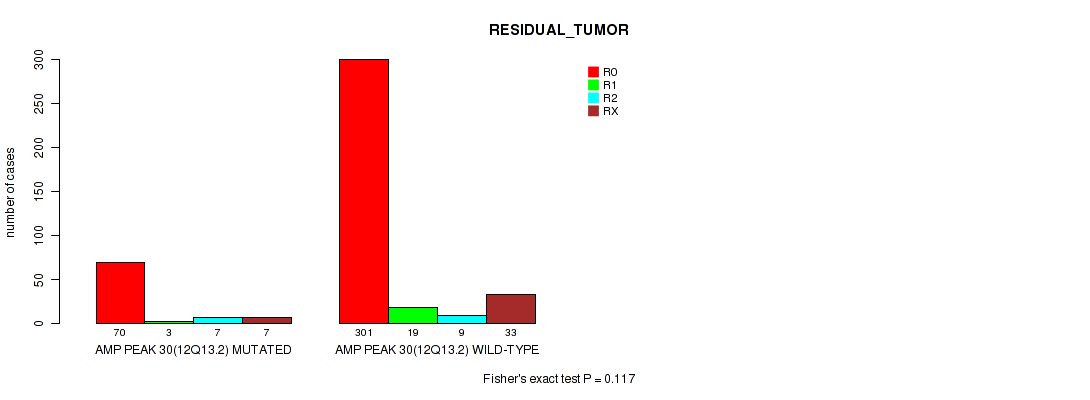
P value = 0.117 (Fisher's exact test), Q value = 0.2
Table S71. Gene #30: 'amp_12q13.2' versus Clinical Feature #4: 'RESIDUAL_TUMOR'
| nPatients | R0 | R1 | R2 | RX |
|---|---|---|---|---|
| ALL | 371 | 22 | 16 | 40 |
| AMP PEAK 30(12Q13.2) MUTATED | 70 | 3 | 7 | 7 |
| AMP PEAK 30(12Q13.2) WILD-TYPE | 301 | 19 | 9 | 33 |
Figure S71. Get High-res Image Gene #30: 'amp_12q13.2' versus Clinical Feature #4: 'RESIDUAL_TUMOR'
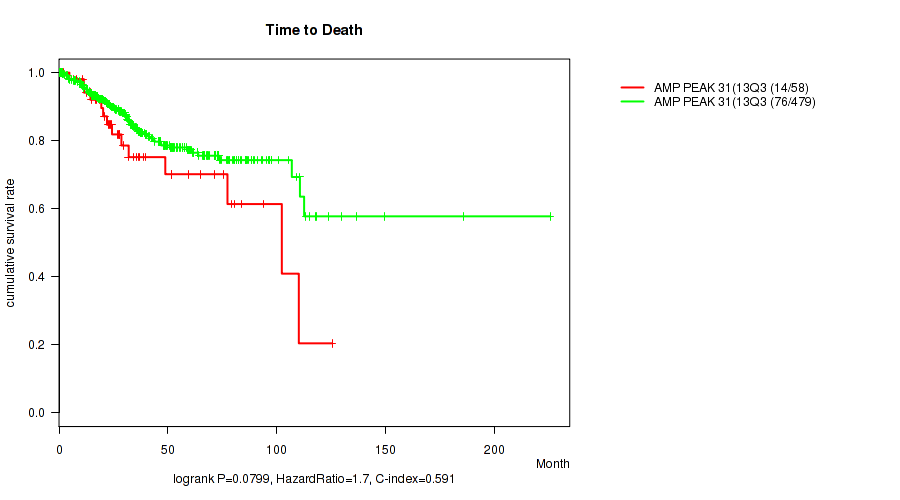
P value = 0.0799 (logrank test), Q value = 0.15
Table S72. Gene #31: 'amp_13q34' versus Clinical Feature #1: 'Time to Death'
| nPatients | nDeath | Duration Range (Median), Month | |
|---|---|---|---|
| ALL | 537 | 90 | 0.1 - 225.5 (29.9) |
| AMP PEAK 31(13Q34) MUTATED | 58 | 14 | 0.6 - 125.4 (25.6) |
| AMP PEAK 31(13Q34) WILD-TYPE | 479 | 76 | 0.1 - 225.5 (30.1) |
Figure S72. Get High-res Image Gene #31: 'amp_13q34' versus Clinical Feature #1: 'Time to Death'
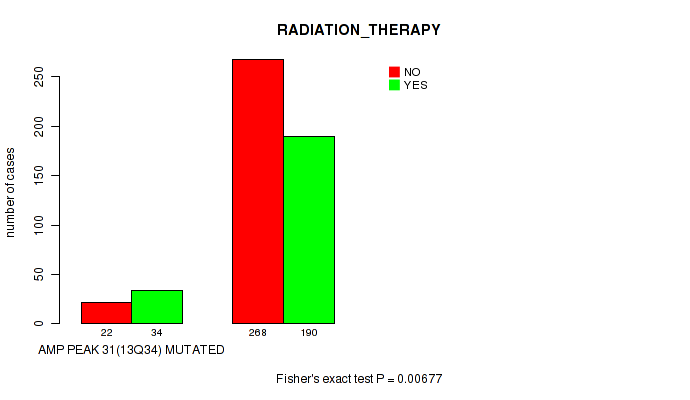
P value = 0.00677 (Fisher's exact test), Q value = 0.016
Table S73. Gene #31: 'amp_13q34' versus Clinical Feature #2: 'RADIATION_THERAPY'
| nPatients | NO | YES |
|---|---|---|
| ALL | 290 | 224 |
| AMP PEAK 31(13Q34) MUTATED | 22 | 34 |
| AMP PEAK 31(13Q34) WILD-TYPE | 268 | 190 |
Figure S73. Get High-res Image Gene #31: 'amp_13q34' versus Clinical Feature #2: 'RADIATION_THERAPY'
P value = 1e-05 (Fisher's exact test), Q value = 4e-05
Table S74. Gene #31: 'amp_13q34' versus Clinical Feature #3: 'HISTOLOGICAL_TYPE'
| nPatients | ENDOMETRIOID ENDOMETRIAL ADENOCARCINOMA | MIXED SEROUS AND ENDOMETRIOID | SEROUS ENDOMETRIAL ADENOCARCINOMA |
|---|---|---|---|
| ALL | 404 | 22 | 113 |
| AMP PEAK 31(13Q34) MUTATED | 14 | 4 | 40 |
| AMP PEAK 31(13Q34) WILD-TYPE | 390 | 18 | 73 |
Figure S74. Get High-res Image Gene #31: 'amp_13q34' versus Clinical Feature #3: 'HISTOLOGICAL_TYPE'

P value = 0.0128 (Fisher's exact test), Q value = 0.029
Table S75. Gene #31: 'amp_13q34' versus Clinical Feature #4: 'RESIDUAL_TUMOR'
| nPatients | R0 | R1 | R2 | RX |
|---|---|---|---|---|
| ALL | 371 | 22 | 16 | 40 |
| AMP PEAK 31(13Q34) MUTATED | 35 | 6 | 4 | 6 |
| AMP PEAK 31(13Q34) WILD-TYPE | 336 | 16 | 12 | 34 |
Figure S75. Get High-res Image Gene #31: 'amp_13q34' versus Clinical Feature #4: 'RESIDUAL_TUMOR'

P value = 0.00213 (logrank test), Q value = 0.0055
Table S76. Gene #32: 'amp_14q24.3' versus Clinical Feature #1: 'Time to Death'
| nPatients | nDeath | Duration Range (Median), Month | |
|---|---|---|---|
| ALL | 537 | 90 | 0.1 - 225.5 (29.9) |
| AMP PEAK 32(14Q24.3) MUTATED | 64 | 21 | 0.4 - 125.4 (28.8) |
| AMP PEAK 32(14Q24.3) WILD-TYPE | 473 | 69 | 0.1 - 225.5 (29.9) |
Figure S76. Get High-res Image Gene #32: 'amp_14q24.3' versus Clinical Feature #1: 'Time to Death'

P value = 1e-05 (Fisher's exact test), Q value = 4e-05
Table S77. Gene #32: 'amp_14q24.3' versus Clinical Feature #3: 'HISTOLOGICAL_TYPE'
| nPatients | ENDOMETRIOID ENDOMETRIAL ADENOCARCINOMA | MIXED SEROUS AND ENDOMETRIOID | SEROUS ENDOMETRIAL ADENOCARCINOMA |
|---|---|---|---|
| ALL | 404 | 22 | 113 |
| AMP PEAK 32(14Q24.3) MUTATED | 22 | 4 | 38 |
| AMP PEAK 32(14Q24.3) WILD-TYPE | 382 | 18 | 75 |
Figure S77. Get High-res Image Gene #32: 'amp_14q24.3' versus Clinical Feature #3: 'HISTOLOGICAL_TYPE'

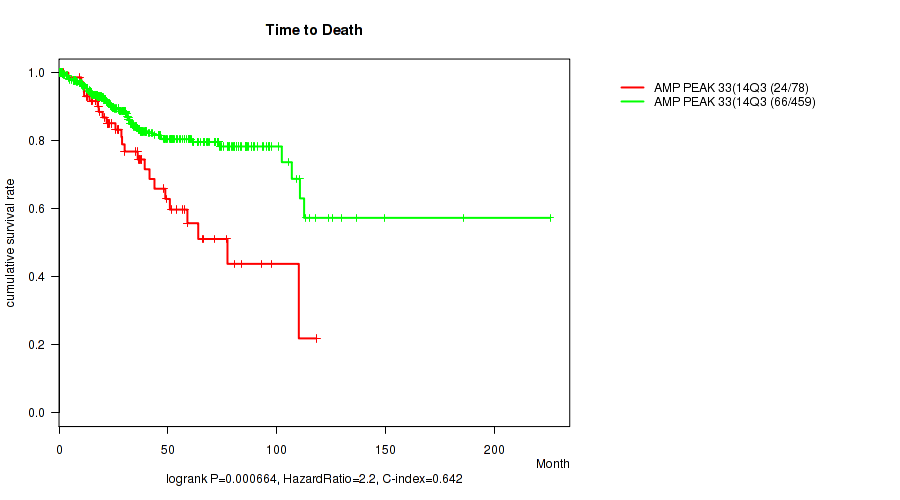
P value = 0.000664 (logrank test), Q value = 0.0019
Table S78. Gene #33: 'amp_14q32.33' versus Clinical Feature #1: 'Time to Death'
| nPatients | nDeath | Duration Range (Median), Month | |
|---|---|---|---|
| ALL | 537 | 90 | 0.1 - 225.5 (29.9) |
| AMP PEAK 33(14Q32.33) MUTATED | 78 | 24 | 0.3 - 118.2 (28.0) |
| AMP PEAK 33(14Q32.33) WILD-TYPE | 459 | 66 | 0.1 - 225.5 (30.0) |
Figure S78. Get High-res Image Gene #33: 'amp_14q32.33' versus Clinical Feature #1: 'Time to Death'
P value = 1e-05 (Fisher's exact test), Q value = 4e-05
Table S79. Gene #33: 'amp_14q32.33' versus Clinical Feature #3: 'HISTOLOGICAL_TYPE'
| nPatients | ENDOMETRIOID ENDOMETRIAL ADENOCARCINOMA | MIXED SEROUS AND ENDOMETRIOID | SEROUS ENDOMETRIAL ADENOCARCINOMA |
|---|---|---|---|
| ALL | 404 | 22 | 113 |
| AMP PEAK 33(14Q32.33) MUTATED | 33 | 5 | 41 |
| AMP PEAK 33(14Q32.33) WILD-TYPE | 371 | 17 | 72 |
Figure S79. Get High-res Image Gene #33: 'amp_14q32.33' versus Clinical Feature #3: 'HISTOLOGICAL_TYPE'

P value = 0.0456 (logrank test), Q value = 0.089
Table S80. Gene #34: 'amp_15q26.3' versus Clinical Feature #1: 'Time to Death'
| nPatients | nDeath | Duration Range (Median), Month | |
|---|---|---|---|
| ALL | 537 | 90 | 0.1 - 225.5 (29.9) |
| AMP PEAK 34(15Q26.3) MUTATED | 38 | 12 | 1.7 - 110.1 (34.5) |
| AMP PEAK 34(15Q26.3) WILD-TYPE | 499 | 78 | 0.1 - 225.5 (29.6) |
Figure S80. Get High-res Image Gene #34: 'amp_15q26.3' versus Clinical Feature #1: 'Time to Death'

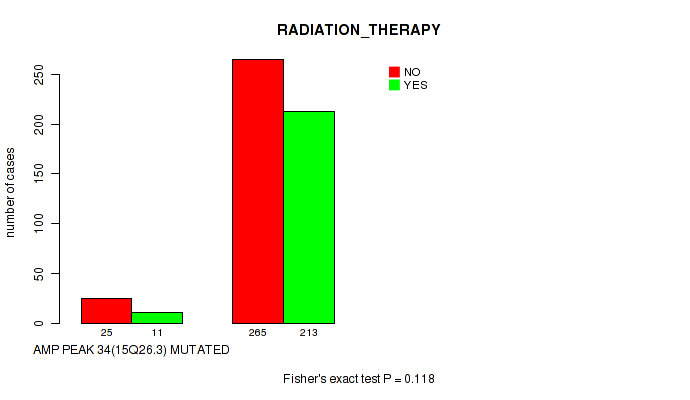
P value = 0.118 (Fisher's exact test), Q value = 0.2
Table S81. Gene #34: 'amp_15q26.3' versus Clinical Feature #2: 'RADIATION_THERAPY'
| nPatients | NO | YES |
|---|---|---|
| ALL | 290 | 224 |
| AMP PEAK 34(15Q26.3) MUTATED | 25 | 11 |
| AMP PEAK 34(15Q26.3) WILD-TYPE | 265 | 213 |
Figure S81. Get High-res Image Gene #34: 'amp_15q26.3' versus Clinical Feature #2: 'RADIATION_THERAPY'
P value = 1e-04 (Fisher's exact test), Q value = 0.00034
Table S82. Gene #34: 'amp_15q26.3' versus Clinical Feature #3: 'HISTOLOGICAL_TYPE'
| nPatients | ENDOMETRIOID ENDOMETRIAL ADENOCARCINOMA | MIXED SEROUS AND ENDOMETRIOID | SEROUS ENDOMETRIAL ADENOCARCINOMA |
|---|---|---|---|
| ALL | 404 | 22 | 113 |
| AMP PEAK 34(15Q26.3) MUTATED | 18 | 1 | 19 |
| AMP PEAK 34(15Q26.3) WILD-TYPE | 386 | 21 | 94 |
Figure S82. Get High-res Image Gene #34: 'amp_15q26.3' versus Clinical Feature #3: 'HISTOLOGICAL_TYPE'

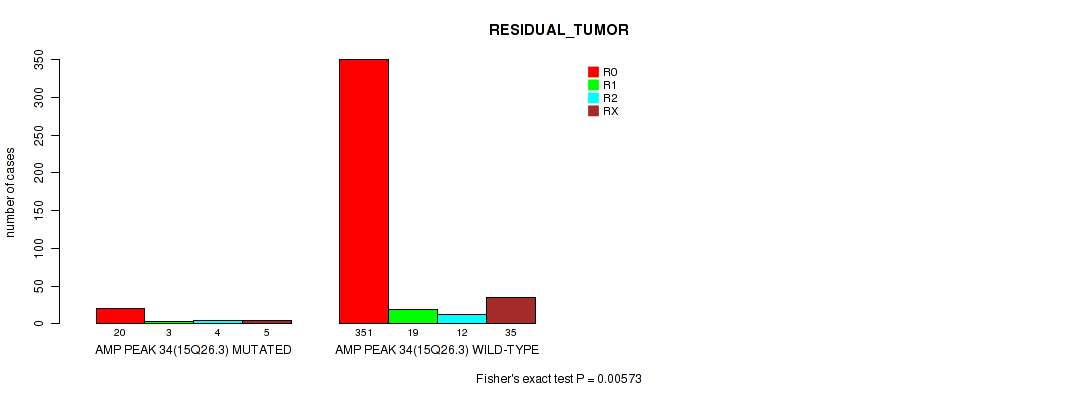
P value = 0.00573 (Fisher's exact test), Q value = 0.014
Table S83. Gene #34: 'amp_15q26.3' versus Clinical Feature #4: 'RESIDUAL_TUMOR'
| nPatients | R0 | R1 | R2 | RX |
|---|---|---|---|---|
| ALL | 371 | 22 | 16 | 40 |
| AMP PEAK 34(15Q26.3) MUTATED | 20 | 3 | 4 | 5 |
| AMP PEAK 34(15Q26.3) WILD-TYPE | 351 | 19 | 12 | 35 |
Figure S83. Get High-res Image Gene #34: 'amp_15q26.3' versus Clinical Feature #4: 'RESIDUAL_TUMOR'
P value = 0.0329 (logrank test), Q value = 0.066
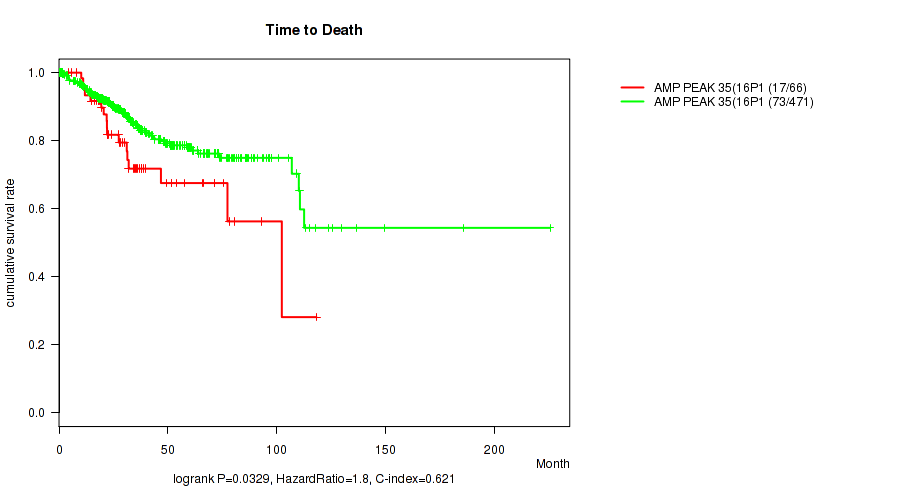
Table S84. Gene #35: 'amp_16p11.2' versus Clinical Feature #1: 'Time to Death'
| nPatients | nDeath | Duration Range (Median), Month | |
|---|---|---|---|
| ALL | 537 | 90 | 0.1 - 225.5 (29.9) |
| AMP PEAK 35(16P11.2) MUTATED | 66 | 17 | 0.1 - 118.2 (28.6) |
| AMP PEAK 35(16P11.2) WILD-TYPE | 471 | 73 | 0.1 - 225.5 (30.0) |
Figure S84. Get High-res Image Gene #35: 'amp_16p11.2' versus Clinical Feature #1: 'Time to Death'
P value = 1e-05 (Fisher's exact test), Q value = 4e-05
Table S85. Gene #35: 'amp_16p11.2' versus Clinical Feature #3: 'HISTOLOGICAL_TYPE'
| nPatients | ENDOMETRIOID ENDOMETRIAL ADENOCARCINOMA | MIXED SEROUS AND ENDOMETRIOID | SEROUS ENDOMETRIAL ADENOCARCINOMA |
|---|---|---|---|
| ALL | 404 | 22 | 113 |
| AMP PEAK 35(16P11.2) MUTATED | 23 | 2 | 41 |
| AMP PEAK 35(16P11.2) WILD-TYPE | 381 | 20 | 72 |
Figure S85. Get High-res Image Gene #35: 'amp_16p11.2' versus Clinical Feature #3: 'HISTOLOGICAL_TYPE'

P value = 0.0604 (Fisher's exact test), Q value = 0.11
Table S86. Gene #35: 'amp_16p11.2' versus Clinical Feature #4: 'RESIDUAL_TUMOR'
| nPatients | R0 | R1 | R2 | RX |
|---|---|---|---|---|
| ALL | 371 | 22 | 16 | 40 |
| AMP PEAK 35(16P11.2) MUTATED | 41 | 3 | 3 | 10 |
| AMP PEAK 35(16P11.2) WILD-TYPE | 330 | 19 | 13 | 30 |
Figure S86. Get High-res Image Gene #35: 'amp_16p11.2' versus Clinical Feature #4: 'RESIDUAL_TUMOR'

P value = 3.34e-05 (logrank test), Q value = 0.00012
Table S87. Gene #36: 'amp_17q11.2' versus Clinical Feature #1: 'Time to Death'
| nPatients | nDeath | Duration Range (Median), Month | |
|---|---|---|---|
| ALL | 537 | 90 | 0.1 - 225.5 (29.9) |
| AMP PEAK 36(17Q11.2) MUTATED | 71 | 23 | 0.1 - 118.2 (27.3) |
| AMP PEAK 36(17Q11.2) WILD-TYPE | 466 | 67 | 0.1 - 225.5 (30.1) |
Figure S87. Get High-res Image Gene #36: 'amp_17q11.2' versus Clinical Feature #1: 'Time to Death'

P value = 1e-05 (Fisher's exact test), Q value = 4e-05
Table S88. Gene #36: 'amp_17q11.2' versus Clinical Feature #3: 'HISTOLOGICAL_TYPE'
| nPatients | ENDOMETRIOID ENDOMETRIAL ADENOCARCINOMA | MIXED SEROUS AND ENDOMETRIOID | SEROUS ENDOMETRIAL ADENOCARCINOMA |
|---|---|---|---|
| ALL | 404 | 22 | 113 |
| AMP PEAK 36(17Q11.2) MUTATED | 19 | 6 | 46 |
| AMP PEAK 36(17Q11.2) WILD-TYPE | 385 | 16 | 67 |
Figure S88. Get High-res Image Gene #36: 'amp_17q11.2' versus Clinical Feature #3: 'HISTOLOGICAL_TYPE'

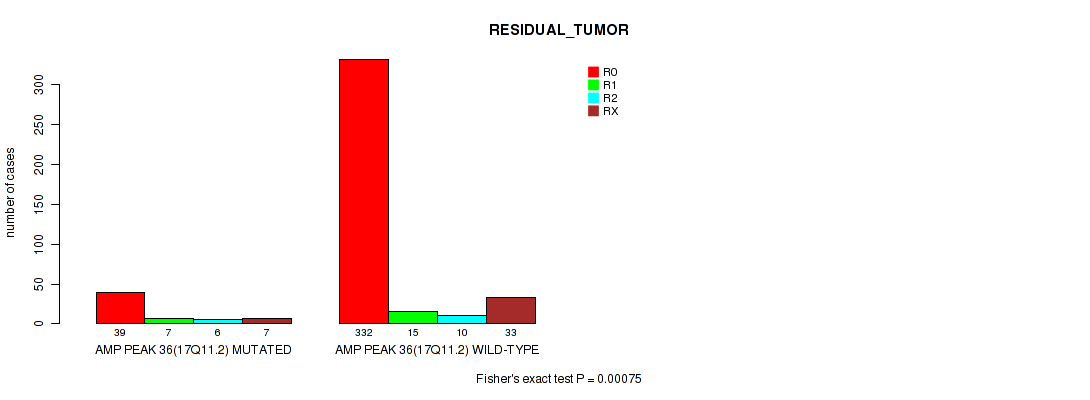
P value = 0.00075 (Fisher's exact test), Q value = 0.0021
Table S89. Gene #36: 'amp_17q11.2' versus Clinical Feature #4: 'RESIDUAL_TUMOR'
| nPatients | R0 | R1 | R2 | RX |
|---|---|---|---|---|
| ALL | 371 | 22 | 16 | 40 |
| AMP PEAK 36(17Q11.2) MUTATED | 39 | 7 | 6 | 7 |
| AMP PEAK 36(17Q11.2) WILD-TYPE | 332 | 15 | 10 | 33 |
Figure S89. Get High-res Image Gene #36: 'amp_17q11.2' versus Clinical Feature #4: 'RESIDUAL_TUMOR'
P value = 5.12e-05 (logrank test), Q value = 0.00018
Table S90. Gene #37: 'amp_17q12' versus Clinical Feature #1: 'Time to Death'
| nPatients | nDeath | Duration Range (Median), Month | |
|---|---|---|---|
| ALL | 537 | 90 | 0.1 - 225.5 (29.9) |
| AMP PEAK 37(17Q12) MUTATED | 75 | 24 | 0.1 - 110.6 (27.4) |
| AMP PEAK 37(17Q12) WILD-TYPE | 462 | 66 | 0.1 - 225.5 (30.1) |
Figure S90. Get High-res Image Gene #37: 'amp_17q12' versus Clinical Feature #1: 'Time to Death'

P value = 1e-05 (Fisher's exact test), Q value = 4e-05
Table S91. Gene #37: 'amp_17q12' versus Clinical Feature #3: 'HISTOLOGICAL_TYPE'
| nPatients | ENDOMETRIOID ENDOMETRIAL ADENOCARCINOMA | MIXED SEROUS AND ENDOMETRIOID | SEROUS ENDOMETRIAL ADENOCARCINOMA |
|---|---|---|---|
| ALL | 404 | 22 | 113 |
| AMP PEAK 37(17Q12) MUTATED | 20 | 4 | 51 |
| AMP PEAK 37(17Q12) WILD-TYPE | 384 | 18 | 62 |
Figure S91. Get High-res Image Gene #37: 'amp_17q12' versus Clinical Feature #3: 'HISTOLOGICAL_TYPE'

P value = 1.45e-05 (logrank test), Q value = 5.7e-05
Table S92. Gene #38: 'amp_17q25.1' versus Clinical Feature #1: 'Time to Death'
| nPatients | nDeath | Duration Range (Median), Month | |
|---|---|---|---|
| ALL | 537 | 90 | 0.1 - 225.5 (29.9) |
| AMP PEAK 38(17Q25.1) MUTATED | 105 | 32 | 0.1 - 125.4 (25.9) |
| AMP PEAK 38(17Q25.1) WILD-TYPE | 432 | 58 | 0.1 - 225.5 (30.7) |
Figure S92. Get High-res Image Gene #38: 'amp_17q25.1' versus Clinical Feature #1: 'Time to Death'

P value = 1e-05 (Fisher's exact test), Q value = 4e-05
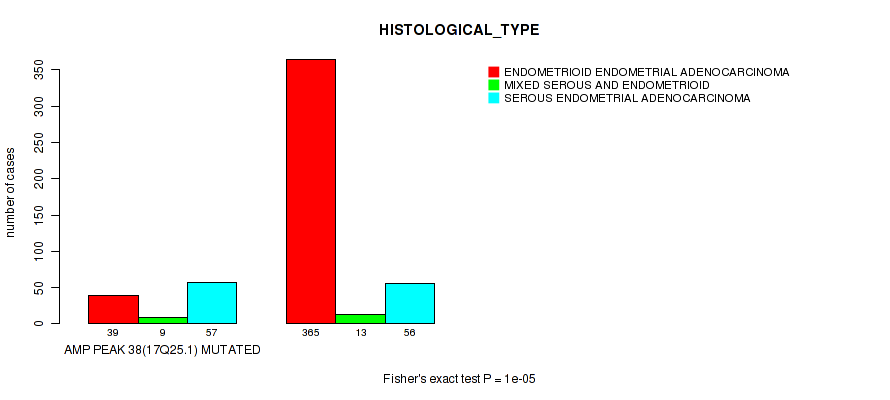
Table S93. Gene #38: 'amp_17q25.1' versus Clinical Feature #3: 'HISTOLOGICAL_TYPE'
| nPatients | ENDOMETRIOID ENDOMETRIAL ADENOCARCINOMA | MIXED SEROUS AND ENDOMETRIOID | SEROUS ENDOMETRIAL ADENOCARCINOMA |
|---|---|---|---|
| ALL | 404 | 22 | 113 |
| AMP PEAK 38(17Q25.1) MUTATED | 39 | 9 | 57 |
| AMP PEAK 38(17Q25.1) WILD-TYPE | 365 | 13 | 56 |
Figure S93. Get High-res Image Gene #38: 'amp_17q25.1' versus Clinical Feature #3: 'HISTOLOGICAL_TYPE'
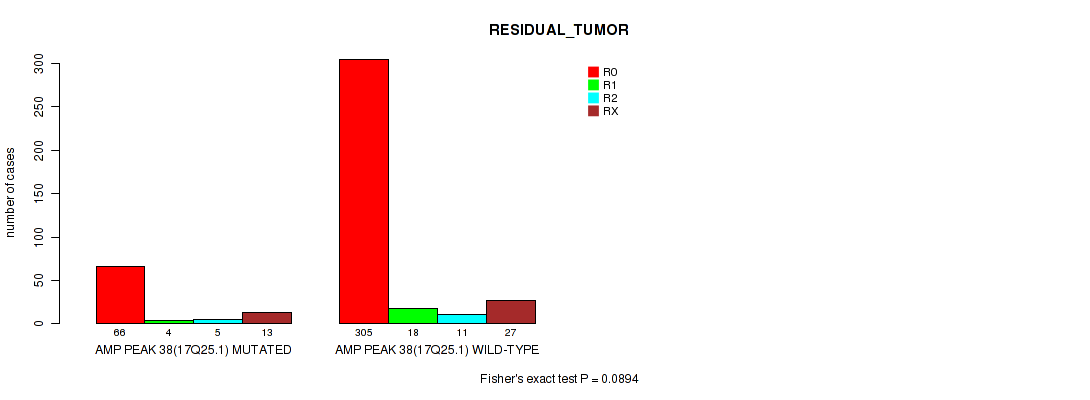
P value = 0.0894 (Fisher's exact test), Q value = 0.16
Table S94. Gene #38: 'amp_17q25.1' versus Clinical Feature #4: 'RESIDUAL_TUMOR'
| nPatients | R0 | R1 | R2 | RX |
|---|---|---|---|---|
| ALL | 371 | 22 | 16 | 40 |
| AMP PEAK 38(17Q25.1) MUTATED | 66 | 4 | 5 | 13 |
| AMP PEAK 38(17Q25.1) WILD-TYPE | 305 | 18 | 11 | 27 |
Figure S94. Get High-res Image Gene #38: 'amp_17q25.1' versus Clinical Feature #4: 'RESIDUAL_TUMOR'
P value = 0.0447 (logrank test), Q value = 0.087
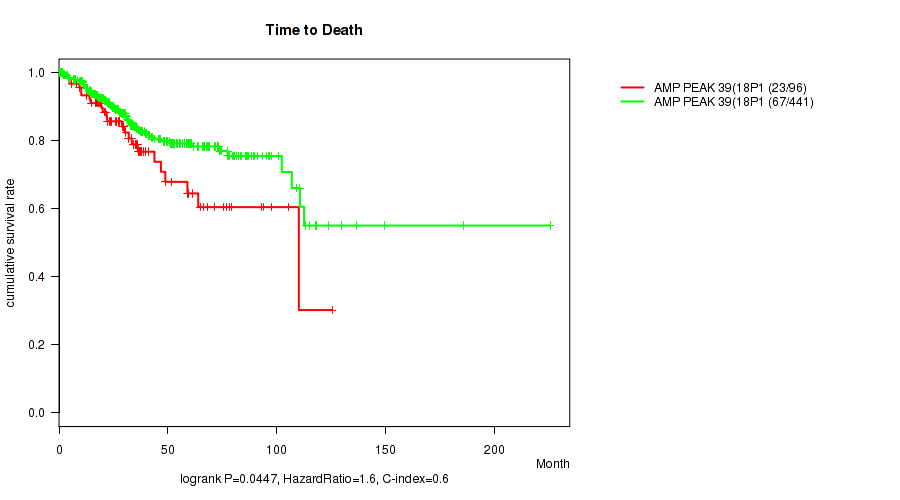
Table S95. Gene #39: 'amp_18p11.31' versus Clinical Feature #1: 'Time to Death'
| nPatients | nDeath | Duration Range (Median), Month | |
|---|---|---|---|
| ALL | 537 | 90 | 0.1 - 225.5 (29.9) |
| AMP PEAK 39(18P11.31) MUTATED | 96 | 23 | 0.4 - 125.4 (31.3) |
| AMP PEAK 39(18P11.31) WILD-TYPE | 441 | 67 | 0.1 - 225.5 (29.7) |
Figure S95. Get High-res Image Gene #39: 'amp_18p11.31' versus Clinical Feature #1: 'Time to Death'
P value = 1e-05 (Fisher's exact test), Q value = 4e-05
Table S96. Gene #39: 'amp_18p11.31' versus Clinical Feature #3: 'HISTOLOGICAL_TYPE'
| nPatients | ENDOMETRIOID ENDOMETRIAL ADENOCARCINOMA | MIXED SEROUS AND ENDOMETRIOID | SEROUS ENDOMETRIAL ADENOCARCINOMA |
|---|---|---|---|
| ALL | 404 | 22 | 113 |
| AMP PEAK 39(18P11.31) MUTATED | 30 | 6 | 60 |
| AMP PEAK 39(18P11.31) WILD-TYPE | 374 | 16 | 53 |
Figure S96. Get High-res Image Gene #39: 'amp_18p11.31' versus Clinical Feature #3: 'HISTOLOGICAL_TYPE'

P value = 0.0713 (Fisher's exact test), Q value = 0.13
Table S97. Gene #39: 'amp_18p11.31' versus Clinical Feature #4: 'RESIDUAL_TUMOR'
| nPatients | R0 | R1 | R2 | RX |
|---|---|---|---|---|
| ALL | 371 | 22 | 16 | 40 |
| AMP PEAK 39(18P11.31) MUTATED | 63 | 3 | 7 | 8 |
| AMP PEAK 39(18P11.31) WILD-TYPE | 308 | 19 | 9 | 32 |
Figure S97. Get High-res Image Gene #39: 'amp_18p11.31' versus Clinical Feature #4: 'RESIDUAL_TUMOR'

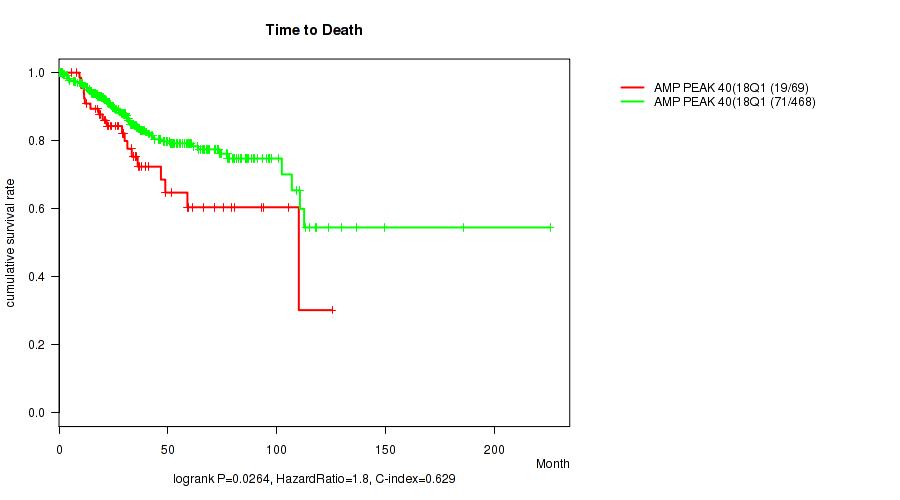
P value = 0.0264 (logrank test), Q value = 0.055
Table S98. Gene #40: 'amp_18q11.2' versus Clinical Feature #1: 'Time to Death'
| nPatients | nDeath | Duration Range (Median), Month | |
|---|---|---|---|
| ALL | 537 | 90 | 0.1 - 225.5 (29.9) |
| AMP PEAK 40(18Q11.2) MUTATED | 69 | 19 | 1.4 - 125.4 (31.4) |
| AMP PEAK 40(18Q11.2) WILD-TYPE | 468 | 71 | 0.1 - 225.5 (29.8) |
Figure S98. Get High-res Image Gene #40: 'amp_18q11.2' versus Clinical Feature #1: 'Time to Death'
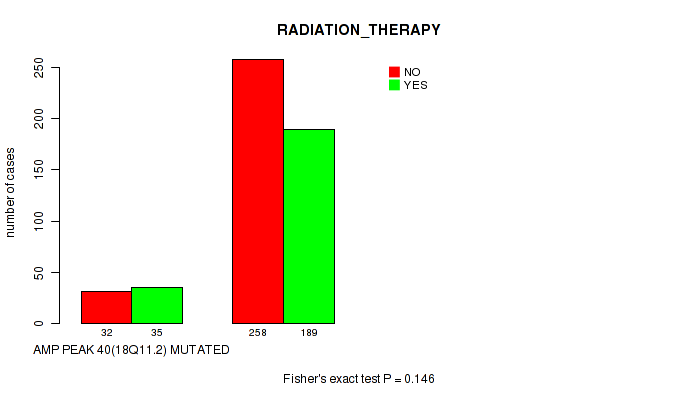
P value = 0.146 (Fisher's exact test), Q value = 0.23
Table S99. Gene #40: 'amp_18q11.2' versus Clinical Feature #2: 'RADIATION_THERAPY'
| nPatients | NO | YES |
|---|---|---|
| ALL | 290 | 224 |
| AMP PEAK 40(18Q11.2) MUTATED | 32 | 35 |
| AMP PEAK 40(18Q11.2) WILD-TYPE | 258 | 189 |
Figure S99. Get High-res Image Gene #40: 'amp_18q11.2' versus Clinical Feature #2: 'RADIATION_THERAPY'
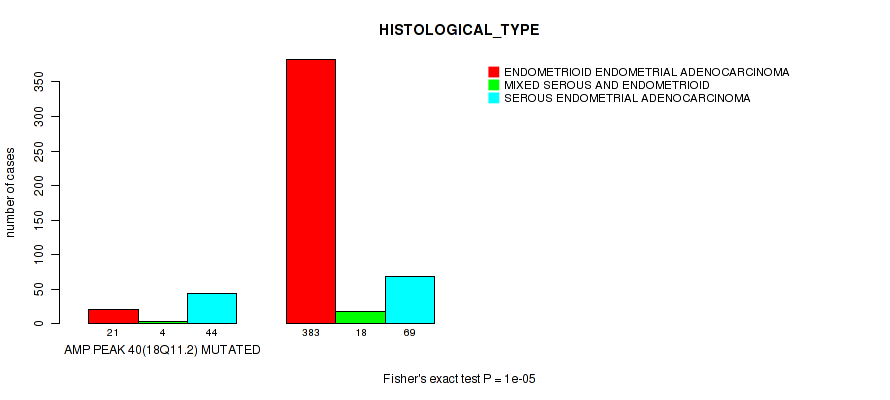
P value = 1e-05 (Fisher's exact test), Q value = 4e-05
Table S100. Gene #40: 'amp_18q11.2' versus Clinical Feature #3: 'HISTOLOGICAL_TYPE'
| nPatients | ENDOMETRIOID ENDOMETRIAL ADENOCARCINOMA | MIXED SEROUS AND ENDOMETRIOID | SEROUS ENDOMETRIAL ADENOCARCINOMA |
|---|---|---|---|
| ALL | 404 | 22 | 113 |
| AMP PEAK 40(18Q11.2) MUTATED | 21 | 4 | 44 |
| AMP PEAK 40(18Q11.2) WILD-TYPE | 383 | 18 | 69 |
Figure S100. Get High-res Image Gene #40: 'amp_18q11.2' versus Clinical Feature #3: 'HISTOLOGICAL_TYPE'
P value = 0.0557 (Fisher's exact test), Q value = 0.11
Table S101. Gene #40: 'amp_18q11.2' versus Clinical Feature #4: 'RESIDUAL_TUMOR'
| nPatients | R0 | R1 | R2 | RX |
|---|---|---|---|---|
| ALL | 371 | 22 | 16 | 40 |
| AMP PEAK 40(18Q11.2) MUTATED | 43 | 1 | 4 | 9 |
| AMP PEAK 40(18Q11.2) WILD-TYPE | 328 | 21 | 12 | 31 |
Figure S101. Get High-res Image Gene #40: 'amp_18q11.2' versus Clinical Feature #4: 'RESIDUAL_TUMOR'

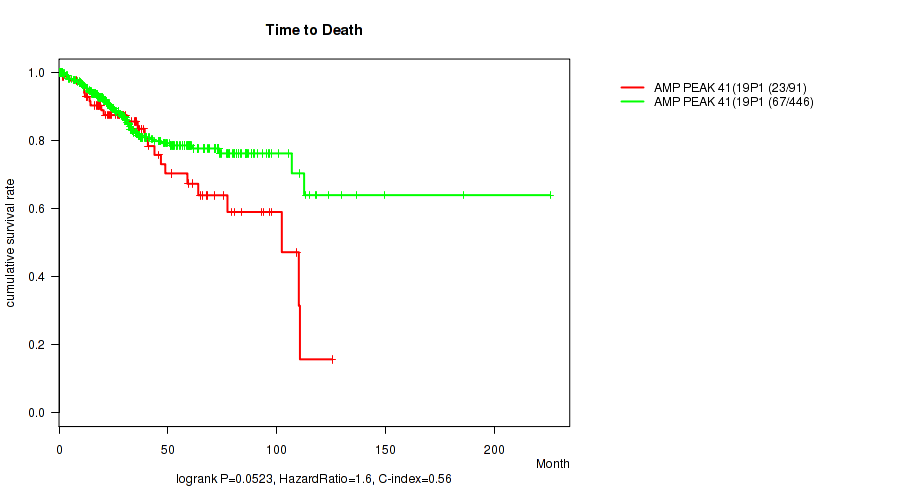
P value = 0.0523 (logrank test), Q value = 0.1
Table S102. Gene #41: 'amp_19p13.2' versus Clinical Feature #1: 'Time to Death'
| nPatients | nDeath | Duration Range (Median), Month | |
|---|---|---|---|
| ALL | 537 | 90 | 0.1 - 225.5 (29.9) |
| AMP PEAK 41(19P13.2) MUTATED | 91 | 23 | 0.1 - 125.4 (31.1) |
| AMP PEAK 41(19P13.2) WILD-TYPE | 446 | 67 | 0.1 - 225.5 (29.8) |
Figure S102. Get High-res Image Gene #41: 'amp_19p13.2' versus Clinical Feature #1: 'Time to Death'
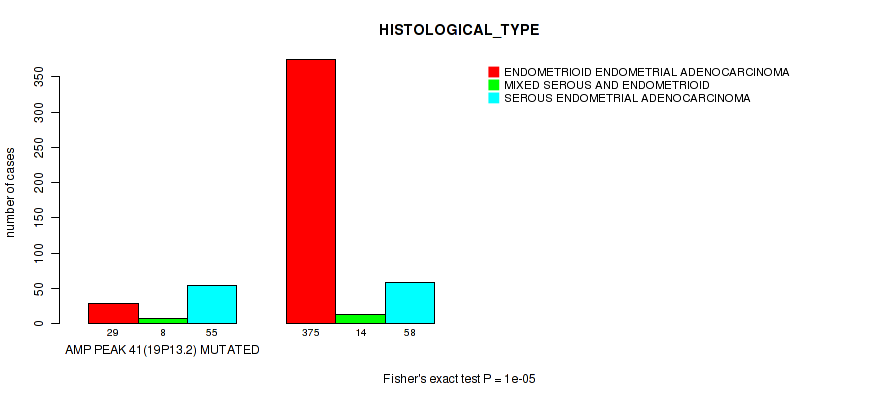
P value = 1e-05 (Fisher's exact test), Q value = 4e-05
Table S103. Gene #41: 'amp_19p13.2' versus Clinical Feature #3: 'HISTOLOGICAL_TYPE'
| nPatients | ENDOMETRIOID ENDOMETRIAL ADENOCARCINOMA | MIXED SEROUS AND ENDOMETRIOID | SEROUS ENDOMETRIAL ADENOCARCINOMA |
|---|---|---|---|
| ALL | 404 | 22 | 113 |
| AMP PEAK 41(19P13.2) MUTATED | 29 | 8 | 55 |
| AMP PEAK 41(19P13.2) WILD-TYPE | 375 | 14 | 58 |
Figure S103. Get High-res Image Gene #41: 'amp_19p13.2' versus Clinical Feature #3: 'HISTOLOGICAL_TYPE'
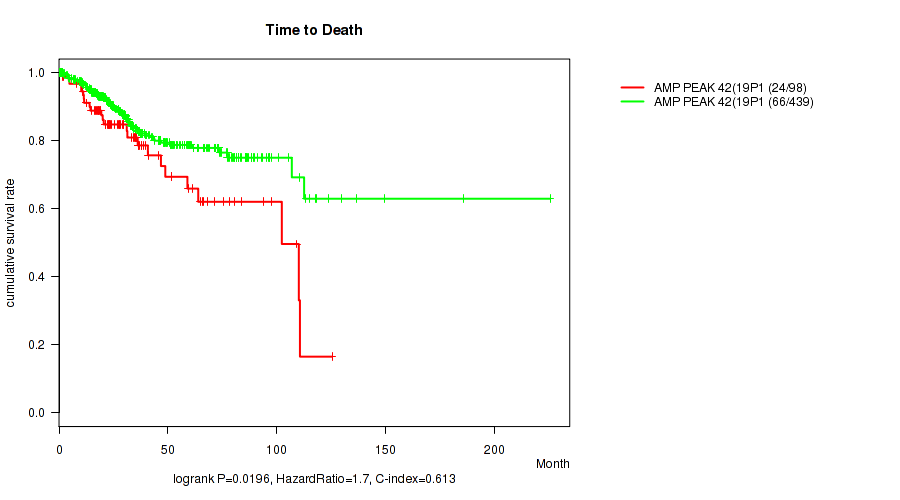
P value = 0.0196 (logrank test), Q value = 0.043
Table S104. Gene #42: 'amp_19p13.12' versus Clinical Feature #1: 'Time to Death'
| nPatients | nDeath | Duration Range (Median), Month | |
|---|---|---|---|
| ALL | 537 | 90 | 0.1 - 225.5 (29.9) |
| AMP PEAK 42(19P13.12) MUTATED | 98 | 24 | 0.1 - 125.4 (27.9) |
| AMP PEAK 42(19P13.12) WILD-TYPE | 439 | 66 | 0.1 - 225.5 (30.1) |
Figure S104. Get High-res Image Gene #42: 'amp_19p13.12' versus Clinical Feature #1: 'Time to Death'
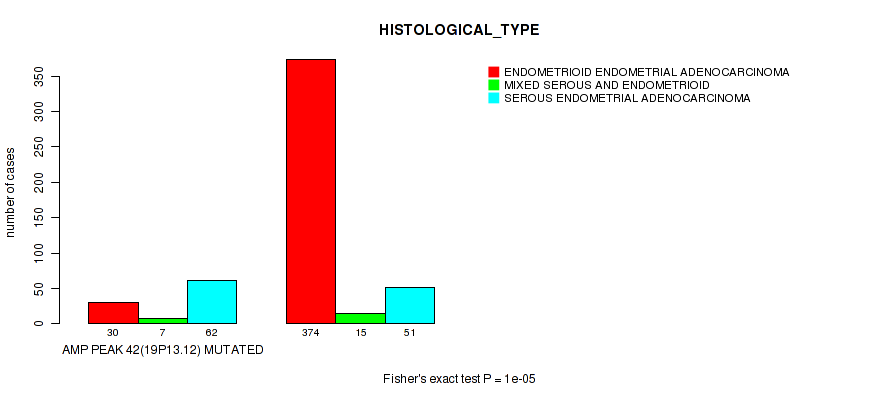
P value = 1e-05 (Fisher's exact test), Q value = 4e-05
Table S105. Gene #42: 'amp_19p13.12' versus Clinical Feature #3: 'HISTOLOGICAL_TYPE'
| nPatients | ENDOMETRIOID ENDOMETRIAL ADENOCARCINOMA | MIXED SEROUS AND ENDOMETRIOID | SEROUS ENDOMETRIAL ADENOCARCINOMA |
|---|---|---|---|
| ALL | 404 | 22 | 113 |
| AMP PEAK 42(19P13.12) MUTATED | 30 | 7 | 62 |
| AMP PEAK 42(19P13.12) WILD-TYPE | 374 | 15 | 51 |
Figure S105. Get High-res Image Gene #42: 'amp_19p13.12' versus Clinical Feature #3: 'HISTOLOGICAL_TYPE'
P value = 3.14e-05 (logrank test), Q value = 0.00012
Table S106. Gene #43: 'amp_19q12' versus Clinical Feature #1: 'Time to Death'
| nPatients | nDeath | Duration Range (Median), Month | |
|---|---|---|---|
| ALL | 537 | 90 | 0.1 - 225.5 (29.9) |
| AMP PEAK 43(19Q12) MUTATED | 120 | 34 | 0.1 - 125.4 (26.0) |
| AMP PEAK 43(19Q12) WILD-TYPE | 417 | 56 | 0.2 - 225.5 (30.7) |
Figure S106. Get High-res Image Gene #43: 'amp_19q12' versus Clinical Feature #1: 'Time to Death'

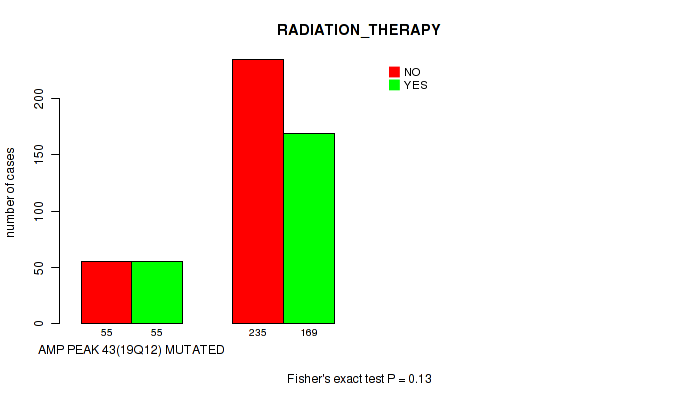
P value = 0.13 (Fisher's exact test), Q value = 0.21
Table S107. Gene #43: 'amp_19q12' versus Clinical Feature #2: 'RADIATION_THERAPY'
| nPatients | NO | YES |
|---|---|---|
| ALL | 290 | 224 |
| AMP PEAK 43(19Q12) MUTATED | 55 | 55 |
| AMP PEAK 43(19Q12) WILD-TYPE | 235 | 169 |
Figure S107. Get High-res Image Gene #43: 'amp_19q12' versus Clinical Feature #2: 'RADIATION_THERAPY'
P value = 1e-05 (Fisher's exact test), Q value = 4e-05
Table S108. Gene #43: 'amp_19q12' versus Clinical Feature #3: 'HISTOLOGICAL_TYPE'
| nPatients | ENDOMETRIOID ENDOMETRIAL ADENOCARCINOMA | MIXED SEROUS AND ENDOMETRIOID | SEROUS ENDOMETRIAL ADENOCARCINOMA |
|---|---|---|---|
| ALL | 404 | 22 | 113 |
| AMP PEAK 43(19Q12) MUTATED | 32 | 11 | 78 |
| AMP PEAK 43(19Q12) WILD-TYPE | 372 | 11 | 35 |
Figure S108. Get High-res Image Gene #43: 'amp_19q12' versus Clinical Feature #3: 'HISTOLOGICAL_TYPE'
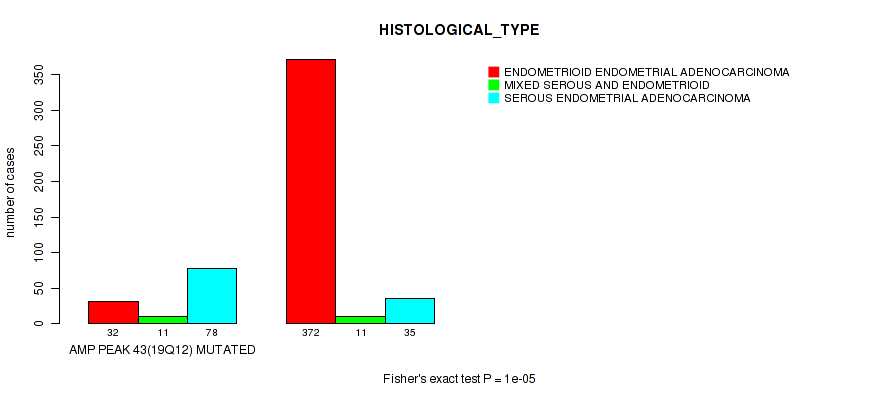
P value = 0.0832 (Fisher's exact test), Q value = 0.15
Table S109. Gene #43: 'amp_19q12' versus Clinical Feature #4: 'RESIDUAL_TUMOR'
| nPatients | R0 | R1 | R2 | RX |
|---|---|---|---|---|
| ALL | 371 | 22 | 16 | 40 |
| AMP PEAK 43(19Q12) MUTATED | 76 | 5 | 6 | 14 |
| AMP PEAK 43(19Q12) WILD-TYPE | 295 | 17 | 10 | 26 |
Figure S109. Get High-res Image Gene #43: 'amp_19q12' versus Clinical Feature #4: 'RESIDUAL_TUMOR'

P value = 0.0202 (logrank test), Q value = 0.044
Table S110. Gene #44: 'amp_20p13' versus Clinical Feature #1: 'Time to Death'
| nPatients | nDeath | Duration Range (Median), Month | |
|---|---|---|---|
| ALL | 537 | 90 | 0.1 - 225.5 (29.9) |
| AMP PEAK 44(20P13) MUTATED | 117 | 27 | 0.1 - 136.6 (28.7) |
| AMP PEAK 44(20P13) WILD-TYPE | 420 | 63 | 0.1 - 225.5 (30.1) |
Figure S110. Get High-res Image Gene #44: 'amp_20p13' versus Clinical Feature #1: 'Time to Death'

P value = 1e-05 (Fisher's exact test), Q value = 4e-05
Table S111. Gene #44: 'amp_20p13' versus Clinical Feature #3: 'HISTOLOGICAL_TYPE'
| nPatients | ENDOMETRIOID ENDOMETRIAL ADENOCARCINOMA | MIXED SEROUS AND ENDOMETRIOID | SEROUS ENDOMETRIAL ADENOCARCINOMA |
|---|---|---|---|
| ALL | 404 | 22 | 113 |
| AMP PEAK 44(20P13) MUTATED | 53 | 5 | 59 |
| AMP PEAK 44(20P13) WILD-TYPE | 351 | 17 | 54 |
Figure S111. Get High-res Image Gene #44: 'amp_20p13' versus Clinical Feature #3: 'HISTOLOGICAL_TYPE'

P value = 5.65e-07 (logrank test), Q value = 4e-05
Table S112. Gene #45: 'amp_20q11.21' versus Clinical Feature #1: 'Time to Death'
| nPatients | nDeath | Duration Range (Median), Month | |
|---|---|---|---|
| ALL | 537 | 90 | 0.1 - 225.5 (29.9) |
| AMP PEAK 45(20Q11.21) MUTATED | 151 | 44 | 0.1 - 149.6 (27.9) |
| AMP PEAK 45(20Q11.21) WILD-TYPE | 386 | 46 | 0.1 - 225.5 (30.7) |
Figure S112. Get High-res Image Gene #45: 'amp_20q11.21' versus Clinical Feature #1: 'Time to Death'
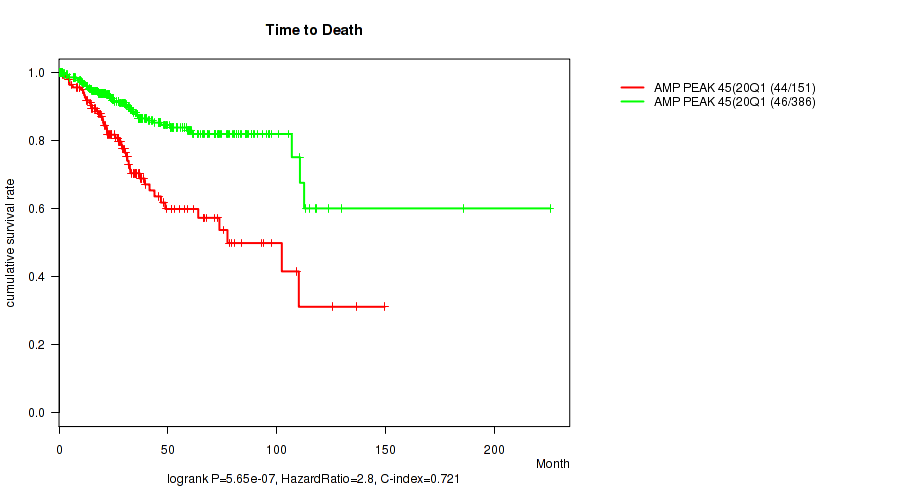
P value = 1e-05 (Fisher's exact test), Q value = 4e-05
Table S113. Gene #45: 'amp_20q11.21' versus Clinical Feature #3: 'HISTOLOGICAL_TYPE'
| nPatients | ENDOMETRIOID ENDOMETRIAL ADENOCARCINOMA | MIXED SEROUS AND ENDOMETRIOID | SEROUS ENDOMETRIAL ADENOCARCINOMA |
|---|---|---|---|
| ALL | 404 | 22 | 113 |
| AMP PEAK 45(20Q11.21) MUTATED | 65 | 6 | 81 |
| AMP PEAK 45(20Q11.21) WILD-TYPE | 339 | 16 | 32 |
Figure S113. Get High-res Image Gene #45: 'amp_20q11.21' versus Clinical Feature #3: 'HISTOLOGICAL_TYPE'

P value = 0.046 (Fisher's exact test), Q value = 0.089
Table S114. Gene #45: 'amp_20q11.21' versus Clinical Feature #4: 'RESIDUAL_TUMOR'
| nPatients | R0 | R1 | R2 | RX |
|---|---|---|---|---|
| ALL | 371 | 22 | 16 | 40 |
| AMP PEAK 45(20Q11.21) MUTATED | 93 | 5 | 9 | 13 |
| AMP PEAK 45(20Q11.21) WILD-TYPE | 278 | 17 | 7 | 27 |
Figure S114. Get High-res Image Gene #45: 'amp_20q11.21' versus Clinical Feature #4: 'RESIDUAL_TUMOR'
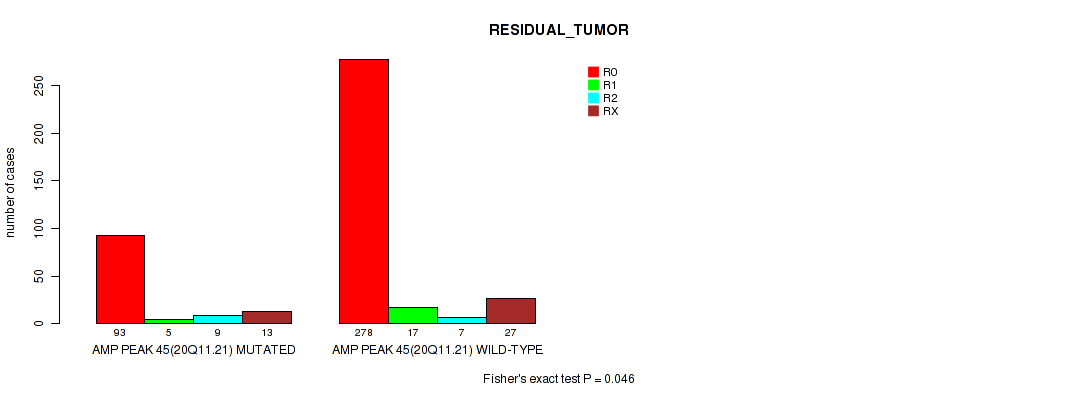
P value = 0.000346 (logrank test), Q value = 0.001
Table S115. Gene #46: 'amp_20q13.12' versus Clinical Feature #1: 'Time to Death'
| nPatients | nDeath | Duration Range (Median), Month | |
|---|---|---|---|
| ALL | 537 | 90 | 0.1 - 225.5 (29.9) |
| AMP PEAK 46(20Q13.12) MUTATED | 151 | 40 | 0.1 - 225.5 (28.1) |
| AMP PEAK 46(20Q13.12) WILD-TYPE | 386 | 50 | 0.1 - 185.8 (30.6) |
Figure S115. Get High-res Image Gene #46: 'amp_20q13.12' versus Clinical Feature #1: 'Time to Death'

P value = 1e-05 (Fisher's exact test), Q value = 4e-05
Table S116. Gene #46: 'amp_20q13.12' versus Clinical Feature #3: 'HISTOLOGICAL_TYPE'
| nPatients | ENDOMETRIOID ENDOMETRIAL ADENOCARCINOMA | MIXED SEROUS AND ENDOMETRIOID | SEROUS ENDOMETRIAL ADENOCARCINOMA |
|---|---|---|---|
| ALL | 404 | 22 | 113 |
| AMP PEAK 46(20Q13.12) MUTATED | 67 | 7 | 78 |
| AMP PEAK 46(20Q13.12) WILD-TYPE | 337 | 15 | 35 |
Figure S116. Get High-res Image Gene #46: 'amp_20q13.12' versus Clinical Feature #3: 'HISTOLOGICAL_TYPE'

P value = 0.0163 (Fisher's exact test), Q value = 0.036
Table S117. Gene #46: 'amp_20q13.12' versus Clinical Feature #4: 'RESIDUAL_TUMOR'
| nPatients | R0 | R1 | R2 | RX |
|---|---|---|---|---|
| ALL | 371 | 22 | 16 | 40 |
| AMP PEAK 46(20Q13.12) MUTATED | 91 | 7 | 9 | 15 |
| AMP PEAK 46(20Q13.12) WILD-TYPE | 280 | 15 | 7 | 25 |
Figure S117. Get High-res Image Gene #46: 'amp_20q13.12' versus Clinical Feature #4: 'RESIDUAL_TUMOR'
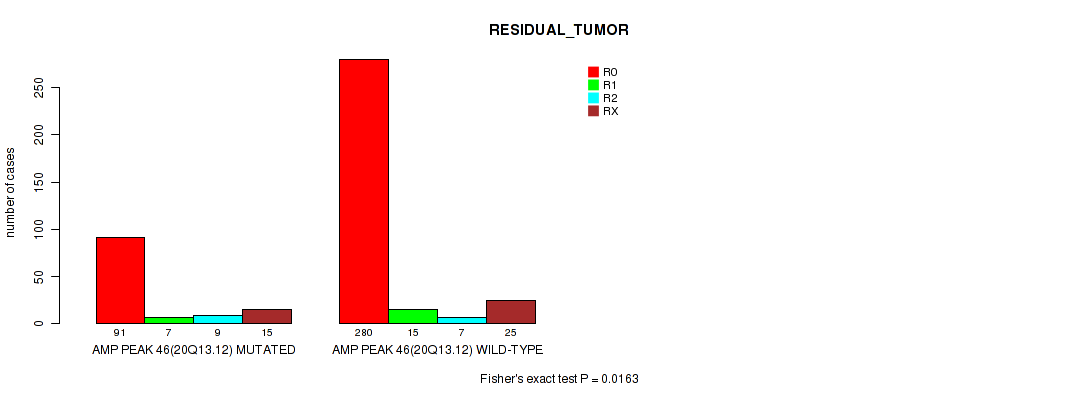
P value = 0.00453 (logrank test), Q value = 0.011
Table S118. Gene #47: 'amp_20q13.33' versus Clinical Feature #1: 'Time to Death'
| nPatients | nDeath | Duration Range (Median), Month | |
|---|---|---|---|
| ALL | 537 | 90 | 0.1 - 225.5 (29.9) |
| AMP PEAK 47(20Q13.33) MUTATED | 152 | 37 | 0.1 - 225.5 (28.0) |
| AMP PEAK 47(20Q13.33) WILD-TYPE | 385 | 53 | 0.1 - 185.8 (30.1) |
Figure S118. Get High-res Image Gene #47: 'amp_20q13.33' versus Clinical Feature #1: 'Time to Death'
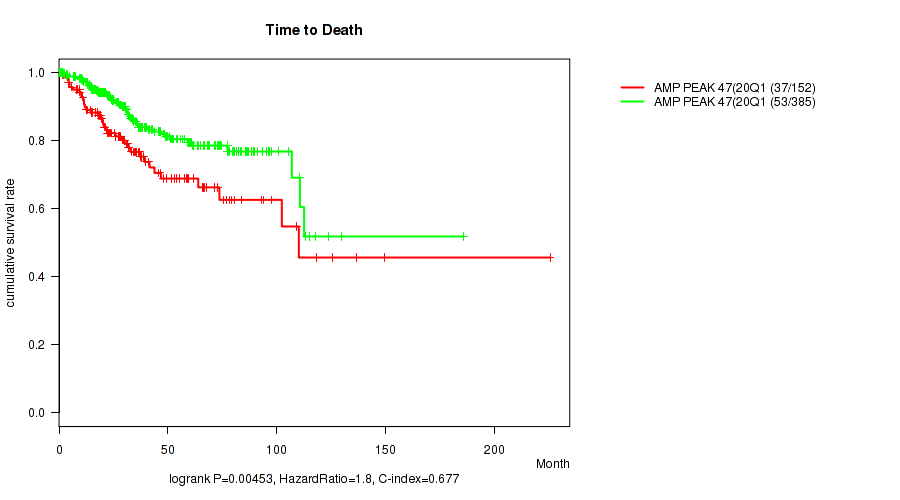
P value = 1e-05 (Fisher's exact test), Q value = 4e-05
Table S119. Gene #47: 'amp_20q13.33' versus Clinical Feature #3: 'HISTOLOGICAL_TYPE'
| nPatients | ENDOMETRIOID ENDOMETRIAL ADENOCARCINOMA | MIXED SEROUS AND ENDOMETRIOID | SEROUS ENDOMETRIAL ADENOCARCINOMA |
|---|---|---|---|
| ALL | 404 | 22 | 113 |
| AMP PEAK 47(20Q13.33) MUTATED | 70 | 6 | 77 |
| AMP PEAK 47(20Q13.33) WILD-TYPE | 334 | 16 | 36 |
Figure S119. Get High-res Image Gene #47: 'amp_20q13.33' versus Clinical Feature #3: 'HISTOLOGICAL_TYPE'

P value = 0.00257 (Fisher's exact test), Q value = 0.0066
Table S120. Gene #47: 'amp_20q13.33' versus Clinical Feature #4: 'RESIDUAL_TUMOR'
| nPatients | R0 | R1 | R2 | RX |
|---|---|---|---|---|
| ALL | 371 | 22 | 16 | 40 |
| AMP PEAK 47(20Q13.33) MUTATED | 91 | 7 | 10 | 16 |
| AMP PEAK 47(20Q13.33) WILD-TYPE | 280 | 15 | 6 | 24 |
Figure S120. Get High-res Image Gene #47: 'amp_20q13.33' versus Clinical Feature #4: 'RESIDUAL_TUMOR'
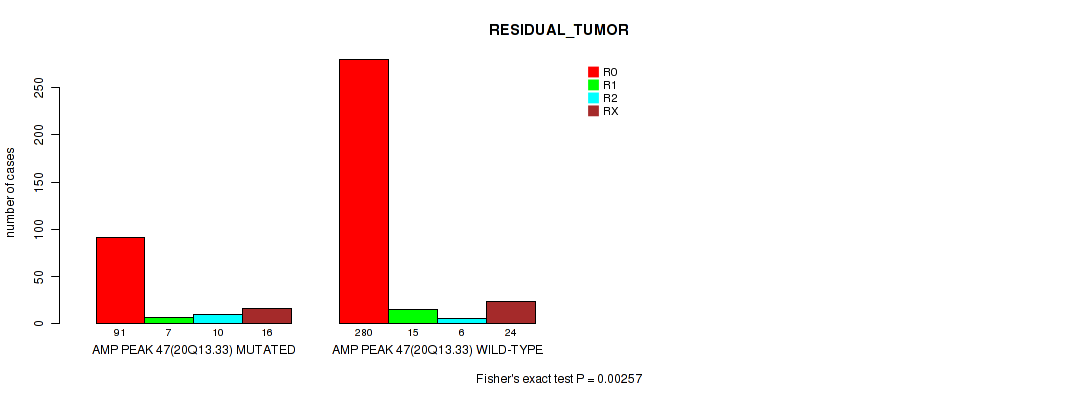
P value = 0.000308 (logrank test), Q value = 0.00093
Table S121. Gene #48: 'amp_22q12.2' versus Clinical Feature #1: 'Time to Death'
| nPatients | nDeath | Duration Range (Median), Month | |
|---|---|---|---|
| ALL | 537 | 90 | 0.1 - 225.5 (29.9) |
| AMP PEAK 48(22Q12.2) MUTATED | 61 | 20 | 0.4 - 225.5 (27.9) |
| AMP PEAK 48(22Q12.2) WILD-TYPE | 476 | 70 | 0.1 - 185.8 (30.1) |
Figure S121. Get High-res Image Gene #48: 'amp_22q12.2' versus Clinical Feature #1: 'Time to Death'
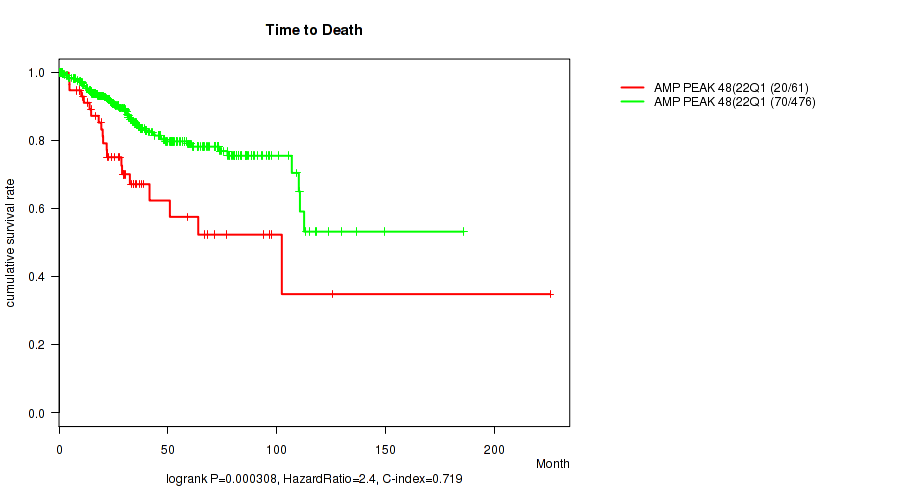
P value = 1e-05 (Fisher's exact test), Q value = 4e-05
Table S122. Gene #48: 'amp_22q12.2' versus Clinical Feature #3: 'HISTOLOGICAL_TYPE'
| nPatients | ENDOMETRIOID ENDOMETRIAL ADENOCARCINOMA | MIXED SEROUS AND ENDOMETRIOID | SEROUS ENDOMETRIAL ADENOCARCINOMA |
|---|---|---|---|
| ALL | 404 | 22 | 113 |
| AMP PEAK 48(22Q12.2) MUTATED | 11 | 2 | 49 |
| AMP PEAK 48(22Q12.2) WILD-TYPE | 393 | 20 | 64 |
Figure S122. Get High-res Image Gene #48: 'amp_22q12.2' versus Clinical Feature #3: 'HISTOLOGICAL_TYPE'
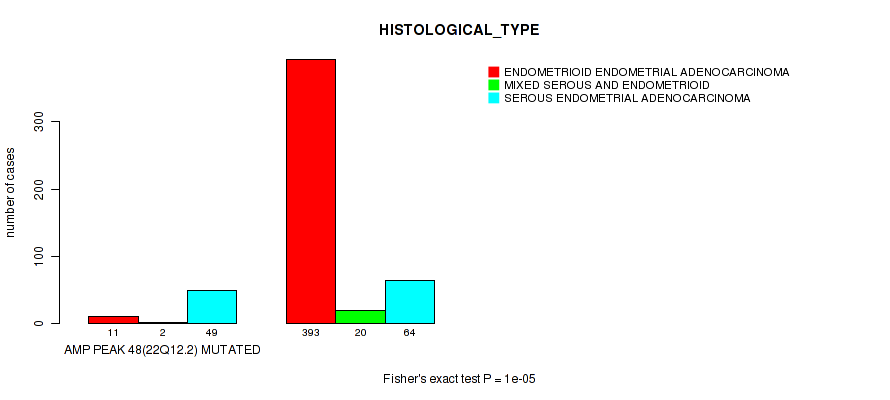
P value = 0.00172 (Fisher's exact test), Q value = 0.0045
Table S123. Gene #48: 'amp_22q12.2' versus Clinical Feature #4: 'RESIDUAL_TUMOR'
| nPatients | R0 | R1 | R2 | RX |
|---|---|---|---|---|
| ALL | 371 | 22 | 16 | 40 |
| AMP PEAK 48(22Q12.2) MUTATED | 35 | 3 | 7 | 6 |
| AMP PEAK 48(22Q12.2) WILD-TYPE | 336 | 19 | 9 | 34 |
Figure S123. Get High-res Image Gene #48: 'amp_22q12.2' versus Clinical Feature #4: 'RESIDUAL_TUMOR'
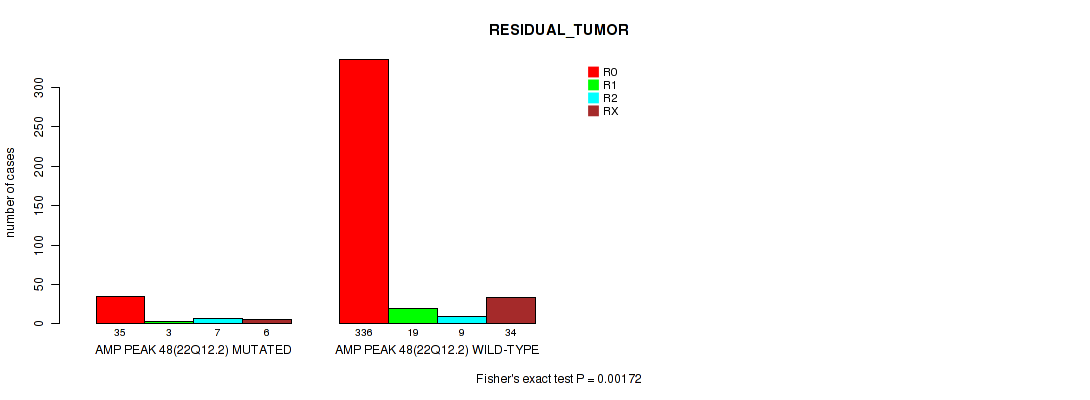
P value = 0.00044 (Fisher's exact test), Q value = 0.0013
Table S124. Gene #49: 'amp_xp11.23' versus Clinical Feature #3: 'HISTOLOGICAL_TYPE'
| nPatients | ENDOMETRIOID ENDOMETRIAL ADENOCARCINOMA | MIXED SEROUS AND ENDOMETRIOID | SEROUS ENDOMETRIAL ADENOCARCINOMA |
|---|---|---|---|
| ALL | 404 | 22 | 113 |
| AMP PEAK 49(XP11.23) MUTATED | 53 | 4 | 33 |
| AMP PEAK 49(XP11.23) WILD-TYPE | 351 | 18 | 80 |
Figure S124. Get High-res Image Gene #49: 'amp_xp11.23' versus Clinical Feature #3: 'HISTOLOGICAL_TYPE'
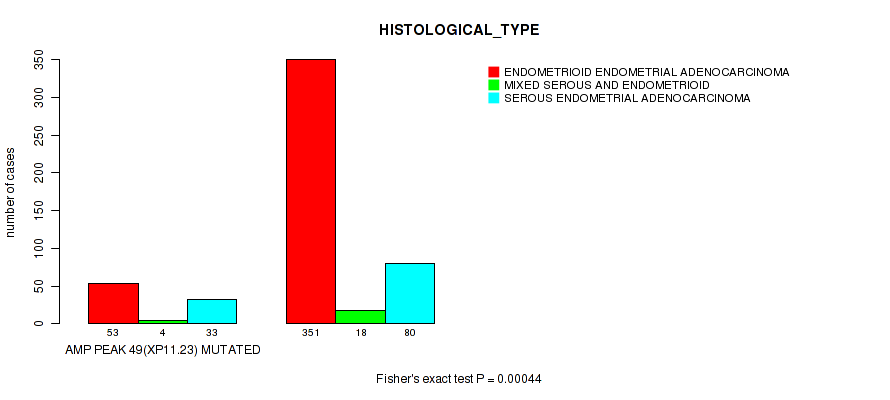
P value = 0.00767 (logrank test), Q value = 0.018
Table S125. Gene #50: 'amp_xq28' versus Clinical Feature #1: 'Time to Death'
| nPatients | nDeath | Duration Range (Median), Month | |
|---|---|---|---|
| ALL | 537 | 90 | 0.1 - 225.5 (29.9) |
| AMP PEAK 50(XQ28) MUTATED | 92 | 24 | 0.1 - 110.6 (28.5) |
| AMP PEAK 50(XQ28) WILD-TYPE | 445 | 66 | 0.1 - 225.5 (29.9) |
Figure S125. Get High-res Image Gene #50: 'amp_xq28' versus Clinical Feature #1: 'Time to Death'

P value = 0.00032 (Fisher's exact test), Q value = 0.00095
Table S126. Gene #50: 'amp_xq28' versus Clinical Feature #3: 'HISTOLOGICAL_TYPE'
| nPatients | ENDOMETRIOID ENDOMETRIAL ADENOCARCINOMA | MIXED SEROUS AND ENDOMETRIOID | SEROUS ENDOMETRIAL ADENOCARCINOMA |
|---|---|---|---|
| ALL | 404 | 22 | 113 |
| AMP PEAK 50(XQ28) MUTATED | 55 | 4 | 34 |
| AMP PEAK 50(XQ28) WILD-TYPE | 349 | 18 | 79 |
Figure S126. Get High-res Image Gene #50: 'amp_xq28' versus Clinical Feature #3: 'HISTOLOGICAL_TYPE'
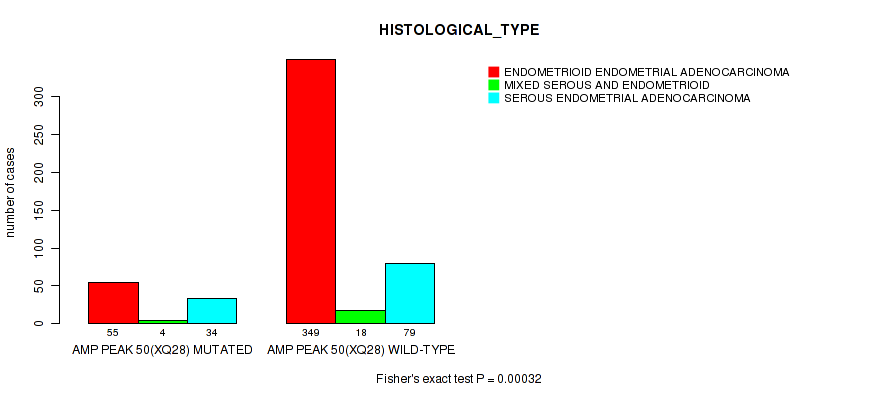
P value = 0.158 (Fisher's exact test), Q value = 0.25
Table S127. Gene #50: 'amp_xq28' versus Clinical Feature #4: 'RESIDUAL_TUMOR'
| nPatients | R0 | R1 | R2 | RX |
|---|---|---|---|---|
| ALL | 371 | 22 | 16 | 40 |
| AMP PEAK 50(XQ28) MUTATED | 65 | 2 | 6 | 8 |
| AMP PEAK 50(XQ28) WILD-TYPE | 306 | 20 | 10 | 32 |
Figure S127. Get High-res Image Gene #50: 'amp_xq28' versus Clinical Feature #4: 'RESIDUAL_TUMOR'

P value = 0.00987 (logrank test), Q value = 0.023
Table S128. Gene #51: 'del_1p36.21' versus Clinical Feature #1: 'Time to Death'
| nPatients | nDeath | Duration Range (Median), Month | |
|---|---|---|---|
| ALL | 537 | 90 | 0.1 - 225.5 (29.9) |
| DEL PEAK 1(1P36.21) MUTATED | 71 | 20 | 0.6 - 149.6 (30.7) |
| DEL PEAK 1(1P36.21) WILD-TYPE | 466 | 70 | 0.1 - 225.5 (29.8) |
Figure S128. Get High-res Image Gene #51: 'del_1p36.21' versus Clinical Feature #1: 'Time to Death'
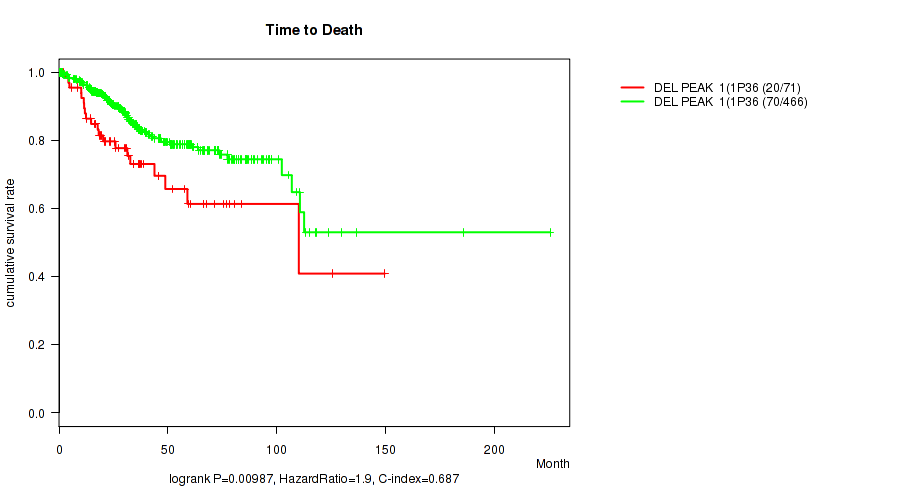
P value = 1e-05 (Fisher's exact test), Q value = 4e-05
Table S129. Gene #51: 'del_1p36.21' versus Clinical Feature #3: 'HISTOLOGICAL_TYPE'
| nPatients | ENDOMETRIOID ENDOMETRIAL ADENOCARCINOMA | MIXED SEROUS AND ENDOMETRIOID | SEROUS ENDOMETRIAL ADENOCARCINOMA |
|---|---|---|---|
| ALL | 404 | 22 | 113 |
| DEL PEAK 1(1P36.21) MUTATED | 28 | 5 | 38 |
| DEL PEAK 1(1P36.21) WILD-TYPE | 376 | 17 | 75 |
Figure S129. Get High-res Image Gene #51: 'del_1p36.21' versus Clinical Feature #3: 'HISTOLOGICAL_TYPE'
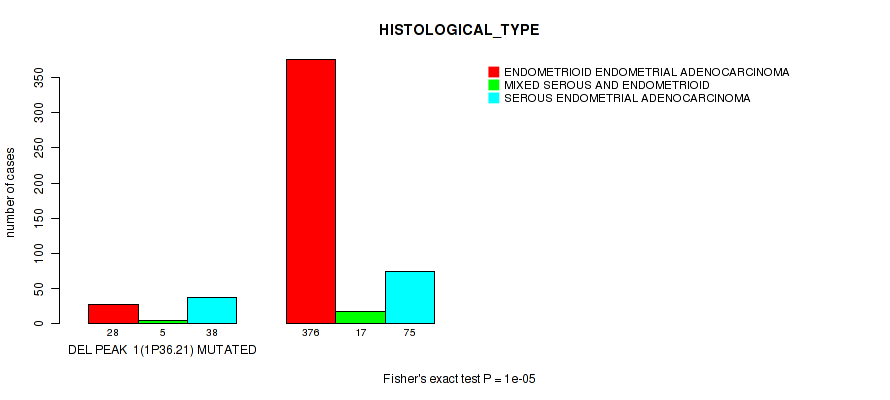
P value = 0.000102 (logrank test), Q value = 0.00034
Table S130. Gene #52: 'del_1p36.11' versus Clinical Feature #1: 'Time to Death'
| nPatients | nDeath | Duration Range (Median), Month | |
|---|---|---|---|
| ALL | 537 | 90 | 0.1 - 225.5 (29.9) |
| DEL PEAK 2(1P36.11) MUTATED | 82 | 25 | 0.6 - 149.6 (28.1) |
| DEL PEAK 2(1P36.11) WILD-TYPE | 455 | 65 | 0.1 - 225.5 (30.1) |
Figure S130. Get High-res Image Gene #52: 'del_1p36.11' versus Clinical Feature #1: 'Time to Death'

P value = 1e-05 (Fisher's exact test), Q value = 4e-05
Table S131. Gene #52: 'del_1p36.11' versus Clinical Feature #3: 'HISTOLOGICAL_TYPE'
| nPatients | ENDOMETRIOID ENDOMETRIAL ADENOCARCINOMA | MIXED SEROUS AND ENDOMETRIOID | SEROUS ENDOMETRIAL ADENOCARCINOMA |
|---|---|---|---|
| ALL | 404 | 22 | 113 |
| DEL PEAK 2(1P36.11) MUTATED | 28 | 5 | 50 |
| DEL PEAK 2(1P36.11) WILD-TYPE | 376 | 17 | 63 |
Figure S131. Get High-res Image Gene #52: 'del_1p36.11' versus Clinical Feature #3: 'HISTOLOGICAL_TYPE'

P value = 0.0498 (Fisher's exact test), Q value = 0.096
Table S132. Gene #52: 'del_1p36.11' versus Clinical Feature #4: 'RESIDUAL_TUMOR'
| nPatients | R0 | R1 | R2 | RX |
|---|---|---|---|---|
| ALL | 371 | 22 | 16 | 40 |
| DEL PEAK 2(1P36.11) MUTATED | 53 | 7 | 5 | 6 |
| DEL PEAK 2(1P36.11) WILD-TYPE | 318 | 15 | 11 | 34 |
Figure S132. Get High-res Image Gene #52: 'del_1p36.11' versus Clinical Feature #4: 'RESIDUAL_TUMOR'
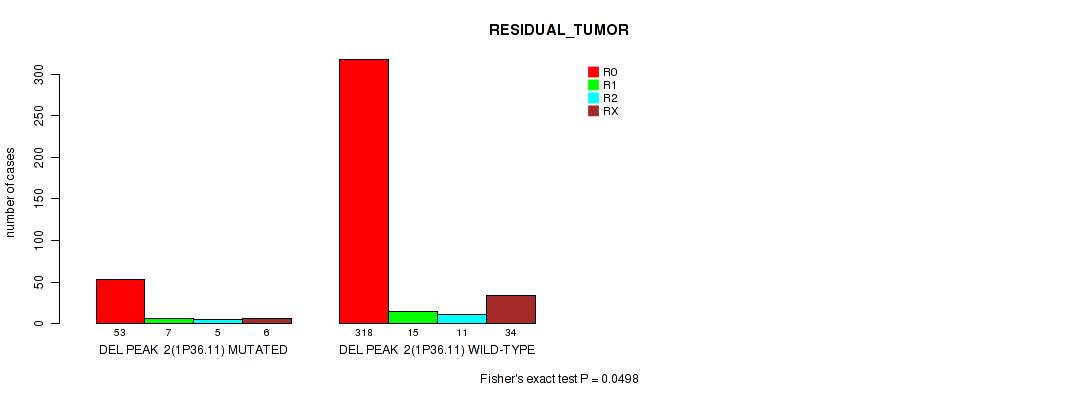
P value = 0.00503 (logrank test), Q value = 0.012
Table S133. Gene #53: 'del_2p25.3' versus Clinical Feature #1: 'Time to Death'
| nPatients | nDeath | Duration Range (Median), Month | |
|---|---|---|---|
| ALL | 537 | 90 | 0.1 - 225.5 (29.9) |
| DEL PEAK 3(2P25.3) MUTATED | 25 | 8 | 0.6 - 125.4 (22.3) |
| DEL PEAK 3(2P25.3) WILD-TYPE | 512 | 82 | 0.1 - 225.5 (30.1) |
Figure S133. Get High-res Image Gene #53: 'del_2p25.3' versus Clinical Feature #1: 'Time to Death'
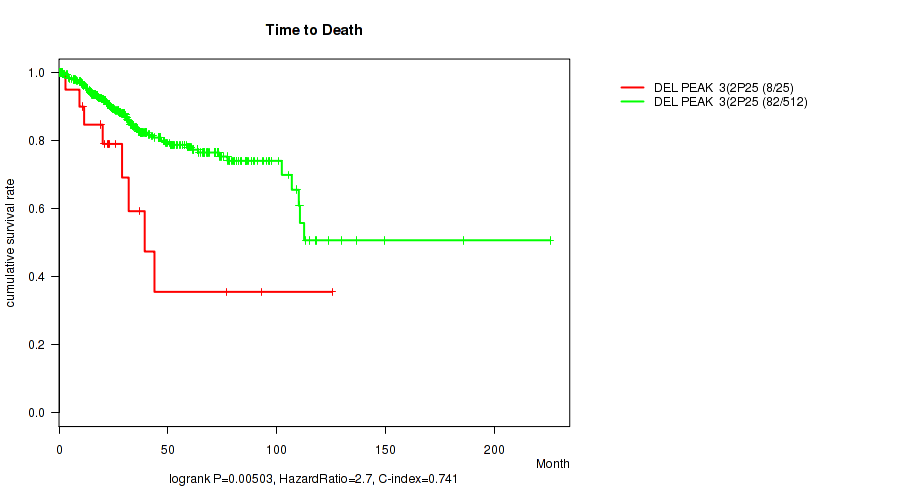
P value = 0.0899 (Fisher's exact test), Q value = 0.16
Table S134. Gene #53: 'del_2p25.3' versus Clinical Feature #2: 'RADIATION_THERAPY'
| nPatients | NO | YES |
|---|---|---|
| ALL | 290 | 224 |
| DEL PEAK 3(2P25.3) MUTATED | 17 | 6 |
| DEL PEAK 3(2P25.3) WILD-TYPE | 273 | 218 |
Figure S134. Get High-res Image Gene #53: 'del_2p25.3' versus Clinical Feature #2: 'RADIATION_THERAPY'
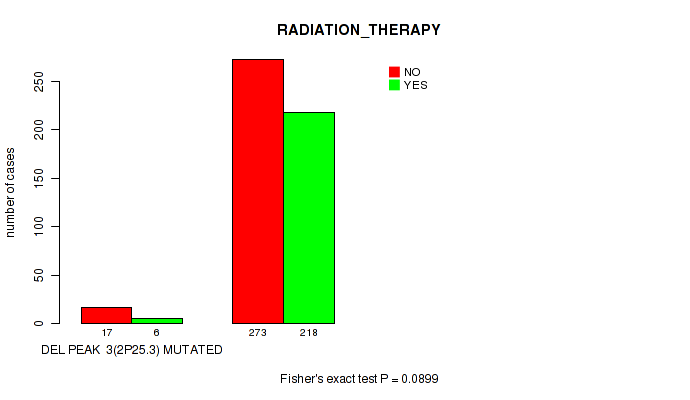
P value = 0.00993 (Fisher's exact test), Q value = 0.023
Table S135. Gene #53: 'del_2p25.3' versus Clinical Feature #3: 'HISTOLOGICAL_TYPE'
| nPatients | ENDOMETRIOID ENDOMETRIAL ADENOCARCINOMA | MIXED SEROUS AND ENDOMETRIOID | SEROUS ENDOMETRIAL ADENOCARCINOMA |
|---|---|---|---|
| ALL | 404 | 22 | 113 |
| DEL PEAK 3(2P25.3) MUTATED | 13 | 2 | 11 |
| DEL PEAK 3(2P25.3) WILD-TYPE | 391 | 20 | 102 |
Figure S135. Get High-res Image Gene #53: 'del_2p25.3' versus Clinical Feature #3: 'HISTOLOGICAL_TYPE'
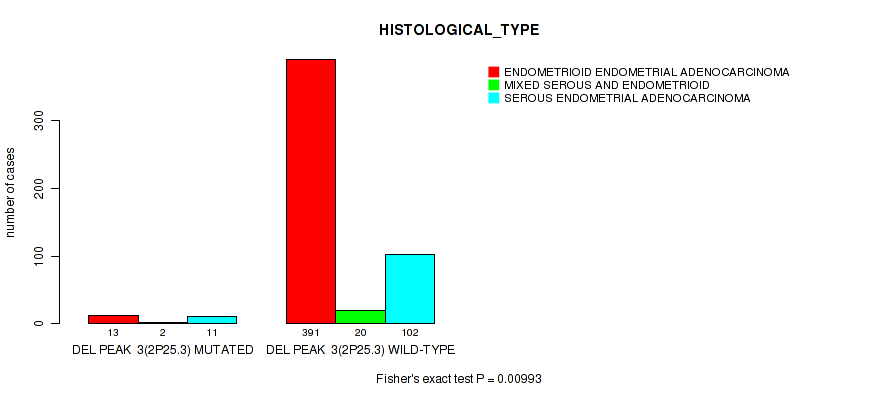
P value = 8.17e-09 (logrank test), Q value = 3.3e-06
Table S136. Gene #54: 'del_2q22.1' versus Clinical Feature #1: 'Time to Death'
| nPatients | nDeath | Duration Range (Median), Month | |
|---|---|---|---|
| ALL | 537 | 90 | 0.1 - 225.5 (29.9) |
| DEL PEAK 4(2Q22.1) MUTATED | 49 | 21 | 0.6 - 125.4 (22.4) |
| DEL PEAK 4(2Q22.1) WILD-TYPE | 488 | 69 | 0.1 - 225.5 (30.6) |
Figure S136. Get High-res Image Gene #54: 'del_2q22.1' versus Clinical Feature #1: 'Time to Death'
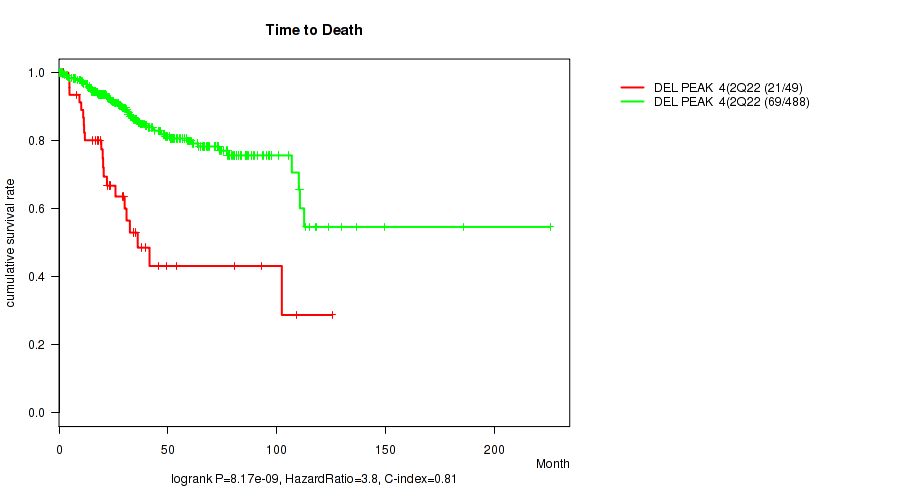
P value = 1e-05 (Fisher's exact test), Q value = 4e-05
Table S137. Gene #54: 'del_2q22.1' versus Clinical Feature #3: 'HISTOLOGICAL_TYPE'
| nPatients | ENDOMETRIOID ENDOMETRIAL ADENOCARCINOMA | MIXED SEROUS AND ENDOMETRIOID | SEROUS ENDOMETRIAL ADENOCARCINOMA |
|---|---|---|---|
| ALL | 404 | 22 | 113 |
| DEL PEAK 4(2Q22.1) MUTATED | 19 | 2 | 28 |
| DEL PEAK 4(2Q22.1) WILD-TYPE | 385 | 20 | 85 |
Figure S137. Get High-res Image Gene #54: 'del_2q22.1' versus Clinical Feature #3: 'HISTOLOGICAL_TYPE'
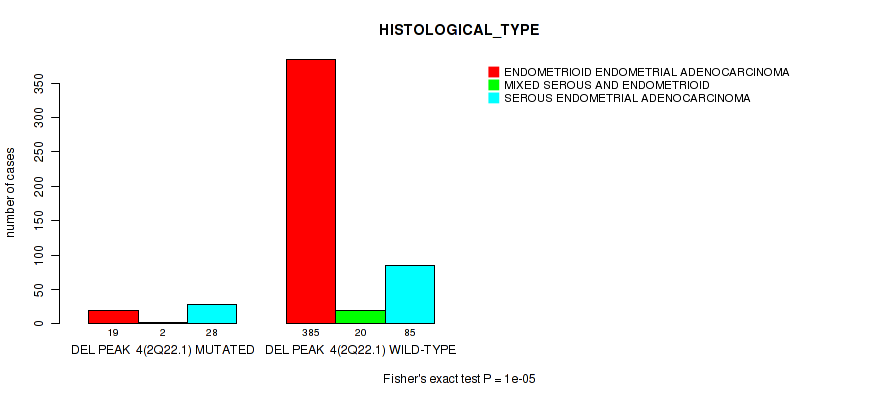
P value = 0.00014 (Fisher's exact test), Q value = 0.00045
Table S138. Gene #54: 'del_2q22.1' versus Clinical Feature #4: 'RESIDUAL_TUMOR'
| nPatients | R0 | R1 | R2 | RX |
|---|---|---|---|---|
| ALL | 371 | 22 | 16 | 40 |
| DEL PEAK 4(2Q22.1) MUTATED | 24 | 2 | 5 | 10 |
| DEL PEAK 4(2Q22.1) WILD-TYPE | 347 | 20 | 11 | 30 |
Figure S138. Get High-res Image Gene #54: 'del_2q22.1' versus Clinical Feature #4: 'RESIDUAL_TUMOR'
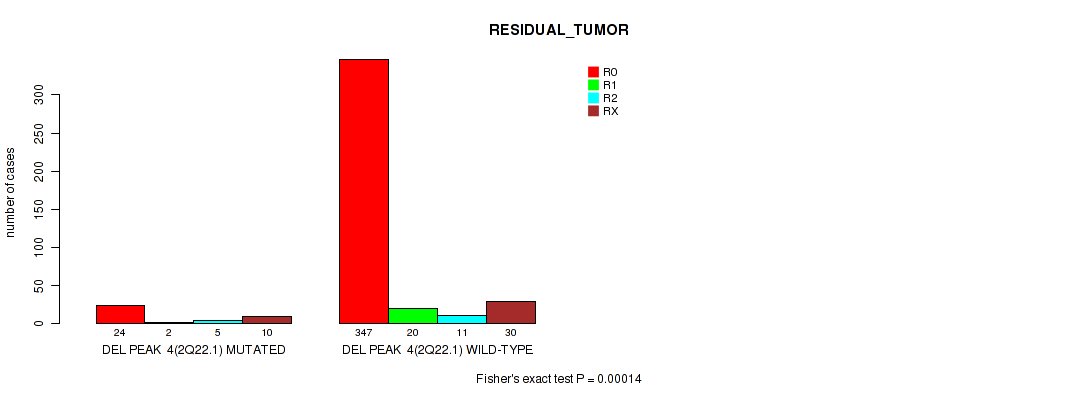
P value = 0.00026 (Fisher's exact test), Q value = 8e-04
Table S139. Gene #55: 'del_2q37.3' versus Clinical Feature #3: 'HISTOLOGICAL_TYPE'
| nPatients | ENDOMETRIOID ENDOMETRIAL ADENOCARCINOMA | MIXED SEROUS AND ENDOMETRIOID | SEROUS ENDOMETRIAL ADENOCARCINOMA |
|---|---|---|---|
| ALL | 404 | 22 | 113 |
| DEL PEAK 5(2Q37.3) MUTATED | 27 | 2 | 23 |
| DEL PEAK 5(2Q37.3) WILD-TYPE | 377 | 20 | 90 |
Figure S139. Get High-res Image Gene #55: 'del_2q37.3' versus Clinical Feature #3: 'HISTOLOGICAL_TYPE'

P value = 0.0291 (Fisher's exact test), Q value = 0.06
Table S140. Gene #55: 'del_2q37.3' versus Clinical Feature #4: 'RESIDUAL_TUMOR'
| nPatients | R0 | R1 | R2 | RX |
|---|---|---|---|---|
| ALL | 371 | 22 | 16 | 40 |
| DEL PEAK 5(2Q37.3) MUTATED | 32 | 2 | 3 | 9 |
| DEL PEAK 5(2Q37.3) WILD-TYPE | 339 | 20 | 13 | 31 |
Figure S140. Get High-res Image Gene #55: 'del_2q37.3' versus Clinical Feature #4: 'RESIDUAL_TUMOR'

P value = 0.00185 (logrank test), Q value = 0.0048
Table S141. Gene #56: 'del_3p14.2' versus Clinical Feature #1: 'Time to Death'
| nPatients | nDeath | Duration Range (Median), Month | |
|---|---|---|---|
| ALL | 537 | 90 | 0.1 - 225.5 (29.9) |
| DEL PEAK 6(3P14.2) MUTATED | 78 | 21 | 0.1 - 125.4 (26.0) |
| DEL PEAK 6(3P14.2) WILD-TYPE | 459 | 69 | 0.1 - 225.5 (30.4) |
Figure S141. Get High-res Image Gene #56: 'del_3p14.2' versus Clinical Feature #1: 'Time to Death'
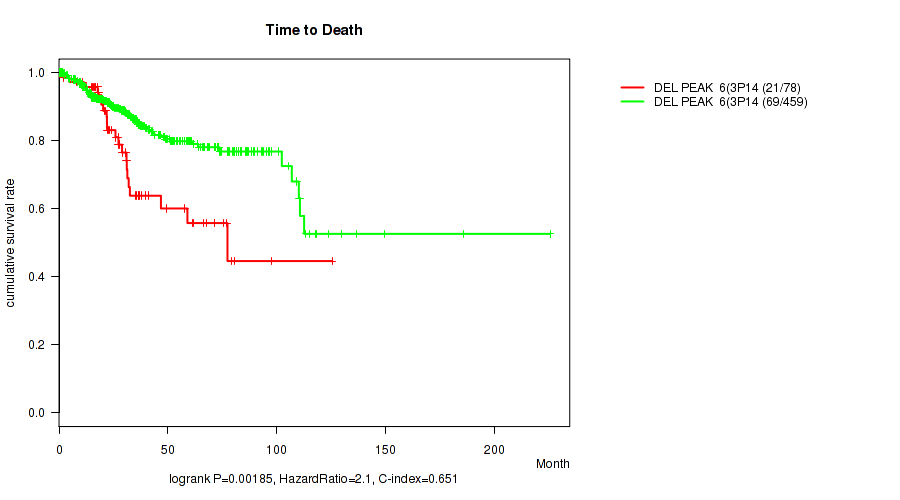
P value = 1e-05 (Fisher's exact test), Q value = 4e-05
Table S142. Gene #56: 'del_3p14.2' versus Clinical Feature #3: 'HISTOLOGICAL_TYPE'
| nPatients | ENDOMETRIOID ENDOMETRIAL ADENOCARCINOMA | MIXED SEROUS AND ENDOMETRIOID | SEROUS ENDOMETRIAL ADENOCARCINOMA |
|---|---|---|---|
| ALL | 404 | 22 | 113 |
| DEL PEAK 6(3P14.2) MUTATED | 29 | 6 | 44 |
| DEL PEAK 6(3P14.2) WILD-TYPE | 375 | 16 | 69 |
Figure S142. Get High-res Image Gene #56: 'del_3p14.2' versus Clinical Feature #3: 'HISTOLOGICAL_TYPE'

P value = 1e-05 (Fisher's exact test), Q value = 4e-05
Table S143. Gene #57: 'del_3q13.31' versus Clinical Feature #3: 'HISTOLOGICAL_TYPE'
| nPatients | ENDOMETRIOID ENDOMETRIAL ADENOCARCINOMA | MIXED SEROUS AND ENDOMETRIOID | SEROUS ENDOMETRIAL ADENOCARCINOMA |
|---|---|---|---|
| ALL | 404 | 22 | 113 |
| DEL PEAK 7(3Q13.31) MUTATED | 18 | 3 | 22 |
| DEL PEAK 7(3Q13.31) WILD-TYPE | 386 | 19 | 91 |
Figure S143. Get High-res Image Gene #57: 'del_3q13.31' versus Clinical Feature #3: 'HISTOLOGICAL_TYPE'

P value = 0.0235 (logrank test), Q value = 0.05
Table S144. Gene #58: 'del_4p16.3' versus Clinical Feature #1: 'Time to Death'
| nPatients | nDeath | Duration Range (Median), Month | |
|---|---|---|---|
| ALL | 537 | 90 | 0.1 - 225.5 (29.9) |
| DEL PEAK 8(4P16.3) MUTATED | 93 | 22 | 0.2 - 149.6 (25.5) |
| DEL PEAK 8(4P16.3) WILD-TYPE | 444 | 68 | 0.1 - 225.5 (31.0) |
Figure S144. Get High-res Image Gene #58: 'del_4p16.3' versus Clinical Feature #1: 'Time to Death'

P value = 1e-05 (Fisher's exact test), Q value = 4e-05
Table S145. Gene #58: 'del_4p16.3' versus Clinical Feature #3: 'HISTOLOGICAL_TYPE'
| nPatients | ENDOMETRIOID ENDOMETRIAL ADENOCARCINOMA | MIXED SEROUS AND ENDOMETRIOID | SEROUS ENDOMETRIAL ADENOCARCINOMA |
|---|---|---|---|
| ALL | 404 | 22 | 113 |
| DEL PEAK 8(4P16.3) MUTATED | 32 | 6 | 56 |
| DEL PEAK 8(4P16.3) WILD-TYPE | 372 | 16 | 57 |
Figure S145. Get High-res Image Gene #58: 'del_4p16.3' versus Clinical Feature #3: 'HISTOLOGICAL_TYPE'
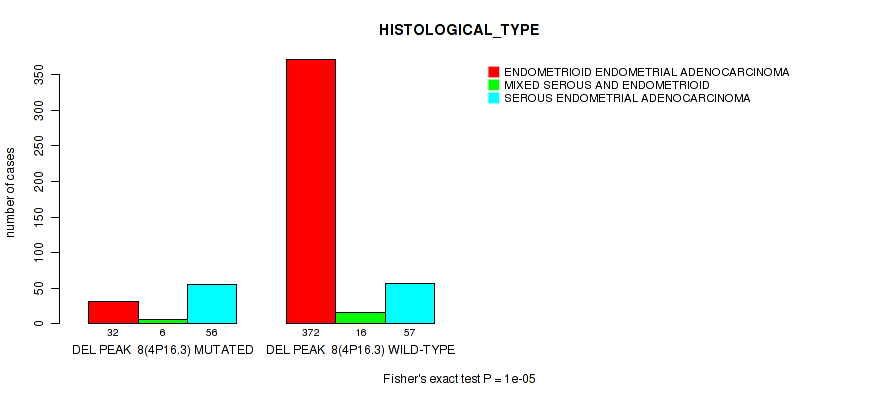
P value = 0.00572 (logrank test), Q value = 0.014
Table S146. Gene #59: 'del_4p15.31' versus Clinical Feature #1: 'Time to Death'
| nPatients | nDeath | Duration Range (Median), Month | |
|---|---|---|---|
| ALL | 537 | 90 | 0.1 - 225.5 (29.9) |
| DEL PEAK 9(4P15.31) MUTATED | 98 | 25 | 0.2 - 149.6 (26.0) |
| DEL PEAK 9(4P15.31) WILD-TYPE | 439 | 65 | 0.1 - 225.5 (30.7) |
Figure S146. Get High-res Image Gene #59: 'del_4p15.31' versus Clinical Feature #1: 'Time to Death'

P value = 1e-05 (Fisher's exact test), Q value = 4e-05
Table S147. Gene #59: 'del_4p15.31' versus Clinical Feature #3: 'HISTOLOGICAL_TYPE'
| nPatients | ENDOMETRIOID ENDOMETRIAL ADENOCARCINOMA | MIXED SEROUS AND ENDOMETRIOID | SEROUS ENDOMETRIAL ADENOCARCINOMA |
|---|---|---|---|
| ALL | 404 | 22 | 113 |
| DEL PEAK 9(4P15.31) MUTATED | 35 | 5 | 59 |
| DEL PEAK 9(4P15.31) WILD-TYPE | 369 | 17 | 54 |
Figure S147. Get High-res Image Gene #59: 'del_4p15.31' versus Clinical Feature #3: 'HISTOLOGICAL_TYPE'
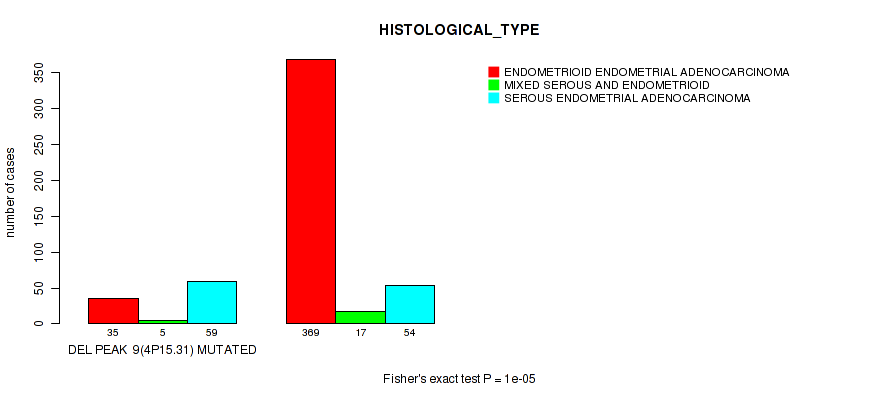
P value = 0.000117 (logrank test), Q value = 0.00038
Table S148. Gene #60: 'del_4q22.1' versus Clinical Feature #1: 'Time to Death'
| nPatients | nDeath | Duration Range (Median), Month | |
|---|---|---|---|
| ALL | 537 | 90 | 0.1 - 225.5 (29.9) |
| DEL PEAK 10(4Q22.1) MUTATED | 105 | 32 | 0.2 - 149.6 (28.9) |
| DEL PEAK 10(4Q22.1) WILD-TYPE | 432 | 58 | 0.1 - 225.5 (30.0) |
Figure S148. Get High-res Image Gene #60: 'del_4q22.1' versus Clinical Feature #1: 'Time to Death'

P value = 1e-05 (Fisher's exact test), Q value = 4e-05
Table S149. Gene #60: 'del_4q22.1' versus Clinical Feature #3: 'HISTOLOGICAL_TYPE'
| nPatients | ENDOMETRIOID ENDOMETRIAL ADENOCARCINOMA | MIXED SEROUS AND ENDOMETRIOID | SEROUS ENDOMETRIAL ADENOCARCINOMA |
|---|---|---|---|
| ALL | 404 | 22 | 113 |
| DEL PEAK 10(4Q22.1) MUTATED | 33 | 6 | 67 |
| DEL PEAK 10(4Q22.1) WILD-TYPE | 371 | 16 | 46 |
Figure S149. Get High-res Image Gene #60: 'del_4q22.1' versus Clinical Feature #3: 'HISTOLOGICAL_TYPE'

P value = 0.0328 (Fisher's exact test), Q value = 0.066
Table S150. Gene #60: 'del_4q22.1' versus Clinical Feature #4: 'RESIDUAL_TUMOR'
| nPatients | R0 | R1 | R2 | RX |
|---|---|---|---|---|
| ALL | 371 | 22 | 16 | 40 |
| DEL PEAK 10(4Q22.1) MUTATED | 64 | 6 | 7 | 10 |
| DEL PEAK 10(4Q22.1) WILD-TYPE | 307 | 16 | 9 | 30 |
Figure S150. Get High-res Image Gene #60: 'del_4q22.1' versus Clinical Feature #4: 'RESIDUAL_TUMOR'

P value = 0.000499 (logrank test), Q value = 0.0014
Table S151. Gene #61: 'del_4q34.3' versus Clinical Feature #1: 'Time to Death'
| nPatients | nDeath | Duration Range (Median), Month | |
|---|---|---|---|
| ALL | 537 | 90 | 0.1 - 225.5 (29.9) |
| DEL PEAK 11(4Q34.3) MUTATED | 129 | 34 | 0.2 - 149.6 (27.9) |
| DEL PEAK 11(4Q34.3) WILD-TYPE | 408 | 56 | 0.1 - 225.5 (30.7) |
Figure S151. Get High-res Image Gene #61: 'del_4q34.3' versus Clinical Feature #1: 'Time to Death'

P value = 1e-05 (Fisher's exact test), Q value = 4e-05
Table S152. Gene #61: 'del_4q34.3' versus Clinical Feature #3: 'HISTOLOGICAL_TYPE'
| nPatients | ENDOMETRIOID ENDOMETRIAL ADENOCARCINOMA | MIXED SEROUS AND ENDOMETRIOID | SEROUS ENDOMETRIAL ADENOCARCINOMA |
|---|---|---|---|
| ALL | 404 | 22 | 113 |
| DEL PEAK 11(4Q34.3) MUTATED | 45 | 8 | 77 |
| DEL PEAK 11(4Q34.3) WILD-TYPE | 359 | 14 | 36 |
Figure S152. Get High-res Image Gene #61: 'del_4q34.3' versus Clinical Feature #3: 'HISTOLOGICAL_TYPE'
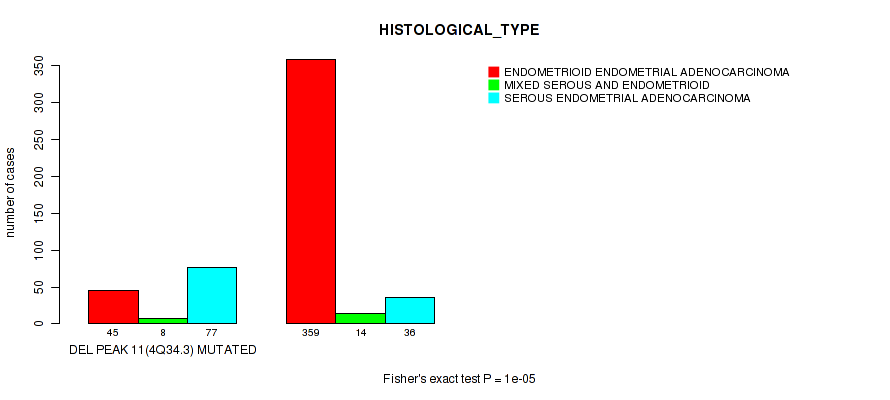
P value = 0.0891 (Fisher's exact test), Q value = 0.16
Table S153. Gene #61: 'del_4q34.3' versus Clinical Feature #4: 'RESIDUAL_TUMOR'
| nPatients | R0 | R1 | R2 | RX |
|---|---|---|---|---|
| ALL | 371 | 22 | 16 | 40 |
| DEL PEAK 11(4Q34.3) MUTATED | 82 | 6 | 8 | 9 |
| DEL PEAK 11(4Q34.3) WILD-TYPE | 289 | 16 | 8 | 31 |
Figure S153. Get High-res Image Gene #61: 'del_4q34.3' versus Clinical Feature #4: 'RESIDUAL_TUMOR'

P value = 0.000214 (logrank test), Q value = 0.00066
Table S154. Gene #62: 'del_5q12.1' versus Clinical Feature #1: 'Time to Death'
| nPatients | nDeath | Duration Range (Median), Month | |
|---|---|---|---|
| ALL | 537 | 90 | 0.1 - 225.5 (29.9) |
| DEL PEAK 12(5Q12.1) MUTATED | 110 | 31 | 0.2 - 149.6 (27.9) |
| DEL PEAK 12(5Q12.1) WILD-TYPE | 427 | 59 | 0.1 - 225.5 (30.1) |
Figure S154. Get High-res Image Gene #62: 'del_5q12.1' versus Clinical Feature #1: 'Time to Death'

P value = 1e-05 (Fisher's exact test), Q value = 4e-05
Table S155. Gene #62: 'del_5q12.1' versus Clinical Feature #3: 'HISTOLOGICAL_TYPE'
| nPatients | ENDOMETRIOID ENDOMETRIAL ADENOCARCINOMA | MIXED SEROUS AND ENDOMETRIOID | SEROUS ENDOMETRIAL ADENOCARCINOMA |
|---|---|---|---|
| ALL | 404 | 22 | 113 |
| DEL PEAK 12(5Q12.1) MUTATED | 37 | 4 | 70 |
| DEL PEAK 12(5Q12.1) WILD-TYPE | 367 | 18 | 43 |
Figure S155. Get High-res Image Gene #62: 'del_5q12.1' versus Clinical Feature #3: 'HISTOLOGICAL_TYPE'

P value = 0.123 (logrank test), Q value = 0.21
Table S156. Gene #63: 'del_6q26' versus Clinical Feature #1: 'Time to Death'
| nPatients | nDeath | Duration Range (Median), Month | |
|---|---|---|---|
| ALL | 537 | 90 | 0.1 - 225.5 (29.9) |
| DEL PEAK 13(6Q26) MUTATED | 45 | 12 | 0.6 - 149.6 (33.3) |
| DEL PEAK 13(6Q26) WILD-TYPE | 492 | 78 | 0.1 - 225.5 (29.8) |
Figure S156. Get High-res Image Gene #63: 'del_6q26' versus Clinical Feature #1: 'Time to Death'

P value = 0.0347 (Fisher's exact test), Q value = 0.069
Table S157. Gene #63: 'del_6q26' versus Clinical Feature #2: 'RADIATION_THERAPY'
| nPatients | NO | YES |
|---|---|---|
| ALL | 290 | 224 |
| DEL PEAK 13(6Q26) MUTATED | 17 | 25 |
| DEL PEAK 13(6Q26) WILD-TYPE | 273 | 199 |
Figure S157. Get High-res Image Gene #63: 'del_6q26' versus Clinical Feature #2: 'RADIATION_THERAPY'
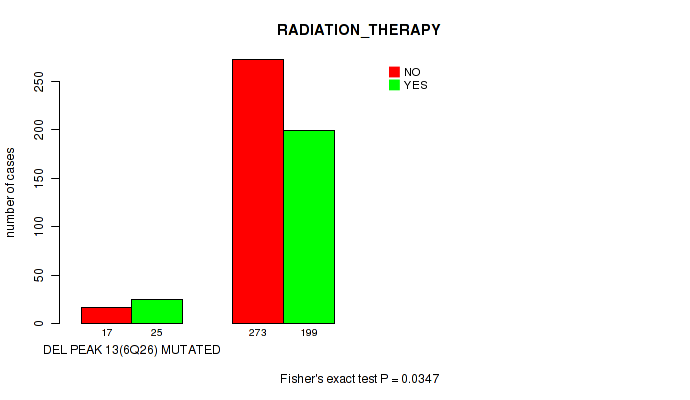
P value = 1e-05 (Fisher's exact test), Q value = 4e-05
Table S158. Gene #63: 'del_6q26' versus Clinical Feature #3: 'HISTOLOGICAL_TYPE'
| nPatients | ENDOMETRIOID ENDOMETRIAL ADENOCARCINOMA | MIXED SEROUS AND ENDOMETRIOID | SEROUS ENDOMETRIAL ADENOCARCINOMA |
|---|---|---|---|
| ALL | 404 | 22 | 113 |
| DEL PEAK 13(6Q26) MUTATED | 13 | 3 | 30 |
| DEL PEAK 13(6Q26) WILD-TYPE | 391 | 19 | 83 |
Figure S158. Get High-res Image Gene #63: 'del_6q26' versus Clinical Feature #3: 'HISTOLOGICAL_TYPE'
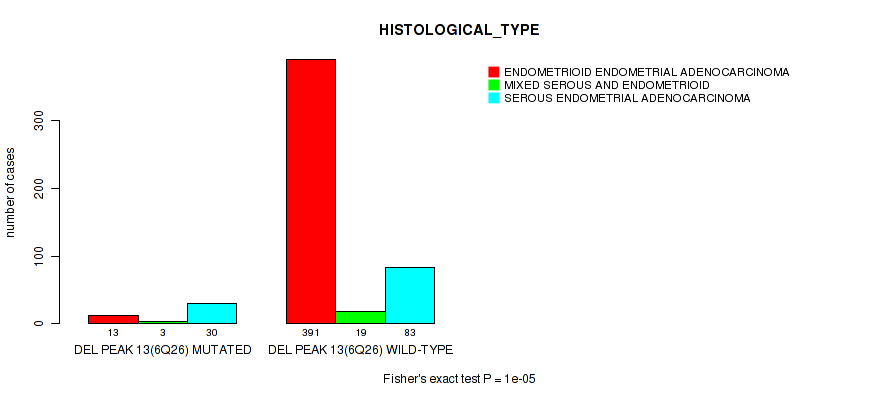
P value = 0.000786 (logrank test), Q value = 0.0022
Table S159. Gene #64: 'del_7p22.3' versus Clinical Feature #1: 'Time to Death'
| nPatients | nDeath | Duration Range (Median), Month | |
|---|---|---|---|
| ALL | 537 | 90 | 0.1 - 225.5 (29.9) |
| DEL PEAK 14(7P22.3) MUTATED | 71 | 22 | 0.6 - 110.6 (30.1) |
| DEL PEAK 14(7P22.3) WILD-TYPE | 466 | 68 | 0.1 - 225.5 (29.8) |
Figure S159. Get High-res Image Gene #64: 'del_7p22.3' versus Clinical Feature #1: 'Time to Death'
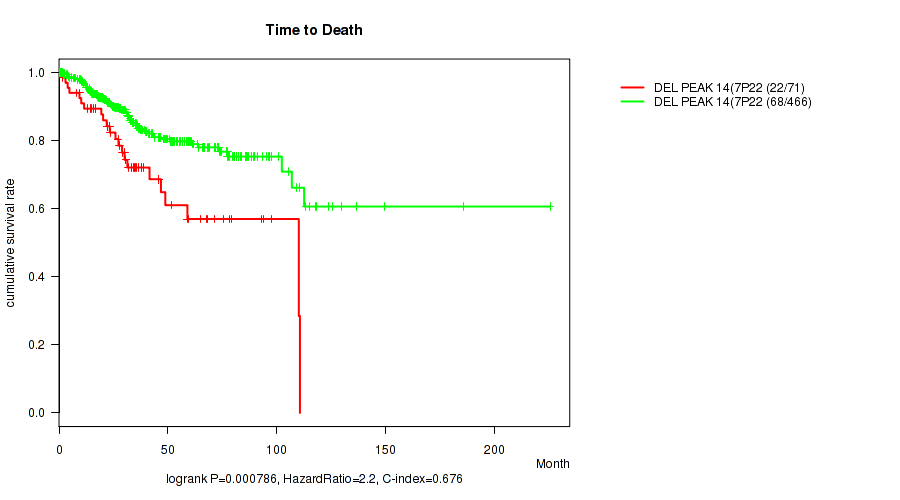
P value = 1e-05 (Fisher's exact test), Q value = 4e-05
Table S160. Gene #64: 'del_7p22.3' versus Clinical Feature #3: 'HISTOLOGICAL_TYPE'
| nPatients | ENDOMETRIOID ENDOMETRIAL ADENOCARCINOMA | MIXED SEROUS AND ENDOMETRIOID | SEROUS ENDOMETRIAL ADENOCARCINOMA |
|---|---|---|---|
| ALL | 404 | 22 | 113 |
| DEL PEAK 14(7P22.3) MUTATED | 23 | 5 | 44 |
| DEL PEAK 14(7P22.3) WILD-TYPE | 381 | 17 | 69 |
Figure S160. Get High-res Image Gene #64: 'del_7p22.3' versus Clinical Feature #3: 'HISTOLOGICAL_TYPE'

P value = 0.119 (Fisher's exact test), Q value = 0.2
Table S161. Gene #64: 'del_7p22.3' versus Clinical Feature #4: 'RESIDUAL_TUMOR'
| nPatients | R0 | R1 | R2 | RX |
|---|---|---|---|---|
| ALL | 371 | 22 | 16 | 40 |
| DEL PEAK 14(7P22.3) MUTATED | 46 | 4 | 4 | 9 |
| DEL PEAK 14(7P22.3) WILD-TYPE | 325 | 18 | 12 | 31 |
Figure S161. Get High-res Image Gene #64: 'del_7p22.3' versus Clinical Feature #4: 'RESIDUAL_TUMOR'
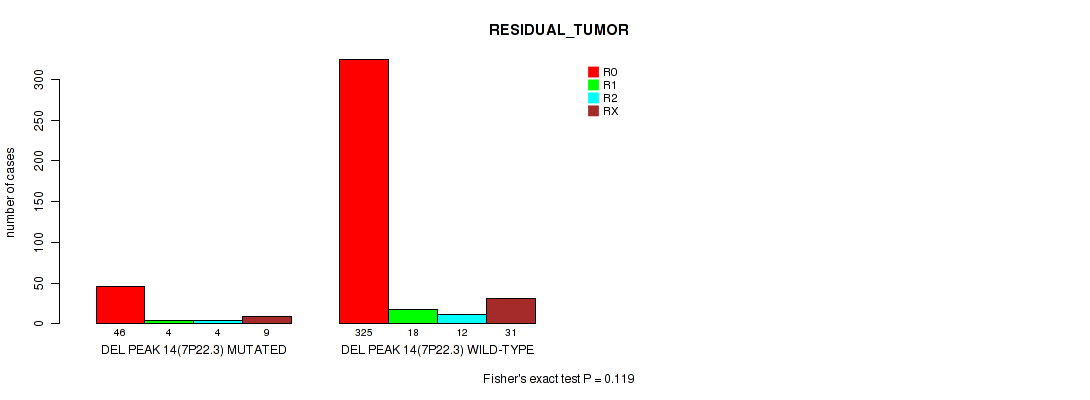
P value = 1e-05 (Fisher's exact test), Q value = 4e-05
Table S162. Gene #65: 'del_7q11.22' versus Clinical Feature #3: 'HISTOLOGICAL_TYPE'
| nPatients | ENDOMETRIOID ENDOMETRIAL ADENOCARCINOMA | MIXED SEROUS AND ENDOMETRIOID | SEROUS ENDOMETRIAL ADENOCARCINOMA |
|---|---|---|---|
| ALL | 404 | 22 | 113 |
| DEL PEAK 15(7Q11.22) MUTATED | 15 | 2 | 24 |
| DEL PEAK 15(7Q11.22) WILD-TYPE | 389 | 20 | 89 |
Figure S162. Get High-res Image Gene #65: 'del_7q11.22' versus Clinical Feature #3: 'HISTOLOGICAL_TYPE'
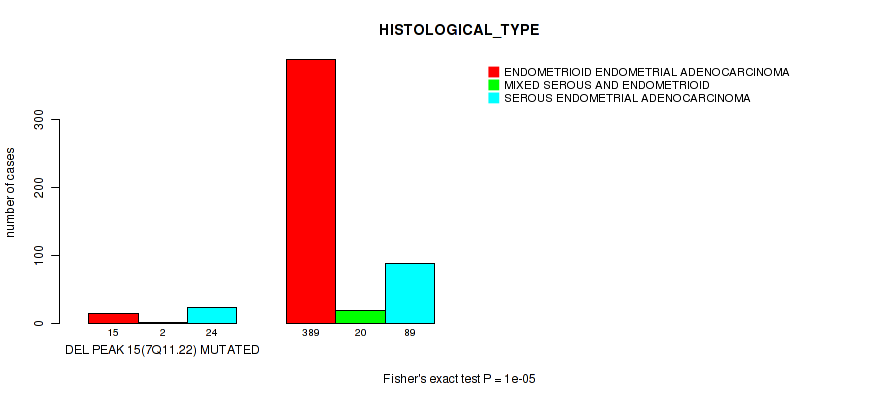
P value = 0.0218 (logrank test), Q value = 0.046
Table S163. Gene #66: 'del_7q31.1' versus Clinical Feature #1: 'Time to Death'
| nPatients | nDeath | Duration Range (Median), Month | |
|---|---|---|---|
| ALL | 537 | 90 | 0.1 - 225.5 (29.9) |
| DEL PEAK 16(7Q31.1) MUTATED | 55 | 16 | 0.1 - 118.2 (27.0) |
| DEL PEAK 16(7Q31.1) WILD-TYPE | 482 | 74 | 0.1 - 225.5 (29.9) |
Figure S163. Get High-res Image Gene #66: 'del_7q31.1' versus Clinical Feature #1: 'Time to Death'
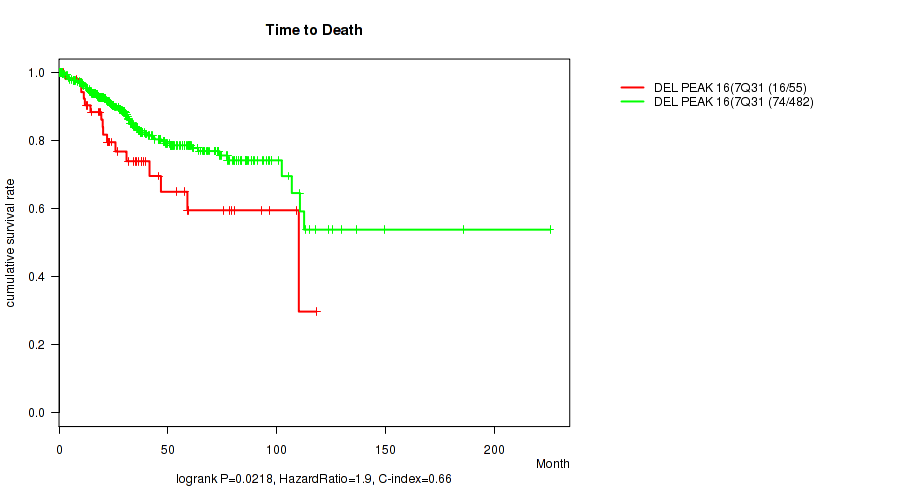
P value = 1e-05 (Fisher's exact test), Q value = 4e-05
Table S164. Gene #66: 'del_7q31.1' versus Clinical Feature #3: 'HISTOLOGICAL_TYPE'
| nPatients | ENDOMETRIOID ENDOMETRIAL ADENOCARCINOMA | MIXED SEROUS AND ENDOMETRIOID | SEROUS ENDOMETRIAL ADENOCARCINOMA |
|---|---|---|---|
| ALL | 404 | 22 | 113 |
| DEL PEAK 16(7Q31.1) MUTATED | 12 | 3 | 40 |
| DEL PEAK 16(7Q31.1) WILD-TYPE | 392 | 19 | 73 |
Figure S164. Get High-res Image Gene #66: 'del_7q31.1' versus Clinical Feature #3: 'HISTOLOGICAL_TYPE'

P value = 0.145 (Fisher's exact test), Q value = 0.23
Table S165. Gene #66: 'del_7q31.1' versus Clinical Feature #4: 'RESIDUAL_TUMOR'
| nPatients | R0 | R1 | R2 | RX |
|---|---|---|---|---|
| ALL | 371 | 22 | 16 | 40 |
| DEL PEAK 16(7Q31.1) MUTATED | 37 | 2 | 3 | 8 |
| DEL PEAK 16(7Q31.1) WILD-TYPE | 334 | 20 | 13 | 32 |
Figure S165. Get High-res Image Gene #66: 'del_7q31.1' versus Clinical Feature #4: 'RESIDUAL_TUMOR'

P value = 0.00254 (logrank test), Q value = 0.0065
Table S166. Gene #67: 'del_7q36.1' versus Clinical Feature #1: 'Time to Death'
| nPatients | nDeath | Duration Range (Median), Month | |
|---|---|---|---|
| ALL | 537 | 90 | 0.1 - 225.5 (29.9) |
| DEL PEAK 17(7Q36.1) MUTATED | 63 | 21 | 1.8 - 125.4 (32.0) |
| DEL PEAK 17(7Q36.1) WILD-TYPE | 474 | 69 | 0.1 - 225.5 (29.7) |
Figure S166. Get High-res Image Gene #67: 'del_7q36.1' versus Clinical Feature #1: 'Time to Death'

P value = 1e-05 (Fisher's exact test), Q value = 4e-05
Table S167. Gene #67: 'del_7q36.1' versus Clinical Feature #3: 'HISTOLOGICAL_TYPE'
| nPatients | ENDOMETRIOID ENDOMETRIAL ADENOCARCINOMA | MIXED SEROUS AND ENDOMETRIOID | SEROUS ENDOMETRIAL ADENOCARCINOMA |
|---|---|---|---|
| ALL | 404 | 22 | 113 |
| DEL PEAK 17(7Q36.1) MUTATED | 13 | 4 | 46 |
| DEL PEAK 17(7Q36.1) WILD-TYPE | 391 | 18 | 67 |
Figure S167. Get High-res Image Gene #67: 'del_7q36.1' versus Clinical Feature #3: 'HISTOLOGICAL_TYPE'

P value = 1.25e-05 (logrank test), Q value = 5e-05
Table S168. Gene #68: 'del_8p23.2' versus Clinical Feature #1: 'Time to Death'
| nPatients | nDeath | Duration Range (Median), Month | |
|---|---|---|---|
| ALL | 537 | 90 | 0.1 - 225.5 (29.9) |
| DEL PEAK 18(8P23.2) MUTATED | 117 | 35 | 0.3 - 225.5 (27.4) |
| DEL PEAK 18(8P23.2) WILD-TYPE | 420 | 55 | 0.1 - 185.8 (30.7) |
Figure S168. Get High-res Image Gene #68: 'del_8p23.2' versus Clinical Feature #1: 'Time to Death'
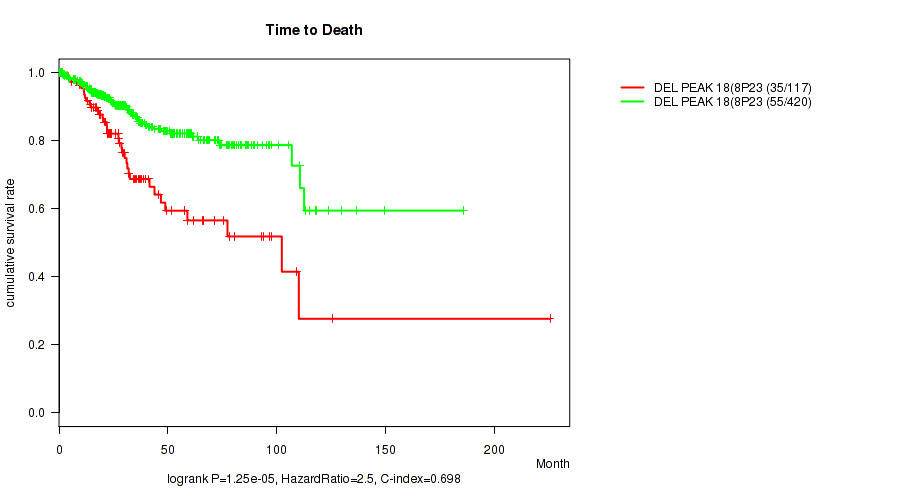
P value = 1e-05 (Fisher's exact test), Q value = 4e-05
Table S169. Gene #68: 'del_8p23.2' versus Clinical Feature #3: 'HISTOLOGICAL_TYPE'
| nPatients | ENDOMETRIOID ENDOMETRIAL ADENOCARCINOMA | MIXED SEROUS AND ENDOMETRIOID | SEROUS ENDOMETRIAL ADENOCARCINOMA |
|---|---|---|---|
| ALL | 404 | 22 | 113 |
| DEL PEAK 18(8P23.2) MUTATED | 36 | 6 | 77 |
| DEL PEAK 18(8P23.2) WILD-TYPE | 368 | 16 | 36 |
Figure S169. Get High-res Image Gene #68: 'del_8p23.2' versus Clinical Feature #3: 'HISTOLOGICAL_TYPE'

P value = 0.0316 (Fisher's exact test), Q value = 0.064
Table S170. Gene #68: 'del_8p23.2' versus Clinical Feature #4: 'RESIDUAL_TUMOR'
| nPatients | R0 | R1 | R2 | RX |
|---|---|---|---|---|
| ALL | 371 | 22 | 16 | 40 |
| DEL PEAK 18(8P23.2) MUTATED | 71 | 5 | 7 | 13 |
| DEL PEAK 18(8P23.2) WILD-TYPE | 300 | 17 | 9 | 27 |
Figure S170. Get High-res Image Gene #68: 'del_8p23.2' versus Clinical Feature #4: 'RESIDUAL_TUMOR'
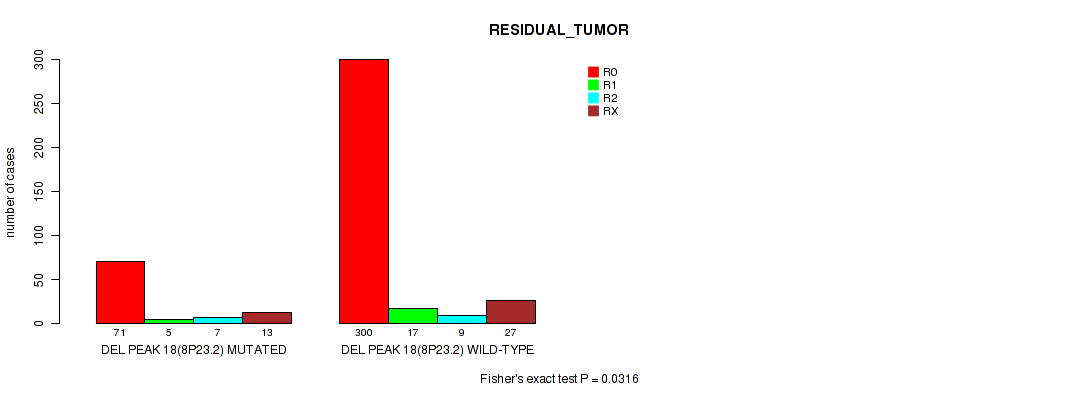
P value = 0.000314 (logrank test), Q value = 0.00094
Table S171. Gene #69: 'del_8p21.2' versus Clinical Feature #1: 'Time to Death'
| nPatients | nDeath | Duration Range (Median), Month | |
|---|---|---|---|
| ALL | 537 | 90 | 0.1 - 225.5 (29.9) |
| DEL PEAK 19(8P21.2) MUTATED | 116 | 33 | 0.3 - 225.5 (27.6) |
| DEL PEAK 19(8P21.2) WILD-TYPE | 421 | 57 | 0.1 - 185.8 (30.7) |
Figure S171. Get High-res Image Gene #69: 'del_8p21.2' versus Clinical Feature #1: 'Time to Death'
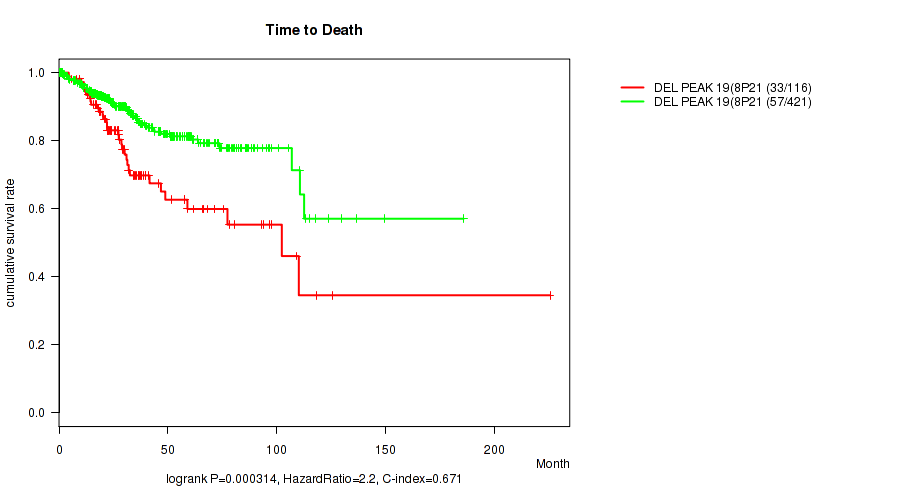
P value = 1e-05 (Fisher's exact test), Q value = 4e-05
Table S172. Gene #69: 'del_8p21.2' versus Clinical Feature #3: 'HISTOLOGICAL_TYPE'
| nPatients | ENDOMETRIOID ENDOMETRIAL ADENOCARCINOMA | MIXED SEROUS AND ENDOMETRIOID | SEROUS ENDOMETRIAL ADENOCARCINOMA |
|---|---|---|---|
| ALL | 404 | 22 | 113 |
| DEL PEAK 19(8P21.2) MUTATED | 28 | 7 | 82 |
| DEL PEAK 19(8P21.2) WILD-TYPE | 376 | 15 | 31 |
Figure S172. Get High-res Image Gene #69: 'del_8p21.2' versus Clinical Feature #3: 'HISTOLOGICAL_TYPE'
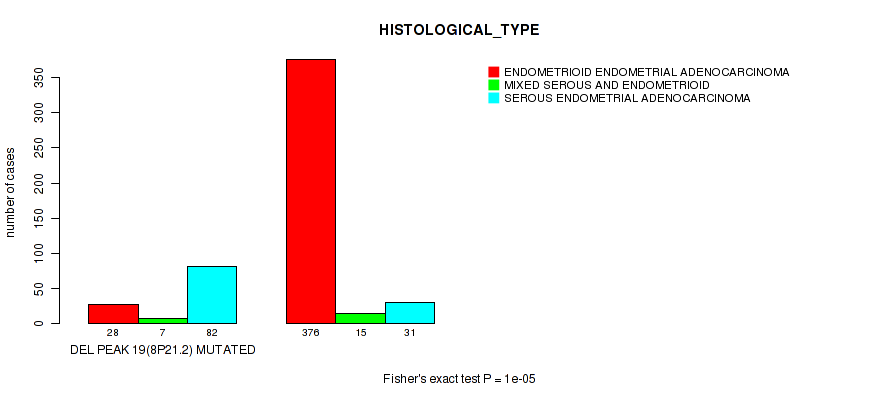
P value = 0.0867 (Fisher's exact test), Q value = 0.16
Table S173. Gene #69: 'del_8p21.2' versus Clinical Feature #4: 'RESIDUAL_TUMOR'
| nPatients | R0 | R1 | R2 | RX |
|---|---|---|---|---|
| ALL | 371 | 22 | 16 | 40 |
| DEL PEAK 19(8P21.2) MUTATED | 72 | 5 | 7 | 11 |
| DEL PEAK 19(8P21.2) WILD-TYPE | 299 | 17 | 9 | 29 |
Figure S173. Get High-res Image Gene #69: 'del_8p21.2' versus Clinical Feature #4: 'RESIDUAL_TUMOR'

P value = 0.000841 (logrank test), Q value = 0.0023
Table S174. Gene #70: 'del_9p23' versus Clinical Feature #1: 'Time to Death'
| nPatients | nDeath | Duration Range (Median), Month | |
|---|---|---|---|
| ALL | 537 | 90 | 0.1 - 225.5 (29.9) |
| DEL PEAK 20(9P23) MUTATED | 80 | 24 | 0.3 - 149.6 (27.0) |
| DEL PEAK 20(9P23) WILD-TYPE | 457 | 66 | 0.1 - 225.5 (30.1) |
Figure S174. Get High-res Image Gene #70: 'del_9p23' versus Clinical Feature #1: 'Time to Death'

P value = 1e-05 (Fisher's exact test), Q value = 4e-05
Table S175. Gene #70: 'del_9p23' versus Clinical Feature #3: 'HISTOLOGICAL_TYPE'
| nPatients | ENDOMETRIOID ENDOMETRIAL ADENOCARCINOMA | MIXED SEROUS AND ENDOMETRIOID | SEROUS ENDOMETRIAL ADENOCARCINOMA |
|---|---|---|---|
| ALL | 404 | 22 | 113 |
| DEL PEAK 20(9P23) MUTATED | 30 | 4 | 46 |
| DEL PEAK 20(9P23) WILD-TYPE | 374 | 18 | 67 |
Figure S175. Get High-res Image Gene #70: 'del_9p23' versus Clinical Feature #3: 'HISTOLOGICAL_TYPE'

P value = 5.69e-06 (logrank test), Q value = 4e-05
Table S176. Gene #71: 'del_9q21.2' versus Clinical Feature #1: 'Time to Death'
| nPatients | nDeath | Duration Range (Median), Month | |
|---|---|---|---|
| ALL | 537 | 90 | 0.1 - 225.5 (29.9) |
| DEL PEAK 21(9Q21.2) MUTATED | 129 | 39 | 0.1 - 136.6 (27.2) |
| DEL PEAK 21(9Q21.2) WILD-TYPE | 408 | 51 | 0.1 - 225.5 (30.7) |
Figure S176. Get High-res Image Gene #71: 'del_9q21.2' versus Clinical Feature #1: 'Time to Death'

P value = 1e-05 (Fisher's exact test), Q value = 4e-05
Table S177. Gene #71: 'del_9q21.2' versus Clinical Feature #3: 'HISTOLOGICAL_TYPE'
| nPatients | ENDOMETRIOID ENDOMETRIAL ADENOCARCINOMA | MIXED SEROUS AND ENDOMETRIOID | SEROUS ENDOMETRIAL ADENOCARCINOMA |
|---|---|---|---|
| ALL | 404 | 22 | 113 |
| DEL PEAK 21(9Q21.2) MUTATED | 51 | 10 | 68 |
| DEL PEAK 21(9Q21.2) WILD-TYPE | 353 | 12 | 45 |
Figure S177. Get High-res Image Gene #71: 'del_9q21.2' versus Clinical Feature #3: 'HISTOLOGICAL_TYPE'

P value = 0.102 (Fisher's exact test), Q value = 0.18
Table S178. Gene #71: 'del_9q21.2' versus Clinical Feature #4: 'RESIDUAL_TUMOR'
| nPatients | R0 | R1 | R2 | RX |
|---|---|---|---|---|
| ALL | 371 | 22 | 16 | 40 |
| DEL PEAK 21(9Q21.2) MUTATED | 80 | 5 | 7 | 13 |
| DEL PEAK 21(9Q21.2) WILD-TYPE | 291 | 17 | 9 | 27 |
Figure S178. Get High-res Image Gene #71: 'del_9q21.2' versus Clinical Feature #4: 'RESIDUAL_TUMOR'
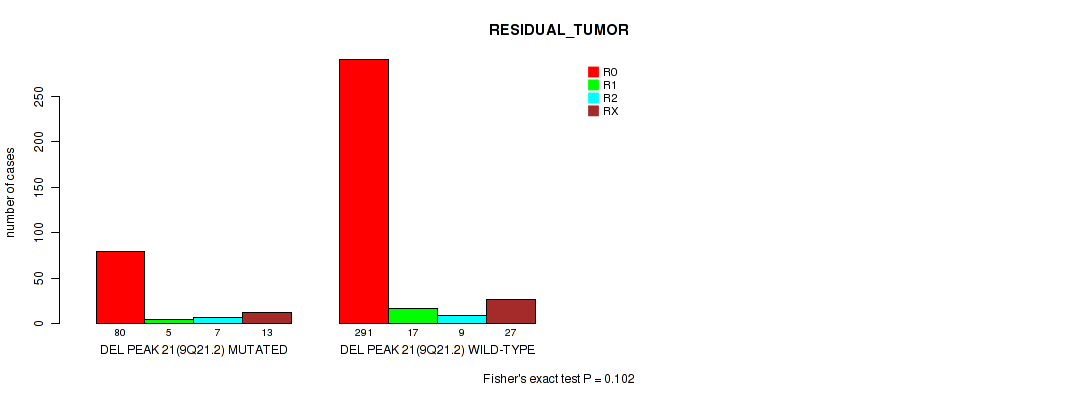
P value = 3.37e-05 (logrank test), Q value = 0.00012
Table S179. Gene #72: 'del_9q34.2' versus Clinical Feature #1: 'Time to Death'
| nPatients | nDeath | Duration Range (Median), Month | |
|---|---|---|---|
| ALL | 537 | 90 | 0.1 - 225.5 (29.9) |
| DEL PEAK 22(9Q34.2) MUTATED | 131 | 39 | 0.2 - 136.6 (28.6) |
| DEL PEAK 22(9Q34.2) WILD-TYPE | 406 | 51 | 0.1 - 225.5 (30.1) |
Figure S179. Get High-res Image Gene #72: 'del_9q34.2' versus Clinical Feature #1: 'Time to Death'

P value = 1e-05 (Fisher's exact test), Q value = 4e-05
Table S180. Gene #72: 'del_9q34.2' versus Clinical Feature #3: 'HISTOLOGICAL_TYPE'
| nPatients | ENDOMETRIOID ENDOMETRIAL ADENOCARCINOMA | MIXED SEROUS AND ENDOMETRIOID | SEROUS ENDOMETRIAL ADENOCARCINOMA |
|---|---|---|---|
| ALL | 404 | 22 | 113 |
| DEL PEAK 22(9Q34.2) MUTATED | 55 | 10 | 67 |
| DEL PEAK 22(9Q34.2) WILD-TYPE | 349 | 12 | 46 |
Figure S180. Get High-res Image Gene #72: 'del_9q34.2' versus Clinical Feature #3: 'HISTOLOGICAL_TYPE'
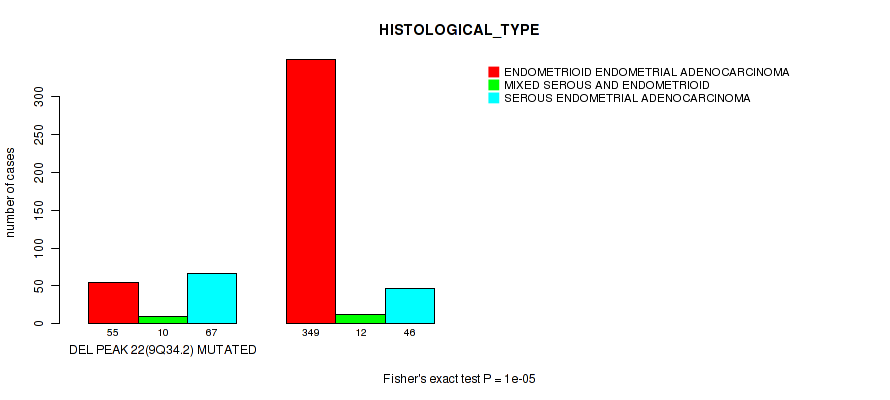
P value = 0.0712 (Fisher's exact test), Q value = 0.13
Table S181. Gene #72: 'del_9q34.2' versus Clinical Feature #4: 'RESIDUAL_TUMOR'
| nPatients | R0 | R1 | R2 | RX |
|---|---|---|---|---|
| ALL | 371 | 22 | 16 | 40 |
| DEL PEAK 22(9Q34.2) MUTATED | 80 | 5 | 6 | 15 |
| DEL PEAK 22(9Q34.2) WILD-TYPE | 291 | 17 | 10 | 25 |
Figure S181. Get High-res Image Gene #72: 'del_9q34.2' versus Clinical Feature #4: 'RESIDUAL_TUMOR'

P value = 1e-05 (Fisher's exact test), Q value = 4e-05
Table S182. Gene #73: 'del_10q21.1' versus Clinical Feature #3: 'HISTOLOGICAL_TYPE'
| nPatients | ENDOMETRIOID ENDOMETRIAL ADENOCARCINOMA | MIXED SEROUS AND ENDOMETRIOID | SEROUS ENDOMETRIAL ADENOCARCINOMA |
|---|---|---|---|
| ALL | 404 | 22 | 113 |
| DEL PEAK 23(10Q21.1) MUTATED | 16 | 4 | 30 |
| DEL PEAK 23(10Q21.1) WILD-TYPE | 388 | 18 | 83 |
Figure S182. Get High-res Image Gene #73: 'del_10q21.1' versus Clinical Feature #3: 'HISTOLOGICAL_TYPE'

P value = 0.000184 (logrank test), Q value = 0.00058
Table S183. Gene #74: 'del_10q23.31' versus Clinical Feature #1: 'Time to Death'
| nPatients | nDeath | Duration Range (Median), Month | |
|---|---|---|---|
| ALL | 537 | 90 | 0.1 - 225.5 (29.9) |
| DEL PEAK 24(10Q23.31) MUTATED | 77 | 23 | 0.3 - 125.4 (23.9) |
| DEL PEAK 24(10Q23.31) WILD-TYPE | 460 | 67 | 0.1 - 225.5 (31.1) |
Figure S183. Get High-res Image Gene #74: 'del_10q23.31' versus Clinical Feature #1: 'Time to Death'
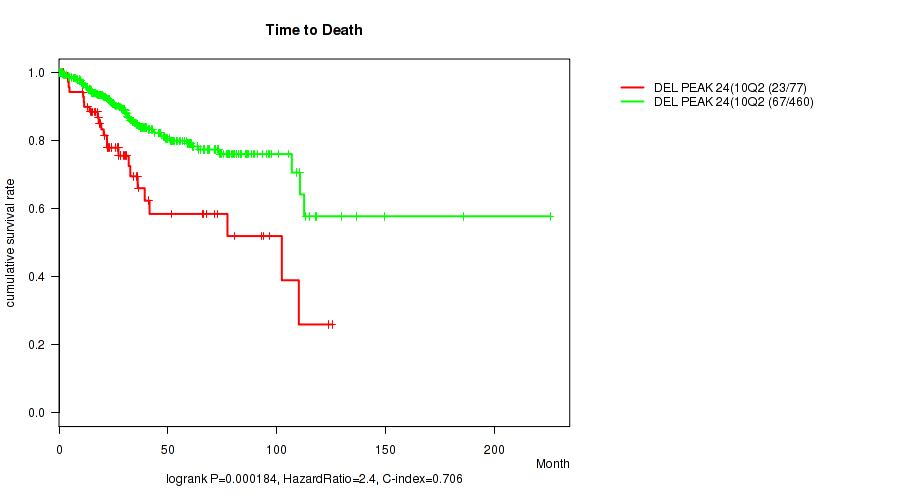
P value = 1e-05 (Fisher's exact test), Q value = 4e-05
Table S184. Gene #74: 'del_10q23.31' versus Clinical Feature #3: 'HISTOLOGICAL_TYPE'
| nPatients | ENDOMETRIOID ENDOMETRIAL ADENOCARCINOMA | MIXED SEROUS AND ENDOMETRIOID | SEROUS ENDOMETRIAL ADENOCARCINOMA |
|---|---|---|---|
| ALL | 404 | 22 | 113 |
| DEL PEAK 24(10Q23.31) MUTATED | 32 | 6 | 40 |
| DEL PEAK 24(10Q23.31) WILD-TYPE | 372 | 16 | 73 |
Figure S184. Get High-res Image Gene #74: 'del_10q23.31' versus Clinical Feature #3: 'HISTOLOGICAL_TYPE'

P value = 0.121 (Fisher's exact test), Q value = 0.2
Table S185. Gene #74: 'del_10q23.31' versus Clinical Feature #4: 'RESIDUAL_TUMOR'
| nPatients | R0 | R1 | R2 | RX |
|---|---|---|---|---|
| ALL | 371 | 22 | 16 | 40 |
| DEL PEAK 24(10Q23.31) MUTATED | 48 | 2 | 5 | 8 |
| DEL PEAK 24(10Q23.31) WILD-TYPE | 323 | 20 | 11 | 32 |
Figure S185. Get High-res Image Gene #74: 'del_10q23.31' versus Clinical Feature #4: 'RESIDUAL_TUMOR'
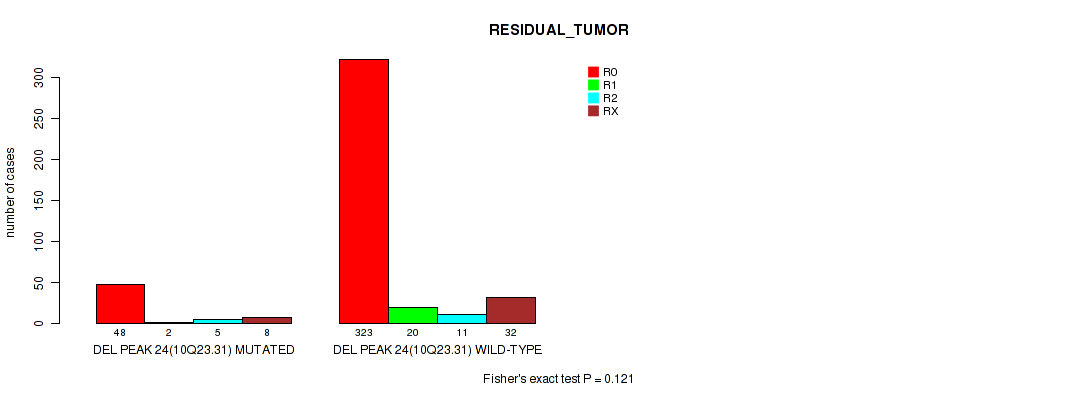
P value = 0.000665 (logrank test), Q value = 0.0019
Table S186. Gene #75: 'del_11p15.5' versus Clinical Feature #1: 'Time to Death'
| nPatients | nDeath | Duration Range (Median), Month | |
|---|---|---|---|
| ALL | 537 | 90 | 0.1 - 225.5 (29.9) |
| DEL PEAK 25(11P15.5) MUTATED | 103 | 29 | 0.1 - 149.6 (28.1) |
| DEL PEAK 25(11P15.5) WILD-TYPE | 434 | 61 | 0.1 - 225.5 (30.1) |
Figure S186. Get High-res Image Gene #75: 'del_11p15.5' versus Clinical Feature #1: 'Time to Death'
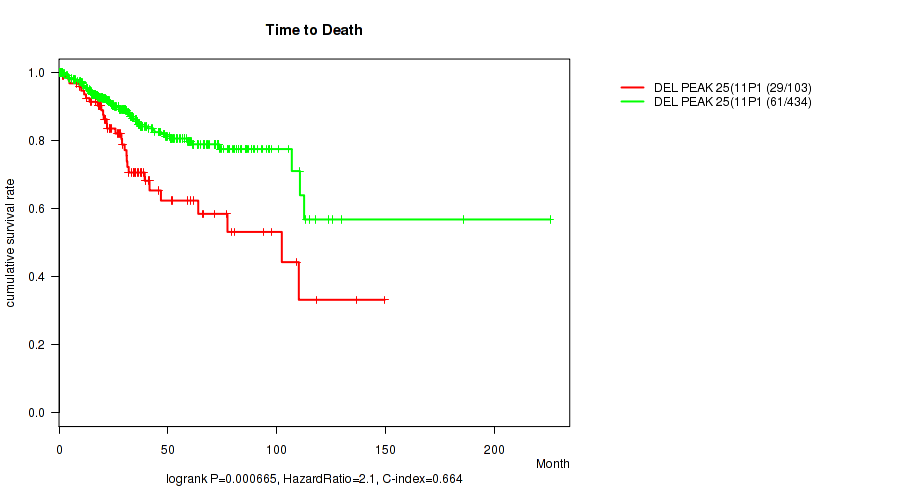
P value = 1e-05 (Fisher's exact test), Q value = 4e-05
Table S187. Gene #75: 'del_11p15.5' versus Clinical Feature #3: 'HISTOLOGICAL_TYPE'
| nPatients | ENDOMETRIOID ENDOMETRIAL ADENOCARCINOMA | MIXED SEROUS AND ENDOMETRIOID | SEROUS ENDOMETRIAL ADENOCARCINOMA |
|---|---|---|---|
| ALL | 404 | 22 | 113 |
| DEL PEAK 25(11P15.5) MUTATED | 40 | 6 | 58 |
| DEL PEAK 25(11P15.5) WILD-TYPE | 364 | 16 | 55 |
Figure S187. Get High-res Image Gene #75: 'del_11p15.5' versus Clinical Feature #3: 'HISTOLOGICAL_TYPE'

P value = 0.0269 (Fisher's exact test), Q value = 0.056
Table S188. Gene #75: 'del_11p15.5' versus Clinical Feature #4: 'RESIDUAL_TUMOR'
| nPatients | R0 | R1 | R2 | RX |
|---|---|---|---|---|
| ALL | 371 | 22 | 16 | 40 |
| DEL PEAK 25(11P15.5) MUTATED | 63 | 3 | 7 | 11 |
| DEL PEAK 25(11P15.5) WILD-TYPE | 308 | 19 | 9 | 29 |
Figure S188. Get High-res Image Gene #75: 'del_11p15.5' versus Clinical Feature #4: 'RESIDUAL_TUMOR'

P value = 0.00663 (logrank test), Q value = 0.016
Table S189. Gene #76: 'del_11q14.1' versus Clinical Feature #1: 'Time to Death'
| nPatients | nDeath | Duration Range (Median), Month | |
|---|---|---|---|
| ALL | 537 | 90 | 0.1 - 225.5 (29.9) |
| DEL PEAK 26(11Q14.1) MUTATED | 69 | 18 | 0.3 - 136.6 (23.9) |
| DEL PEAK 26(11Q14.1) WILD-TYPE | 468 | 72 | 0.1 - 225.5 (30.7) |
Figure S189. Get High-res Image Gene #76: 'del_11q14.1' versus Clinical Feature #1: 'Time to Death'

P value = 1e-05 (Fisher's exact test), Q value = 4e-05
Table S190. Gene #76: 'del_11q14.1' versus Clinical Feature #3: 'HISTOLOGICAL_TYPE'
| nPatients | ENDOMETRIOID ENDOMETRIAL ADENOCARCINOMA | MIXED SEROUS AND ENDOMETRIOID | SEROUS ENDOMETRIAL ADENOCARCINOMA |
|---|---|---|---|
| ALL | 404 | 22 | 113 |
| DEL PEAK 26(11Q14.1) MUTATED | 21 | 6 | 42 |
| DEL PEAK 26(11Q14.1) WILD-TYPE | 383 | 16 | 71 |
Figure S190. Get High-res Image Gene #76: 'del_11q14.1' versus Clinical Feature #3: 'HISTOLOGICAL_TYPE'

P value = 0.000197 (logrank test), Q value = 0.00062
Table S191. Gene #77: 'del_11q25' versus Clinical Feature #1: 'Time to Death'
| nPatients | nDeath | Duration Range (Median), Month | |
|---|---|---|---|
| ALL | 537 | 90 | 0.1 - 225.5 (29.9) |
| DEL PEAK 27(11Q25) MUTATED | 94 | 26 | 0.3 - 136.6 (24.0) |
| DEL PEAK 27(11Q25) WILD-TYPE | 443 | 64 | 0.1 - 225.5 (30.7) |
Figure S191. Get High-res Image Gene #77: 'del_11q25' versus Clinical Feature #1: 'Time to Death'

P value = 1e-05 (Fisher's exact test), Q value = 4e-05
Table S192. Gene #77: 'del_11q25' versus Clinical Feature #3: 'HISTOLOGICAL_TYPE'
| nPatients | ENDOMETRIOID ENDOMETRIAL ADENOCARCINOMA | MIXED SEROUS AND ENDOMETRIOID | SEROUS ENDOMETRIAL ADENOCARCINOMA |
|---|---|---|---|
| ALL | 404 | 22 | 113 |
| DEL PEAK 27(11Q25) MUTATED | 33 | 6 | 55 |
| DEL PEAK 27(11Q25) WILD-TYPE | 371 | 16 | 58 |
Figure S192. Get High-res Image Gene #77: 'del_11q25' versus Clinical Feature #3: 'HISTOLOGICAL_TYPE'

P value = 6.25e-05 (logrank test), Q value = 0.00022
Table S193. Gene #78: 'del_12q23.1' versus Clinical Feature #1: 'Time to Death'
| nPatients | nDeath | Duration Range (Median), Month | |
|---|---|---|---|
| ALL | 537 | 90 | 0.1 - 225.5 (29.9) |
| DEL PEAK 28(12Q23.1) MUTATED | 56 | 19 | 0.6 - 118.2 (23.9) |
| DEL PEAK 28(12Q23.1) WILD-TYPE | 481 | 71 | 0.1 - 225.5 (30.7) |
Figure S193. Get High-res Image Gene #78: 'del_12q23.1' versus Clinical Feature #1: 'Time to Death'
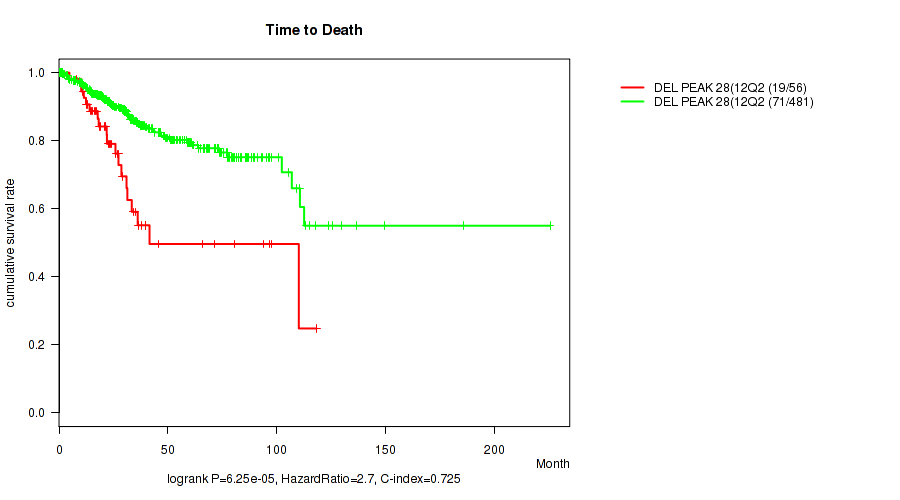
P value = 1e-05 (Fisher's exact test), Q value = 4e-05
Table S194. Gene #78: 'del_12q23.1' versus Clinical Feature #3: 'HISTOLOGICAL_TYPE'
| nPatients | ENDOMETRIOID ENDOMETRIAL ADENOCARCINOMA | MIXED SEROUS AND ENDOMETRIOID | SEROUS ENDOMETRIAL ADENOCARCINOMA |
|---|---|---|---|
| ALL | 404 | 22 | 113 |
| DEL PEAK 28(12Q23.1) MUTATED | 14 | 3 | 39 |
| DEL PEAK 28(12Q23.1) WILD-TYPE | 390 | 19 | 74 |
Figure S194. Get High-res Image Gene #78: 'del_12q23.1' versus Clinical Feature #3: 'HISTOLOGICAL_TYPE'

P value = 0.0125 (Fisher's exact test), Q value = 0.028
Table S195. Gene #78: 'del_12q23.1' versus Clinical Feature #4: 'RESIDUAL_TUMOR'
| nPatients | R0 | R1 | R2 | RX |
|---|---|---|---|---|
| ALL | 371 | 22 | 16 | 40 |
| DEL PEAK 28(12Q23.1) MUTATED | 34 | 1 | 4 | 9 |
| DEL PEAK 28(12Q23.1) WILD-TYPE | 337 | 21 | 12 | 31 |
Figure S195. Get High-res Image Gene #78: 'del_12q23.1' versus Clinical Feature #4: 'RESIDUAL_TUMOR'

P value = 0.00307 (logrank test), Q value = 0.0077
Table S196. Gene #79: 'del_12q24.33' versus Clinical Feature #1: 'Time to Death'
| nPatients | nDeath | Duration Range (Median), Month | |
|---|---|---|---|
| ALL | 537 | 90 | 0.1 - 225.5 (29.9) |
| DEL PEAK 29(12Q24.33) MUTATED | 66 | 18 | 0.1 - 118.2 (25.0) |
| DEL PEAK 29(12Q24.33) WILD-TYPE | 471 | 72 | 0.1 - 225.5 (30.7) |
Figure S196. Get High-res Image Gene #79: 'del_12q24.33' versus Clinical Feature #1: 'Time to Death'
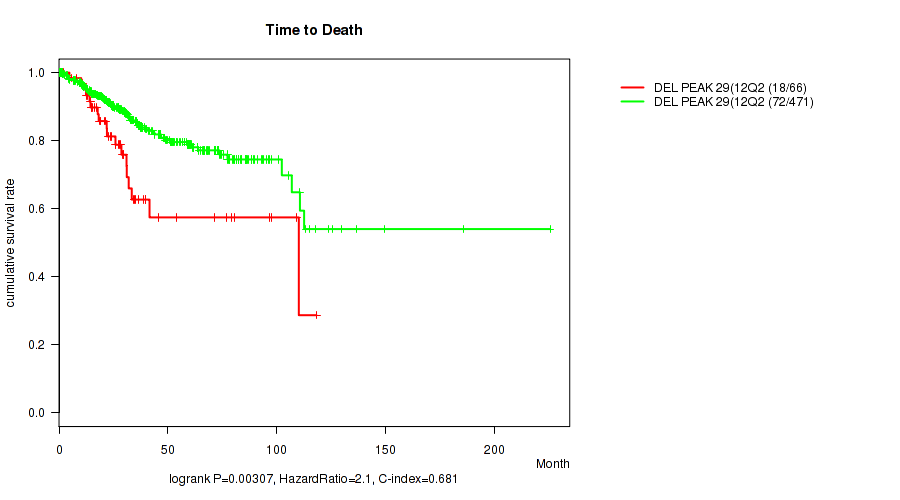
P value = 1e-05 (Fisher's exact test), Q value = 4e-05
Table S197. Gene #79: 'del_12q24.33' versus Clinical Feature #3: 'HISTOLOGICAL_TYPE'
| nPatients | ENDOMETRIOID ENDOMETRIAL ADENOCARCINOMA | MIXED SEROUS AND ENDOMETRIOID | SEROUS ENDOMETRIAL ADENOCARCINOMA |
|---|---|---|---|
| ALL | 404 | 22 | 113 |
| DEL PEAK 29(12Q24.33) MUTATED | 20 | 2 | 44 |
| DEL PEAK 29(12Q24.33) WILD-TYPE | 384 | 20 | 69 |
Figure S197. Get High-res Image Gene #79: 'del_12q24.33' versus Clinical Feature #3: 'HISTOLOGICAL_TYPE'

P value = 0.00903 (Fisher's exact test), Q value = 0.021
Table S198. Gene #79: 'del_12q24.33' versus Clinical Feature #4: 'RESIDUAL_TUMOR'
| nPatients | R0 | R1 | R2 | RX |
|---|---|---|---|---|
| ALL | 371 | 22 | 16 | 40 |
| DEL PEAK 29(12Q24.33) MUTATED | 40 | 2 | 5 | 10 |
| DEL PEAK 29(12Q24.33) WILD-TYPE | 331 | 20 | 11 | 30 |
Figure S198. Get High-res Image Gene #79: 'del_12q24.33' versus Clinical Feature #4: 'RESIDUAL_TUMOR'
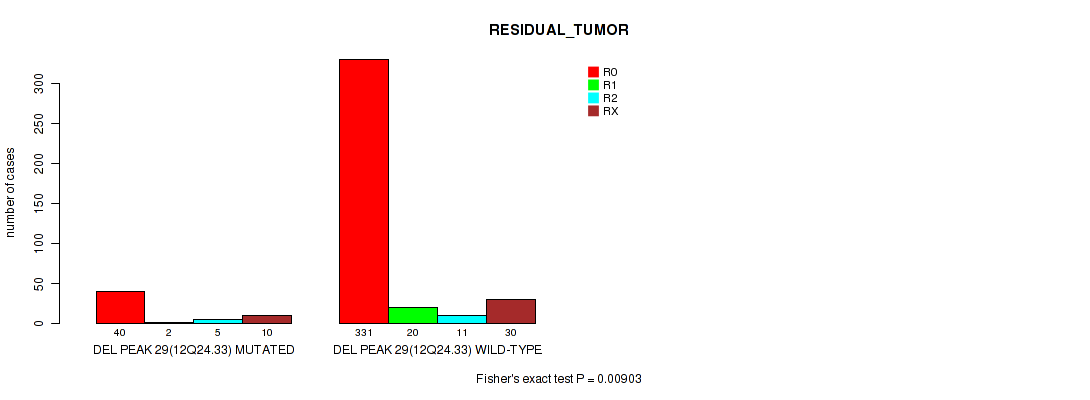
P value = 0.00144 (logrank test), Q value = 0.0039
Table S199. Gene #80: 'del_13q11' versus Clinical Feature #1: 'Time to Death'
| nPatients | nDeath | Duration Range (Median), Month | |
|---|---|---|---|
| ALL | 537 | 90 | 0.1 - 225.5 (29.9) |
| DEL PEAK 30(13Q11) MUTATED | 97 | 27 | 0.1 - 149.6 (26.4) |
| DEL PEAK 30(13Q11) WILD-TYPE | 440 | 63 | 0.1 - 225.5 (30.6) |
Figure S199. Get High-res Image Gene #80: 'del_13q11' versus Clinical Feature #1: 'Time to Death'

P value = 1e-05 (Fisher's exact test), Q value = 4e-05
Table S200. Gene #80: 'del_13q11' versus Clinical Feature #3: 'HISTOLOGICAL_TYPE'
| nPatients | ENDOMETRIOID ENDOMETRIAL ADENOCARCINOMA | MIXED SEROUS AND ENDOMETRIOID | SEROUS ENDOMETRIAL ADENOCARCINOMA |
|---|---|---|---|
| ALL | 404 | 22 | 113 |
| DEL PEAK 30(13Q11) MUTATED | 41 | 6 | 51 |
| DEL PEAK 30(13Q11) WILD-TYPE | 363 | 16 | 62 |
Figure S200. Get High-res Image Gene #80: 'del_13q11' versus Clinical Feature #3: 'HISTOLOGICAL_TYPE'
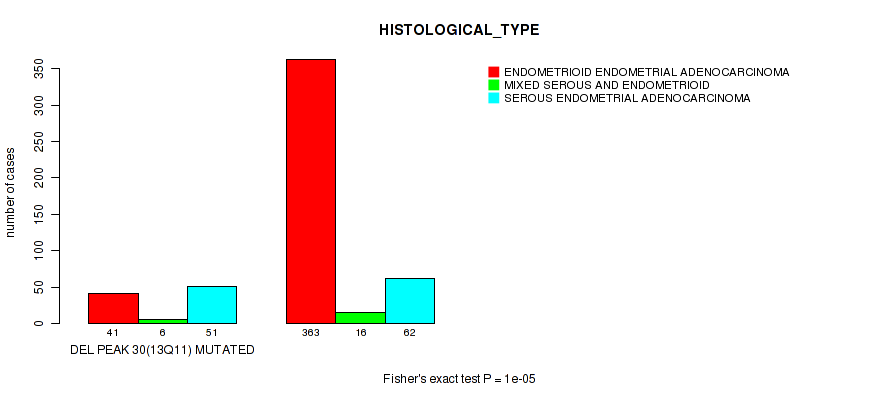
P value = 0.00016 (logrank test), Q value = 0.00051
Table S201. Gene #81: 'del_13q14.2' versus Clinical Feature #1: 'Time to Death'
| nPatients | nDeath | Duration Range (Median), Month | |
|---|---|---|---|
| ALL | 537 | 90 | 0.1 - 225.5 (29.9) |
| DEL PEAK 31(13Q14.2) MUTATED | 105 | 29 | 0.1 - 149.6 (25.9) |
| DEL PEAK 31(13Q14.2) WILD-TYPE | 432 | 61 | 0.1 - 225.5 (31.1) |
Figure S201. Get High-res Image Gene #81: 'del_13q14.2' versus Clinical Feature #1: 'Time to Death'

P value = 1e-05 (Fisher's exact test), Q value = 4e-05
Table S202. Gene #81: 'del_13q14.2' versus Clinical Feature #3: 'HISTOLOGICAL_TYPE'
| nPatients | ENDOMETRIOID ENDOMETRIAL ADENOCARCINOMA | MIXED SEROUS AND ENDOMETRIOID | SEROUS ENDOMETRIAL ADENOCARCINOMA |
|---|---|---|---|
| ALL | 404 | 22 | 113 |
| DEL PEAK 31(13Q14.2) MUTATED | 54 | 7 | 45 |
| DEL PEAK 31(13Q14.2) WILD-TYPE | 350 | 15 | 68 |
Figure S202. Get High-res Image Gene #81: 'del_13q14.2' versus Clinical Feature #3: 'HISTOLOGICAL_TYPE'

P value = 0.00158 (logrank test), Q value = 0.0042
Table S203. Gene #82: 'del_14q13.1' versus Clinical Feature #1: 'Time to Death'
| nPatients | nDeath | Duration Range (Median), Month | |
|---|---|---|---|
| ALL | 537 | 90 | 0.1 - 225.5 (29.9) |
| DEL PEAK 32(14Q13.1) MUTATED | 73 | 19 | 0.1 - 125.4 (22.5) |
| DEL PEAK 32(14Q13.1) WILD-TYPE | 464 | 71 | 0.1 - 225.5 (30.7) |
Figure S203. Get High-res Image Gene #82: 'del_14q13.1' versus Clinical Feature #1: 'Time to Death'
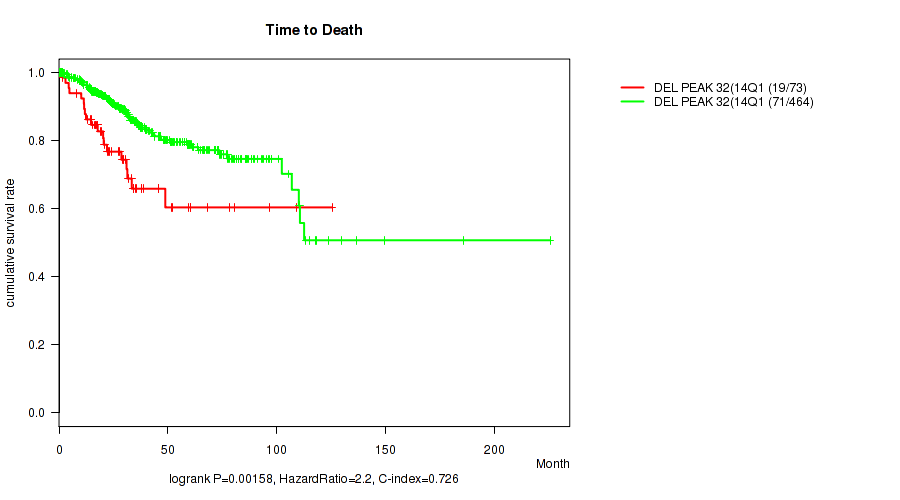
P value = 1e-05 (Fisher's exact test), Q value = 4e-05
Table S204. Gene #82: 'del_14q13.1' versus Clinical Feature #3: 'HISTOLOGICAL_TYPE'
| nPatients | ENDOMETRIOID ENDOMETRIAL ADENOCARCINOMA | MIXED SEROUS AND ENDOMETRIOID | SEROUS ENDOMETRIAL ADENOCARCINOMA |
|---|---|---|---|
| ALL | 404 | 22 | 113 |
| DEL PEAK 32(14Q13.1) MUTATED | 26 | 5 | 42 |
| DEL PEAK 32(14Q13.1) WILD-TYPE | 378 | 17 | 71 |
Figure S204. Get High-res Image Gene #82: 'del_14q13.1' versus Clinical Feature #3: 'HISTOLOGICAL_TYPE'

P value = 7e-05 (logrank test), Q value = 0.00024
Table S205. Gene #83: 'del_15q15.1' versus Clinical Feature #1: 'Time to Death'
| nPatients | nDeath | Duration Range (Median), Month | |
|---|---|---|---|
| ALL | 537 | 90 | 0.1 - 225.5 (29.9) |
| DEL PEAK 33(15Q15.1) MUTATED | 139 | 37 | 0.1 - 136.6 (26.4) |
| DEL PEAK 33(15Q15.1) WILD-TYPE | 398 | 53 | 0.1 - 225.5 (32.0) |
Figure S205. Get High-res Image Gene #83: 'del_15q15.1' versus Clinical Feature #1: 'Time to Death'
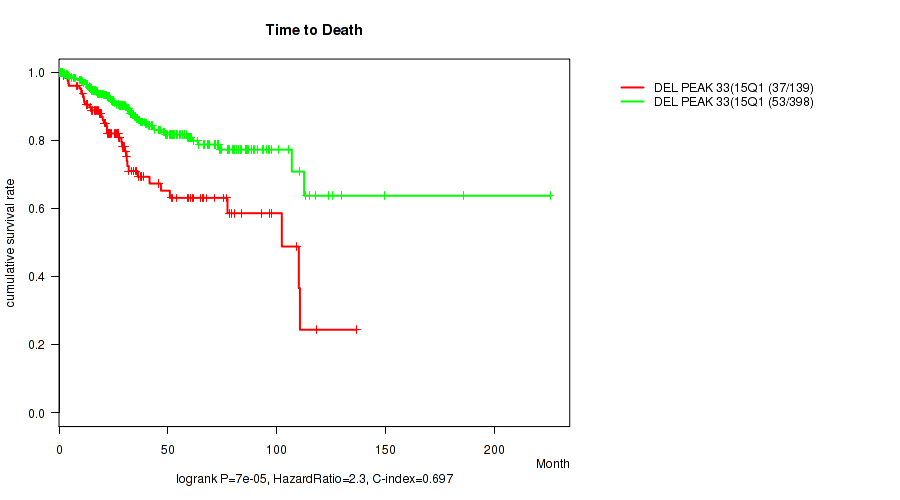
P value = 1e-05 (Fisher's exact test), Q value = 4e-05
Table S206. Gene #83: 'del_15q15.1' versus Clinical Feature #3: 'HISTOLOGICAL_TYPE'
| nPatients | ENDOMETRIOID ENDOMETRIAL ADENOCARCINOMA | MIXED SEROUS AND ENDOMETRIOID | SEROUS ENDOMETRIAL ADENOCARCINOMA |
|---|---|---|---|
| ALL | 404 | 22 | 113 |
| DEL PEAK 33(15Q15.1) MUTATED | 54 | 10 | 76 |
| DEL PEAK 33(15Q15.1) WILD-TYPE | 350 | 12 | 37 |
Figure S206. Get High-res Image Gene #83: 'del_15q15.1' versus Clinical Feature #3: 'HISTOLOGICAL_TYPE'
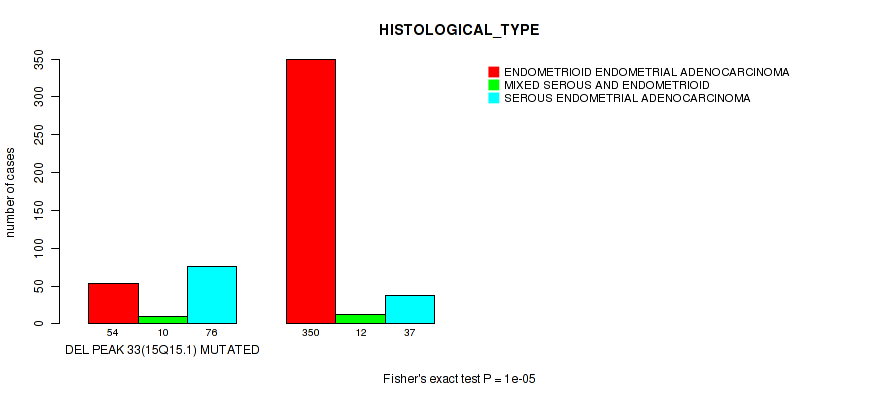
P value = 0.0559 (Fisher's exact test), Q value = 0.11
Table S207. Gene #83: 'del_15q15.1' versus Clinical Feature #4: 'RESIDUAL_TUMOR'
| nPatients | R0 | R1 | R2 | RX |
|---|---|---|---|---|
| ALL | 371 | 22 | 16 | 40 |
| DEL PEAK 33(15Q15.1) MUTATED | 86 | 7 | 7 | 15 |
| DEL PEAK 33(15Q15.1) WILD-TYPE | 285 | 15 | 9 | 25 |
Figure S207. Get High-res Image Gene #83: 'del_15q15.1' versus Clinical Feature #4: 'RESIDUAL_TUMOR'
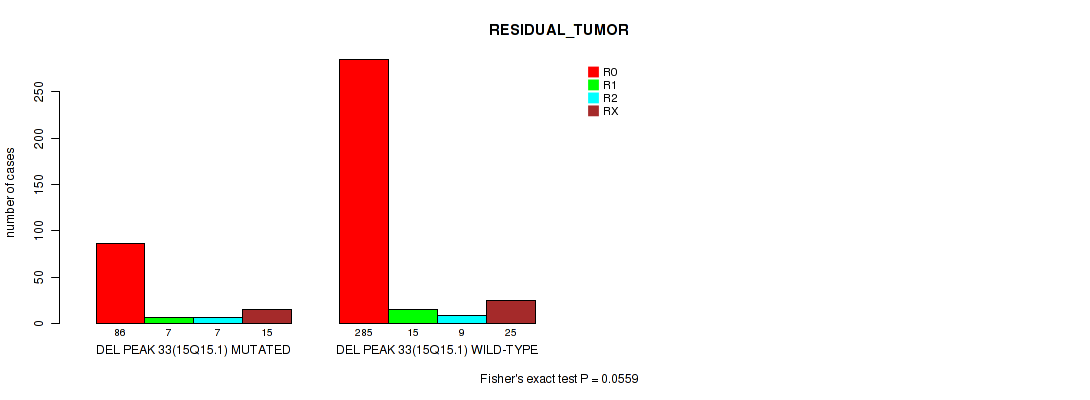
P value = 0.00675 (logrank test), Q value = 0.016
Table S208. Gene #84: 'del_15q23' versus Clinical Feature #1: 'Time to Death'
| nPatients | nDeath | Duration Range (Median), Month | |
|---|---|---|---|
| ALL | 537 | 90 | 0.1 - 225.5 (29.9) |
| DEL PEAK 34(15Q23) MUTATED | 115 | 26 | 0.2 - 136.6 (22.6) |
| DEL PEAK 34(15Q23) WILD-TYPE | 422 | 64 | 0.1 - 225.5 (32.7) |
Figure S208. Get High-res Image Gene #84: 'del_15q23' versus Clinical Feature #1: 'Time to Death'

P value = 1e-05 (Fisher's exact test), Q value = 4e-05
Table S209. Gene #84: 'del_15q23' versus Clinical Feature #3: 'HISTOLOGICAL_TYPE'
| nPatients | ENDOMETRIOID ENDOMETRIAL ADENOCARCINOMA | MIXED SEROUS AND ENDOMETRIOID | SEROUS ENDOMETRIAL ADENOCARCINOMA |
|---|---|---|---|
| ALL | 404 | 22 | 113 |
| DEL PEAK 34(15Q23) MUTATED | 38 | 8 | 69 |
| DEL PEAK 34(15Q23) WILD-TYPE | 366 | 14 | 44 |
Figure S209. Get High-res Image Gene #84: 'del_15q23' versus Clinical Feature #3: 'HISTOLOGICAL_TYPE'
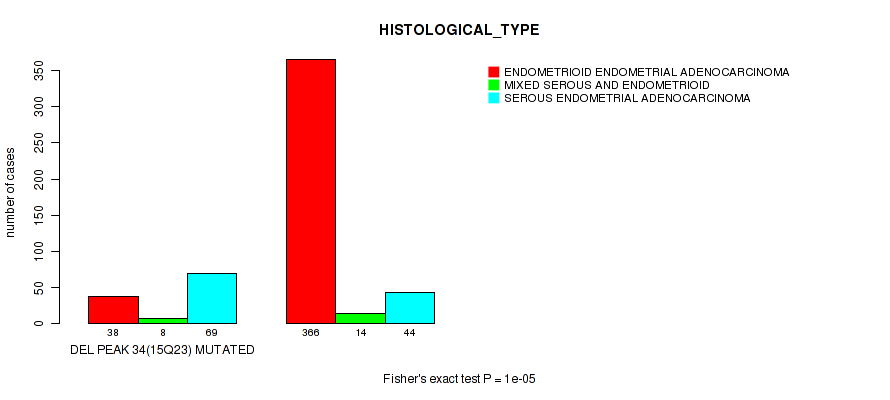
P value = 4.95e-05 (logrank test), Q value = 0.00018
Table S210. Gene #85: 'del_16p13.3' versus Clinical Feature #1: 'Time to Death'
| nPatients | nDeath | Duration Range (Median), Month | |
|---|---|---|---|
| ALL | 537 | 90 | 0.1 - 225.5 (29.9) |
| DEL PEAK 35(16P13.3) MUTATED | 91 | 27 | 0.1 - 125.4 (27.1) |
| DEL PEAK 35(16P13.3) WILD-TYPE | 446 | 63 | 0.1 - 225.5 (30.9) |
Figure S210. Get High-res Image Gene #85: 'del_16p13.3' versus Clinical Feature #1: 'Time to Death'

P value = 1e-05 (Fisher's exact test), Q value = 4e-05
Table S211. Gene #85: 'del_16p13.3' versus Clinical Feature #3: 'HISTOLOGICAL_TYPE'
| nPatients | ENDOMETRIOID ENDOMETRIAL ADENOCARCINOMA | MIXED SEROUS AND ENDOMETRIOID | SEROUS ENDOMETRIAL ADENOCARCINOMA |
|---|---|---|---|
| ALL | 404 | 22 | 113 |
| DEL PEAK 35(16P13.3) MUTATED | 27 | 5 | 60 |
| DEL PEAK 35(16P13.3) WILD-TYPE | 377 | 17 | 53 |
Figure S211. Get High-res Image Gene #85: 'del_16p13.3' versus Clinical Feature #3: 'HISTOLOGICAL_TYPE'

P value = 0.00204 (logrank test), Q value = 0.0053
Table S212. Gene #86: 'del_16q21' versus Clinical Feature #1: 'Time to Death'
| nPatients | nDeath | Duration Range (Median), Month | |
|---|---|---|---|
| ALL | 537 | 90 | 0.1 - 225.5 (29.9) |
| DEL PEAK 36(16Q21) MUTATED | 153 | 37 | 0.1 - 123.7 (27.9) |
| DEL PEAK 36(16Q21) WILD-TYPE | 384 | 53 | 0.1 - 225.5 (31.0) |
Figure S212. Get High-res Image Gene #86: 'del_16q21' versus Clinical Feature #1: 'Time to Death'
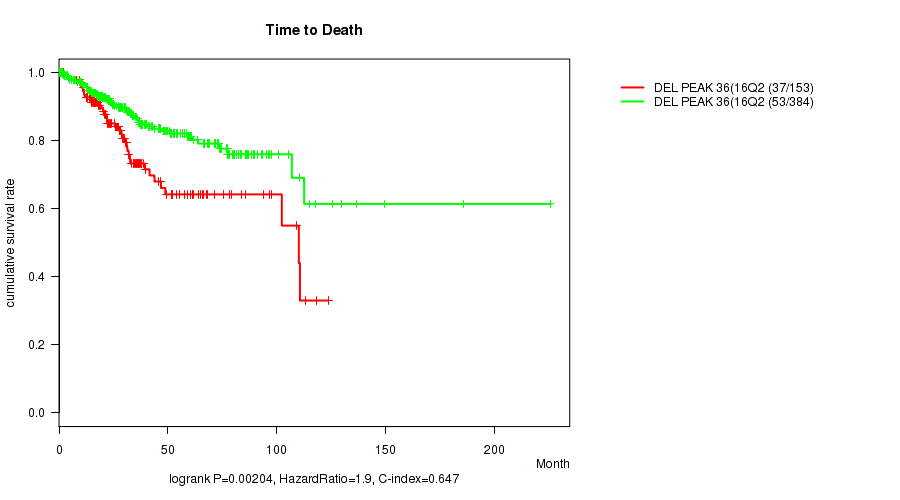
P value = 1e-05 (Fisher's exact test), Q value = 4e-05
Table S213. Gene #86: 'del_16q21' versus Clinical Feature #3: 'HISTOLOGICAL_TYPE'
| nPatients | ENDOMETRIOID ENDOMETRIAL ADENOCARCINOMA | MIXED SEROUS AND ENDOMETRIOID | SEROUS ENDOMETRIAL ADENOCARCINOMA |
|---|---|---|---|
| ALL | 404 | 22 | 113 |
| DEL PEAK 36(16Q21) MUTATED | 65 | 9 | 80 |
| DEL PEAK 36(16Q21) WILD-TYPE | 339 | 13 | 33 |
Figure S213. Get High-res Image Gene #86: 'del_16q21' versus Clinical Feature #3: 'HISTOLOGICAL_TYPE'

P value = 0.0207 (logrank test), Q value = 0.044
Table S214. Gene #87: 'del_16q22.3' versus Clinical Feature #1: 'Time to Death'
| nPatients | nDeath | Duration Range (Median), Month | |
|---|---|---|---|
| ALL | 537 | 90 | 0.1 - 225.5 (29.9) |
| DEL PEAK 37(16Q22.3) MUTATED | 157 | 34 | 0.1 - 123.7 (27.2) |
| DEL PEAK 37(16Q22.3) WILD-TYPE | 380 | 56 | 0.1 - 225.5 (31.1) |
Figure S214. Get High-res Image Gene #87: 'del_16q22.3' versus Clinical Feature #1: 'Time to Death'

P value = 1e-05 (Fisher's exact test), Q value = 4e-05
Table S215. Gene #87: 'del_16q22.3' versus Clinical Feature #3: 'HISTOLOGICAL_TYPE'
| nPatients | ENDOMETRIOID ENDOMETRIAL ADENOCARCINOMA | MIXED SEROUS AND ENDOMETRIOID | SEROUS ENDOMETRIAL ADENOCARCINOMA |
|---|---|---|---|
| ALL | 404 | 22 | 113 |
| DEL PEAK 37(16Q22.3) MUTATED | 69 | 9 | 80 |
| DEL PEAK 37(16Q22.3) WILD-TYPE | 335 | 13 | 33 |
Figure S215. Get High-res Image Gene #87: 'del_16q22.3' versus Clinical Feature #3: 'HISTOLOGICAL_TYPE'
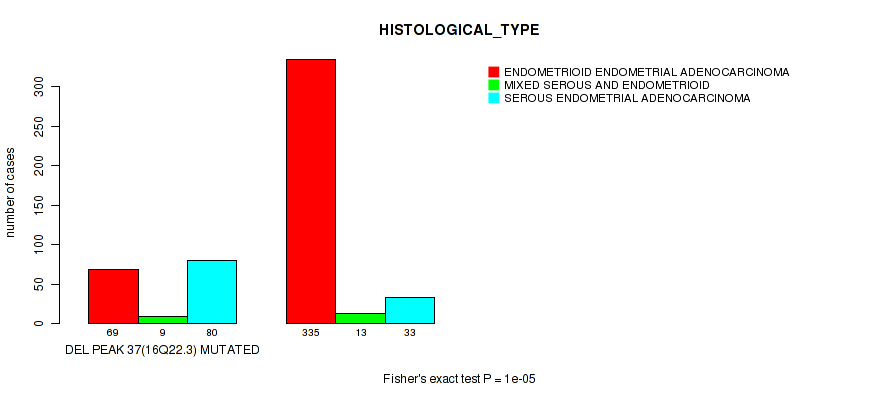
P value = 0.00123 (logrank test), Q value = 0.0033
Table S216. Gene #88: 'del_16q23.1' versus Clinical Feature #1: 'Time to Death'
| nPatients | nDeath | Duration Range (Median), Month | |
|---|---|---|---|
| ALL | 537 | 90 | 0.1 - 225.5 (29.9) |
| DEL PEAK 38(16Q23.1) MUTATED | 165 | 39 | 0.1 - 123.7 (27.3) |
| DEL PEAK 38(16Q23.1) WILD-TYPE | 372 | 51 | 0.1 - 225.5 (31.2) |
Figure S216. Get High-res Image Gene #88: 'del_16q23.1' versus Clinical Feature #1: 'Time to Death'

P value = 1e-05 (Fisher's exact test), Q value = 4e-05
Table S217. Gene #88: 'del_16q23.1' versus Clinical Feature #3: 'HISTOLOGICAL_TYPE'
| nPatients | ENDOMETRIOID ENDOMETRIAL ADENOCARCINOMA | MIXED SEROUS AND ENDOMETRIOID | SEROUS ENDOMETRIAL ADENOCARCINOMA |
|---|---|---|---|
| ALL | 404 | 22 | 113 |
| DEL PEAK 38(16Q23.1) MUTATED | 71 | 8 | 87 |
| DEL PEAK 38(16Q23.1) WILD-TYPE | 333 | 14 | 26 |
Figure S217. Get High-res Image Gene #88: 'del_16q23.1' versus Clinical Feature #3: 'HISTOLOGICAL_TYPE'

P value = 0.0304 (Fisher's exact test), Q value = 0.062
Table S218. Gene #88: 'del_16q23.1' versus Clinical Feature #4: 'RESIDUAL_TUMOR'
| nPatients | R0 | R1 | R2 | RX |
|---|---|---|---|---|
| ALL | 371 | 22 | 16 | 40 |
| DEL PEAK 38(16Q23.1) MUTATED | 105 | 8 | 10 | 14 |
| DEL PEAK 38(16Q23.1) WILD-TYPE | 266 | 14 | 6 | 26 |
Figure S218. Get High-res Image Gene #88: 'del_16q23.1' versus Clinical Feature #4: 'RESIDUAL_TUMOR'
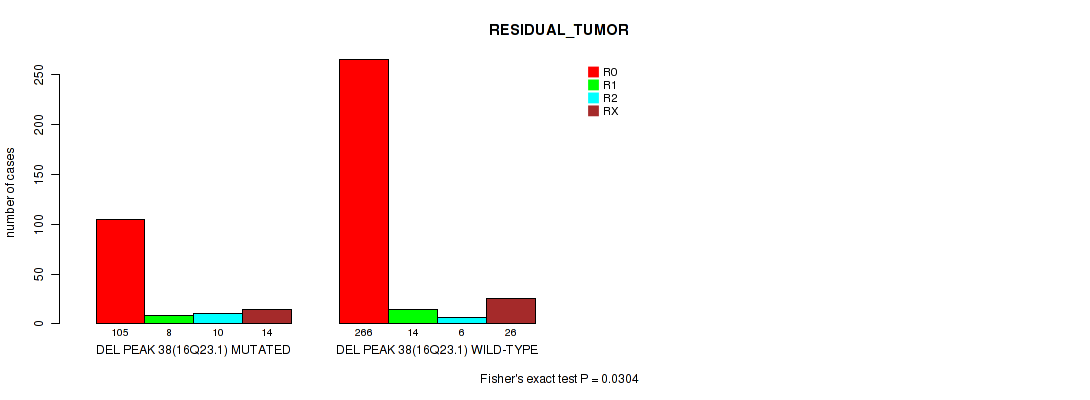
P value = 1.07e-06 (logrank test), Q value = 4e-05
Table S219. Gene #89: 'del_17p13.3' versus Clinical Feature #1: 'Time to Death'
| nPatients | nDeath | Duration Range (Median), Month | |
|---|---|---|---|
| ALL | 537 | 90 | 0.1 - 225.5 (29.9) |
| DEL PEAK 39(17P13.3) MUTATED | 121 | 37 | 0.1 - 136.6 (27.1) |
| DEL PEAK 39(17P13.3) WILD-TYPE | 416 | 53 | 0.1 - 225.5 (30.7) |
Figure S219. Get High-res Image Gene #89: 'del_17p13.3' versus Clinical Feature #1: 'Time to Death'

P value = 1e-05 (Fisher's exact test), Q value = 4e-05
Table S220. Gene #89: 'del_17p13.3' versus Clinical Feature #3: 'HISTOLOGICAL_TYPE'
| nPatients | ENDOMETRIOID ENDOMETRIAL ADENOCARCINOMA | MIXED SEROUS AND ENDOMETRIOID | SEROUS ENDOMETRIAL ADENOCARCINOMA |
|---|---|---|---|
| ALL | 404 | 22 | 113 |
| DEL PEAK 39(17P13.3) MUTATED | 48 | 9 | 65 |
| DEL PEAK 39(17P13.3) WILD-TYPE | 356 | 13 | 48 |
Figure S220. Get High-res Image Gene #89: 'del_17p13.3' versus Clinical Feature #3: 'HISTOLOGICAL_TYPE'
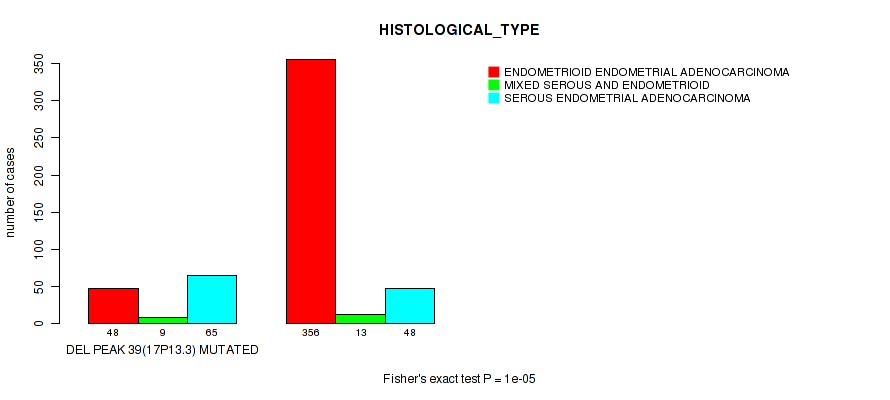
P value = 0.0807 (Fisher's exact test), Q value = 0.15
Table S221. Gene #89: 'del_17p13.3' versus Clinical Feature #4: 'RESIDUAL_TUMOR'
| nPatients | R0 | R1 | R2 | RX |
|---|---|---|---|---|
| ALL | 371 | 22 | 16 | 40 |
| DEL PEAK 39(17P13.3) MUTATED | 73 | 7 | 4 | 14 |
| DEL PEAK 39(17P13.3) WILD-TYPE | 298 | 15 | 12 | 26 |
Figure S221. Get High-res Image Gene #89: 'del_17p13.3' versus Clinical Feature #4: 'RESIDUAL_TUMOR'
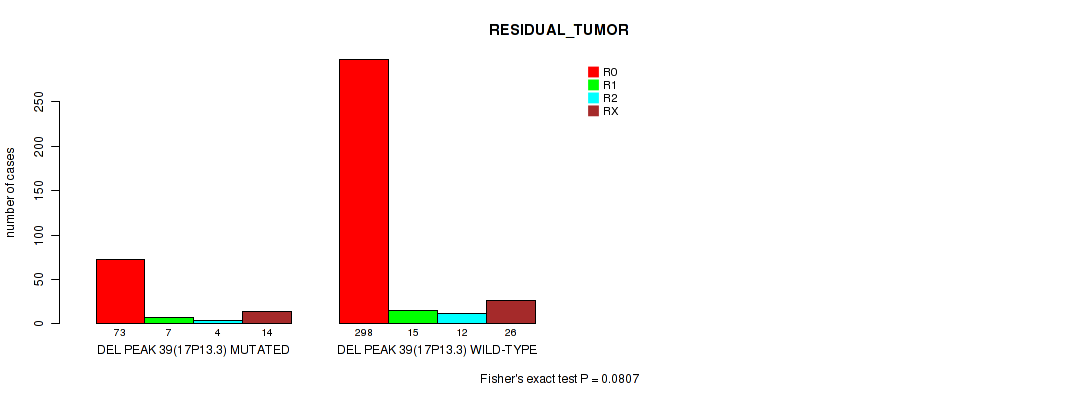
P value = 5.76e-06 (logrank test), Q value = 4e-05
Table S222. Gene #90: 'del_17p11.2' versus Clinical Feature #1: 'Time to Death'
| nPatients | nDeath | Duration Range (Median), Month | |
|---|---|---|---|
| ALL | 537 | 90 | 0.1 - 225.5 (29.9) |
| DEL PEAK 40(17P11.2) MUTATED | 127 | 38 | 0.1 - 136.6 (27.9) |
| DEL PEAK 40(17P11.2) WILD-TYPE | 410 | 52 | 0.1 - 225.5 (30.1) |
Figure S222. Get High-res Image Gene #90: 'del_17p11.2' versus Clinical Feature #1: 'Time to Death'
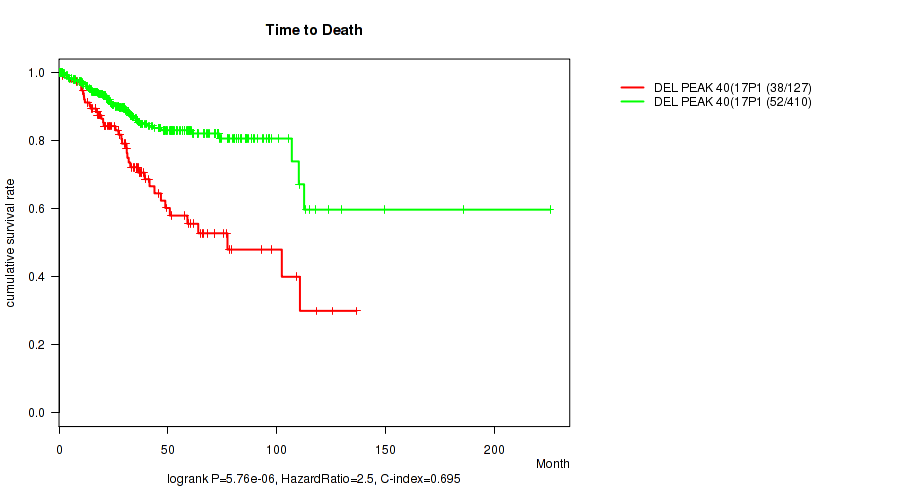
P value = 1e-05 (Fisher's exact test), Q value = 4e-05
Table S223. Gene #90: 'del_17p11.2' versus Clinical Feature #3: 'HISTOLOGICAL_TYPE'
| nPatients | ENDOMETRIOID ENDOMETRIAL ADENOCARCINOMA | MIXED SEROUS AND ENDOMETRIOID | SEROUS ENDOMETRIAL ADENOCARCINOMA |
|---|---|---|---|
| ALL | 404 | 22 | 113 |
| DEL PEAK 40(17P11.2) MUTATED | 48 | 9 | 71 |
| DEL PEAK 40(17P11.2) WILD-TYPE | 356 | 13 | 42 |
Figure S223. Get High-res Image Gene #90: 'del_17p11.2' versus Clinical Feature #3: 'HISTOLOGICAL_TYPE'

P value = 0.000896 (logrank test), Q value = 0.0025
Table S224. Gene #91: 'del_17q11.2' versus Clinical Feature #1: 'Time to Death'
| nPatients | nDeath | Duration Range (Median), Month | |
|---|---|---|---|
| ALL | 537 | 90 | 0.1 - 225.5 (29.9) |
| DEL PEAK 41(17Q11.2) MUTATED | 104 | 29 | 0.2 - 136.6 (28.0) |
| DEL PEAK 41(17Q11.2) WILD-TYPE | 433 | 61 | 0.1 - 225.5 (30.1) |
Figure S224. Get High-res Image Gene #91: 'del_17q11.2' versus Clinical Feature #1: 'Time to Death'

P value = 1e-05 (Fisher's exact test), Q value = 4e-05
Table S225. Gene #91: 'del_17q11.2' versus Clinical Feature #3: 'HISTOLOGICAL_TYPE'
| nPatients | ENDOMETRIOID ENDOMETRIAL ADENOCARCINOMA | MIXED SEROUS AND ENDOMETRIOID | SEROUS ENDOMETRIAL ADENOCARCINOMA |
|---|---|---|---|
| ALL | 404 | 22 | 113 |
| DEL PEAK 41(17Q11.2) MUTATED | 46 | 5 | 54 |
| DEL PEAK 41(17Q11.2) WILD-TYPE | 358 | 17 | 59 |
Figure S225. Get High-res Image Gene #91: 'del_17q11.2' versus Clinical Feature #3: 'HISTOLOGICAL_TYPE'
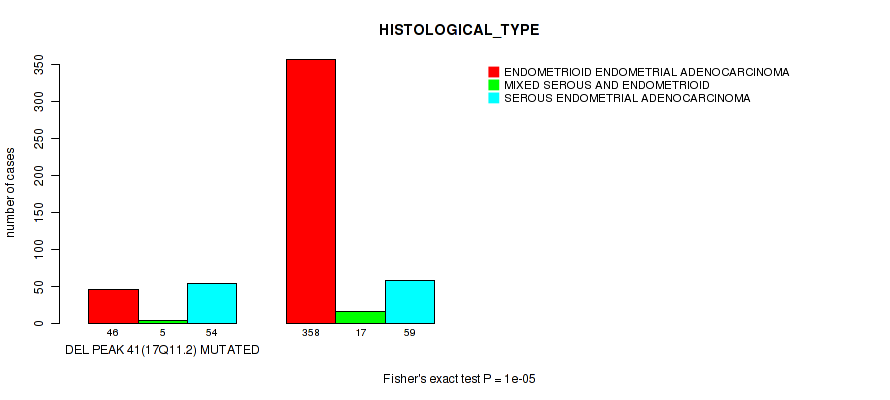
P value = 0.115 (Fisher's exact test), Q value = 0.2
Table S226. Gene #91: 'del_17q11.2' versus Clinical Feature #4: 'RESIDUAL_TUMOR'
| nPatients | R0 | R1 | R2 | RX |
|---|---|---|---|---|
| ALL | 371 | 22 | 16 | 40 |
| DEL PEAK 41(17Q11.2) MUTATED | 66 | 6 | 6 | 10 |
| DEL PEAK 41(17Q11.2) WILD-TYPE | 305 | 16 | 10 | 30 |
Figure S226. Get High-res Image Gene #91: 'del_17q11.2' versus Clinical Feature #4: 'RESIDUAL_TUMOR'

P value = 0.00013 (logrank test), Q value = 0.00042
Table S227. Gene #92: 'del_17q21.31' versus Clinical Feature #1: 'Time to Death'
| nPatients | nDeath | Duration Range (Median), Month | |
|---|---|---|---|
| ALL | 537 | 90 | 0.1 - 225.5 (29.9) |
| DEL PEAK 42(17Q21.31) MUTATED | 113 | 33 | 0.2 - 136.6 (27.3) |
| DEL PEAK 42(17Q21.31) WILD-TYPE | 424 | 57 | 0.1 - 225.5 (30.7) |
Figure S227. Get High-res Image Gene #92: 'del_17q21.31' versus Clinical Feature #1: 'Time to Death'

P value = 1e-05 (Fisher's exact test), Q value = 4e-05
Table S228. Gene #92: 'del_17q21.31' versus Clinical Feature #3: 'HISTOLOGICAL_TYPE'
| nPatients | ENDOMETRIOID ENDOMETRIAL ADENOCARCINOMA | MIXED SEROUS AND ENDOMETRIOID | SEROUS ENDOMETRIAL ADENOCARCINOMA |
|---|---|---|---|
| ALL | 404 | 22 | 113 |
| DEL PEAK 42(17Q21.31) MUTATED | 47 | 6 | 61 |
| DEL PEAK 42(17Q21.31) WILD-TYPE | 357 | 16 | 52 |
Figure S228. Get High-res Image Gene #92: 'del_17q21.31' versus Clinical Feature #3: 'HISTOLOGICAL_TYPE'

P value = 0.0206 (Fisher's exact test), Q value = 0.044
Table S229. Gene #92: 'del_17q21.31' versus Clinical Feature #4: 'RESIDUAL_TUMOR'
| nPatients | R0 | R1 | R2 | RX |
|---|---|---|---|---|
| ALL | 371 | 22 | 16 | 40 |
| DEL PEAK 42(17Q21.31) MUTATED | 68 | 6 | 6 | 14 |
| DEL PEAK 42(17Q21.31) WILD-TYPE | 303 | 16 | 10 | 26 |
Figure S229. Get High-res Image Gene #92: 'del_17q21.31' versus Clinical Feature #4: 'RESIDUAL_TUMOR'

P value = 0.0899 (logrank test), Q value = 0.16
Table S230. Gene #93: 'del_18q21.2' versus Clinical Feature #1: 'Time to Death'
| nPatients | nDeath | Duration Range (Median), Month | |
|---|---|---|---|
| ALL | 537 | 90 | 0.1 - 225.5 (29.9) |
| DEL PEAK 43(18Q21.2) MUTATED | 89 | 20 | 0.1 - 136.6 (28.1) |
| DEL PEAK 43(18Q21.2) WILD-TYPE | 448 | 70 | 0.1 - 225.5 (30.1) |
Figure S230. Get High-res Image Gene #93: 'del_18q21.2' versus Clinical Feature #1: 'Time to Death'
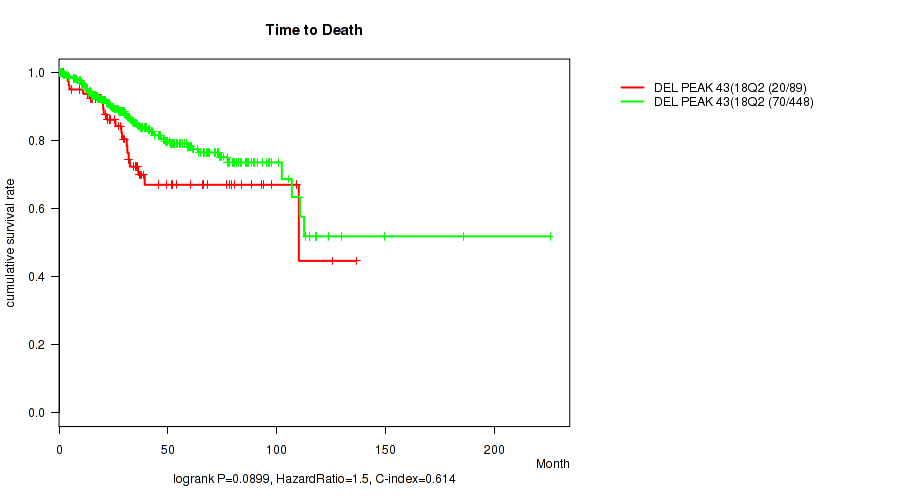
P value = 1e-05 (Fisher's exact test), Q value = 4e-05
Table S231. Gene #93: 'del_18q21.2' versus Clinical Feature #3: 'HISTOLOGICAL_TYPE'
| nPatients | ENDOMETRIOID ENDOMETRIAL ADENOCARCINOMA | MIXED SEROUS AND ENDOMETRIOID | SEROUS ENDOMETRIAL ADENOCARCINOMA |
|---|---|---|---|
| ALL | 404 | 22 | 113 |
| DEL PEAK 43(18Q21.2) MUTATED | 38 | 6 | 46 |
| DEL PEAK 43(18Q21.2) WILD-TYPE | 366 | 16 | 67 |
Figure S231. Get High-res Image Gene #93: 'del_18q21.2' versus Clinical Feature #3: 'HISTOLOGICAL_TYPE'

P value = 0.0378 (Fisher's exact test), Q value = 0.075
Table S232. Gene #93: 'del_18q21.2' versus Clinical Feature #4: 'RESIDUAL_TUMOR'
| nPatients | R0 | R1 | R2 | RX |
|---|---|---|---|---|
| ALL | 371 | 22 | 16 | 40 |
| DEL PEAK 43(18Q21.2) MUTATED | 50 | 5 | 5 | 10 |
| DEL PEAK 43(18Q21.2) WILD-TYPE | 321 | 17 | 11 | 30 |
Figure S232. Get High-res Image Gene #93: 'del_18q21.2' versus Clinical Feature #4: 'RESIDUAL_TUMOR'

P value = 0.00106 (logrank test), Q value = 0.0029
Table S233. Gene #94: 'del_18q23' versus Clinical Feature #1: 'Time to Death'
| nPatients | nDeath | Duration Range (Median), Month | |
|---|---|---|---|
| ALL | 537 | 90 | 0.1 - 225.5 (29.9) |
| DEL PEAK 44(18Q23) MUTATED | 97 | 26 | 0.1 - 136.6 (28.1) |
| DEL PEAK 44(18Q23) WILD-TYPE | 440 | 64 | 0.1 - 225.5 (30.1) |
Figure S233. Get High-res Image Gene #94: 'del_18q23' versus Clinical Feature #1: 'Time to Death'

P value = 1e-05 (Fisher's exact test), Q value = 4e-05
Table S234. Gene #94: 'del_18q23' versus Clinical Feature #3: 'HISTOLOGICAL_TYPE'
| nPatients | ENDOMETRIOID ENDOMETRIAL ADENOCARCINOMA | MIXED SEROUS AND ENDOMETRIOID | SEROUS ENDOMETRIAL ADENOCARCINOMA |
|---|---|---|---|
| ALL | 404 | 22 | 113 |
| DEL PEAK 44(18Q23) MUTATED | 39 | 6 | 53 |
| DEL PEAK 44(18Q23) WILD-TYPE | 365 | 16 | 60 |
Figure S234. Get High-res Image Gene #94: 'del_18q23' versus Clinical Feature #3: 'HISTOLOGICAL_TYPE'
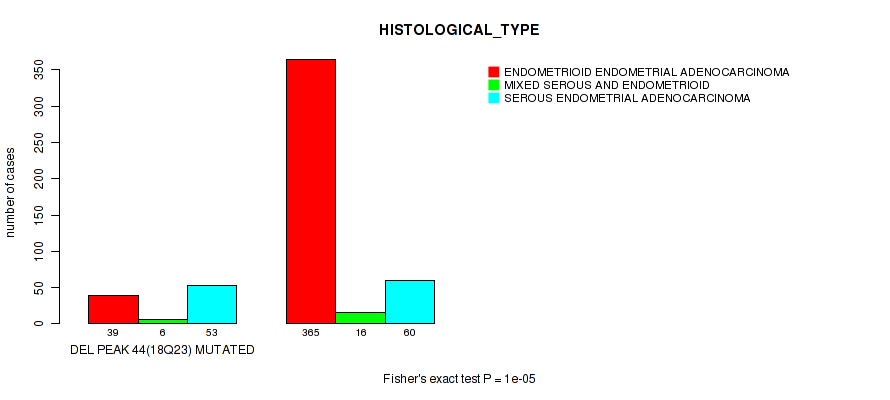
P value = 0.00535 (Fisher's exact test), Q value = 0.013
Table S235. Gene #94: 'del_18q23' versus Clinical Feature #4: 'RESIDUAL_TUMOR'
| nPatients | R0 | R1 | R2 | RX |
|---|---|---|---|---|
| ALL | 371 | 22 | 16 | 40 |
| DEL PEAK 44(18Q23) MUTATED | 57 | 5 | 8 | 9 |
| DEL PEAK 44(18Q23) WILD-TYPE | 314 | 17 | 8 | 31 |
Figure S235. Get High-res Image Gene #94: 'del_18q23' versus Clinical Feature #4: 'RESIDUAL_TUMOR'

P value = 5.21e-07 (logrank test), Q value = 4e-05
Table S236. Gene #95: 'del_19p13.3' versus Clinical Feature #1: 'Time to Death'
| nPatients | nDeath | Duration Range (Median), Month | |
|---|---|---|---|
| ALL | 537 | 90 | 0.1 - 225.5 (29.9) |
| DEL PEAK 45(19P13.3) MUTATED | 156 | 46 | 0.1 - 136.6 (27.6) |
| DEL PEAK 45(19P13.3) WILD-TYPE | 381 | 44 | 0.1 - 225.5 (30.7) |
Figure S236. Get High-res Image Gene #95: 'del_19p13.3' versus Clinical Feature #1: 'Time to Death'
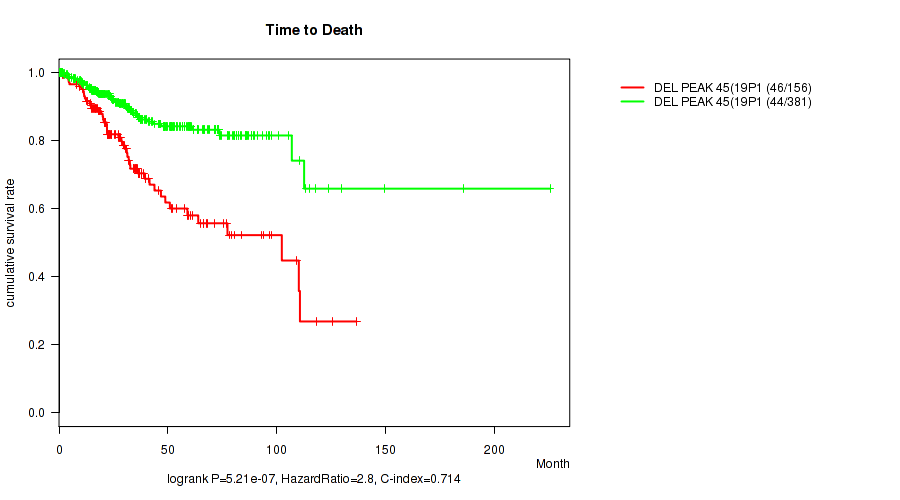
P value = 1e-05 (Fisher's exact test), Q value = 4e-05
Table S237. Gene #95: 'del_19p13.3' versus Clinical Feature #3: 'HISTOLOGICAL_TYPE'
| nPatients | ENDOMETRIOID ENDOMETRIAL ADENOCARCINOMA | MIXED SEROUS AND ENDOMETRIOID | SEROUS ENDOMETRIAL ADENOCARCINOMA |
|---|---|---|---|
| ALL | 404 | 22 | 113 |
| DEL PEAK 45(19P13.3) MUTATED | 45 | 10 | 102 |
| DEL PEAK 45(19P13.3) WILD-TYPE | 359 | 12 | 11 |
Figure S237. Get High-res Image Gene #95: 'del_19p13.3' versus Clinical Feature #3: 'HISTOLOGICAL_TYPE'
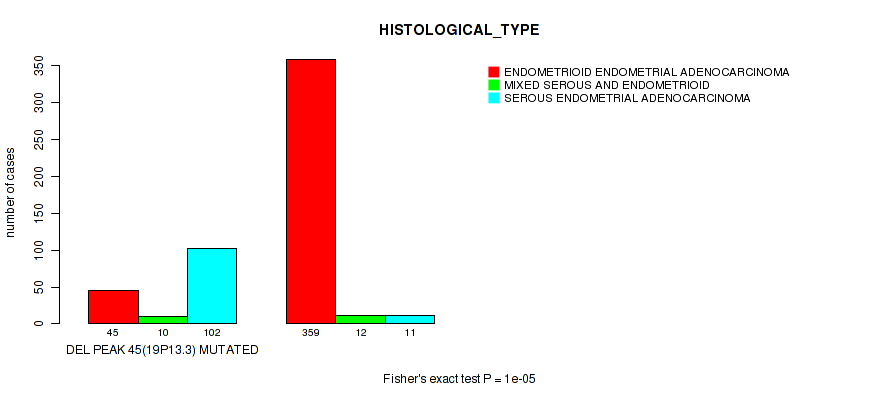
P value = 0.00313 (Fisher's exact test), Q value = 0.0078
Table S238. Gene #95: 'del_19p13.3' versus Clinical Feature #4: 'RESIDUAL_TUMOR'
| nPatients | R0 | R1 | R2 | RX |
|---|---|---|---|---|
| ALL | 371 | 22 | 16 | 40 |
| DEL PEAK 45(19P13.3) MUTATED | 94 | 9 | 10 | 15 |
| DEL PEAK 45(19P13.3) WILD-TYPE | 277 | 13 | 6 | 25 |
Figure S238. Get High-res Image Gene #95: 'del_19p13.3' versus Clinical Feature #4: 'RESIDUAL_TUMOR'
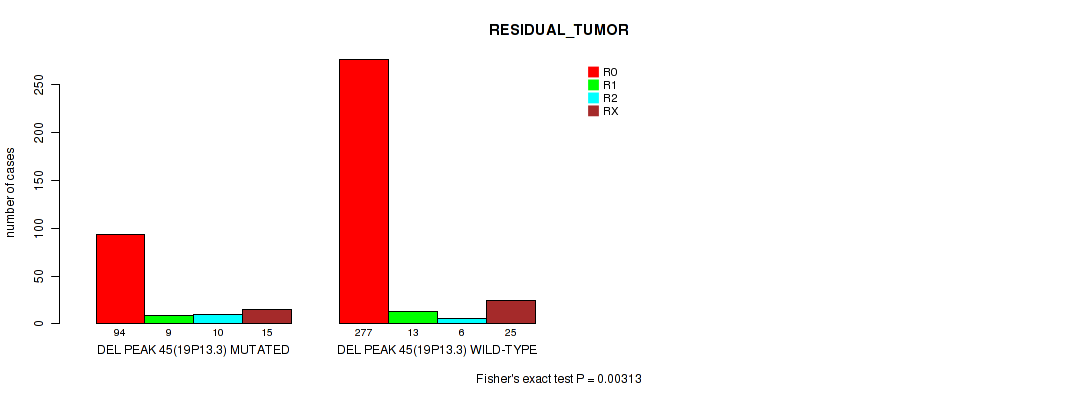
P value = 0.0946 (logrank test), Q value = 0.17
Table S239. Gene #96: 'del_19p12' versus Clinical Feature #1: 'Time to Death'
| nPatients | nDeath | Duration Range (Median), Month | |
|---|---|---|---|
| ALL | 537 | 90 | 0.1 - 225.5 (29.9) |
| DEL PEAK 46(19P12) MUTATED | 58 | 14 | 0.2 - 136.6 (29.0) |
| DEL PEAK 46(19P12) WILD-TYPE | 479 | 76 | 0.1 - 225.5 (30.0) |
Figure S239. Get High-res Image Gene #96: 'del_19p12' versus Clinical Feature #1: 'Time to Death'
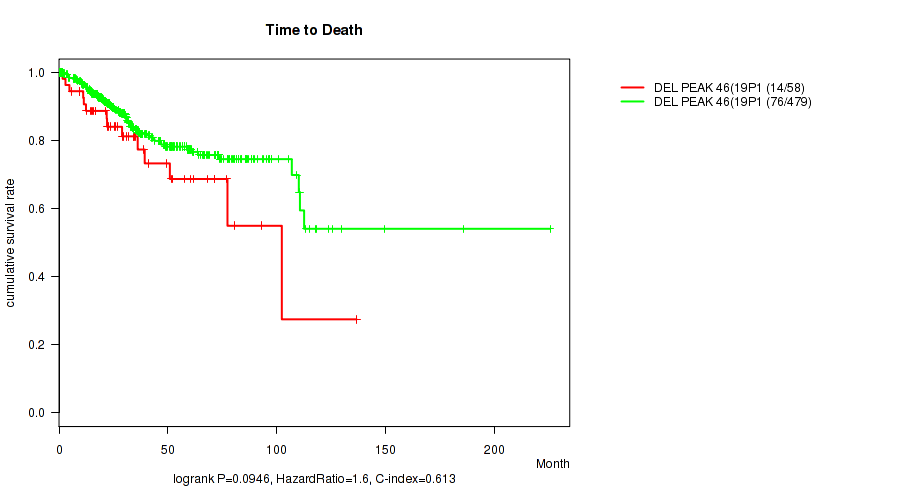
P value = 1e-05 (Fisher's exact test), Q value = 4e-05
Table S240. Gene #96: 'del_19p12' versus Clinical Feature #3: 'HISTOLOGICAL_TYPE'
| nPatients | ENDOMETRIOID ENDOMETRIAL ADENOCARCINOMA | MIXED SEROUS AND ENDOMETRIOID | SEROUS ENDOMETRIAL ADENOCARCINOMA |
|---|---|---|---|
| ALL | 404 | 22 | 113 |
| DEL PEAK 46(19P12) MUTATED | 21 | 5 | 32 |
| DEL PEAK 46(19P12) WILD-TYPE | 383 | 17 | 81 |
Figure S240. Get High-res Image Gene #96: 'del_19p12' versus Clinical Feature #3: 'HISTOLOGICAL_TYPE'

P value = 0.112 (Fisher's exact test), Q value = 0.19
Table S241. Gene #96: 'del_19p12' versus Clinical Feature #4: 'RESIDUAL_TUMOR'
| nPatients | R0 | R1 | R2 | RX |
|---|---|---|---|---|
| ALL | 371 | 22 | 16 | 40 |
| DEL PEAK 46(19P12) MUTATED | 33 | 3 | 2 | 8 |
| DEL PEAK 46(19P12) WILD-TYPE | 338 | 19 | 14 | 32 |
Figure S241. Get High-res Image Gene #96: 'del_19p12' versus Clinical Feature #4: 'RESIDUAL_TUMOR'

P value = 0.00293 (logrank test), Q value = 0.0074
Table S242. Gene #97: 'del_19q13.43' versus Clinical Feature #1: 'Time to Death'
| nPatients | nDeath | Duration Range (Median), Month | |
|---|---|---|---|
| ALL | 537 | 90 | 0.1 - 225.5 (29.9) |
| DEL PEAK 47(19Q13.43) MUTATED | 66 | 19 | 0.1 - 125.4 (25.8) |
| DEL PEAK 47(19Q13.43) WILD-TYPE | 471 | 71 | 0.1 - 225.5 (30.1) |
Figure S242. Get High-res Image Gene #97: 'del_19q13.43' versus Clinical Feature #1: 'Time to Death'
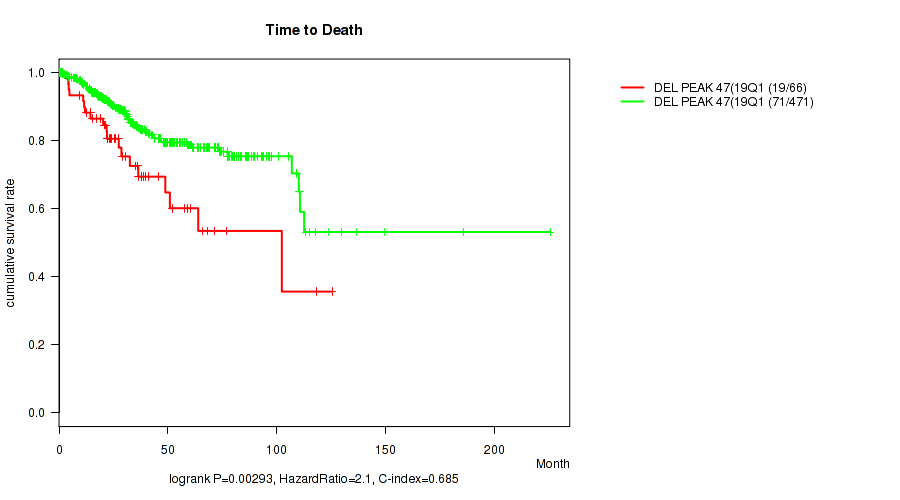
P value = 1e-05 (Fisher's exact test), Q value = 4e-05
Table S243. Gene #97: 'del_19q13.43' versus Clinical Feature #3: 'HISTOLOGICAL_TYPE'
| nPatients | ENDOMETRIOID ENDOMETRIAL ADENOCARCINOMA | MIXED SEROUS AND ENDOMETRIOID | SEROUS ENDOMETRIAL ADENOCARCINOMA |
|---|---|---|---|
| ALL | 404 | 22 | 113 |
| DEL PEAK 47(19Q13.43) MUTATED | 20 | 4 | 43 |
| DEL PEAK 47(19Q13.43) WILD-TYPE | 384 | 18 | 70 |
Figure S243. Get High-res Image Gene #97: 'del_19q13.43' versus Clinical Feature #3: 'HISTOLOGICAL_TYPE'

P value = 0.0175 (Fisher's exact test), Q value = 0.039
Table S244. Gene #97: 'del_19q13.43' versus Clinical Feature #4: 'RESIDUAL_TUMOR'
| nPatients | R0 | R1 | R2 | RX |
|---|---|---|---|---|
| ALL | 371 | 22 | 16 | 40 |
| DEL PEAK 47(19Q13.43) MUTATED | 37 | 6 | 3 | 8 |
| DEL PEAK 47(19Q13.43) WILD-TYPE | 334 | 16 | 13 | 32 |
Figure S244. Get High-res Image Gene #97: 'del_19q13.43' versus Clinical Feature #4: 'RESIDUAL_TUMOR'

P value = 0.000108 (logrank test), Q value = 0.00035
Table S245. Gene #98: 'del_20p12.1' versus Clinical Feature #1: 'Time to Death'
| nPatients | nDeath | Duration Range (Median), Month | |
|---|---|---|---|
| ALL | 537 | 90 | 0.1 - 225.5 (29.9) |
| DEL PEAK 48(20P12.1) MUTATED | 35 | 14 | 0.3 - 149.6 (27.6) |
| DEL PEAK 48(20P12.1) WILD-TYPE | 502 | 76 | 0.1 - 225.5 (30.1) |
Figure S245. Get High-res Image Gene #98: 'del_20p12.1' versus Clinical Feature #1: 'Time to Death'
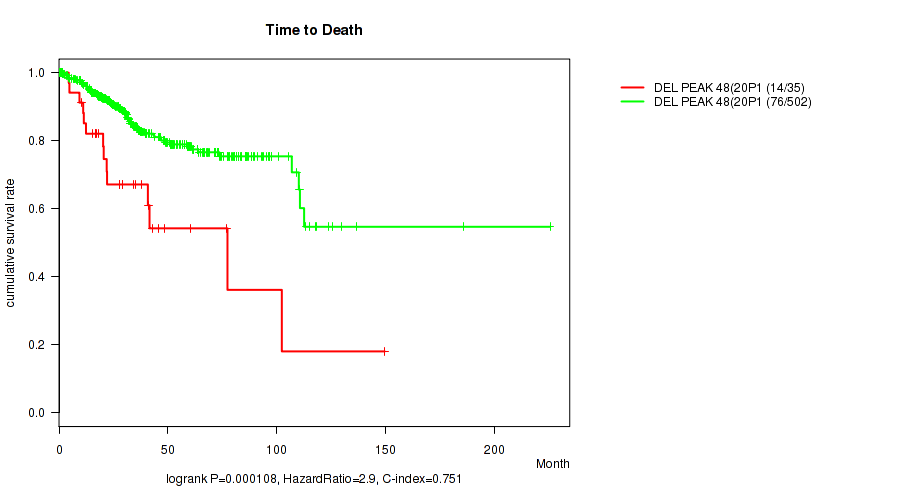
P value = 1e-04 (Fisher's exact test), Q value = 0.00034
Table S246. Gene #98: 'del_20p12.1' versus Clinical Feature #3: 'HISTOLOGICAL_TYPE'
| nPatients | ENDOMETRIOID ENDOMETRIAL ADENOCARCINOMA | MIXED SEROUS AND ENDOMETRIOID | SEROUS ENDOMETRIAL ADENOCARCINOMA |
|---|---|---|---|
| ALL | 404 | 22 | 113 |
| DEL PEAK 48(20P12.1) MUTATED | 16 | 1 | 18 |
| DEL PEAK 48(20P12.1) WILD-TYPE | 388 | 21 | 95 |
Figure S246. Get High-res Image Gene #98: 'del_20p12.1' versus Clinical Feature #3: 'HISTOLOGICAL_TYPE'

P value = 0.153 (Fisher's exact test), Q value = 0.24
Table S247. Gene #98: 'del_20p12.1' versus Clinical Feature #4: 'RESIDUAL_TUMOR'
| nPatients | R0 | R1 | R2 | RX |
|---|---|---|---|---|
| ALL | 371 | 22 | 16 | 40 |
| DEL PEAK 48(20P12.1) MUTATED | 20 | 1 | 2 | 5 |
| DEL PEAK 48(20P12.1) WILD-TYPE | 351 | 21 | 14 | 35 |
Figure S247. Get High-res Image Gene #98: 'del_20p12.1' versus Clinical Feature #4: 'RESIDUAL_TUMOR'
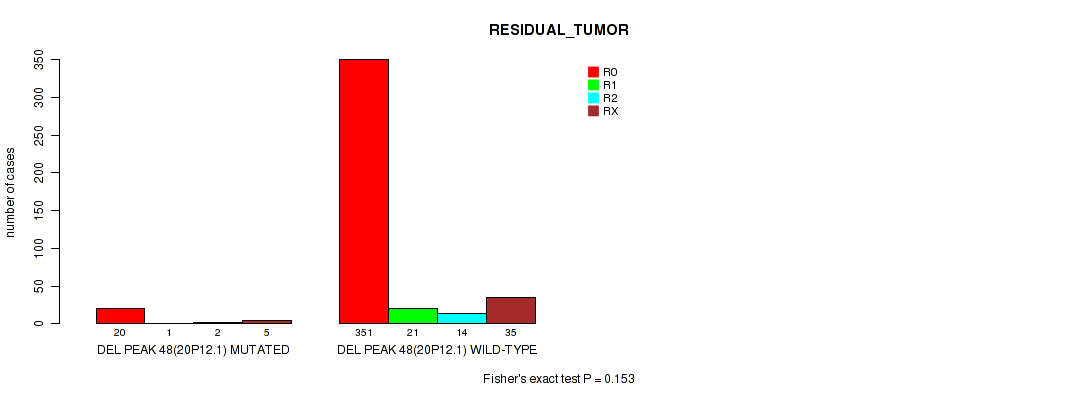
P value = 0.00109 (logrank test), Q value = 0.003
Table S248. Gene #99: 'del_22q12.1' versus Clinical Feature #1: 'Time to Death'
| nPatients | nDeath | Duration Range (Median), Month | |
|---|---|---|---|
| ALL | 537 | 90 | 0.1 - 225.5 (29.9) |
| DEL PEAK 49(22Q12.1) MUTATED | 94 | 26 | 0.1 - 136.6 (28.6) |
| DEL PEAK 49(22Q12.1) WILD-TYPE | 443 | 64 | 0.1 - 225.5 (29.9) |
Figure S248. Get High-res Image Gene #99: 'del_22q12.1' versus Clinical Feature #1: 'Time to Death'

P value = 1e-05 (Fisher's exact test), Q value = 4e-05
Table S249. Gene #99: 'del_22q12.1' versus Clinical Feature #3: 'HISTOLOGICAL_TYPE'
| nPatients | ENDOMETRIOID ENDOMETRIAL ADENOCARCINOMA | MIXED SEROUS AND ENDOMETRIOID | SEROUS ENDOMETRIAL ADENOCARCINOMA |
|---|---|---|---|
| ALL | 404 | 22 | 113 |
| DEL PEAK 49(22Q12.1) MUTATED | 48 | 9 | 38 |
| DEL PEAK 49(22Q12.1) WILD-TYPE | 356 | 13 | 75 |
Figure S249. Get High-res Image Gene #99: 'del_22q12.1' versus Clinical Feature #3: 'HISTOLOGICAL_TYPE'

P value = 0.129 (Fisher's exact test), Q value = 0.21
Table S250. Gene #99: 'del_22q12.1' versus Clinical Feature #4: 'RESIDUAL_TUMOR'
| nPatients | R0 | R1 | R2 | RX |
|---|---|---|---|---|
| ALL | 371 | 22 | 16 | 40 |
| DEL PEAK 49(22Q12.1) MUTATED | 59 | 5 | 3 | 12 |
| DEL PEAK 49(22Q12.1) WILD-TYPE | 312 | 17 | 13 | 28 |
Figure S250. Get High-res Image Gene #99: 'del_22q12.1' versus Clinical Feature #4: 'RESIDUAL_TUMOR'

P value = 2.75e-05 (logrank test), Q value = 0.00011
Table S251. Gene #100: 'del_22q13.32' versus Clinical Feature #1: 'Time to Death'
| nPatients | nDeath | Duration Range (Median), Month | |
|---|---|---|---|
| ALL | 537 | 90 | 0.1 - 225.5 (29.9) |
| DEL PEAK 50(22Q13.32) MUTATED | 139 | 38 | 0.1 - 136.6 (27.1) |
| DEL PEAK 50(22Q13.32) WILD-TYPE | 398 | 52 | 0.1 - 225.5 (30.7) |
Figure S251. Get High-res Image Gene #100: 'del_22q13.32' versus Clinical Feature #1: 'Time to Death'

P value = 1e-05 (Fisher's exact test), Q value = 4e-05
Table S252. Gene #100: 'del_22q13.32' versus Clinical Feature #3: 'HISTOLOGICAL_TYPE'
| nPatients | ENDOMETRIOID ENDOMETRIAL ADENOCARCINOMA | MIXED SEROUS AND ENDOMETRIOID | SEROUS ENDOMETRIAL ADENOCARCINOMA |
|---|---|---|---|
| ALL | 404 | 22 | 113 |
| DEL PEAK 50(22Q13.32) MUTATED | 57 | 10 | 73 |
| DEL PEAK 50(22Q13.32) WILD-TYPE | 347 | 12 | 40 |
Figure S252. Get High-res Image Gene #100: 'del_22q13.32' versus Clinical Feature #3: 'HISTOLOGICAL_TYPE'
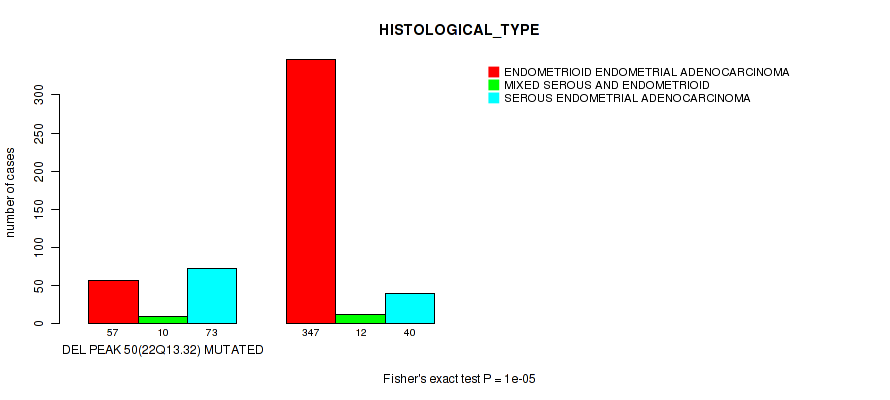
P value = 7.7e-06 (logrank test), Q value = 4e-05
Table S253. Gene #101: 'del_xp21.1' versus Clinical Feature #1: 'Time to Death'
| nPatients | nDeath | Duration Range (Median), Month | |
|---|---|---|---|
| ALL | 537 | 90 | 0.1 - 225.5 (29.9) |
| DEL PEAK 51(XP21.1) MUTATED | 87 | 29 | 0.3 - 118.2 (27.3) |
| DEL PEAK 51(XP21.1) WILD-TYPE | 450 | 61 | 0.1 - 225.5 (30.6) |
Figure S253. Get High-res Image Gene #101: 'del_xp21.1' versus Clinical Feature #1: 'Time to Death'

P value = 1e-05 (Fisher's exact test), Q value = 4e-05
Table S254. Gene #101: 'del_xp21.1' versus Clinical Feature #3: 'HISTOLOGICAL_TYPE'
| nPatients | ENDOMETRIOID ENDOMETRIAL ADENOCARCINOMA | MIXED SEROUS AND ENDOMETRIOID | SEROUS ENDOMETRIAL ADENOCARCINOMA |
|---|---|---|---|
| ALL | 404 | 22 | 113 |
| DEL PEAK 51(XP21.1) MUTATED | 32 | 4 | 52 |
| DEL PEAK 51(XP21.1) WILD-TYPE | 372 | 18 | 61 |
Figure S254. Get High-res Image Gene #101: 'del_xp21.1' versus Clinical Feature #3: 'HISTOLOGICAL_TYPE'

P value = 0.111 (Fisher's exact test), Q value = 0.19
Table S255. Gene #101: 'del_xp21.1' versus Clinical Feature #4: 'RESIDUAL_TUMOR'
| nPatients | R0 | R1 | R2 | RX |
|---|---|---|---|---|
| ALL | 371 | 22 | 16 | 40 |
| DEL PEAK 51(XP21.1) MUTATED | 56 | 2 | 6 | 7 |
| DEL PEAK 51(XP21.1) WILD-TYPE | 315 | 20 | 10 | 33 |
Figure S255. Get High-res Image Gene #101: 'del_xp21.1' versus Clinical Feature #4: 'RESIDUAL_TUMOR'

-
Copy number data file = all_lesions.txt from GISTIC pipeline
-
Processed Copy number data file = /xchip/cga/gdac-prod/tcga-gdac/jobResults/GDAC_Correlate_Genomic_Events_Preprocess/UCEC-TP/22534122/transformed.cor.cli.txt
-
Clinical data file = /xchip/cga/gdac-prod/tcga-gdac/jobResults/Append_Data/UCEC-TP/22507145/UCEC-TP.merged_data.txt
-
Number of patients = 539
-
Number of significantly focal cnvs = 101
-
Number of selected clinical features = 4
-
Exclude genes that fewer than K tumors have mutations, K = 3
For survival clinical features, the Kaplan-Meier survival curves of tumors with and without gene mutations were plotted and the statistical significance P values were estimated by logrank test (Bland and Altman 2004) using the 'survdiff' function in R
For binary or multi-class clinical features (nominal or ordinal), two-tailed Fisher's exact tests (Fisher 1922) were used to estimate the P values using the 'fisher.test' function in R
For multiple hypothesis correction, Q value is the False Discovery Rate (FDR) analogue of the P value (Benjamini and Hochberg 1995), defined as the minimum FDR at which the test may be called significant. We used the 'Benjamini and Hochberg' method of 'p.adjust' function in R to convert P values into Q values.
In addition to the links below, the full results of the analysis summarized in this report can also be downloaded programmatically using firehose_get, or interactively from either the Broad GDAC website or TCGA Data Coordination Center Portal.