This report serves to describe the mutational landscape and properties of a given individual set, as well as rank genes and genesets according to mutational significance. MutSig v2.0 was used to generate the results found in this report.
-
Working with individual set: UCEC-TP
-
Number of patients in set: 248
The input for this pipeline is a set of individuals with the following files associated for each:
-
An annotated .maf file describing the mutations called for the respective individual, and their properties.
-
A .wig file that contains information about the coverage of the sample.
-
MAF used for this analysis:UCEC-TP.final_analysis_set.maf
-
Blacklist used for this analysis: pancan_mutation_blacklist.v14.hg19.txt
-
Significantly mutated genes (q ≤ 0.1): 42
-
Mutations seen in COSMIC: 989
-
Significantly mutated genes in COSMIC territory: 41
-
Significantly mutated genesets: 70
-
Significantly mutated genesets: (excluding sig. mutated genes):0
-
Read 248 MAFs of type "maf1"
-
Total number of mutations in input MAFs: 184731
-
After removing 118 mutations outside chr1-24: 184613
-
After removing 1169 blacklisted mutations: 183444
-
After removing 9575 noncoding mutations: 173869
-
After collapsing adjacent/redundant mutations: 173868
-
Number of mutations before filtering: 173868
-
After removing 15041 mutations outside gene set: 158827
-
After removing 1077 mutations outside category set: 157750
-
After removing 26 "impossible" mutations in
-
gene-patient-category bins of zero coverage: 141606
Table 1. Get Full Table Table representing breakdown of mutations by type.
| type | count |
|---|---|
| De_novo_Start_InFrame | 11 |
| De_novo_Start_OutOfFrame | 27 |
| Frame_Shift_Del | 846 |
| Frame_Shift_Ins | 367 |
| In_Frame_Del | 571 |
| In_Frame_Ins | 76 |
| Missense_Mutation | 103510 |
| Nonsense_Mutation | 10339 |
| Nonstop_Mutation | 96 |
| Silent | 36998 |
| Splice_Site | 4822 |
| Start_Codon_Del | 3 |
| Start_Codon_SNP | 80 |
| Stop_Codon_Del | 3 |
| Stop_Codon_Ins | 1 |
| Total | 157750 |
Table 2. Get Full Table A breakdown of mutation rates per category discovered for this individual set.
| category | n | N | rate | rate_per_mb | relative_rate | exp_ns_s_ratio |
|---|---|---|---|---|---|---|
| *CpG->T | 35132 | 363920417 | 0.000097 | 97 | 5.6 | 2.2 |
| *Cp(A/C/T)->mut | 45808 | 3147487610 | 0.000015 | 15 | 0.84 | 3.4 |
| A->mut | 21636 | 3458111551 | 6.3e-06 | 6.3 | 0.36 | 3.8 |
| *CpG->(G/A) | 999 | 363920417 | 2.7e-06 | 2.7 | 0.16 | 2.7 |
| indel+null | 16221 | 6969519578 | 2.3e-06 | 2.3 | 0.13 | NaN |
| double_null | 940 | 6969519578 | 1.3e-07 | 0.13 | 0.0078 | NaN |
| Total | 120736 | 6969519578 | 0.000017 | 17 | 1 | 3.5 |
The x axis represents the samples. The y axis represents the exons, one row per exon, and they are sorted by average coverage across samples. For exons with exactly the same average coverage, they are sorted next by the %GC of the exon. (The secondary sort is especially useful for the zero-coverage exons at the bottom). If the figure is unpopulated, then full coverage is assumed (e.g. MutSig CV doesn't use WIGs and assumes full coverage).
Figure 1.
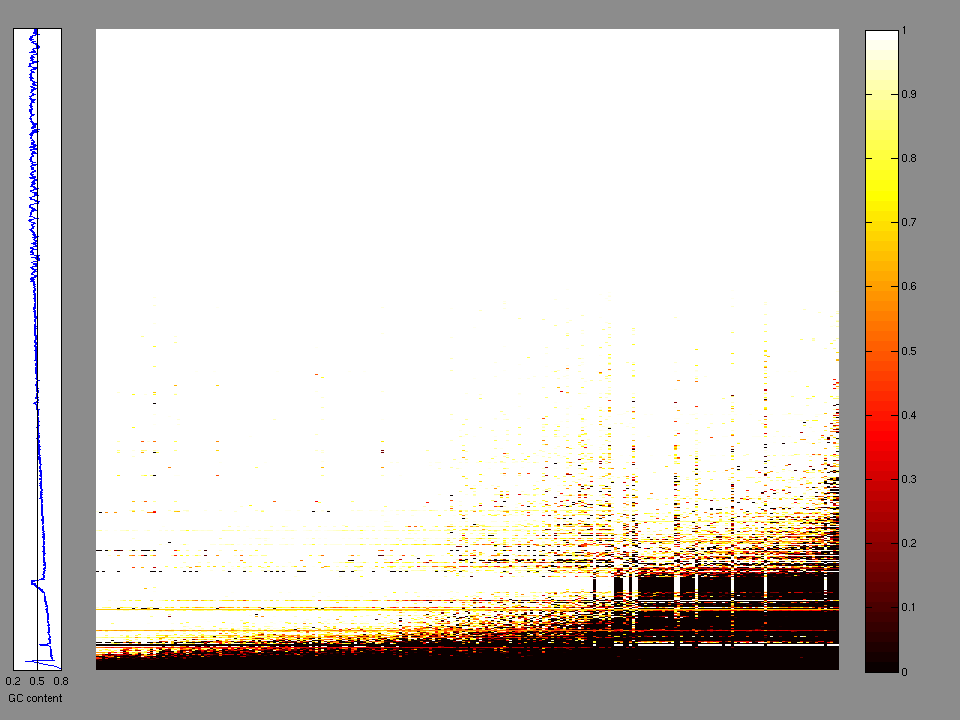
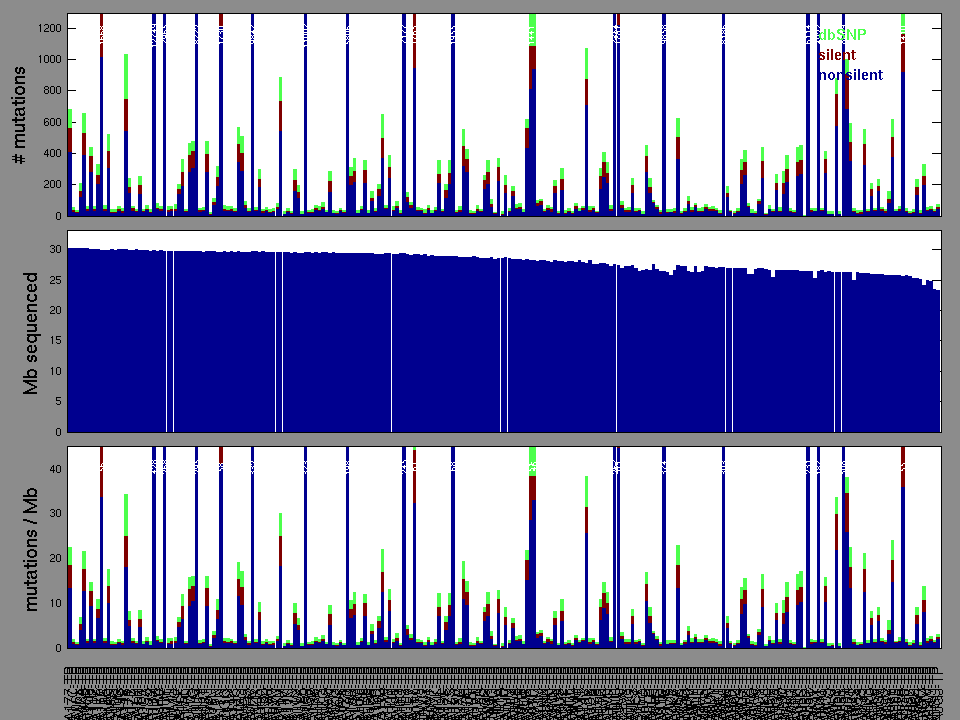
Figure 2. Patients counts and rates file used to generate this plot: UCEC-TP.patients.counts_and_rates.txt
The mutation spectrum is depicted in the lego plots below in which the 96 possible mutation types are subdivided into six large blocks, color-coded to reflect the base substitution type. Each large block is further subdivided into the 16 possible pairs of 5' and 3' neighbors, as listed in the 4x4 trinucleotide context legend. The height of each block corresponds to the mutation frequency for that kind of mutation (counts of mutations normalized by the base coverage in a given bin). The shape of the spectrum is a signature for dominant mutational mechanisms in different tumor types.
Figure 3. Get High-res Image SNV Mutation rate lego plot for entire set. Each bin is normalized by base coverage for that bin. Colors represent the six SNV types on the upper right. The three-base context for each mutation is labeled in the 4x4 legend on the lower right. The fractional breakdown of SNV counts is shown in the pie chart on the upper left. If this figure is blank, not enough information was provided in the MAF to generate it.
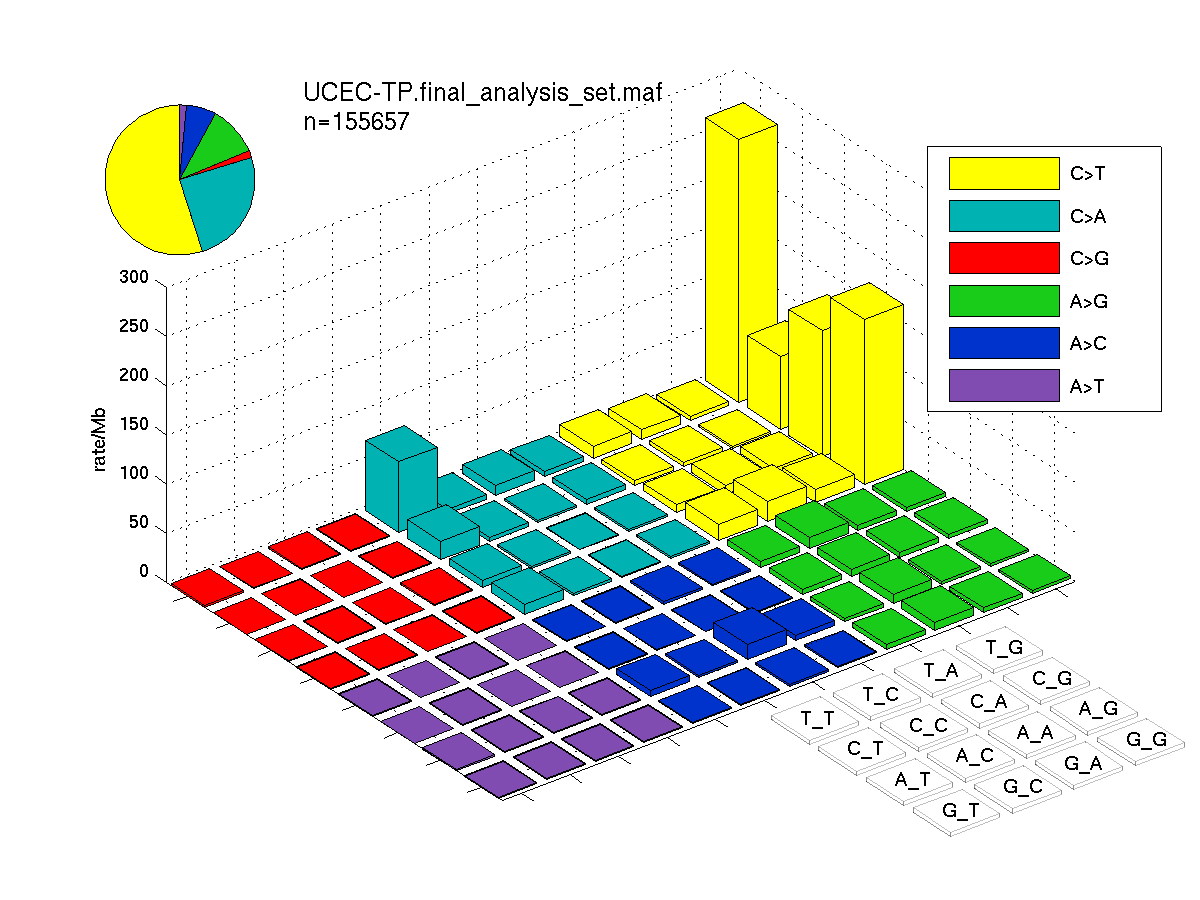
Figure 4. Get High-res Image SNV Mutation rate lego plots for 4 slices of mutation allele fraction (0<=AF<0.1, 0.1<=AF<0.25, 0.25<=AF<0.5, & 0.5<=AF) . The color code and three-base context legends are the same as the previous figure. If this figure is blank, not enough information was provided in the MAF to generate it.

Column Descriptions:
-
N = number of sequenced bases in this gene across the individual set
-
n = number of (nonsilent) mutations in this gene across the individual set
-
npat = number of patients (individuals) with at least one nonsilent mutation
-
nsite = number of unique sites having a non-silent mutation
-
nsil = number of silent mutations in this gene across the individual set
-
n1 = number of nonsilent mutations of type: *CpG->T
-
n2 = number of nonsilent mutations of type: *Cp(A/C/T)->mut
-
n3 = number of nonsilent mutations of type: A->mut
-
n4 = number of nonsilent mutations of type: *CpG->(G/A)
-
n5 = number of nonsilent mutations of type: indel+null
-
n6 = number of nonsilent mutations of type: double_null
-
p_classic = p-value for the observed amount of nonsilent mutations being elevated in this gene
-
p_ns_s = p-value for the observed nonsilent/silent ratio being elevated in this gene
-
p_cons = p-value for enrichment of mutations at evolutionarily most-conserved sites in gene
-
p_joint = p-value for clustering + conservation
-
p = p-value (overall)
-
q = q-value, False Discovery Rate (Benjamini-Hochberg procedure)
Table 3. Get Full Table A Ranked List of Significantly Mutated Genes. Number of significant genes found: 42. Number of genes displayed: 35. Click on a gene name to display its stick figure depicting the distribution of mutations and mutation types across the chosen gene (this feature may not be available for all significant genes).
| rank | gene | description | N | n | npat | nsite | nsil | n1 | n2 | n3 | n4 | n5 | n6 | p_classic | p_ns_s | p_clust | p_cons | p_joint | p | q |
|---|---|---|---|---|---|---|---|---|---|---|---|---|---|---|---|---|---|---|---|---|
| 1 | FBXW7 | F-box and WD repeat domain containing 7 | 638720 | 44 | 38 | 28 | 1 | 20 | 12 | 2 | 1 | 8 | 1 | 8.10e-15 | 0.00073 | 0.000065 | 0.0057 | 0.000035 | 0.000 | 0.000 |
| 2 | SPOP | speckle-type POZ protein | 287083 | 23 | 21 | 18 | 0 | 5 | 8 | 6 | 0 | 4 | 0 | 8.10e-15 | 0.0041 | 0.0034 | 0.035 | 0.0013 | 4.44e-16 | 1.21e-12 |
| 3 | PTEN | phosphatase and tensin homolog (mutated in multiple advanced cancers 1) | 306286 | 227 | 161 | 134 | 5 | 19 | 25 | 21 | 33 | 102 | 27 | <1.00e-15 | 4.8e-12 | 0 | 0.86 | 0 | <1.00e-15 | <1.21e-12 |
| 4 | PIK3CA | phosphoinositide-3-kinase, catalytic, alpha polypeptide | 813637 | 172 | 132 | 76 | 3 | 31 | 55 | 68 | 3 | 15 | 0 | 2.33e-15 | 2.1e-11 | 0 | 0 | 0 | <1.00e-15 | <1.21e-12 |
| 5 | PIK3R1 | phosphoinositide-3-kinase, regulatory subunit 1 (alpha) | 581125 | 99 | 82 | 76 | 1 | 4 | 4 | 12 | 1 | 63 | 15 | <1.00e-15 | 0.00051 | 0 | 0.54 | 0 | <1.00e-15 | <1.21e-12 |
| 6 | CTNNB1 | catenin (cadherin-associated protein), beta 1, 88kDa | 592248 | 80 | 74 | 25 | 7 | 5 | 61 | 14 | 0 | 0 | 0 | 4.55e-15 | 0.0034 | 0 | 0 | 0 | <1.00e-15 | <1.21e-12 |
| 7 | TP53 | tumor protein p53 | 317550 | 74 | 69 | 50 | 2 | 23 | 18 | 15 | 1 | 17 | 0 | 3.11e-15 | 2.1e-06 | 0 | 4e-07 | 0 | <1.00e-15 | <1.21e-12 |
| 8 | KRAS | v-Ki-ras2 Kirsten rat sarcoma viral oncogene homolog | 175322 | 52 | 52 | 11 | 1 | 2 | 45 | 4 | 1 | 0 | 0 | <1.00e-15 | 0.0014 | 0 | 0.0011 | 0 | <1.00e-15 | <1.21e-12 |
| 9 | PPP2R1A | protein phosphatase 2 (formerly 2A), regulatory subunit A , alpha isoform | 434902 | 31 | 28 | 19 | 2 | 10 | 18 | 1 | 0 | 2 | 0 | 4.33e-15 | 0.00052 | 0 | 0.12 | 0 | <1.00e-15 | <1.21e-12 |
| 10 | SNAP25 | synaptosomal-associated protein, 25kDa | 188638 | 7 | 7 | 7 | 2 | 3 | 1 | 2 | 0 | 1 | 0 | 0.457 | 0.64 | 0.59 | 0 | 0 | <1.00e-15 | <1.21e-12 |
| 11 | FAM118B | family with sequence similarity 118, member B | 267757 | 3 | 3 | 3 | 0 | 0 | 1 | 1 | 0 | 1 | 0 | 0.589 | 0.42 | 0.7 | 0 | 0 | <1.00e-15 | <1.21e-12 |
| 12 | TMEM55A | transmembrane protein 55A | 195925 | 3 | 3 | 3 | 0 | 0 | 2 | 0 | 0 | 1 | 0 | 0.321 | 0.52 | 0.66 | 0 | 0 | <1.00e-15 | <1.21e-12 |
| 13 | GIPC1 | GIPC PDZ domain containing family, member 1 | 168127 | 2 | 2 | 2 | 1 | 1 | 0 | 0 | 0 | 1 | 0 | 0.503 | 0.7 | 0.92 | 0 | 0 | <1.00e-15 | <1.21e-12 |
| 14 | PGRMC2 | progesterone receptor membrane component 2 | 89028 | 2 | 2 | 2 | 0 | 1 | 0 | 0 | 0 | 1 | 0 | 0.366 | 0.45 | 0.14 | 0.24 | 0 | <1.00e-15 | <1.21e-12 |
| 15 | FGFR2 | fibroblast growth factor receptor 2 (bacteria-expressed kinase, keratinocyte growth factor receptor, craniofacial dysostosis 1, Crouzon syndrome, Pfeiffer syndrome, Jackson-Weiss syndrome) | 687457 | 33 | 31 | 18 | 3 | 3 | 5 | 12 | 9 | 3 | 1 | 4.88e-15 | 0.011 | 0.011 | 0.19 | 0.016 | 2.89e-15 | 3.27e-12 |
| 16 | CTCF | CCCTC-binding factor (zinc finger protein) | 547098 | 48 | 44 | 38 | 1 | 8 | 4 | 7 | 0 | 27 | 2 | 4.66e-15 | 0.00095 | 0.012 | 0.08 | 0.022 | 3.89e-15 | 4.12e-12 |
| 17 | ARID1A | AT rich interactive domain 1A (SWI-like) | 1412380 | 93 | 83 | 78 | 5 | 2 | 7 | 5 | 1 | 64 | 14 | 2.44e-15 | 0.00015 | 0.97 | 0.82 | 1 | 8.46e-14 | 8.45e-11 |
| 18 | P2RY11 | purinergic receptor P2Y, G-protein coupled, 11 | 4342 | 7 | 9 | 9 | 2 | 1 | 4 | 0 | 1 | 1 | 0 | 6.93e-13 | 0.33 | NaN | NaN | NaN | 6.93e-13 | 6.54e-10 |
| 19 | CCND1 | cyclin D1 | 154874 | 14 | 14 | 12 | 1 | 1 | 7 | 3 | 0 | 3 | 0 | 9.00e-11 | 0.083 | 0.0009 | 0.15 | 0.0017 | 4.59e-12 | 4.10e-09 |
| 20 | CHD4 | chromodomain helicase DNA binding protein 4 | 1452335 | 43 | 35 | 38 | 2 | 16 | 16 | 7 | 0 | 3 | 1 | 1.55e-11 | 0.0045 | 0.013 | 0.59 | 0.033 | 1.50e-11 | 1.27e-08 |
| 21 | NFE2L2 | nuclear factor (erythroid-derived 2)-like 2 | 446498 | 14 | 14 | 11 | 0 | 2 | 4 | 5 | 3 | 0 | 0 | 5.99e-08 | 0.024 | 0.000092 | 0.025 | 0.000084 | 1.36e-10 | 1.10e-07 |
| 22 | SOX17 | SRY (sex determining region Y)-box 17 | 77226 | 7 | 7 | 3 | 1 | 0 | 6 | 0 | 0 | 1 | 0 | 3.67e-08 | 0.36 | 0.13 | 0.069 | 0.02 | 1.62e-08 | 1.25e-05 |
| 23 | FOXA2 | forkhead box A2 | 222670 | 12 | 12 | 12 | 1 | 1 | 2 | 2 | 0 | 7 | 0 | 1.37e-08 | 0.27 | 0.14 | 0.29 | 0.25 | 7.02e-08 | 5.18e-05 |
| 24 | FAM9A | family with sequence similarity 9, member A | 249932 | 20 | 14 | 20 | 1 | 2 | 12 | 1 | 0 | 4 | 1 | 6.77e-08 | 0.1 | 0.12 | 0.99 | 0.2 | 2.57e-07 | 0.000182 |
| 25 | LIMK2 | LIM domain kinase 2 | 575544 | 13 | 12 | 11 | 1 | 5 | 3 | 1 | 0 | 4 | 0 | 0.0196 | 0.07 | 0.000037 | 0.092 | 0.000017 | 5.42e-06 | 0.00368 |
| 26 | ING1 | inhibitor of growth family, member 1 | 255446 | 12 | 12 | 9 | 2 | 4 | 1 | 0 | 1 | 6 | 0 | 0.00229 | 0.1 | 0.00016 | 0.022 | 0.0002 | 7.07e-06 | 0.00461 |
| 27 | DNER | delta/notch-like EGF repeat containing | 485604 | 21 | 18 | 20 | 0 | 4 | 8 | 5 | 0 | 4 | 0 | 0.000107 | 0.0019 | 0.29 | 0.0026 | 0.0052 | 8.65e-06 | 0.00535 |
| 28 | MAX | MYC associated factor X | 205913 | 9 | 9 | 5 | 0 | 3 | 1 | 4 | 0 | 1 | 0 | 0.000144 | 0.1 | 0.11 | 0.0017 | 0.004 | 8.82e-06 | 0.00535 |
| 29 | ABI1 | abl-interactor 1 | 390369 | 5 | 4 | 2 | 5 | 0 | 5 | 0 | 0 | 0 | 0 | 1.000 | 1 | 8e-07 | 1 | 2.8e-06 | 3.86e-05 | 0.0226 |
| 30 | ZNF286A | zinc finger protein 286A | 389712 | 16 | 12 | 14 | 1 | 3 | 6 | 6 | 0 | 1 | 0 | 0.000884 | 0.12 | 0.0015 | 0.62 | 0.0039 | 4.72e-05 | 0.0267 |
| 31 | NRAS | neuroblastoma RAS viral (v-ras) oncogene homolog | 145328 | 9 | 9 | 6 | 2 | 1 | 4 | 3 | 0 | 1 | 0 | 0.000277 | 0.48 | 0.08 | 0.015 | 0.014 | 5.11e-05 | 0.0280 |
| 32 | TPTE | transmembrane phosphatase with tensin homology | 431520 | 32 | 15 | 28 | 3 | 8 | 10 | 8 | 1 | 5 | 0 | 0.000286 | 0.032 | 0.017 | 0.047 | 0.017 | 6.57e-05 | 0.0349 |
| 33 | ZNF267 | zinc finger protein 267 | 555952 | 22 | 16 | 19 | 1 | 10 | 5 | 3 | 1 | 3 | 0 | 1.26e-05 | 0.13 | 0.29 | 0.65 | 0.5 | 8.21e-05 | 0.0422 |
| 34 | RASA1 | RAS p21 protein activator (GTPase activating protein) 1 | 776972 | 29 | 21 | 27 | 3 | 5 | 9 | 3 | 0 | 11 | 1 | 0.000537 | 0.11 | 0.048 | 0.013 | 0.013 | 8.89e-05 | 0.0444 |
| 35 | CYLC1 | cylicin, basic protein of sperm head cytoskeleton 1 | 477704 | 27 | 18 | 27 | 2 | 0 | 16 | 7 | 0 | 4 | 0 | 1.52e-05 | 0.13 | 0.79 | 0.13 | 0.48 | 9.29e-05 | 0.0450 |
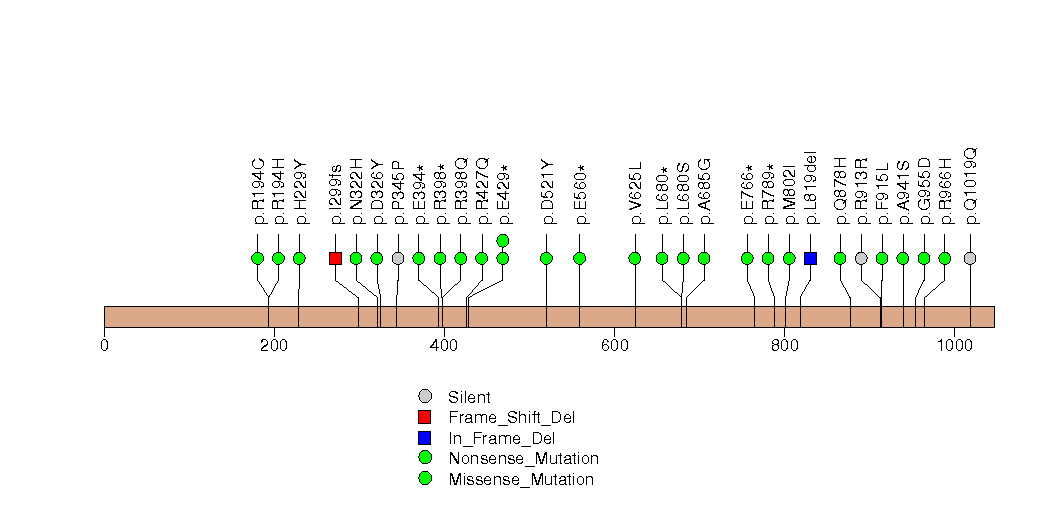
Figure S1. This figure depicts the distribution of mutations and mutation types across the FBXW7 significant gene.
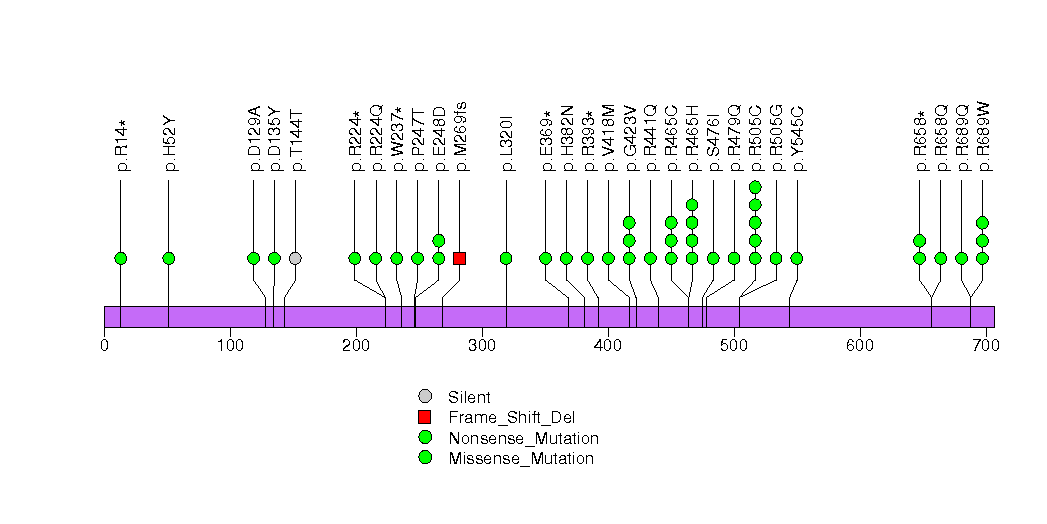
Figure S2. This figure depicts the distribution of mutations and mutation types across the SPOP significant gene.
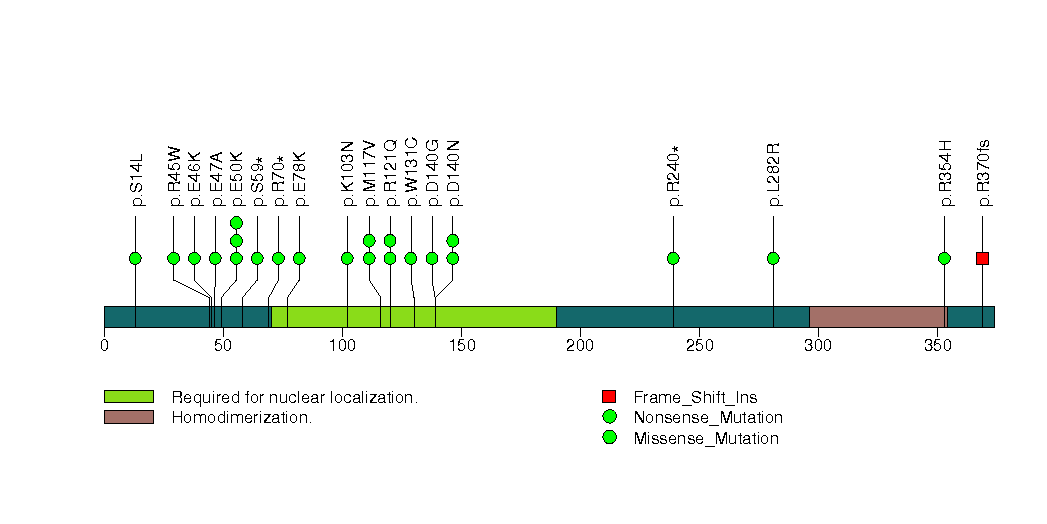
Figure S3. This figure depicts the distribution of mutations and mutation types across the PTEN significant gene.
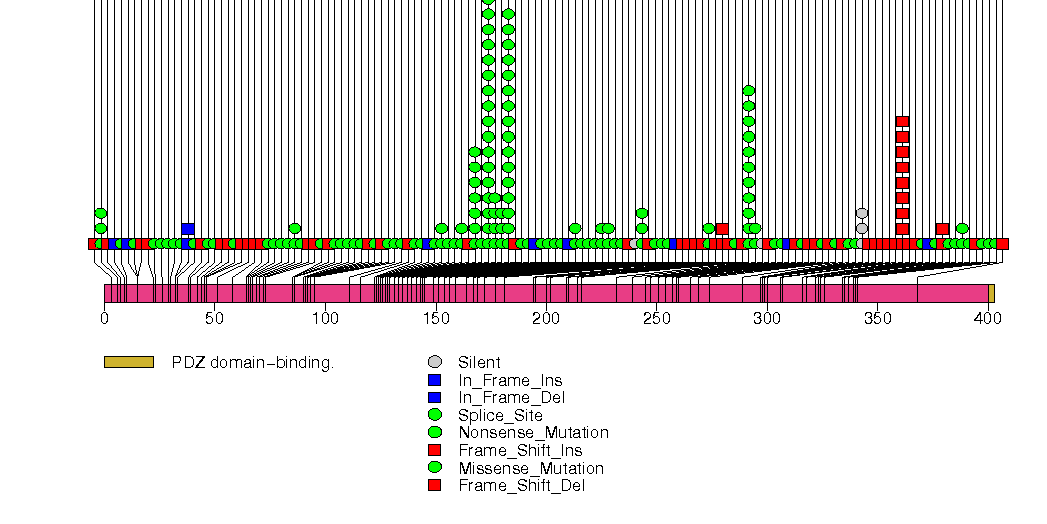
Figure S4. This figure depicts the distribution of mutations and mutation types across the PIK3CA significant gene.
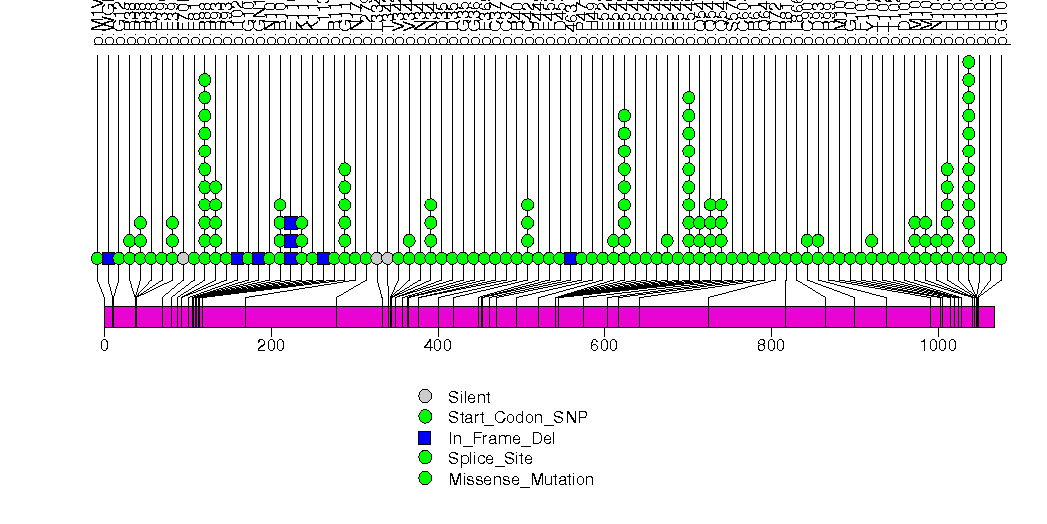
Figure S5. This figure depicts the distribution of mutations and mutation types across the PIK3R1 significant gene.
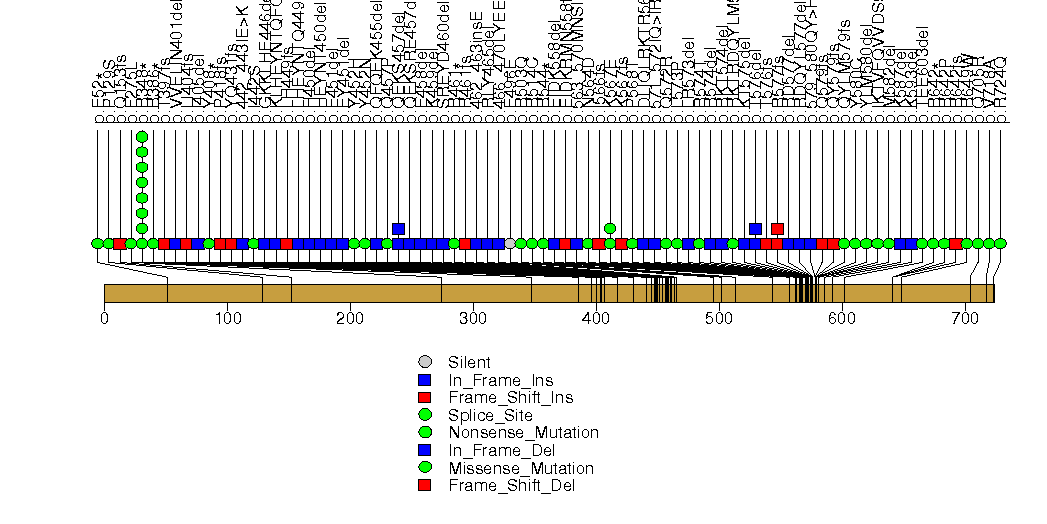
Figure S6. This figure depicts the distribution of mutations and mutation types across the CTNNB1 significant gene.
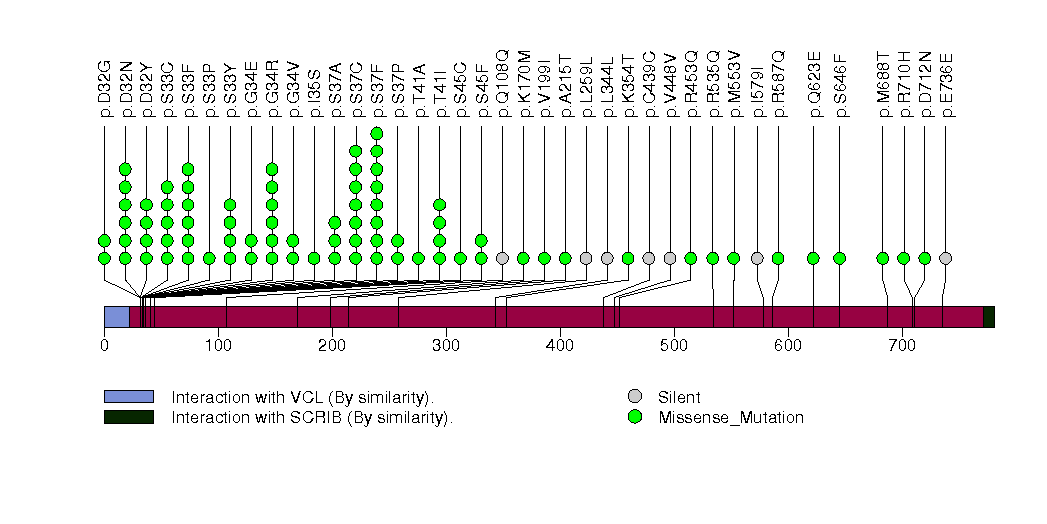
Figure S7. This figure depicts the distribution of mutations and mutation types across the TP53 significant gene.
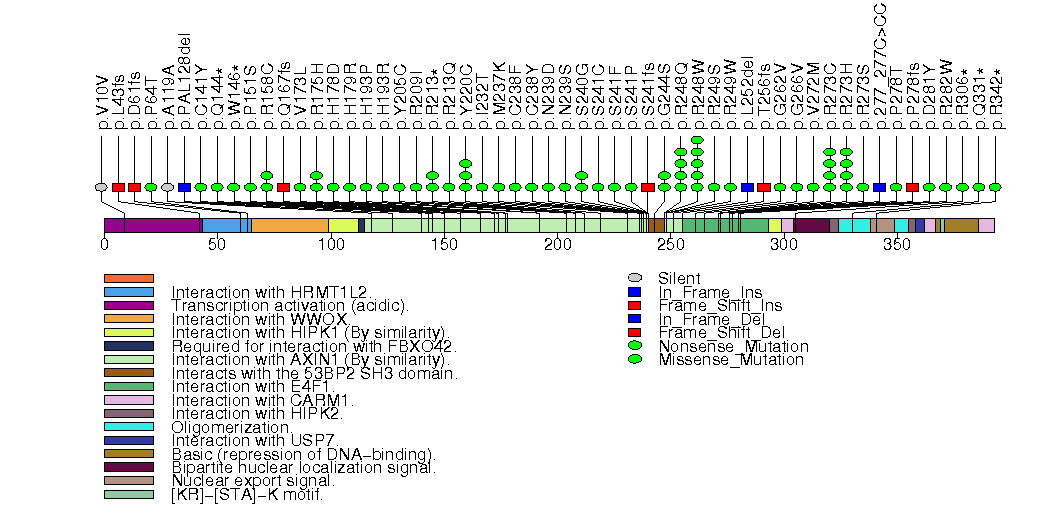
Figure S8. This figure depicts the distribution of mutations and mutation types across the KRAS significant gene.
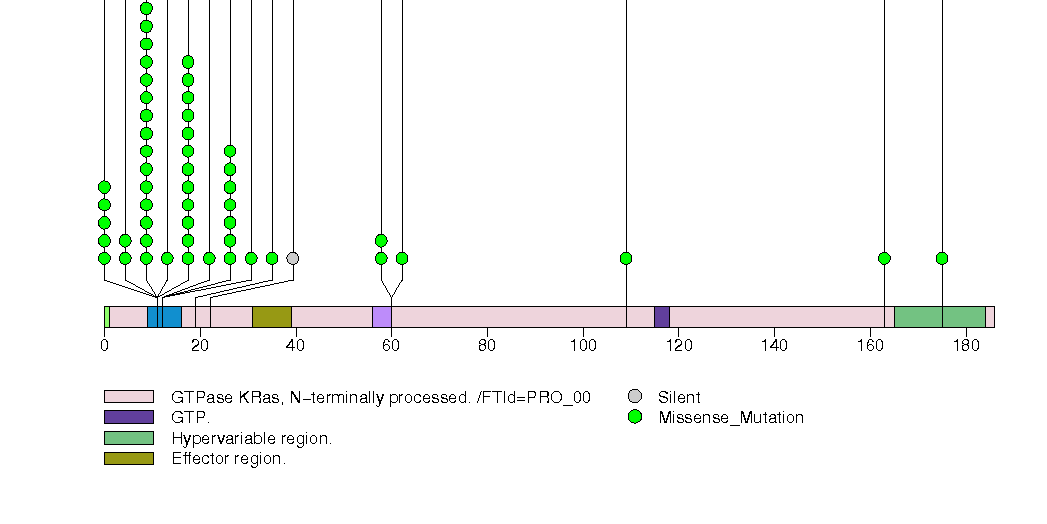
Figure S9. This figure depicts the distribution of mutations and mutation types across the PPP2R1A significant gene.
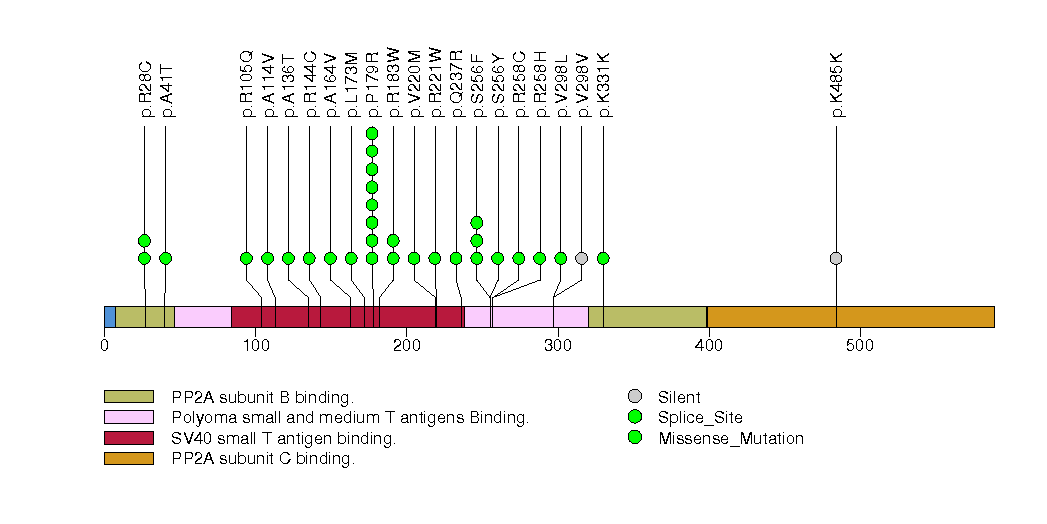
Figure S10. This figure depicts the distribution of mutations and mutation types across the SNAP25 significant gene.
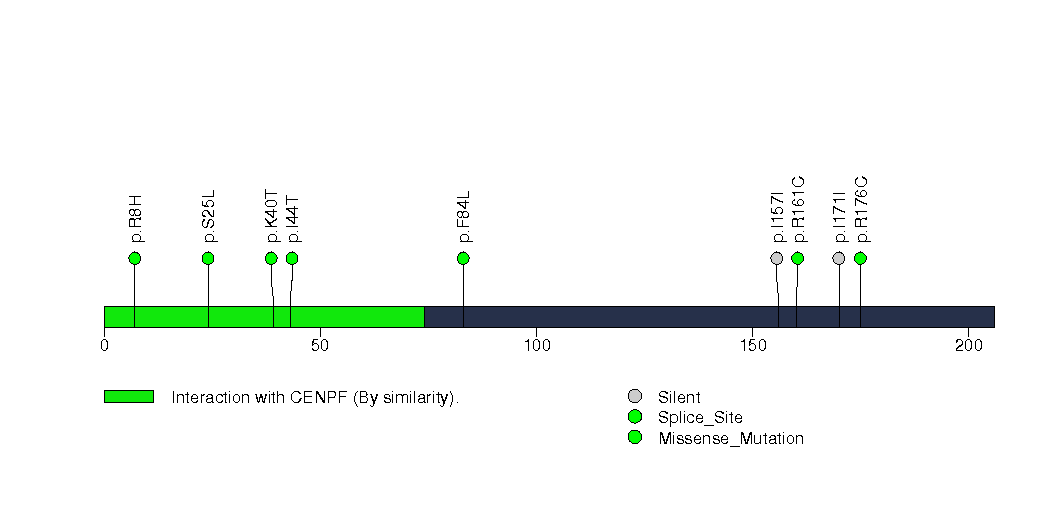
Figure S11. This figure depicts the distribution of mutations and mutation types across the FAM118B significant gene.
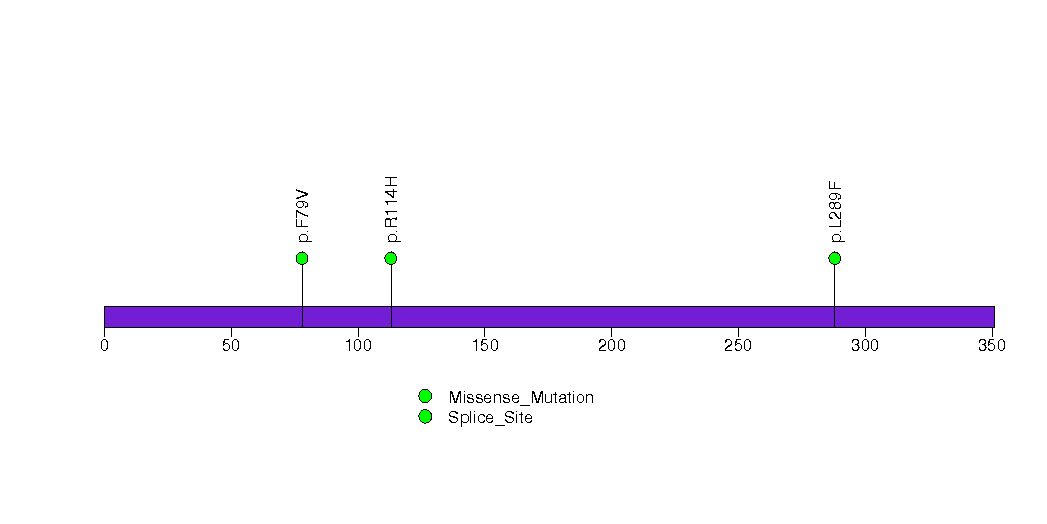
Figure S12. This figure depicts the distribution of mutations and mutation types across the TMEM55A significant gene.
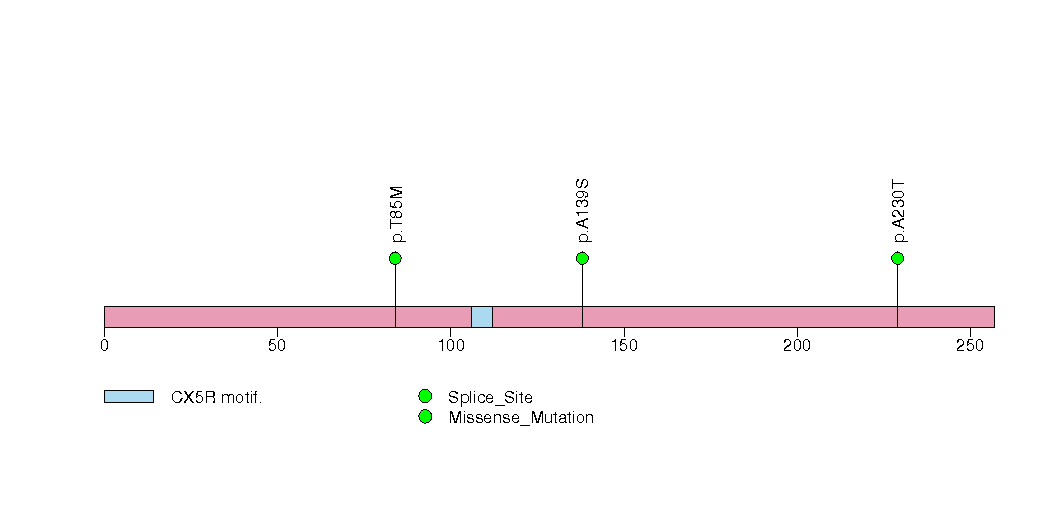
Figure S13. This figure depicts the distribution of mutations and mutation types across the GIPC1 significant gene.
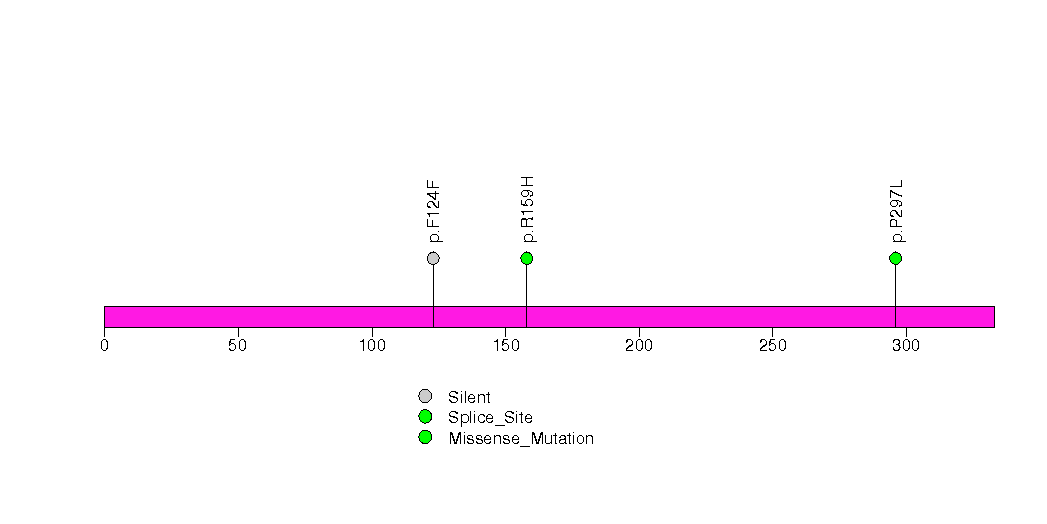
Figure S14. This figure depicts the distribution of mutations and mutation types across the PGRMC2 significant gene.
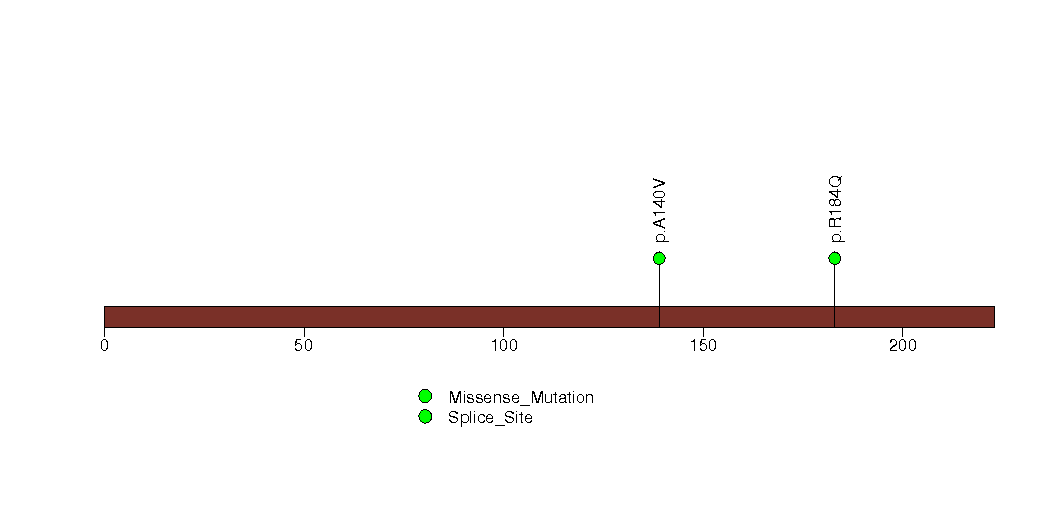
Figure S15. This figure depicts the distribution of mutations and mutation types across the FGFR2 significant gene.
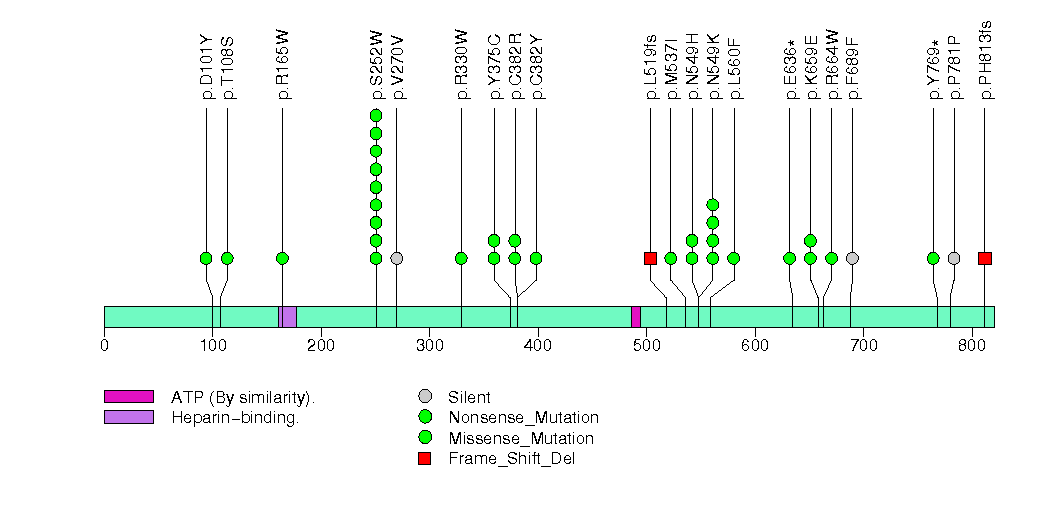
Figure S16. This figure depicts the distribution of mutations and mutation types across the CTCF significant gene.
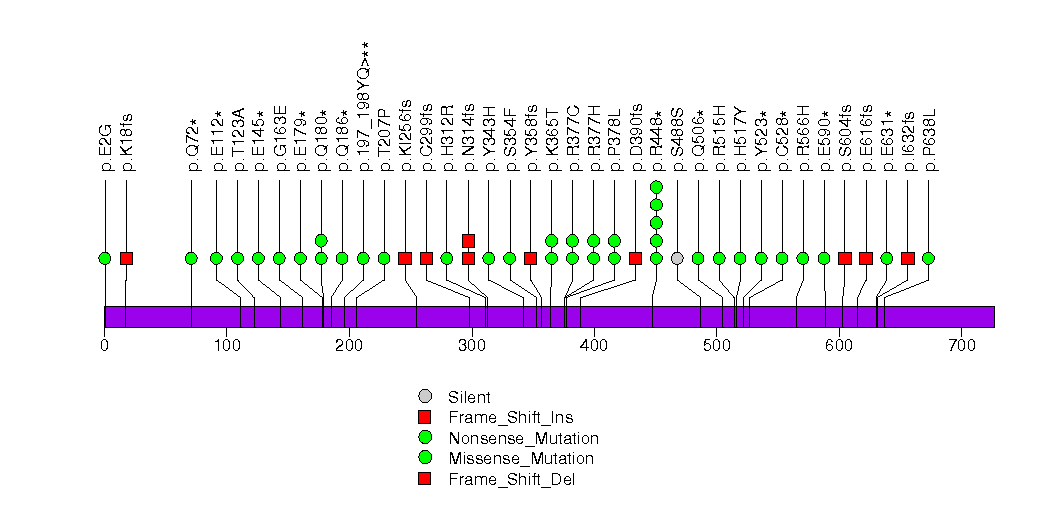
Figure S17. This figure depicts the distribution of mutations and mutation types across the ARID1A significant gene.
Figure S18. This figure depicts the distribution of mutations and mutation types across the P2RY11 significant gene.
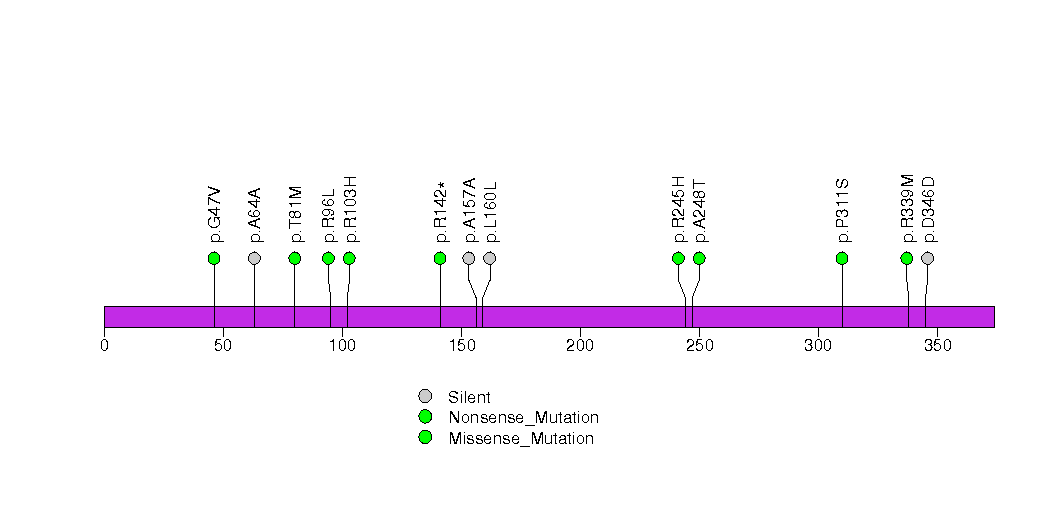
Figure S19. This figure depicts the distribution of mutations and mutation types across the CCND1 significant gene.
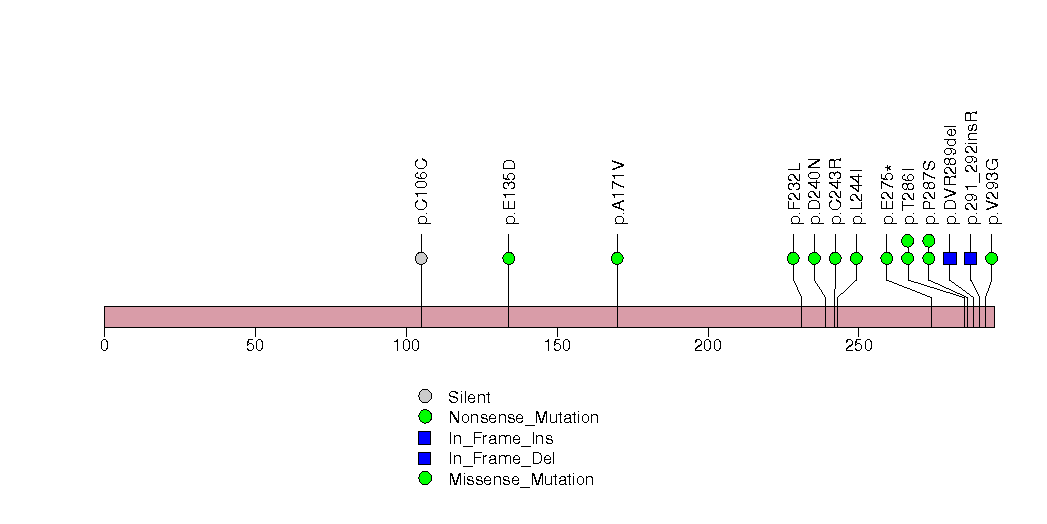
Figure S20. This figure depicts the distribution of mutations and mutation types across the CHD4 significant gene.
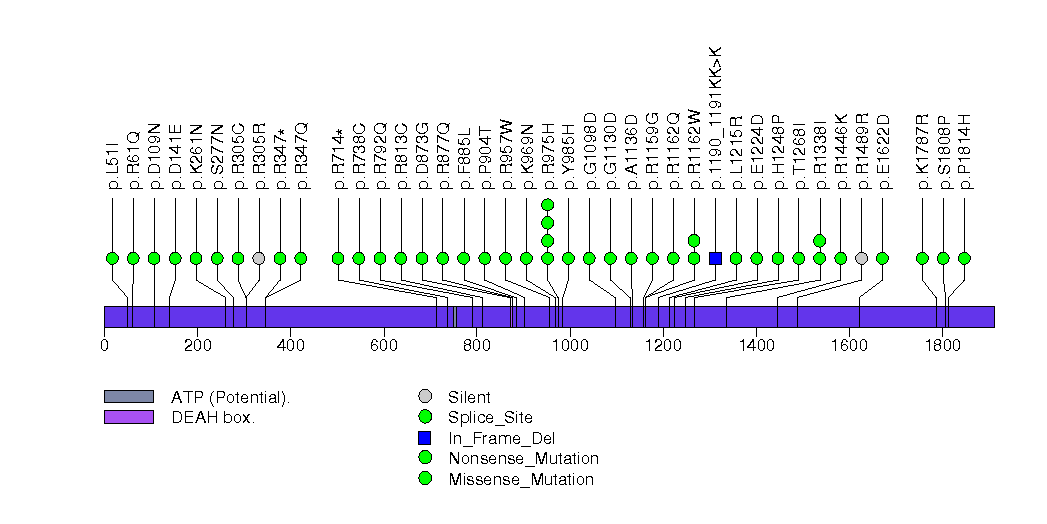
Figure S21. This figure depicts the distribution of mutations and mutation types across the NFE2L2 significant gene.
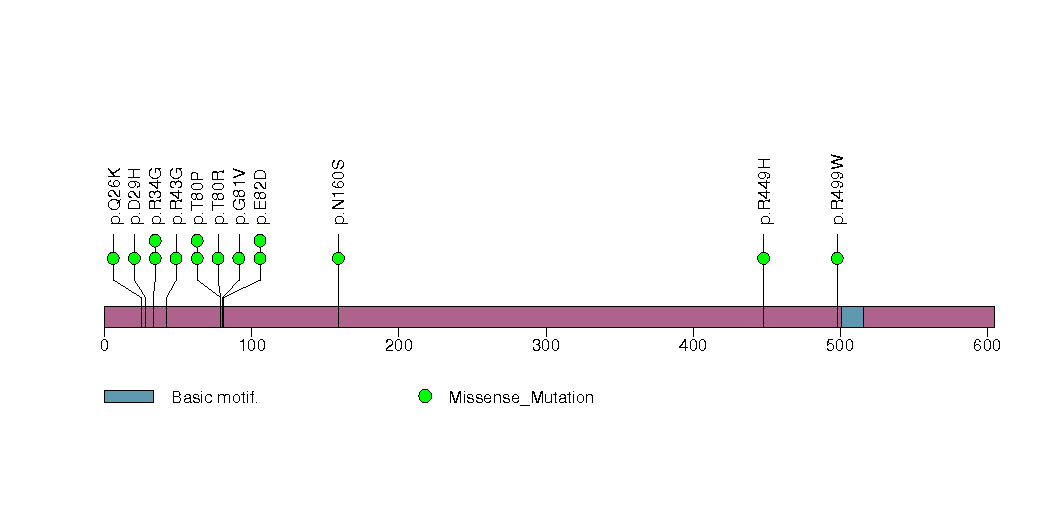
Figure S22. This figure depicts the distribution of mutations and mutation types across the SOX17 significant gene.
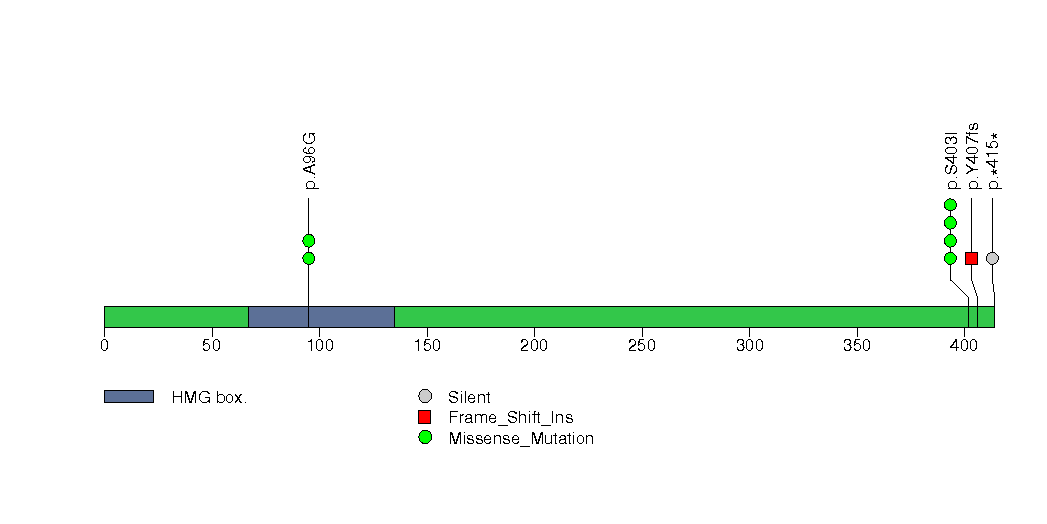
Figure S23. This figure depicts the distribution of mutations and mutation types across the FOXA2 significant gene.
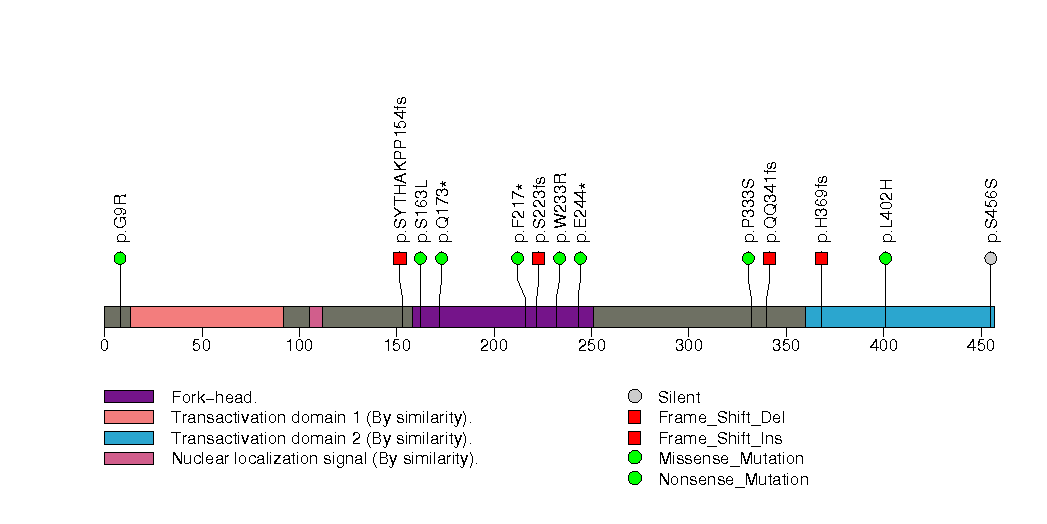
Figure S24. This figure depicts the distribution of mutations and mutation types across the FAM9A significant gene.
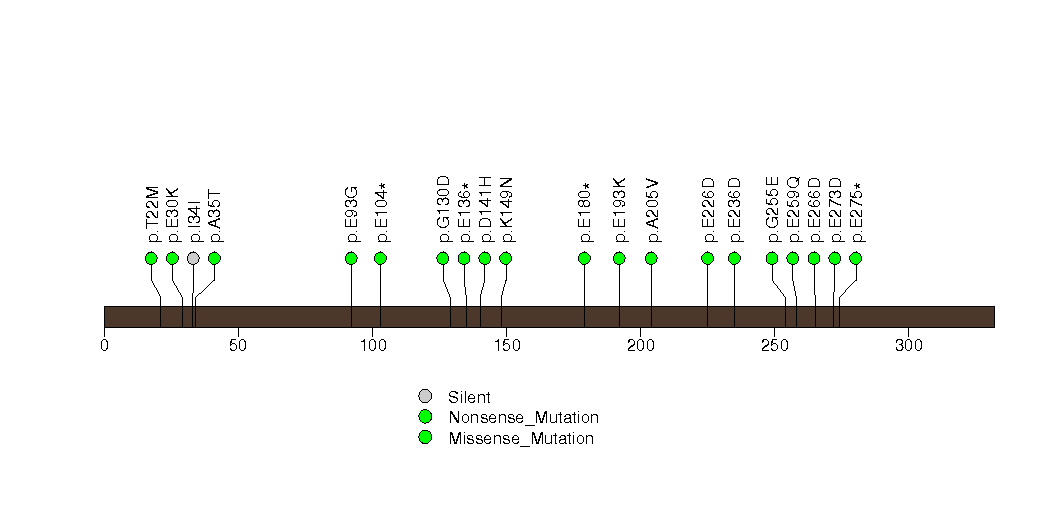
Figure S25. This figure depicts the distribution of mutations and mutation types across the LIMK2 significant gene.
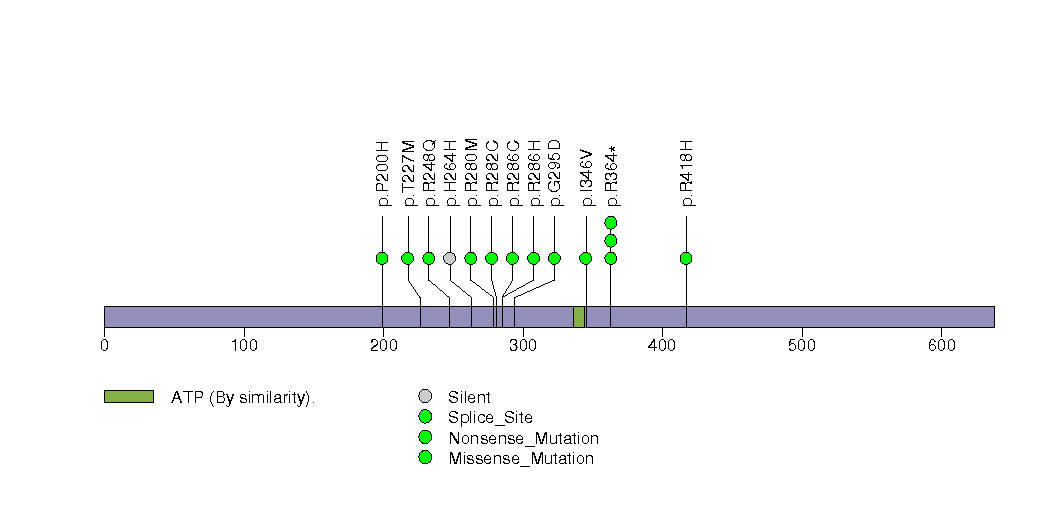
Figure S26. This figure depicts the distribution of mutations and mutation types across the ING1 significant gene.
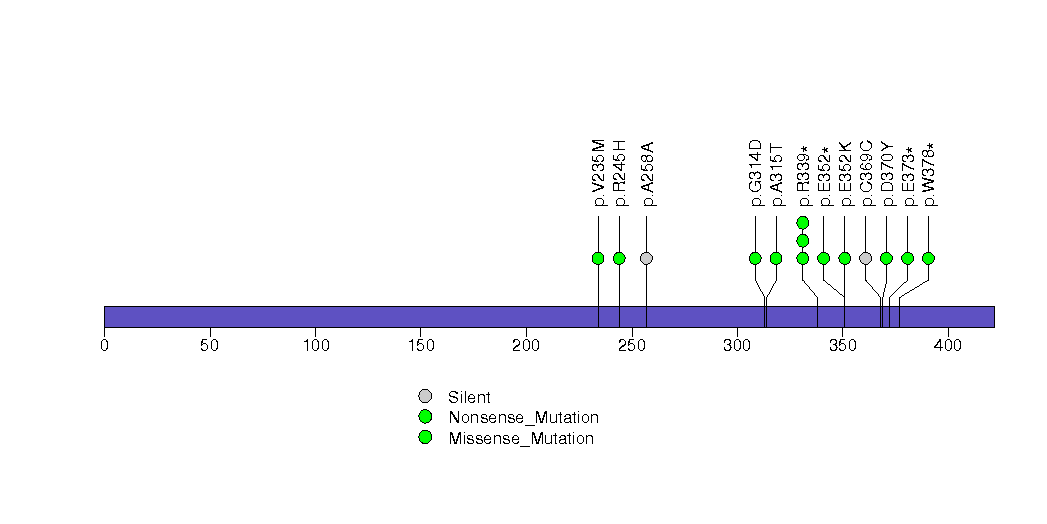
Figure S27. This figure depicts the distribution of mutations and mutation types across the DNER significant gene.
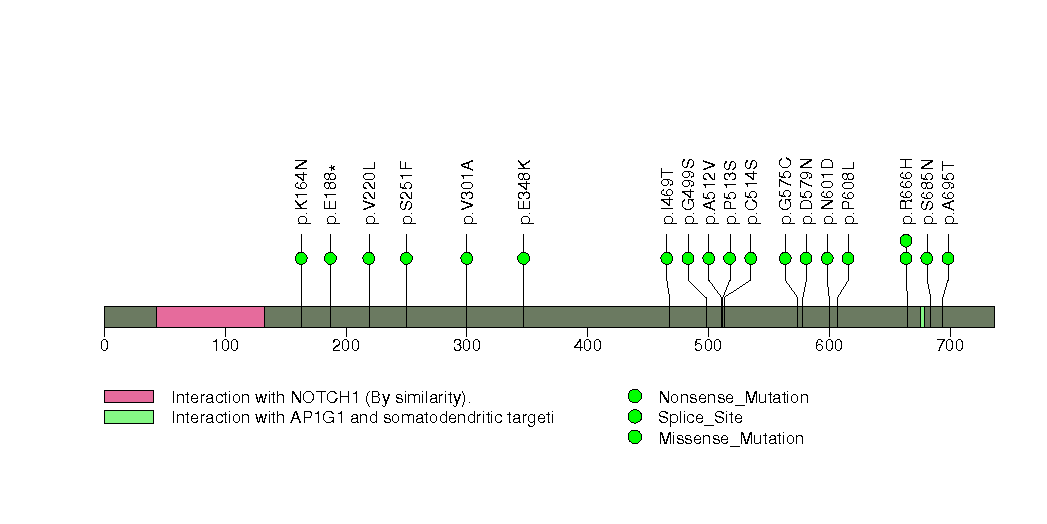
Figure S28. This figure depicts the distribution of mutations and mutation types across the MAX significant gene.
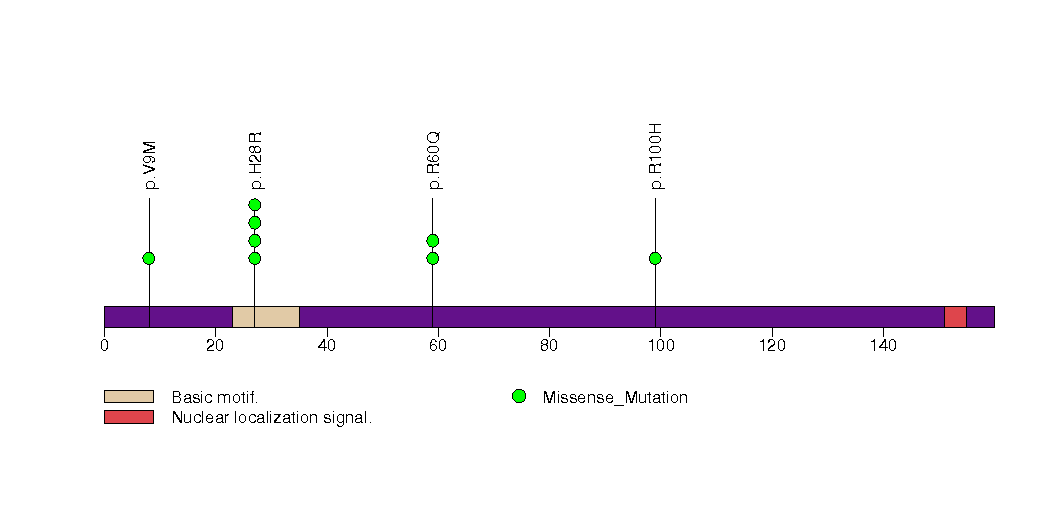
Figure S29. This figure depicts the distribution of mutations and mutation types across the ABI1 significant gene.
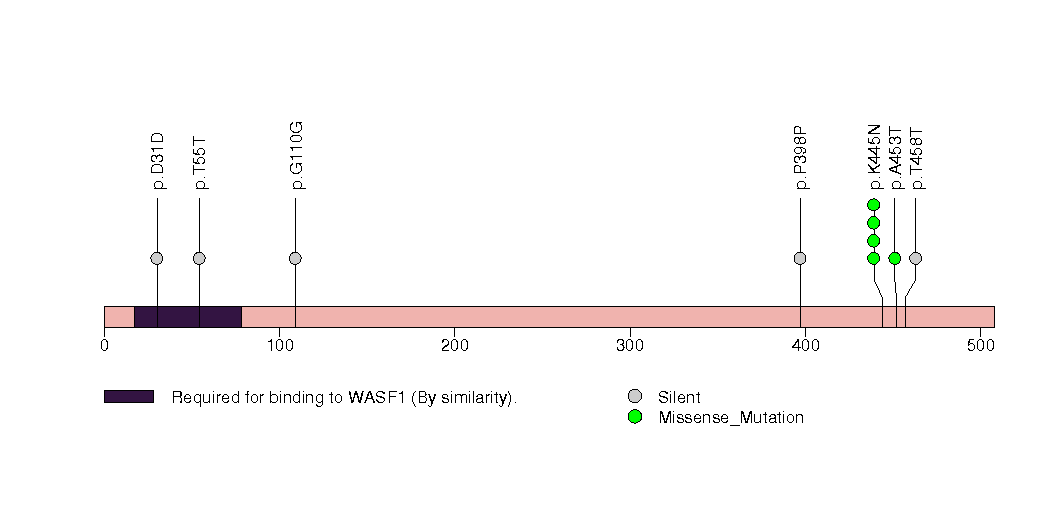
Figure S30. This figure depicts the distribution of mutations and mutation types across the ZNF286A significant gene.
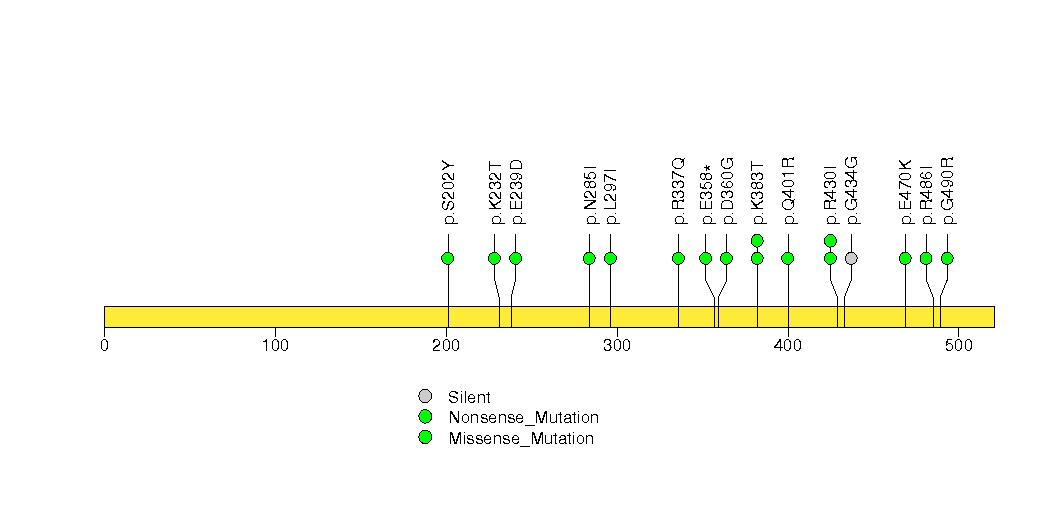
Figure S31. This figure depicts the distribution of mutations and mutation types across the NRAS significant gene.
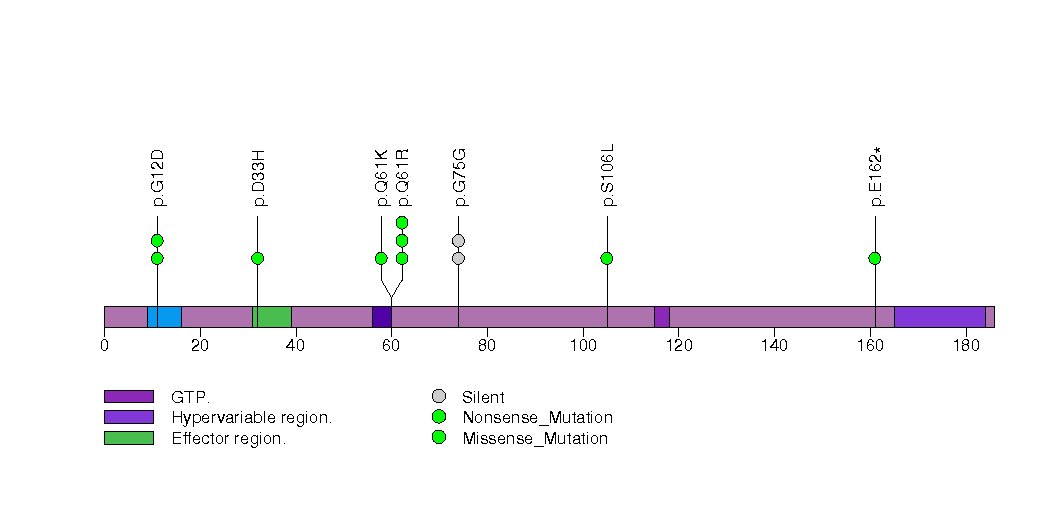
Figure S32. This figure depicts the distribution of mutations and mutation types across the TPTE significant gene.
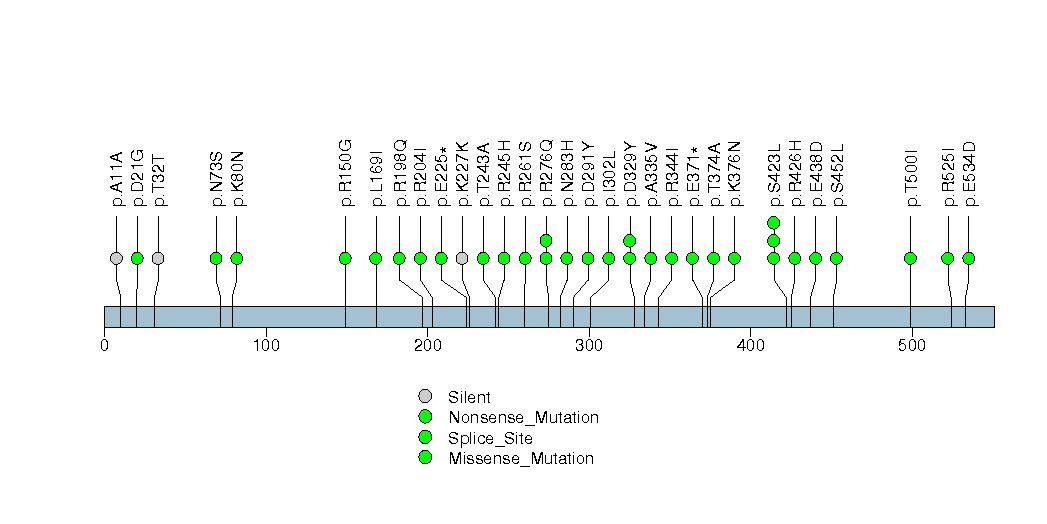
Figure S33. This figure depicts the distribution of mutations and mutation types across the ZNF267 significant gene.
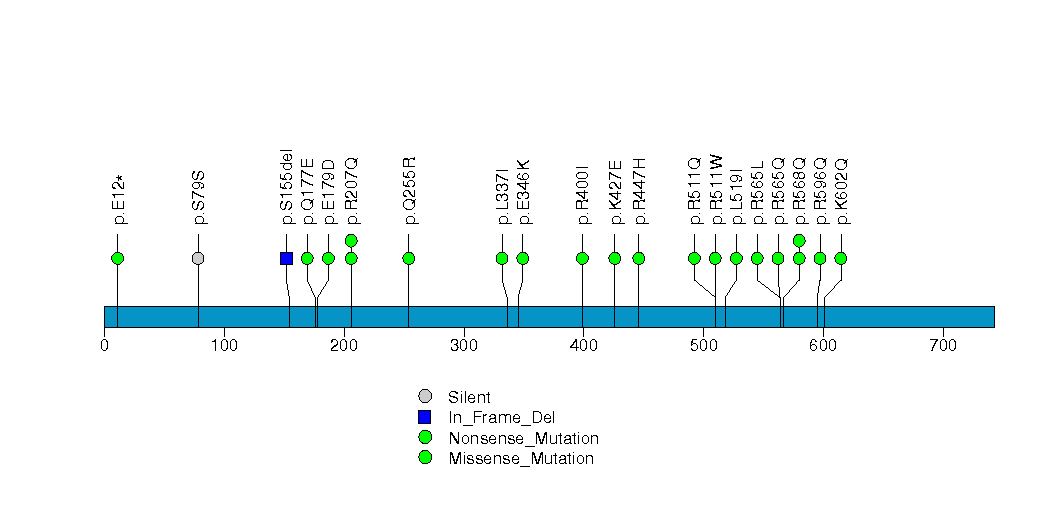
Figure S34. This figure depicts the distribution of mutations and mutation types across the RASA1 significant gene.
In this analysis, COSMIC is used as a filter to increase power by restricting the territory of each gene. Cosmic version: v48.
Table 4. Get Full Table Significantly mutated genes (COSMIC territory only). To access the database please go to: COSMIC. Number of significant genes found: 41. Number of genes displayed: 10
| rank | gene | description | n | cos | n_cos | N_cos | cos_ev | p | q |
|---|---|---|---|---|---|---|---|---|---|
| 1 | PTEN | phosphatase and tensin homolog (mutated in multiple advanced cancers 1) | 227 | 767 | 218 | 190216 | 14940 | 0 | 0 |
| 2 | PIK3R1 | phosphoinositide-3-kinase, regulatory subunit 1 (alpha) | 99 | 33 | 39 | 8184 | 111 | 3.3e-13 | 5.3e-10 |
| 3 | FGFR2 | fibroblast growth factor receptor 2 (bacteria-expressed kinase, keratinocyte growth factor receptor, craniofacial dysostosis 1, Crouzon syndrome, Pfeiffer syndrome, Jackson-Weiss syndrome) | 33 | 51 | 24 | 12648 | 113 | 4.8e-13 | 5.3e-10 |
| 4 | KRAS | v-Ki-ras2 Kirsten rat sarcoma viral oncogene homolog | 52 | 52 | 49 | 12896 | 556649 | 4.8e-13 | 5.3e-10 |
| 5 | FBXW7 | F-box and WD repeat domain containing 7 | 44 | 91 | 29 | 22568 | 852 | 7.2e-13 | 5.4e-10 |
| 6 | CTNNB1 | catenin (cadherin-associated protein), beta 1, 88kDa | 80 | 138 | 67 | 34224 | 23813 | 8.9e-13 | 5.4e-10 |
| 7 | TP53 | tumor protein p53 | 74 | 356 | 72 | 88288 | 24186 | 9e-13 | 5.4e-10 |
| 8 | PIK3CA | phosphoinositide-3-kinase, catalytic, alpha polypeptide | 172 | 220 | 150 | 54560 | 35669 | 9.9e-13 | 5.4e-10 |
| 9 | NRAS | neuroblastoma RAS viral (v-ras) oncogene homolog | 9 | 33 | 6 | 8184 | 6490 | 1e-08 | 4.8e-06 |
| 10 | RB1 | retinoblastoma 1 (including osteosarcoma) | 26 | 267 | 11 | 66216 | 30 | 4e-08 | 0.000017 |
Note:
n - number of (nonsilent) mutations in this gene across the individual set.
cos = number of unique mutated sites in this gene in COSMIC
n_cos = overlap between n and cos.
N_cos = number of individuals times cos.
cos_ev = total evidence: number of reports in COSMIC for mutations seen in this gene.
p = p-value for seeing the observed amount of overlap in this gene)
q = q-value, False Discovery Rate (Benjamini-Hochberg procedure)
Table 5. Get Full Table A Ranked List of Significantly Mutated Genesets. (Source: MSigDB GSEA Cannonical Pathway Set).Number of significant genesets found: 70. Number of genesets displayed: 10
| rank | geneset | description | genes | N_genes | mut_tally | N | n | npat | nsite | nsil | n1 | n2 | n3 | n4 | n5 | n6 | p_ns_s | p | q |
|---|---|---|---|---|---|---|---|---|---|---|---|---|---|---|---|---|---|---|---|
| 1 | IGF1MTORPATHWAY | Growth factor IGF-1 activates AKT, Gsk3-beta, and mTOR to promote muscle hypertrophy. | AKT1, EIF2B5, EIF2S1, EIF2S2, EIF2S3, EIF4E, EIF4EBP1, FRAP1, GSK3B, IGF1, IGF1R, INPPL1, PDK2, PDPK1, PIK3CA, PIK3R1, PPP2CA, PTEN, RPS6, RPS6KB1 | 19 | AKT1(4), EIF2B5(5), EIF2S1(2), EIF2S2(9), EIF2S3(6), EIF4E(1), GSK3B(13), IGF1(5), IGF1R(13), INPPL1(18), PDK2(4), PDPK1(3), PIK3CA(172), PIK3R1(99), PPP2CA(6), PTEN(227), RPS6(7), RPS6KB1(3) | 7138255 | 597 | 217 | 382 | 44 | 78 | 118 | 113 | 40 | 206 | 42 | <1.00e-15 | <1.00e-15 | <4.41e-14 |
| 2 | GSK3PATHWAY | Bacterial lipopolysaccharide activates AKT to promote the survival and activation of macrophages and inhibits Gsk3-beta to promote beta-catenin accumulation in the nucleus. | AKT1, APC, AXIN1, CCND1, CD14, CTNNB1, DVL1, FZD1, GJA1, GNAI1, GSK3B, IRAK1, LBP, LEF1, LY96, MYD88, NFKB1, PDPK1, PIK3CA, PIK3R1, PPP2CA, PRKR, RELA, TIRAP, TLR4, TOLLIP, WNT1 | 26 | AKT1(4), APC(56), AXIN1(9), CCND1(14), CD14(2), CTNNB1(80), DVL1(3), FZD1(3), GJA1(5), GNAI1(5), GSK3B(13), IRAK1(4), LBP(3), LEF1(8), LY96(4), MYD88(2), NFKB1(10), PDPK1(3), PIK3CA(172), PIK3R1(99), PPP2CA(6), RELA(6), TIRAP(2), TLR4(17), TOLLIP(1), WNT1(1) | 10634125 | 532 | 210 | 352 | 57 | 77 | 194 | 121 | 6 | 115 | 19 | 1.24e-13 | <1.00e-15 | <4.41e-14 |
| 3 | SA_PTEN_PATHWAY | PTEN is a tumor suppressor that dephosphorylates the lipid messenger phosphatidylinositol triphosphate. | AKT1, AKT2, AKT3, BPNT1, GRB2, ILK, MAPK1, MAPK3, PDK1, PIK3CA, PIK3CD, PIP3-E, PTEN, PTK2B, RBL2, SHC1, SOS1 | 16 | AKT1(4), AKT2(6), AKT3(11), BPNT1(3), GRB2(3), ILK(5), MAPK1(2), MAPK3(3), PDK1(2), PIK3CA(172), PIK3CD(12), PTEN(227), PTK2B(15), RBL2(19), SHC1(6), SOS1(13) | 7243620 | 503 | 208 | 305 | 39 | 89 | 116 | 107 | 36 | 127 | 28 | <1.00e-15 | <1.00e-15 | <4.41e-14 |
| 4 | IL2RBPATHWAY | The beta subunit of the IL-2 receptor is required for IL-2 and IL-15 signal recognition and activates JAK kinase on ligand binding. | AKT1, BAD, BCL2, BCL2L1, CBL, CFLAR, CRKL, E2F1, FOS, GRB2, HRAS, IL2RA, IL2RB, IL2RG, IRS1, JAK1, JAK3, MAPK1, MAPK3, MYC, NMI, PIK3CA, PIK3R1, PPIA, PTPN6, RAF1, RPS6KB1, SHC1, SOCS1, SOCS3, SOS1, STAT5A, STAT5B, SYK, TNFRSF6, TNFSF6, ZNFN1A3 | 33 | AKT1(4), BAD(1), BCL2L1(4), CBL(12), CFLAR(2), CRKL(6), E2F1(9), FOS(3), GRB2(3), HRAS(1), IL2RA(4), IL2RB(3), IL2RG(11), IRS1(13), JAK1(20), JAK3(10), MAPK1(2), MAPK3(3), MYC(8), NMI(3), PIK3CA(172), PIK3R1(99), PPIA(1), PTPN6(5), RAF1(9), RPS6KB1(3), SHC1(6), SOS1(13), STAT5A(5), STAT5B(7), SYK(4) | 12777577 | 446 | 203 | 323 | 55 | 81 | 126 | 119 | 5 | 100 | 15 | 8.83e-10 | <1.00e-15 | <4.41e-14 |
| 5 | BADPATHWAY | When phosphorylated, BAD is inhibited by sequestration; when non-phosphorylated, it promotes apoptosis by inactivating pro-survival BCL-XL and BCL-2. | ADCY1, AKT1, BAD, BAX, BCL2, BCL2L1, CSF2RB, IGF1, IGF1R, IL3, IL3RA, KIT, KITLG, PIK3CA, PIK3R1, PRKACB, PRKACG, PRKAR1A, PRKAR1B, PRKAR2A, PRKAR2B, YWHAH | 22 | ADCY1(21), AKT1(4), BAD(1), BAX(2), BCL2L1(4), CSF2RB(14), IGF1(5), IGF1R(13), IL3(2), IL3RA(9), KIT(23), KITLG(3), PIK3CA(172), PIK3R1(99), PRKACB(3), PRKACG(9), PRKAR1A(4), PRKAR1B(4), PRKAR2A(4), PRKAR2B(3), YWHAH(3) | 7856210 | 402 | 200 | 282 | 53 | 73 | 110 | 106 | 6 | 91 | 16 | 9.92e-09 | <1.00e-15 | <4.41e-14 |
| 6 | CREBPATHWAY | CREB is a transcription factor that binds to cAMP-responsive elements (CREs) to activate transcription in response to extracellular signaling. | ADCY1, AKT1, CAMK2A, CAMK2B, CAMK2D, CAMK2G, CREB1, GNAS, GRB2, HRAS, MAPK1, MAPK14, MAPK3, PIK3CA, PIK3R1, PRKACB, PRKACG, PRKAR1A, PRKAR1B, PRKAR2A, PRKAR2B, PRKCA, PRKCB1, RAC1, RPS6KA1, RPS6KA5, SOS1 | 26 | ADCY1(21), AKT1(4), CAMK2A(9), CAMK2B(4), CAMK2D(5), CAMK2G(5), CREB1(5), GNAS(24), GRB2(3), HRAS(1), MAPK1(2), MAPK14(4), MAPK3(3), PIK3CA(172), PIK3R1(99), PRKACB(3), PRKACG(9), PRKAR1A(4), PRKAR1B(4), PRKAR2A(4), PRKAR2B(3), PRKCA(11), RAC1(1), RPS6KA1(1), RPS6KA5(11), SOS1(13) | 10330216 | 425 | 200 | 300 | 50 | 88 | 106 | 110 | 5 | 100 | 16 | 3.43e-09 | <1.00e-15 | <4.41e-14 |
| 7 | EGFPATHWAY | The epidermal growth factor (EGF) peptide stimulates the EGF receptor to promote cell proliferation via the MAP kinase and Ras pathways. | CSNK2A1, EGF, EGFR, ELK1, FOS, GRB2, HRAS, JAK1, JUN, MAP2K1, MAP2K4, MAP3K1, MAPK3, MAPK8, PIK3CA, PIK3R1, PLCG1, PRKCA, PRKCB1, RAF1, RASA1, SHC1, SOS1, SRF, STAT1, STAT3, STAT5A | 26 | CSNK2A1(9), EGF(19), EGFR(12), ELK1(3), FOS(3), GRB2(3), HRAS(1), JAK1(20), JUN(1), MAP2K1(2), MAP2K4(9), MAP3K1(30), MAPK3(3), MAPK8(11), PIK3CA(172), PIK3R1(99), PLCG1(12), PRKCA(11), RAF1(9), RASA1(29), SHC1(6), SOS1(13), SRF(3), STAT1(15), STAT3(11), STAT5A(5) | 13675029 | 511 | 200 | 380 | 56 | 97 | 136 | 129 | 4 | 128 | 17 | 2.51e-12 | <1.00e-15 | <4.41e-14 |
| 8 | HCMVPATHWAY | Cytomegalovirus activates MAP kinase pathways in the host cell, inducing transcription of viral genes. | AKT1, CREB1, MAP2K1, MAP2K2, MAP2K3, MAP2K6, MAP3K1, MAPK1, MAPK14, MAPK3, NFKB1, PIK3CA, PIK3R1, RB1, RELA, SP1 | 16 | AKT1(4), CREB1(5), MAP2K1(2), MAP2K2(5), MAP2K3(7), MAP2K6(10), MAP3K1(30), MAPK1(2), MAPK14(4), MAPK3(3), NFKB1(10), PIK3CA(172), PIK3R1(99), RB1(26), RELA(6), SP1(7) | 7166136 | 392 | 200 | 270 | 30 | 61 | 104 | 106 | 4 | 98 | 19 | 1.13e-12 | <1.00e-15 | <4.41e-14 |
| 9 | TRKAPATHWAY | Nerve growth factor (NGF) promotes neuronal survival and proliferation by binding its receptor TrkA, which activates PI3K/AKT, Ras, and the MAP kinase pathway. | AKT1, DPM2, GRB2, HRAS, KLK2, NGFB, NTRK1, PIK3CA, PIK3R1, PLCG1, PRKCA, PRKCB1, SHC1, SOS1 | 12 | AKT1(4), DPM2(1), GRB2(3), HRAS(1), KLK2(2), NTRK1(13), PIK3CA(172), PIK3R1(99), PLCG1(12), PRKCA(11), SHC1(6), SOS1(13) | 5625851 | 337 | 198 | 214 | 28 | 53 | 88 | 94 | 4 | 83 | 15 | 6.65e-10 | <1.00e-15 | <4.41e-14 |
| 10 | RASPATHWAY | Ras activation stimulates many signaling cascades, including PI3K/AKT activation to inhibit apoptosis. | AKT1, ARHA, BAD, BCL2L1, CASP9, CDC42, CHUK, ELK1, H2AFX, HRAS, MAP2K1, MAPK3, MLLT7, NFKB1, PIK3CA, PIK3R1, RAC1, RAF1, RALA, RALBP1, RALGDS, RELA, RHOA | 21 | AKT1(4), BAD(1), BCL2L1(4), CASP9(3), CDC42(3), CHUK(8), ELK1(3), H2AFX(1), HRAS(1), MAP2K1(2), MAPK3(3), NFKB1(10), PIK3CA(172), PIK3R1(99), RAC1(1), RAF1(9), RALA(6), RALBP1(6), RALGDS(9), RELA(6), RHOA(3) | 6942603 | 354 | 197 | 233 | 27 | 56 | 99 | 94 | 4 | 84 | 17 | 2.14e-12 | <1.00e-15 | <4.41e-14 |
Table 6. Get Full Table A Ranked List of Significantly Mutated Genesets (Excluding Significantly Mutated Genes). Number of significant genesets found: 0. Number of genesets displayed: 10
| rank | geneset | description | genes | N_genes | mut_tally | N | n | npat | nsite | nsil | n1 | n2 | n3 | n4 | n5 | n6 | p_ns_s | p | q |
|---|---|---|---|---|---|---|---|---|---|---|---|---|---|---|---|---|---|---|---|
| 1 | HSA00627_1,4_DICHLOROBENZENE_DEGRADATION | Genes involved in 1,4-dichlorobenzene degradation | CMBL | 1 | CMBL(3) | 187727 | 3 | 3 | 3 | 1 | 0 | 1 | 0 | 1 | 1 | 0 | 0.81 | 0.2 | 1 |
| 2 | LDLPATHWAY | Low density lipoproteins (LDL) are present in blood plasma, contain cholesterol and triglycerides, and contribute to atherogenic plaque formation. | ACAT1, CCL2, CSF1, IL6, LDLR, LPL | 6 | ACAT1(6), CSF1(6), IL6(5), LDLR(7), LPL(16) | 1914084 | 40 | 24 | 40 | 6 | 10 | 15 | 9 | 0 | 6 | 0 | 0.025 | 0.25 | 1 |
| 3 | TCAPOPTOSISPATHWAY | HIV infection upregulates Fas ligand in macrophages and CD4 in helper T cells, leading to widespread Fas-induced T cell apoptosis. | CCR5, CD28, CD3D, CD3E, CD3G, CD3Z, CD4, TNFRSF6, TNFSF6, TRA@, TRB@ | 6 | CCR5(6), CD28(3), CD3D(6), CD3E(2), CD3G(3), CD4(6) | 1210424 | 26 | 16 | 26 | 5 | 2 | 17 | 0 | 0 | 7 | 0 | 0.16 | 0.26 | 1 |
| 4 | HSA00472_D_ARGININE_AND_D_ORNITHINE_METABOLISM | Genes involved in D-arginine and D-ornithine metabolism | DAO | 1 | DAO(8) | 264662 | 8 | 6 | 8 | 1 | 2 | 4 | 2 | 0 | 0 | 0 | 0.3 | 0.31 | 1 |
| 5 | TCRMOLECULE | T Cell Receptor and CD3 Complex | CD3D, CD3E, CD3G, CD3Z, TRA@, TRB@ | 3 | CD3D(6), CD3E(2), CD3G(3) | 433293 | 11 | 7 | 11 | 1 | 1 | 7 | 0 | 0 | 3 | 0 | 0.18 | 0.4 | 1 |
| 6 | P27PATHWAY | p27 blocks the G1/S transition by inhibiting the checkpoint kinase cdk2/cyclin E and is inhibited by cdk2-mediated ubiquitination. | CCNE1, CDK2, CDKN1B, CKS1B, CUL1, E2F1, NEDD8, RB1, RBX1, SKP1A, SKP2, TFDP1, UBE2M | 12 | CCNE1(6), CDK2(2), CDKN1B(7), CKS1B(1), CUL1(13), E2F1(9), RB1(26), RBX1(1), SKP2(6), TFDP1(13) | 3169643 | 84 | 38 | 82 | 17 | 26 | 25 | 17 | 0 | 13 | 3 | 0.029 | 0.43 | 1 |
| 7 | HSA00643_STYRENE_DEGRADATION | Genes involved in styrene degradation | FAH, GSTZ1, HGD | 3 | FAH(6), GSTZ1(5), HGD(4) | 822142 | 15 | 12 | 15 | 2 | 5 | 4 | 4 | 0 | 2 | 0 | 0.11 | 0.46 | 1 |
| 8 | PEPIPATHWAY | Proepithelin (PEPI) induces epithelial cells to secrete IL-8, which promotes elastase secretion by neutrophils. | ELA1, ELA2, ELA2A, ELA2B, ELA3B, GRN, IL8, SLPI | 3 | GRN(5), SLPI(2) | 572860 | 7 | 7 | 6 | 0 | 1 | 4 | 2 | 0 | 0 | 0 | 0.15 | 0.52 | 1 |
| 9 | HSA00031_INOSITOL_METABOLISM | Genes involved in inositol metabolism | ALDH6A1, TPI1 | 2 | ALDH6A1(6), TPI1(2) | 582980 | 8 | 7 | 8 | 1 | 0 | 3 | 1 | 0 | 4 | 0 | 0.27 | 0.53 | 1 |
| 10 | HSA00401_NOVOBIOCIN_BIOSYNTHESIS | Genes involved in novobiocin biosynthesis | GOT1, GOT2, TAT | 3 | GOT1(9), GOT2(3), TAT(7) | 959929 | 19 | 13 | 19 | 2 | 6 | 6 | 5 | 1 | 1 | 0 | 0.088 | 0.56 | 1 |
In brief, we tabulate the number of mutations and the number of covered bases for each gene. The counts are broken down by mutation context category: four context categories that are discovered by MutSig, and one for indel and 'null' mutations, which include indels, nonsense mutations, splice-site mutations, and non-stop (read-through) mutations. For each gene, we calculate the probability of seeing the observed constellation of mutations, i.e. the product P1 x P2 x ... x Pm, or a more extreme one, given the background mutation rates calculated across the dataset. [1]
In addition to the links below, the full results of the analysis summarized in this report can also be downloaded programmatically using firehose_get, or interactively from either the Broad GDAC website or TCGA Data Coordination Center Portal.