This pipeline computes the correlation between significant arm-level copy number variations (cnvs) and selected clinical features.
Testing the association between copy number variation 82 arm-level events and 12 clinical features across 90 patients, 14 significant findings detected with Q value < 0.25.
-
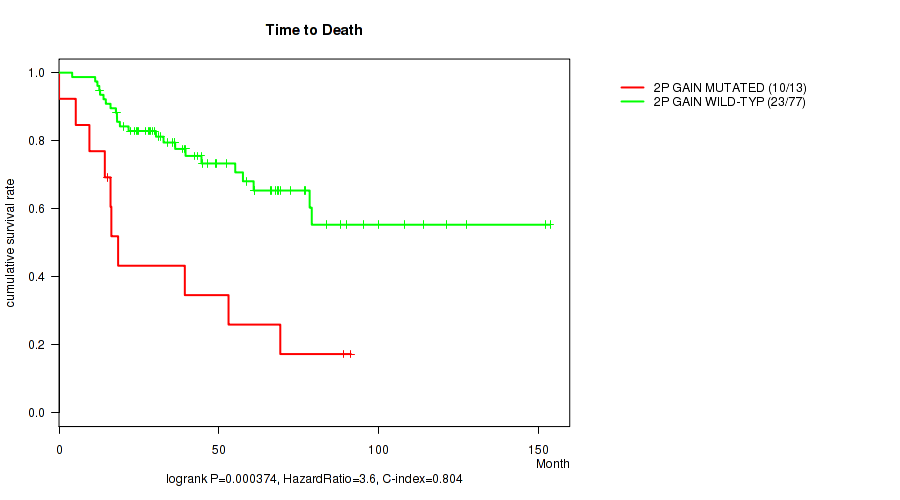
2p gain cnv correlated to 'Time to Death'.
-
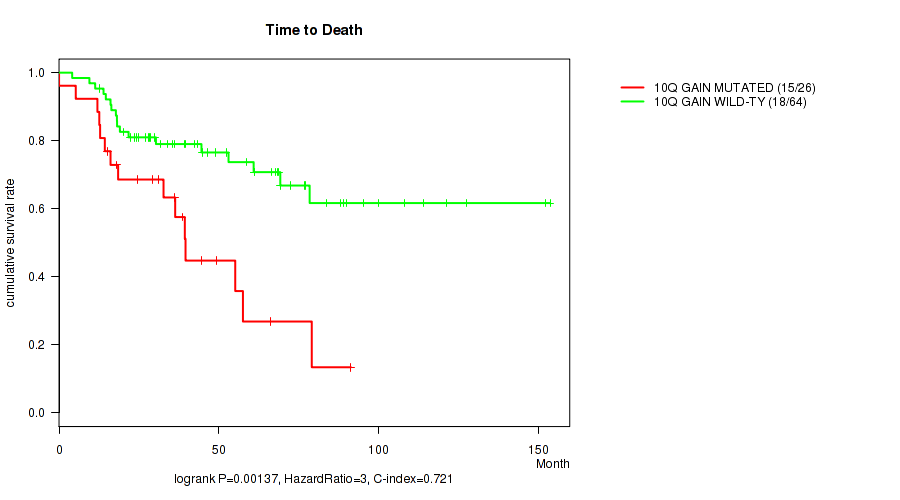
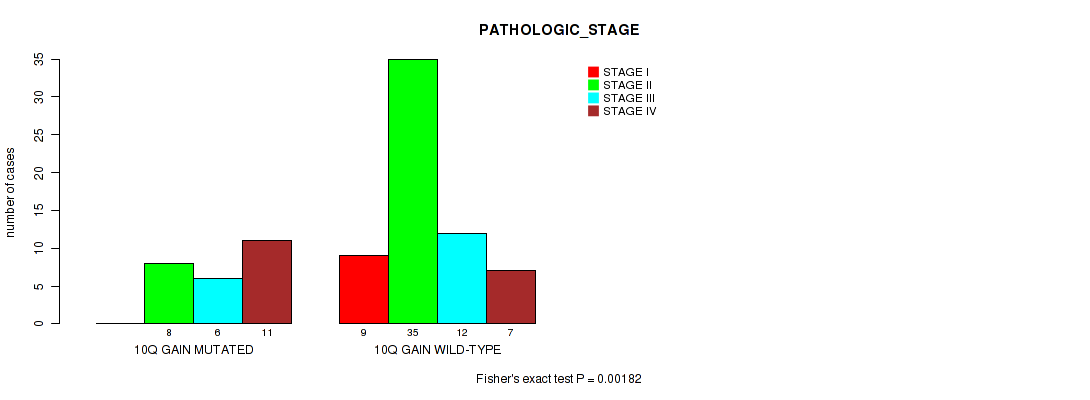
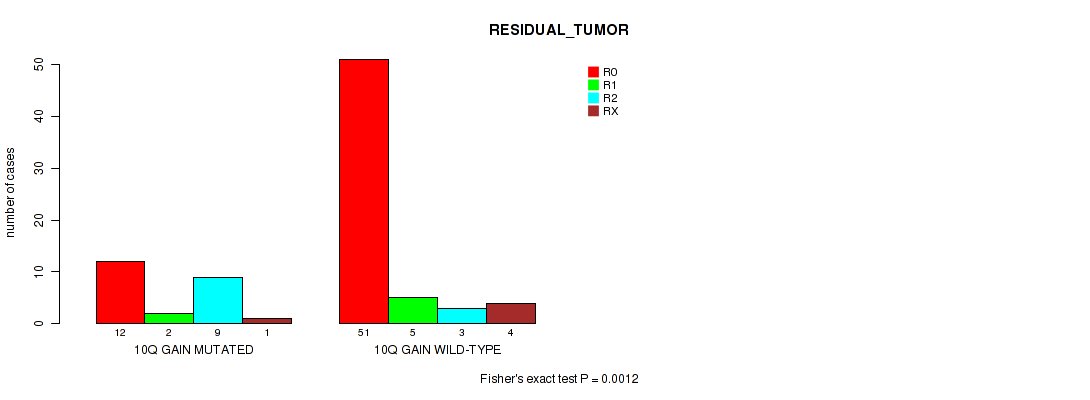
10q gain cnv correlated to 'Time to Death', 'PATHOLOGIC_STAGE', and 'RESIDUAL_TUMOR'.
-
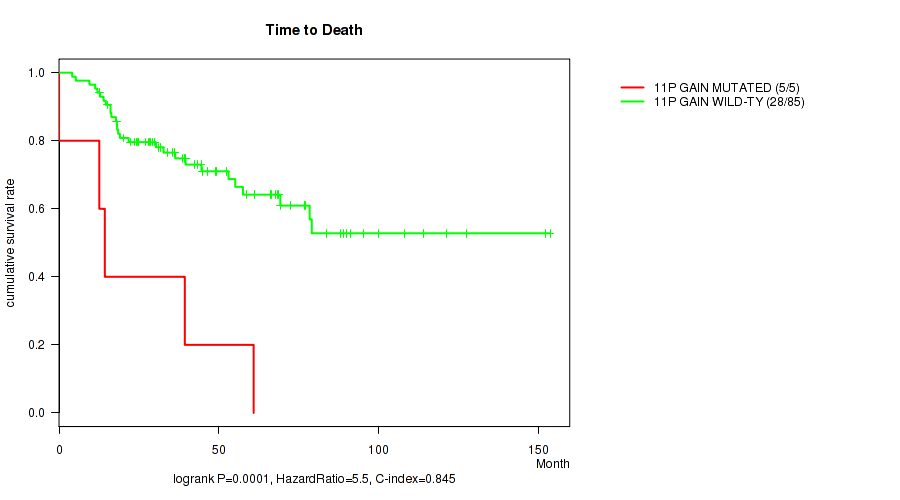
11p gain cnv correlated to 'Time to Death'.
-
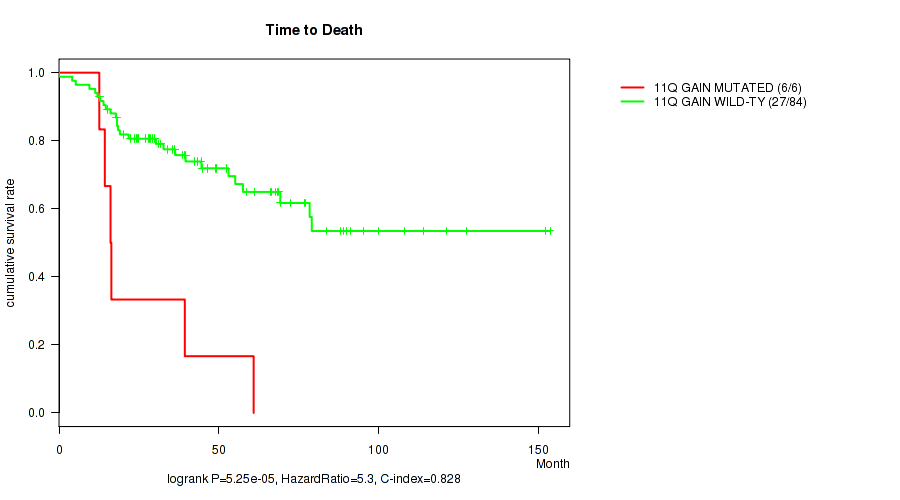
11q gain cnv correlated to 'Time to Death'.
-
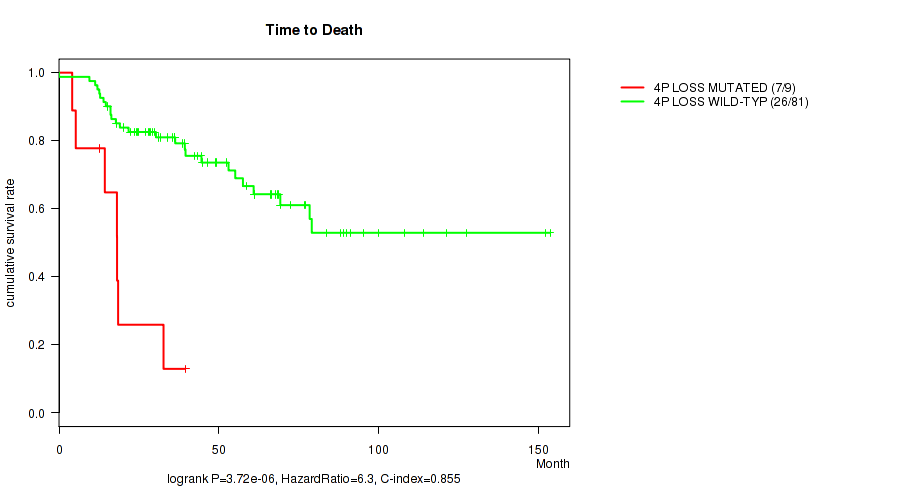
4p loss cnv correlated to 'Time to Death'.
-
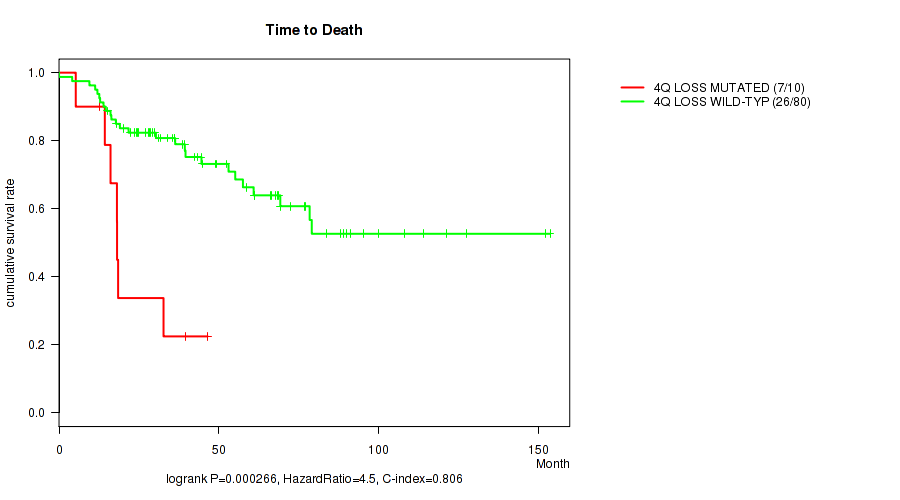
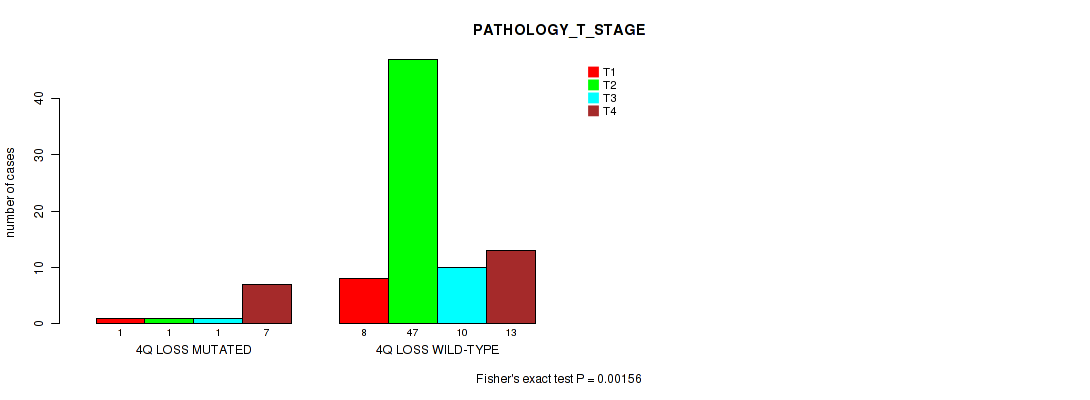
4q loss cnv correlated to 'Time to Death' and 'PATHOLOGY_T_STAGE'.
-
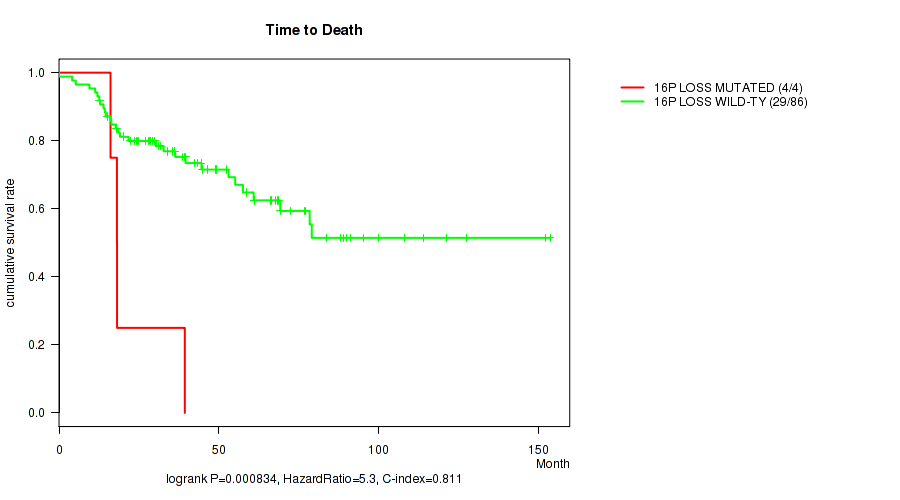
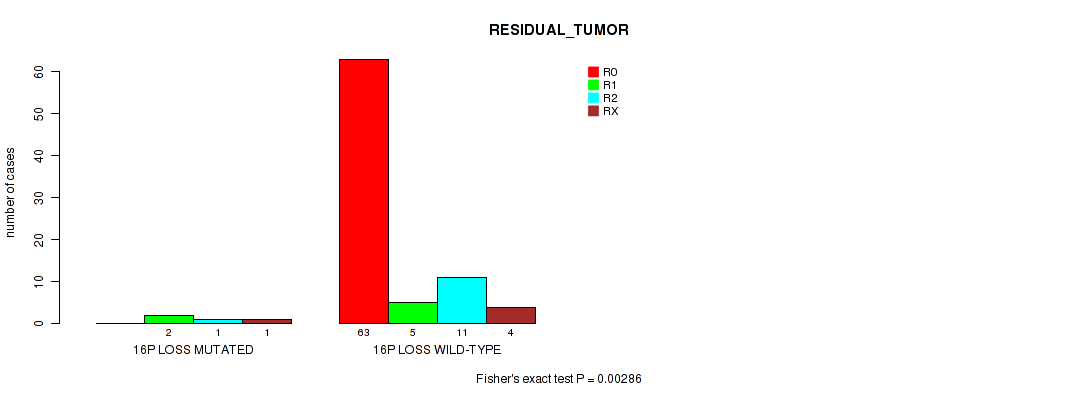
16p loss cnv correlated to 'Time to Death' and 'RESIDUAL_TUMOR'.
-
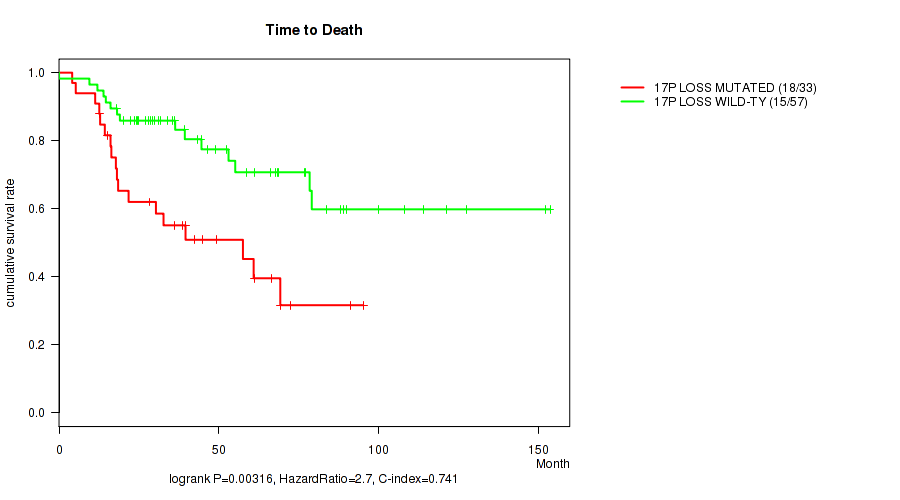
17p loss cnv correlated to 'Time to Death'.
-
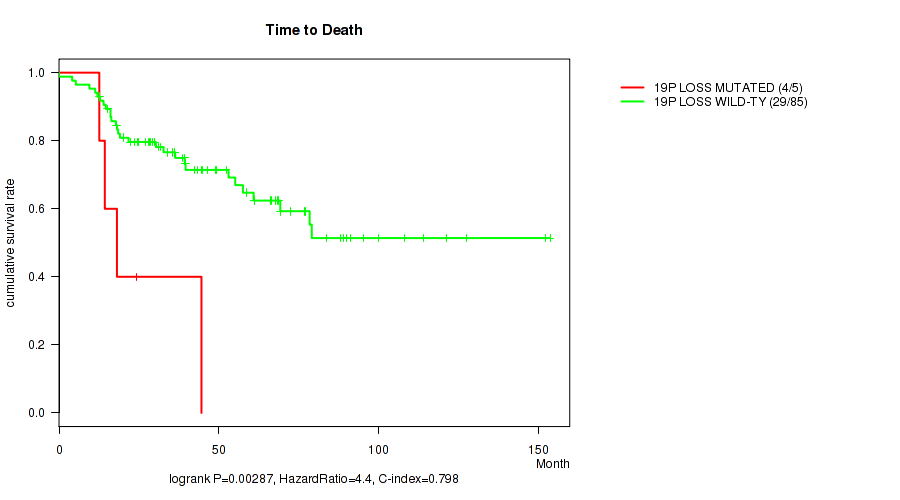
19p loss cnv correlated to 'Time to Death'.
-
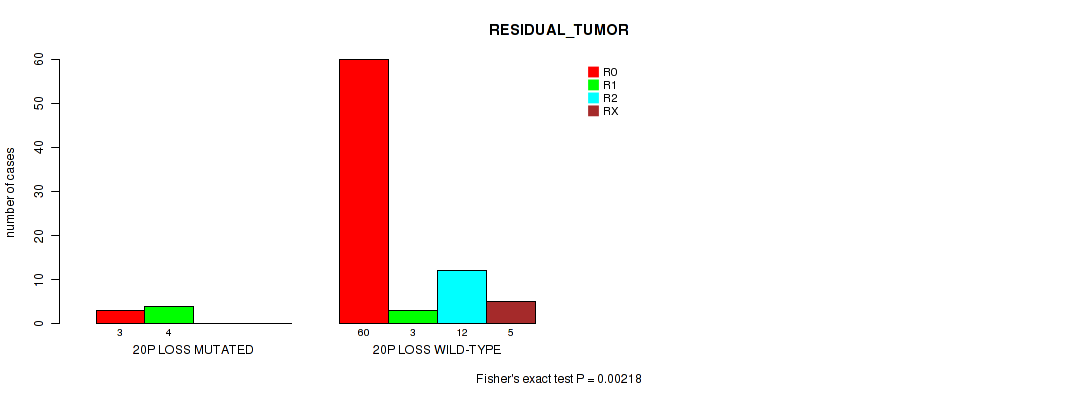
20p loss cnv correlated to 'RESIDUAL_TUMOR'.
Table 1. Get Full Table Overview of the association between significant copy number variation of 82 arm-level events and 12 clinical features. Shown in the table are P values (Q values). Thresholded by Q value < 0.25, 14 significant findings detected.
|
Clinical Features |
Time to Death |
YEARS TO BIRTH |
PATHOLOGIC STAGE |
PATHOLOGY T STAGE |
PATHOLOGY N STAGE |
GENDER |
RADIATION THERAPY |
HISTOLOGICAL TYPE |
RESIDUAL TUMOR |
NUMBER OF LYMPH NODES |
RACE | ETHNICITY | ||
| nCNV (%) | nWild-Type | logrank test | Wilcoxon-test | Fisher's exact test | Fisher's exact test | Fisher's exact test | Fisher's exact test | Fisher's exact test | Fisher's exact test | Fisher's exact test | Wilcoxon-test | Fisher's exact test | Fisher's exact test | |
| 10q gain | 26 (29%) | 64 |
0.00137 (0.168) |
0.266 (1.00) |
0.00182 (0.179) |
0.00552 (0.322) |
1 (1.00) |
1 (1.00) |
0.771 (1.00) |
0.511 (1.00) |
0.0012 (0.168) |
0.763 (1.00) |
1 (1.00) |
0.421 (1.00) |
| 4q loss | 10 (11%) | 80 |
0.000266 (0.0655) |
0.691 (1.00) |
0.00522 (0.322) |
0.00156 (0.171) |
1 (1.00) |
0.484 (1.00) |
0.0835 (0.858) |
1 (1.00) |
0.0126 (0.427) |
0.818 (1.00) |
1 (1.00) |
0.548 (1.00) |
| 16p loss | 4 (4%) | 86 |
0.000834 (0.137) |
0.732 (1.00) |
0.0441 (0.678) |
0.0361 (0.647) |
0.388 (1.00) |
0.606 (1.00) |
0.506 (1.00) |
1 (1.00) |
0.00286 (0.217) |
1 (1.00) |
0.321 (1.00) |
|
| 2p gain | 13 (14%) | 77 |
0.000374 (0.0735) |
0.818 (1.00) |
0.381 (1.00) |
0.144 (0.944) |
0.347 (1.00) |
0.205 (1.00) |
0.727 (1.00) |
1 (1.00) |
0.227 (1.00) |
0.235 (1.00) |
0.17 (0.982) |
0.587 (1.00) |
| 11p gain | 5 (6%) | 85 |
0.0001 (0.0328) |
0.364 (1.00) |
0.158 (0.963) |
0.0425 (0.663) |
1 (1.00) |
0.656 (1.00) |
0.579 (1.00) |
1 (1.00) |
0.0108 (0.427) |
1 (1.00) |
0.569 (1.00) |
|
| 11q gain | 6 (7%) | 84 |
5.25e-05 (0.0258) |
0.698 (1.00) |
0.118 (0.89) |
0.0617 (0.731) |
1 (1.00) |
0.66 (1.00) |
1 (1.00) |
1 (1.00) |
0.0641 (0.743) |
0.318 (1.00) |
1 (1.00) |
1 (1.00) |
| 4p loss | 9 (10%) | 81 |
3.72e-06 (0.00366) |
0.408 (1.00) |
0.0529 (0.731) |
0.0124 (0.427) |
1 (1.00) |
1 (1.00) |
0.0537 (0.731) |
1 (1.00) |
0.0208 (0.502) |
1 (1.00) |
1 (1.00) |
1 (1.00) |
| 17p loss | 33 (37%) | 57 |
0.00316 (0.222) |
0.492 (1.00) |
0.0812 (0.858) |
0.18 (0.982) |
0.737 (1.00) |
0.255 (1.00) |
0.405 (1.00) |
1 (1.00) |
0.15 (0.949) |
0.747 (1.00) |
0.702 (1.00) |
0.403 (1.00) |
| 19p loss | 5 (6%) | 85 |
0.00287 (0.217) |
0.603 (1.00) |
0.195 (1.00) |
0.285 (1.00) |
1 (1.00) |
1 (1.00) |
0.576 (1.00) |
1 (1.00) |
0.159 (0.963) |
1 (1.00) |
1 (1.00) |
|
| 20p loss | 9 (10%) | 81 |
0.828 (1.00) |
0.595 (1.00) |
0.555 (1.00) |
0.745 (1.00) |
1 (1.00) |
0.156 (0.963) |
0.385 (1.00) |
1 (1.00) |
0.00218 (0.195) |
0.969 (1.00) |
0.276 (1.00) |
0.548 (1.00) |
| 1p gain | 4 (4%) | 86 |
0.0866 (0.858) |
0.487 (1.00) |
1 (1.00) |
0.746 (1.00) |
1 (1.00) |
0.294 (1.00) |
0.576 (1.00) |
1 (1.00) |
0.305 (1.00) |
0.318 (1.00) |
0.148 (0.945) |
1 (1.00) |
| 1q gain | 8 (9%) | 82 |
0.0407 (0.663) |
0.798 (1.00) |
0.734 (1.00) |
0.455 (1.00) |
0.589 (1.00) |
0.047 (0.7) |
1 (1.00) |
1 (1.00) |
0.511 (1.00) |
0.173 (0.982) |
0.245 (1.00) |
0.548 (1.00) |
| 2q gain | 13 (14%) | 77 |
0.0146 (0.478) |
0.667 (1.00) |
0.291 (1.00) |
0.377 (1.00) |
1 (1.00) |
0.205 (1.00) |
1 (1.00) |
1 (1.00) |
0.538 (1.00) |
0.235 (1.00) |
0.184 (0.982) |
0.645 (1.00) |
| 3p gain | 14 (16%) | 76 |
0.182 (0.982) |
0.49 (1.00) |
0.547 (1.00) |
0.831 (1.00) |
1 (1.00) |
1 (1.00) |
0.036 (0.647) |
0.0252 (0.541) |
0.745 (1.00) |
0.581 (1.00) |
1 (1.00) |
1 (1.00) |
| 3q gain | 16 (18%) | 74 |
0.266 (1.00) |
0.598 (1.00) |
0.328 (1.00) |
0.671 (1.00) |
1 (1.00) |
1 (1.00) |
0.035 (0.647) |
0.0367 (0.647) |
0.477 (1.00) |
0.581 (1.00) |
1 (1.00) |
1 (1.00) |
| 4p gain | 38 (42%) | 52 |
0.177 (0.982) |
0.974 (1.00) |
0.881 (1.00) |
0.896 (1.00) |
1 (1.00) |
0.823 (1.00) |
0.432 (1.00) |
0.204 (1.00) |
0.183 (0.982) |
0.718 (1.00) |
1 (1.00) |
0.443 (1.00) |
| 4q gain | 35 (39%) | 55 |
0.272 (1.00) |
0.83 (1.00) |
0.826 (1.00) |
0.763 (1.00) |
1 (1.00) |
0.495 (1.00) |
0.787 (1.00) |
0.429 (1.00) |
0.878 (1.00) |
0.567 (1.00) |
1 (1.00) |
1 (1.00) |
| 5p gain | 57 (63%) | 33 |
0.451 (1.00) |
0.854 (1.00) |
0.694 (1.00) |
0.893 (1.00) |
1 (1.00) |
1 (1.00) |
0.272 (1.00) |
1 (1.00) |
0.559 (1.00) |
0.621 (1.00) |
1 (1.00) |
0.226 (1.00) |
| 5q gain | 55 (61%) | 35 |
0.577 (1.00) |
0.593 (1.00) |
0.884 (1.00) |
0.838 (1.00) |
1 (1.00) |
0.657 (1.00) |
0.295 (1.00) |
1 (1.00) |
0.793 (1.00) |
0.621 (1.00) |
0.161 (0.971) |
0.115 (0.89) |
| 6p gain | 18 (20%) | 72 |
0.66 (1.00) |
0.0275 (0.552) |
0.497 (1.00) |
0.253 (1.00) |
0.679 (1.00) |
0.588 (1.00) |
0.506 (1.00) |
1 (1.00) |
0.0254 (0.541) |
0.407 (1.00) |
0.0911 (0.858) |
0.0548 (0.731) |
| 6q gain | 16 (18%) | 74 |
0.765 (1.00) |
0.2 (1.00) |
0.114 (0.89) |
0.172 (0.982) |
0.2 (1.00) |
0.399 (1.00) |
0.179 (0.982) |
0.635 (1.00) |
0.117 (0.89) |
0.127 (0.896) |
0.0591 (0.731) |
0.613 (1.00) |
| 7p gain | 48 (53%) | 42 |
0.815 (1.00) |
0.51 (1.00) |
0.168 (0.982) |
0.232 (1.00) |
0.336 (1.00) |
1 (1.00) |
0.793 (1.00) |
0.621 (1.00) |
0.771 (1.00) |
0.361 (1.00) |
0.215 (1.00) |
0.435 (1.00) |
| 7q gain | 48 (53%) | 42 |
0.512 (1.00) |
0.859 (1.00) |
0.107 (0.89) |
0.224 (1.00) |
0.336 (1.00) |
1 (1.00) |
0.431 (1.00) |
0.621 (1.00) |
0.769 (1.00) |
0.268 (1.00) |
0.217 (1.00) |
0.115 (0.89) |
| 8p gain | 32 (36%) | 58 |
0.222 (1.00) |
0.508 (1.00) |
0.442 (1.00) |
0.635 (1.00) |
0.484 (1.00) |
1 (1.00) |
0.786 (1.00) |
0.546 (1.00) |
1 (1.00) |
1 (1.00) |
0.29 (1.00) |
0.421 (1.00) |
| 8q gain | 38 (42%) | 52 |
0.649 (1.00) |
0.49 (1.00) |
0.348 (1.00) |
0.534 (1.00) |
0.51 (1.00) |
1 (1.00) |
0.594 (1.00) |
0.449 (1.00) |
0.799 (1.00) |
0.83 (1.00) |
0.342 (1.00) |
0.7 (1.00) |
| 9p gain | 21 (23%) | 69 |
0.123 (0.896) |
0.643 (1.00) |
0.0583 (0.731) |
0.338 (1.00) |
0.0106 (0.427) |
1 (1.00) |
0.0606 (0.731) |
0.264 (1.00) |
0.126 (0.896) |
0.0118 (0.427) |
1 (1.00) |
0.412 (1.00) |
| 9q gain | 27 (30%) | 63 |
0.00579 (0.322) |
0.669 (1.00) |
0.0174 (0.502) |
0.0594 (0.731) |
0.00805 (0.377) |
0.631 (1.00) |
0.567 (1.00) |
0.356 (1.00) |
0.0221 (0.506) |
0.0177 (0.502) |
0.665 (1.00) |
1 (1.00) |
| 10p gain | 25 (28%) | 65 |
0.011 (0.427) |
0.397 (1.00) |
0.00622 (0.322) |
0.0162 (0.502) |
1 (1.00) |
1 (1.00) |
1 (1.00) |
0.691 (1.00) |
0.00989 (0.427) |
0.763 (1.00) |
1 (1.00) |
0.421 (1.00) |
| 12p gain | 64 (71%) | 26 |
0.894 (1.00) |
0.287 (1.00) |
0.701 (1.00) |
0.61 (1.00) |
1 (1.00) |
0.464 (1.00) |
0.38 (1.00) |
1 (1.00) |
0.639 (1.00) |
0.703 (1.00) |
0.648 (1.00) |
0.0898 (0.858) |
| 12q gain | 64 (71%) | 26 |
0.917 (1.00) |
0.415 (1.00) |
0.703 (1.00) |
0.65 (1.00) |
0.718 (1.00) |
0.464 (1.00) |
0.38 (1.00) |
1 (1.00) |
0.655 (1.00) |
0.703 (1.00) |
0.0821 (0.858) |
0.0898 (0.858) |
| 13q gain | 6 (7%) | 84 |
0.839 (1.00) |
0.651 (1.00) |
0.735 (1.00) |
0.722 (1.00) |
0.526 (1.00) |
1 (1.00) |
1 (1.00) |
1 (1.00) |
0.501 (1.00) |
0.633 (1.00) |
1 (1.00) |
0.548 (1.00) |
| 14q gain | 21 (23%) | 69 |
0.13 (0.896) |
0.426 (1.00) |
0.182 (0.982) |
0.311 (1.00) |
0.241 (1.00) |
0.606 (1.00) |
0.0606 (0.731) |
0.671 (1.00) |
0.73 (1.00) |
0.149 (0.946) |
1 (1.00) |
0.374 (1.00) |
| 15q gain | 11 (12%) | 79 |
0.779 (1.00) |
0.46 (1.00) |
0.795 (1.00) |
0.71 (1.00) |
1 (1.00) |
1 (1.00) |
0.425 (1.00) |
1 (1.00) |
1 (1.00) |
0.917 (1.00) |
1 (1.00) |
1 (1.00) |
| 16p gain | 50 (56%) | 40 |
0.522 (1.00) |
0.606 (1.00) |
0.471 (1.00) |
0.145 (0.944) |
0.745 (1.00) |
0.267 (1.00) |
0.791 (1.00) |
1 (1.00) |
0.87 (1.00) |
0.515 (1.00) |
0.72 (1.00) |
0.267 (1.00) |
| 16q gain | 47 (52%) | 43 |
0.35 (1.00) |
0.929 (1.00) |
0.832 (1.00) |
0.611 (1.00) |
1 (1.00) |
0.269 (1.00) |
0.112 (0.89) |
1 (1.00) |
0.932 (1.00) |
0.394 (1.00) |
0.115 (0.89) |
0.699 (1.00) |
| 17p gain | 5 (6%) | 85 |
0.291 (1.00) |
0.622 (1.00) |
0.158 (0.963) |
0.107 (0.89) |
1 (1.00) |
1 (1.00) |
1 (1.00) |
0.0701 (0.802) |
0.503 (1.00) |
0.318 (1.00) |
0.146 (0.944) |
0.444 (1.00) |
| 17q gain | 7 (8%) | 83 |
0.124 (0.896) |
0.488 (1.00) |
0.69 (1.00) |
0.469 (1.00) |
1 (1.00) |
1 (1.00) |
1 (1.00) |
0.0211 (0.502) |
0.585 (1.00) |
1 (1.00) |
0.548 (1.00) |
|
| 18p gain | 6 (7%) | 84 |
0.129 (0.896) |
0.452 (1.00) |
0.342 (1.00) |
0.33 (1.00) |
1 (1.00) |
1 (1.00) |
1 (1.00) |
1 (1.00) |
0.207 (1.00) |
0.212 (1.00) |
1 (1.00) |
|
| 18q gain | 5 (6%) | 85 |
0.309 (1.00) |
0.833 (1.00) |
0.832 (1.00) |
0.29 (1.00) |
1 (1.00) |
0.656 (1.00) |
0.579 (1.00) |
1 (1.00) |
0.111 (0.89) |
0.181 (0.982) |
0.569 (1.00) |
|
| 19p gain | 56 (62%) | 34 |
0.289 (1.00) |
0.119 (0.89) |
0.181 (0.982) |
0.207 (1.00) |
0.737 (1.00) |
0.821 (1.00) |
0.105 (0.89) |
1 (1.00) |
0.774 (1.00) |
0.552 (1.00) |
1 (1.00) |
0.124 (0.896) |
| 19q gain | 52 (58%) | 38 |
0.318 (1.00) |
0.0203 (0.502) |
0.198 (1.00) |
0.326 (1.00) |
0.182 (0.982) |
0.378 (1.00) |
0.108 (0.89) |
0.787 (1.00) |
0.253 (1.00) |
0.321 (1.00) |
1 (1.00) |
0.124 (0.896) |
| 20p gain | 46 (51%) | 44 |
0.141 (0.937) |
0.495 (1.00) |
0.339 (1.00) |
0.796 (1.00) |
1 (1.00) |
0.188 (0.986) |
0.3 (1.00) |
0.616 (1.00) |
0.463 (1.00) |
0.917 (1.00) |
0.492 (1.00) |
1 (1.00) |
| 20q gain | 49 (54%) | 41 |
0.542 (1.00) |
0.964 (1.00) |
0.32 (1.00) |
0.857 (1.00) |
0.336 (1.00) |
0.187 (0.986) |
0.431 (1.00) |
0.62 (1.00) |
0.245 (1.00) |
0.396 (1.00) |
0.217 (1.00) |
0.71 (1.00) |
| 21q gain | 31 (34%) | 59 |
0.68 (1.00) |
0.154 (0.957) |
0.936 (1.00) |
0.941 (1.00) |
0.0836 (0.858) |
0.818 (1.00) |
0.4 (1.00) |
0.396 (1.00) |
0.972 (1.00) |
0.0907 (0.858) |
0.272 (1.00) |
0.443 (1.00) |
| 22q gain | 3 (3%) | 87 |
0.131 (0.896) |
0.208 (1.00) |
1 (1.00) |
1 (1.00) |
0.307 (1.00) |
1 (1.00) |
1 (1.00) |
1 (1.00) |
0.625 (1.00) |
1 (1.00) |
1 (1.00) |
|
| xp gain | 43 (48%) | 47 |
0.822 (1.00) |
0.856 (1.00) |
0.977 (1.00) |
0.96 (1.00) |
0.517 (1.00) |
1 (1.00) |
0.792 (1.00) |
0.617 (1.00) |
0.147 (0.944) |
0.316 (1.00) |
0.36 (1.00) |
0.115 (0.89) |
| xq gain | 41 (46%) | 49 |
0.54 (1.00) |
0.82 (1.00) |
0.838 (1.00) |
1 (1.00) |
0.745 (1.00) |
0.824 (1.00) |
0.597 (1.00) |
0.624 (1.00) |
0.182 (0.982) |
0.699 (1.00) |
0.345 (1.00) |
0.26 (1.00) |
| 1p loss | 29 (32%) | 61 |
0.902 (1.00) |
0.866 (1.00) |
0.958 (1.00) |
0.952 (1.00) |
1 (1.00) |
1 (1.00) |
0.26 (1.00) |
0.257 (1.00) |
1 (1.00) |
0.292 (1.00) |
1 (1.00) |
1 (1.00) |
| 1q loss | 21 (23%) | 69 |
0.928 (1.00) |
0.309 (1.00) |
0.512 (1.00) |
0.716 (1.00) |
0.689 (1.00) |
0.433 (1.00) |
0.344 (1.00) |
0.0815 (0.858) |
0.607 (1.00) |
0.814 (1.00) |
1 (1.00) |
1 (1.00) |
| 2p loss | 16 (18%) | 74 |
0.0502 (0.731) |
0.569 (1.00) |
1 (1.00) |
0.756 (1.00) |
0.677 (1.00) |
0.399 (1.00) |
0.502 (1.00) |
0.0376 (0.647) |
0.89 (1.00) |
0.581 (1.00) |
1 (1.00) |
1 (1.00) |
| 2q loss | 14 (16%) | 76 |
0.0897 (0.858) |
0.854 (1.00) |
0.7 (1.00) |
0.841 (1.00) |
1 (1.00) |
0.545 (1.00) |
0.456 (1.00) |
0.0253 (0.541) |
0.938 (1.00) |
0.753 (1.00) |
1 (1.00) |
1 (1.00) |
| 3p loss | 19 (21%) | 71 |
0.0584 (0.731) |
0.452 (1.00) |
0.0867 (0.858) |
0.302 (1.00) |
1 (1.00) |
0.276 (1.00) |
0.734 (1.00) |
0.666 (1.00) |
0.02 (0.502) |
0.77 (1.00) |
1 (1.00) |
1 (1.00) |
| 3q loss | 19 (21%) | 71 |
0.109 (0.89) |
0.722 (1.00) |
0.175 (0.982) |
0.561 (1.00) |
1 (1.00) |
0.43 (1.00) |
0.745 (1.00) |
0.662 (1.00) |
0.13 (0.896) |
0.77 (1.00) |
0.234 (1.00) |
0.277 (1.00) |
| 5p loss | 7 (8%) | 83 |
0.285 (1.00) |
0.958 (1.00) |
0.349 (1.00) |
0.113 (0.89) |
0.584 (1.00) |
0.688 (1.00) |
1 (1.00) |
1 (1.00) |
0.241 (1.00) |
0.235 (1.00) |
1 (1.00) |
0.548 (1.00) |
| 5q loss | 5 (6%) | 85 |
0.786 (1.00) |
0.591 (1.00) |
0.245 (1.00) |
0.638 (1.00) |
0.461 (1.00) |
0.335 (1.00) |
1 (1.00) |
1 (1.00) |
0.0908 (0.858) |
1 (1.00) |
1 (1.00) |
|
| 6p loss | 19 (21%) | 71 |
0.11 (0.89) |
0.35 (1.00) |
0.0845 (0.858) |
0.145 (0.944) |
0.445 (1.00) |
1 (1.00) |
1 (1.00) |
0.0629 (0.737) |
0.246 (1.00) |
0.5 (1.00) |
1 (1.00) |
0.571 (1.00) |
| 6q loss | 22 (24%) | 68 |
0.0259 (0.541) |
0.254 (1.00) |
0.00727 (0.358) |
0.0184 (0.502) |
0.706 (1.00) |
0.453 (1.00) |
1 (1.00) |
0.0924 (0.858) |
0.0424 (0.663) |
0.671 (1.00) |
1 (1.00) |
1 (1.00) |
| 7p loss | 5 (6%) | 85 |
0.109 (0.89) |
0.718 (1.00) |
0.332 (1.00) |
0.285 (1.00) |
1 (1.00) |
0.0461 (0.698) |
0.576 (1.00) |
1 (1.00) |
0.173 (0.982) |
1 (1.00) |
1 (1.00) |
|
| 7q loss | 6 (7%) | 84 |
0.0173 (0.502) |
0.61 (1.00) |
0.0389 (0.648) |
0.0195 (0.502) |
1 (1.00) |
0.411 (1.00) |
1 (1.00) |
1 (1.00) |
0.261 (1.00) |
1 (1.00) |
1 (1.00) |
|
| 8p loss | 16 (18%) | 74 |
0.821 (1.00) |
0.768 (1.00) |
0.671 (1.00) |
0.97 (1.00) |
0.365 (1.00) |
1 (1.00) |
0.725 (1.00) |
1 (1.00) |
0.0269 (0.552) |
0.854 (1.00) |
1 (1.00) |
1 (1.00) |
| 8q loss | 12 (13%) | 78 |
0.892 (1.00) |
0.639 (1.00) |
0.578 (1.00) |
1 (1.00) |
0.107 (0.89) |
0.534 (1.00) |
1 (1.00) |
1 (1.00) |
0.0794 (0.858) |
0.25 (1.00) |
1 (1.00) |
1 (1.00) |
| 9p loss | 20 (22%) | 70 |
0.174 (0.982) |
0.506 (1.00) |
0.846 (1.00) |
0.622 (1.00) |
0.683 (1.00) |
0.599 (1.00) |
0.061 (0.731) |
0.665 (1.00) |
0.821 (1.00) |
0.193 (1.00) |
1 (1.00) |
0.645 (1.00) |
| 9q loss | 12 (13%) | 78 |
0.985 (1.00) |
0.771 (1.00) |
0.194 (1.00) |
0.519 (1.00) |
0.35 (1.00) |
1 (1.00) |
0.69 (1.00) |
1 (1.00) |
0.487 (1.00) |
0.235 (1.00) |
1 (1.00) |
1 (1.00) |
| 10p loss | 12 (13%) | 78 |
0.311 (1.00) |
0.934 (1.00) |
0.185 (0.986) |
1 (1.00) |
0.134 (0.91) |
1 (1.00) |
1 (1.00) |
0.0615 (0.731) |
0.526 (1.00) |
0.116 (0.89) |
1 (1.00) |
0.444 (1.00) |
| 10q loss | 10 (11%) | 80 |
0.383 (1.00) |
0.298 (1.00) |
0.306 (1.00) |
0.713 (1.00) |
0.317 (1.00) |
1 (1.00) |
1 (1.00) |
0.0424 (0.663) |
0.479 (1.00) |
0.152 (0.951) |
1 (1.00) |
1 (1.00) |
| 11p loss | 23 (26%) | 67 |
0.602 (1.00) |
0.582 (1.00) |
0.176 (0.982) |
0.716 (1.00) |
0.697 (1.00) |
0.317 (1.00) |
1 (1.00) |
0.103 (0.89) |
0.421 (1.00) |
0.671 (1.00) |
1 (1.00) |
1 (1.00) |
| 11q loss | 22 (24%) | 68 |
0.219 (1.00) |
0.436 (1.00) |
0.0338 (0.647) |
0.207 (1.00) |
1 (1.00) |
0.302 (1.00) |
1 (1.00) |
0.0922 (0.858) |
0.746 (1.00) |
0.854 (1.00) |
1 (1.00) |
0.569 (1.00) |
| 12p loss | 5 (6%) | 85 |
0.181 (0.982) |
0.241 (1.00) |
0.334 (1.00) |
0.287 (1.00) |
1 (1.00) |
0.335 (1.00) |
1 (1.00) |
1 (1.00) |
0.058 (0.731) |
0.318 (1.00) |
1 (1.00) |
1 (1.00) |
| 12q loss | 4 (4%) | 86 |
0.0594 (0.731) |
0.463 (1.00) |
0.331 (1.00) |
0.284 (1.00) |
1 (1.00) |
0.606 (1.00) |
1 (1.00) |
1 (1.00) |
0.0574 (0.731) |
0.318 (1.00) |
1 (1.00) |
1 (1.00) |
| 13q loss | 39 (43%) | 51 |
0.114 (0.89) |
0.536 (1.00) |
0.481 (1.00) |
0.921 (1.00) |
0.51 (1.00) |
0.51 (1.00) |
1 (1.00) |
0.204 (1.00) |
0.869 (1.00) |
0.606 (1.00) |
0.507 (1.00) |
1 (1.00) |
| 14q loss | 18 (20%) | 72 |
0.72 (1.00) |
0.793 (1.00) |
0.834 (1.00) |
0.781 (1.00) |
0.68 (1.00) |
0.782 (1.00) |
1 (1.00) |
0.0523 (0.731) |
0.529 (1.00) |
0.265 (1.00) |
0.219 (1.00) |
0.129 (0.896) |
| 15q loss | 21 (23%) | 69 |
0.679 (1.00) |
0.519 (1.00) |
0.65 (1.00) |
0.7 (1.00) |
1 (1.00) |
0.606 (1.00) |
0.218 (1.00) |
0.0828 (0.858) |
0.961 (1.00) |
0.333 (1.00) |
1 (1.00) |
0.664 (1.00) |
| 16q loss | 5 (6%) | 85 |
0.0193 (0.502) |
0.214 (1.00) |
0.246 (1.00) |
0.139 (0.931) |
0.461 (1.00) |
1 (1.00) |
0.275 (1.00) |
1 (1.00) |
0.114 (0.89) |
1 (1.00) |
0.444 (1.00) |
|
| 17q loss | 25 (28%) | 65 |
0.0381 (0.647) |
0.982 (1.00) |
0.278 (1.00) |
0.467 (1.00) |
0.717 (1.00) |
0.0125 (0.427) |
0.55 (1.00) |
0.691 (1.00) |
0.314 (1.00) |
0.583 (1.00) |
1 (1.00) |
0.658 (1.00) |
| 18p loss | 37 (41%) | 53 |
0.599 (1.00) |
0.892 (1.00) |
0.205 (1.00) |
0.494 (1.00) |
1 (1.00) |
0.37 (1.00) |
0.295 (1.00) |
0.589 (1.00) |
0.182 (0.982) |
0.816 (1.00) |
0.294 (1.00) |
1 (1.00) |
| 18q loss | 35 (39%) | 55 |
0.934 (1.00) |
0.747 (1.00) |
0.272 (1.00) |
0.52 (1.00) |
1 (1.00) |
0.11 (0.89) |
0.584 (1.00) |
0.429 (1.00) |
0.649 (1.00) |
0.816 (1.00) |
0.273 (1.00) |
1 (1.00) |
| 19q loss | 4 (4%) | 86 |
0.0746 (0.843) |
0.124 (0.896) |
0.874 (1.00) |
1 (1.00) |
1 (1.00) |
1 (1.00) |
0.576 (1.00) |
1 (1.00) |
0.732 (1.00) |
0.318 (1.00) |
1 (1.00) |
1 (1.00) |
| 20q loss | 3 (3%) | 87 |
0.408 (1.00) |
0.582 (1.00) |
0.704 (1.00) |
0.524 (1.00) |
1 (1.00) |
0.549 (1.00) |
1 (1.00) |
1 (1.00) |
0.0381 (0.647) |
1 (1.00) |
0.321 (1.00) |
|
| 21q loss | 15 (17%) | 75 |
0.0214 (0.502) |
0.468 (1.00) |
0.672 (1.00) |
0.416 (1.00) |
1 (1.00) |
0.565 (1.00) |
0.502 (1.00) |
0.0308 (0.606) |
0.519 (1.00) |
0.475 (1.00) |
1 (1.00) |
1 (1.00) |
| 22q loss | 48 (53%) | 42 |
0.0059 (0.322) |
0.236 (1.00) |
0.188 (0.986) |
0.082 (0.858) |
1 (1.00) |
0.374 (1.00) |
1 (1.00) |
1 (1.00) |
0.755 (1.00) |
0.51 (1.00) |
1 (1.00) |
0.117 (0.89) |
| xp loss | 16 (18%) | 74 |
0.859 (1.00) |
0.138 (0.93) |
0.861 (1.00) |
0.866 (1.00) |
1 (1.00) |
0.778 (1.00) |
0.502 (1.00) |
0.634 (1.00) |
0.652 (1.00) |
0.475 (1.00) |
0.42 (1.00) |
0.325 (1.00) |
| xq loss | 16 (18%) | 74 |
0.936 (1.00) |
0.131 (0.896) |
0.455 (1.00) |
0.422 (1.00) |
0.677 (1.00) |
1 (1.00) |
0.29 (1.00) |
0.633 (1.00) |
0.651 (1.00) |
0.485 (1.00) |
0.445 (1.00) |
0.317 (1.00) |
P value = 0.000374 (logrank test), Q value = 0.074
Table S1. Gene #3: '2p gain' versus Clinical Feature #1: 'Time to Death'
| nPatients | nDeath | Duration Range (Median), Month | |
|---|---|---|---|
| ALL | 90 | 33 | 0.0 - 153.6 (38.9) |
| 2P GAIN MUTATED | 13 | 10 | 0.0 - 91.3 (16.4) |
| 2P GAIN WILD-TYPE | 77 | 23 | 4.1 - 153.6 (39.5) |
Figure S1. Get High-res Image Gene #3: '2p gain' versus Clinical Feature #1: 'Time to Death'
P value = 0.00137 (logrank test), Q value = 0.17
Table S2. Gene #20: '10q gain' versus Clinical Feature #1: 'Time to Death'
| nPatients | nDeath | Duration Range (Median), Month | |
|---|---|---|---|
| ALL | 90 | 33 | 0.0 - 153.6 (38.9) |
| 10Q GAIN MUTATED | 26 | 15 | 0.0 - 91.3 (32.0) |
| 10Q GAIN WILD-TYPE | 64 | 18 | 4.1 - 153.6 (43.9) |
Figure S2. Get High-res Image Gene #20: '10q gain' versus Clinical Feature #1: 'Time to Death'
P value = 0.00182 (Fisher's exact test), Q value = 0.18
Table S3. Gene #20: '10q gain' versus Clinical Feature #3: 'PATHOLOGIC_STAGE'
| nPatients | STAGE I | STAGE II | STAGE III | STAGE IV |
|---|---|---|---|---|
| ALL | 9 | 43 | 18 | 18 |
| 10Q GAIN MUTATED | 0 | 8 | 6 | 11 |
| 10Q GAIN WILD-TYPE | 9 | 35 | 12 | 7 |
Figure S3. Get High-res Image Gene #20: '10q gain' versus Clinical Feature #3: 'PATHOLOGIC_STAGE'
P value = 0.0012 (Fisher's exact test), Q value = 0.17
Table S4. Gene #20: '10q gain' versus Clinical Feature #9: 'RESIDUAL_TUMOR'
| nPatients | R0 | R1 | R2 | RX |
|---|---|---|---|---|
| ALL | 63 | 7 | 12 | 5 |
| 10Q GAIN MUTATED | 12 | 2 | 9 | 1 |
| 10Q GAIN WILD-TYPE | 51 | 5 | 3 | 4 |
Figure S4. Get High-res Image Gene #20: '10q gain' versus Clinical Feature #9: 'RESIDUAL_TUMOR'
P value = 1e-04 (logrank test), Q value = 0.033
Table S5. Gene #21: '11p gain' versus Clinical Feature #1: 'Time to Death'
| nPatients | nDeath | Duration Range (Median), Month | |
|---|---|---|---|
| ALL | 90 | 33 | 0.0 - 153.6 (38.9) |
| 11P GAIN MUTATED | 5 | 5 | 0.0 - 60.9 (14.3) |
| 11P GAIN WILD-TYPE | 85 | 28 | 4.1 - 153.6 (39.2) |
Figure S5. Get High-res Image Gene #21: '11p gain' versus Clinical Feature #1: 'Time to Death'
P value = 5.25e-05 (logrank test), Q value = 0.026
Table S6. Gene #22: '11q gain' versus Clinical Feature #1: 'Time to Death'
| nPatients | nDeath | Duration Range (Median), Month | |
|---|---|---|---|
| ALL | 90 | 33 | 0.0 - 153.6 (38.9) |
| 11Q GAIN MUTATED | 6 | 6 | 12.6 - 60.9 (16.2) |
| 11Q GAIN WILD-TYPE | 84 | 27 | 0.0 - 153.6 (39.4) |
Figure S6. Get High-res Image Gene #22: '11q gain' versus Clinical Feature #1: 'Time to Death'
P value = 3.72e-06 (logrank test), Q value = 0.0037
Table S7. Gene #48: '4p loss' versus Clinical Feature #1: 'Time to Death'
| nPatients | nDeath | Duration Range (Median), Month | |
|---|---|---|---|
| ALL | 90 | 33 | 0.0 - 153.6 (38.9) |
| 4P LOSS MUTATED | 9 | 7 | 4.1 - 39.5 (18.1) |
| 4P LOSS WILD-TYPE | 81 | 26 | 0.0 - 153.6 (42.5) |
Figure S7. Get High-res Image Gene #48: '4p loss' versus Clinical Feature #1: 'Time to Death'
P value = 0.000266 (logrank test), Q value = 0.066
Table S8. Gene #49: '4q loss' versus Clinical Feature #1: 'Time to Death'
| nPatients | nDeath | Duration Range (Median), Month | |
|---|---|---|---|
| ALL | 90 | 33 | 0.0 - 153.6 (38.9) |
| 4Q LOSS MUTATED | 10 | 7 | 5.2 - 46.5 (18.1) |
| 4Q LOSS WILD-TYPE | 80 | 26 | 0.0 - 153.6 (41.0) |
Figure S8. Get High-res Image Gene #49: '4q loss' versus Clinical Feature #1: 'Time to Death'
P value = 0.00156 (Fisher's exact test), Q value = 0.17
Table S9. Gene #49: '4q loss' versus Clinical Feature #4: 'PATHOLOGY_T_STAGE'
| nPatients | T1 | T2 | T3 | T4 |
|---|---|---|---|---|
| ALL | 9 | 48 | 11 | 20 |
| 4Q LOSS MUTATED | 1 | 1 | 1 | 7 |
| 4Q LOSS WILD-TYPE | 8 | 47 | 10 | 13 |
Figure S9. Get High-res Image Gene #49: '4q loss' versus Clinical Feature #4: 'PATHOLOGY_T_STAGE'
P value = 0.000834 (logrank test), Q value = 0.14
Table S10. Gene #69: '16p loss' versus Clinical Feature #1: 'Time to Death'
| nPatients | nDeath | Duration Range (Median), Month | |
|---|---|---|---|
| ALL | 90 | 33 | 0.0 - 153.6 (38.9) |
| 16P LOSS MUTATED | 4 | 4 | 16.1 - 39.4 (18.1) |
| 16P LOSS WILD-TYPE | 86 | 29 | 0.0 - 153.6 (39.4) |
Figure S10. Get High-res Image Gene #69: '16p loss' versus Clinical Feature #1: 'Time to Death'
P value = 0.00286 (Fisher's exact test), Q value = 0.22
Table S11. Gene #69: '16p loss' versus Clinical Feature #9: 'RESIDUAL_TUMOR'
| nPatients | R0 | R1 | R2 | RX |
|---|---|---|---|---|
| ALL | 63 | 7 | 12 | 5 |
| 16P LOSS MUTATED | 0 | 2 | 1 | 1 |
| 16P LOSS WILD-TYPE | 63 | 5 | 11 | 4 |
Figure S11. Get High-res Image Gene #69: '16p loss' versus Clinical Feature #9: 'RESIDUAL_TUMOR'
P value = 0.00316 (logrank test), Q value = 0.22
Table S12. Gene #71: '17p loss' versus Clinical Feature #1: 'Time to Death'
| nPatients | nDeath | Duration Range (Median), Month | |
|---|---|---|---|
| ALL | 90 | 33 | 0.0 - 153.6 (38.9) |
| 17P LOSS MUTATED | 33 | 18 | 4.1 - 95.2 (32.7) |
| 17P LOSS WILD-TYPE | 57 | 15 | 0.0 - 153.6 (43.3) |
Figure S12. Get High-res Image Gene #71: '17p loss' versus Clinical Feature #1: 'Time to Death'
P value = 0.00287 (logrank test), Q value = 0.22
Table S13. Gene #75: '19p loss' versus Clinical Feature #1: 'Time to Death'
| nPatients | nDeath | Duration Range (Median), Month | |
|---|---|---|---|
| ALL | 90 | 33 | 0.0 - 153.6 (38.9) |
| 19P LOSS MUTATED | 5 | 4 | 12.6 - 44.5 (18.1) |
| 19P LOSS WILD-TYPE | 85 | 29 | 0.0 - 153.6 (39.4) |
Figure S13. Get High-res Image Gene #75: '19p loss' versus Clinical Feature #1: 'Time to Death'
P value = 0.00218 (Fisher's exact test), Q value = 0.2
Table S14. Gene #77: '20p loss' versus Clinical Feature #9: 'RESIDUAL_TUMOR'
| nPatients | R0 | R1 | R2 | RX |
|---|---|---|---|---|
| ALL | 63 | 7 | 12 | 5 |
| 20P LOSS MUTATED | 3 | 4 | 0 | 0 |
| 20P LOSS WILD-TYPE | 60 | 3 | 12 | 5 |
Figure S14. Get High-res Image Gene #77: '20p loss' versus Clinical Feature #9: 'RESIDUAL_TUMOR'
-
Copy number data file = broad_values_by_arm.txt from GISTIC pipeline
-
Processed Copy number data file = /xchip/cga/gdac-prod/tcga-gdac/jobResults/GDAC_Correlate_Genomic_Events_Preprocess/ACC-TP/22522856/transformed.cor.cli.txt
-
Clinical data file = /xchip/cga/gdac-prod/tcga-gdac/jobResults/Append_Data/ACC-TP/22489368/ACC-TP.merged_data.txt
-
Number of patients = 90
-
Number of significantly arm-level cnvs = 82
-
Number of selected clinical features = 12
-
Exclude regions that fewer than K tumors have mutations, K = 3
For survival clinical features, the Kaplan-Meier survival curves of tumors with and without gene mutations were plotted and the statistical significance P values were estimated by logrank test (Bland and Altman 2004) using the 'survdiff' function in R
For binary or multi-class clinical features (nominal or ordinal), two-tailed Fisher's exact tests (Fisher 1922) were used to estimate the P values using the 'fisher.test' function in R
For multiple hypothesis correction, Q value is the False Discovery Rate (FDR) analogue of the P value (Benjamini and Hochberg 1995), defined as the minimum FDR at which the test may be called significant. We used the 'Benjamini and Hochberg' method of 'p.adjust' function in R to convert P values into Q values.
In addition to the links below, the full results of the analysis summarized in this report can also be downloaded programmatically using firehose_get, or interactively from either the Broad GDAC website or TCGA Data Coordination Center Portal.