This pipeline performs Gene Set Enrichment Analysis (GSEA) using The Broad Institute GSEA tool with MSigDB - Class2: Canonical Pathways gene sets. For a given phenotype subtype, it shows what pathways are significantly enriched in each subtype by comparing gene expression profiles between subtypes. Here, the phenotype is mRNAseq_cNMF subtypes having more than three samples and the input expression file "BRCA-TP.uncv2.mRNAseq_RSEM_normalized_log2.txt" is generated in the pipeline mRNAseq_Preprocess in the stddata run. This pipeline has the following features:
-
For each subtype, calculates enrichment scores (ES) using signal to noise (S2N) that checks similarity between subtypes in expression level then calculates p values through permutation test.
-
Lists pathways significantly enriched in each phenotype subtype and their enrichment scores (ES).
-
Lists top 20 core genes enriched in each significant gene set and their enrichment scores (ES).
-
Checks if the top core genes are up-regulated or down-regulated.
-
Checks if the top core genes are high expressed or low expressed.
-
Checks if the top core genes are significantly differently expressed genes.
Table 1. Get Full Table basic data info
| basic data info |
|---|
| Number of Gene Sets: 711 |
| Number of samples: 1093 |
| Original number of Gene Sets: 1320 |
| Maximum gene set size: 933 |
Table 2. Get Full Table pheno data info
| phenotype info |
|---|
| pheno.type: 1 - 7 :[ clus1 ] 267 |
| pheno.type: 2 - 7 :[ clus2 ] 171 |
| pheno.type: 3 - 7 :[ clus3 ] 147 |
| pheno.type: 4 - 7 :[ clus4 ] 227 |
| pheno.type: 5 - 7 :[ clus5 ] 209 |
| pheno.type: 6 - 7 :[ clus6 ] 52 |
| pheno.type: 7 - 7 :[ clus7 ] 20 |
For the expression subtypes of 18296 genes in 1094 samples, GSEA found enriched gene sets in each cluster using 1093 gene sets in MSigDB canonical pathways. Top enriched gene sets are listed as below.
-
clus1
-
Top enriched gene sets are KEGG GLYCOSYLPHOSPHATIDYLINOSITOL GPI ANCHOR BIOSYNTHESIS, KEGG BASE EXCISION REPAIR, BIOCARTA CARM ER PATHWAY, BIOCARTA MPR PATHWAY, REACTOME METABOLISM OF VITAMINS AND COFACTORS, REACTOME GLUCONEOGENESIS, REACTOME TRANSCRIPTION COUPLED NER TC NER, REACTOME NUCLEOTIDE EXCISION REPAIR, REACTOME FORMATION OF RNA POL II ELONGATION COMPLEX , REACTOME POST TRANSLATIONAL MODIFICATION SYNTHESIS OF GPI ANCHORED PROTEINS
-
And common core enriched genes are GPLD1, PGAP1, PIGF, PIGH, PIGL, PIGN, PIGO, PIGP, PIGQ, PIGS
-
clus2
-
Top enriched gene sets are KEGG STEROID HORMONE BIOSYNTHESIS, KEGG PORPHYRIN AND CHLOROPHYLL METABOLISM, KEGG PROTEASOME, BIOCARTA PROTEASOME PATHWAY, BIOCARTA VEGF PATHWAY, PID INTEGRIN3 PATHWAY, REACTOME SIGNALING BY WNT, REACTOME CROSS PRESENTATION OF SOLUBLE EXOGENOUS ANTIGENS ENDOSOMES, REACTOME ANTIGEN PROCESSING CROSS PRESENTATION, REACTOME ER PHAGOSOME PATHWAY
-
And common core enriched genes are PSMA2, PSMA3, PSMA4, PSMA6, PSMA7, PSMB1, PSMB3, PSMB5, PSMB7, PSMB9
-
clus3
-
Top enriched gene sets are KEGG FATTY ACID METABOLISM, KEGG STEROID HORMONE BIOSYNTHESIS, KEGG PURINE METABOLISM, KEGG TYROSINE METABOLISM, KEGG O GLYCAN BIOSYNTHESIS, KEGG INOSITOL PHOSPHATE METABOLISM, KEGG GLYCEROPHOSPHOLIPID METABOLISM, KEGG ETHER LIPID METABOLISM, KEGG ARACHIDONIC ACID METABOLISM, KEGG BUTANOATE METABOLISM
-
And common core enriched genes are AKT3, PIK3R1, PAK7, EGFR, NRG1, NRG2, JUN, PAK3, PIK3CD, PIK3CG
-
clus4
-
Top enriched gene sets are KEGG FATTY ACID METABOLISM, KEGG PURINE METABOLISM, KEGG ALANINE ASPARTATE AND GLUTAMATE METABOLISM, KEGG VALINE LEUCINE AND ISOLEUCINE DEGRADATION, KEGG PROPANOATE METABOLISM, KEGG BUTANOATE METABOLISM, KEGG PEROXISOME, ST GA13 PATHWAY, PID AR PATHWAY, PID TRAIL PATHWAY
-
And common core enriched genes are ABAT, HMGCL, ACAA1, ACADS, ACAT1, ALDH3A2, ALDH9A1, HMGCS2, GAD1, DDO
-
clus5
-
Top enriched gene sets are KEGG LYSINE DEGRADATION, KEGG GLYCOSPHINGOLIPID BIOSYNTHESIS LACTO AND NEOLACTO SERIES, KEGG RNA POLYMERASE, KEGG CELL CYCLE, PID AURORA B PATHWAY, PID E2F PATHWAY, PID MYC ACTIVPATHWAY, PID LIS1PATHWAY, PID AURORA A PATHWAY, PID RB 1PATHWAY
-
And common core enriched genes are MAGOH, NCBP2, RBM8A, RNPS1, UPF3B, CCNB1, CDC25A, E2F3, MYC, CPSF1
-
clus6
-
Top enriched gene sets are KEGG GLYCOLYSIS GLUCONEOGENESIS, KEGG CITRATE CYCLE TCA CYCLE, KEGG FATTY ACID METABOLISM, KEGG ALANINE ASPARTATE AND GLUTAMATE METABOLISM, KEGG GLYCINE SERINE AND THREONINE METABOLISM, KEGG ARGININE AND PROLINE METABOLISM, KEGG TYROSINE METABOLISM, KEGG GLYCEROLIPID METABOLISM, KEGG GLYCEROPHOSPHOLIPID METABOLISM, KEGG ETHER LIPID METABOLISM
-
And common core enriched genes are PCK1, SLC2A4, ADIPOQ, CD36, LEP, PPARGC1A, ACACB, G6PC2, GYS2, IRS2
-
clus7
-
Top enriched gene sets are KEGG TRYPTOPHAN METABOLISM, KEGG AMINO SUGAR AND NUCLEOTIDE SUGAR METABOLISM, KEGG INOSITOL PHOSPHATE METABOLISM, KEGG ETHER LIPID METABOLISM, KEGG RIBOSOME, KEGG PROTEASOME, KEGG CYTOKINE CYTOKINE RECEPTOR INTERACTION, KEGG CHEMOKINE SIGNALING PATHWAY, KEGG PHOSPHATIDYLINOSITOL SIGNALING SYSTEM, KEGG UBIQUITIN MEDIATED PROTEOLYSIS
-
And common core enriched genes are PSMB8, FYN, PSMA8, PSMB10, PSMB9, PSME2, B2M, HCK, HLA-A, LCK
Table 3. Get Full Table This table shows top 10 pathways which are significantly enriched in cluster clus1. It displays only significant gene sets satisfying nom.p.val.threshold (-1), fwer.p.val.threshold (-1) , fdr.q.val.threshold (0.25) and the default table is sorted by Normalized Enrichment Score (NES). Further details on NES statistics, please visit The Broad GSEA website.
| GeneSet(GS) | Size(#genes) | genes.ES.table | ES | NES | NOM.p.val | FDR.q.val | FWER.p.val | Tag.. | Gene.. | Signal | FDR..median. | glob.p.val |
|---|---|---|---|---|---|---|---|---|---|---|---|---|
| KEGG GLYCOSYLPHOSPHATIDYLINOSITOL GPI ANCHOR BIOSYNTHESIS | 25 | genes.ES.table | 0.56 | 1.9 | 0.0063 | 0.46 | 0.26 | 0.6 | 0.21 | 0.47 | 0 | 0.1 |
| KEGG BASE EXCISION REPAIR | 33 | genes.ES.table | 0.41 | 1.4 | 0.16 | 1 | 1 | 0.48 | 0.32 | 0.33 | 0.8 | 0.4 |
| BIOCARTA CARM ER PATHWAY | 35 | genes.ES.table | 0.39 | 1.4 | 0.08 | 1 | 0.99 | 0.17 | 0.065 | 0.16 | 1 | 0.5 |
| BIOCARTA MPR PATHWAY | 33 | genes.ES.table | 0.49 | 1.6 | 0.02 | 1 | 0.9 | 0.39 | 0.19 | 0.32 | 0.59 | 0.33 |
| REACTOME METABOLISM OF VITAMINS AND COFACTORS | 50 | genes.ES.table | 0.43 | 1.7 | 0.014 | 1 | 0.82 | 0.36 | 0.15 | 0.31 | 0.46 | 0.27 |
| REACTOME GLUCONEOGENESIS | 30 | genes.ES.table | 0.46 | 1.4 | 0.081 | 1 | 1 | 0.3 | 0.16 | 0.25 | 0.85 | 0.42 |
| REACTOME TRANSCRIPTION COUPLED NER TC NER | 44 | genes.ES.table | 0.37 | 1.4 | 0.15 | 1 | 1 | 0.48 | 0.33 | 0.32 | 0.75 | 0.37 |
| REACTOME NUCLEOTIDE EXCISION REPAIR | 49 | genes.ES.table | 0.38 | 1.5 | 0.098 | 1 | 0.97 | 0.55 | 0.35 | 0.36 | 0.98 | 0.49 |
| REACTOME FORMATION OF RNA POL II ELONGATION COMPLEX | 43 | genes.ES.table | 0.41 | 1.7 | 0.027 | 1 | 0.72 | 0.33 | 0.25 | 0.24 | 0.43 | 0.26 |
| REACTOME POST TRANSLATIONAL MODIFICATION SYNTHESIS OF GPI ANCHORED PROTEINS | 26 | genes.ES.table | 0.37 | 1.4 | 0.13 | 1 | 1 | 0.54 | 0.21 | 0.42 | 0.77 | 0.38 |
Table S1. Get Full Table This table shows a Running Enrichment Score (RES) of each gene in this pathway, that is, the enrichment score at this point in the ranked list of genes. All genes are ranked by Signal-to-Noise (S2N), a measure of similarity as default and are used to obtain ES matrix of all genes. In this way, GSEA tool uses expression pattern of not only overlapped genes but also not-overlapped genes to produce ES matrix.
| Rank | GENE | SYMBOL | DESC | LIST.LOC | S2N | RES | CORE_ENRICHMENT |
|---|---|---|---|---|---|---|---|
| 1 | PIGP | PIGP | PIGP | 1359 | 0.14 | 0.02 | YES |
| 2 | PIGT | PIGT | PIGT | 1920 | 0.11 | 0.062 | YES |
| 3 | PIGW | PIGW | PIGW | 1945 | 0.1 | 0.13 | YES |
| 4 | PIGX | PIGX | PIGX | 2558 | 0.084 | 0.16 | YES |
| 5 | PIGS | PIGS | PIGS | 2680 | 0.08 | 0.21 | YES |
| 6 | PIGV | PIGV | PIGV | 3111 | 0.069 | 0.23 | YES |
| 7 | PIGO | PIGO | PIGO | 3209 | 0.067 | 0.27 | YES |
| 8 | PIGU | PIGU | PIGU | 3241 | 0.066 | 0.32 | YES |
| 9 | PIGQ | PIGQ | PIGQ | 3251 | 0.066 | 0.36 | YES |
| 10 | GPLD1 | GPLD1 | GPLD1 | 3562 | 0.059 | 0.38 | YES |
| 11 | PIGL | PIGL | PIGL | 3565 | 0.059 | 0.42 | YES |
| 12 | PIGH | PIGH | PIGH | 3601 | 0.058 | 0.46 | YES |
| 13 | PGAP1 | PGAP1 | PGAP1 | 3759 | 0.055 | 0.49 | YES |
| 14 | PIGN | PIGN | PIGN | 3805 | 0.054 | 0.53 | YES |
| 15 | PIGF | PIGF | PIGF | 3900 | 0.052 | 0.56 | YES |
| 16 | PIGG | PIGG | PIGG | 4507 | 0.042 | 0.55 | NO |
| 17 | PIGM | PIGM | PIGM | 5395 | 0.03 | 0.53 | NO |
| 18 | PIGB | PIGB | PIGB | 5944 | 0.022 | 0.51 | NO |
| 19 | DPM2 | DPM2 | DPM2 | 5959 | 0.022 | 0.52 | NO |
| 20 | GPAA1 | GPAA1 | GPAA1 | 6172 | 0.019 | 0.53 | NO |
| 21 | PIGY | PIGY | PIGY | 8633 | -0.0099 | 0.4 | NO |
| 22 | PIGK | PIGK | PIGK | 9865 | -0.026 | 0.35 | NO |
| 23 | PIGZ | PIGZ | PIGZ | 10310 | -0.032 | 0.35 | NO |
| 24 | PIGC | PIGC | PIGC | 10543 | -0.036 | 0.36 | NO |
| 25 | PIGA | PIGA | PIGA | 13144 | -0.093 | 0.28 | NO |
Figure S1. Get High-res Image This plot shows mRNAseq_cNMF expression data heatmap (on the left) a RunningEnrichmentScore(RES) plot (on the top right) and a Signal2Noise(S2N) plot (on the bottom right) of genes in the pathway: KEGG GLYCOSYLPHOSPHATIDYLINOSITOL GPI ANCHOR BIOSYNTHESIS.
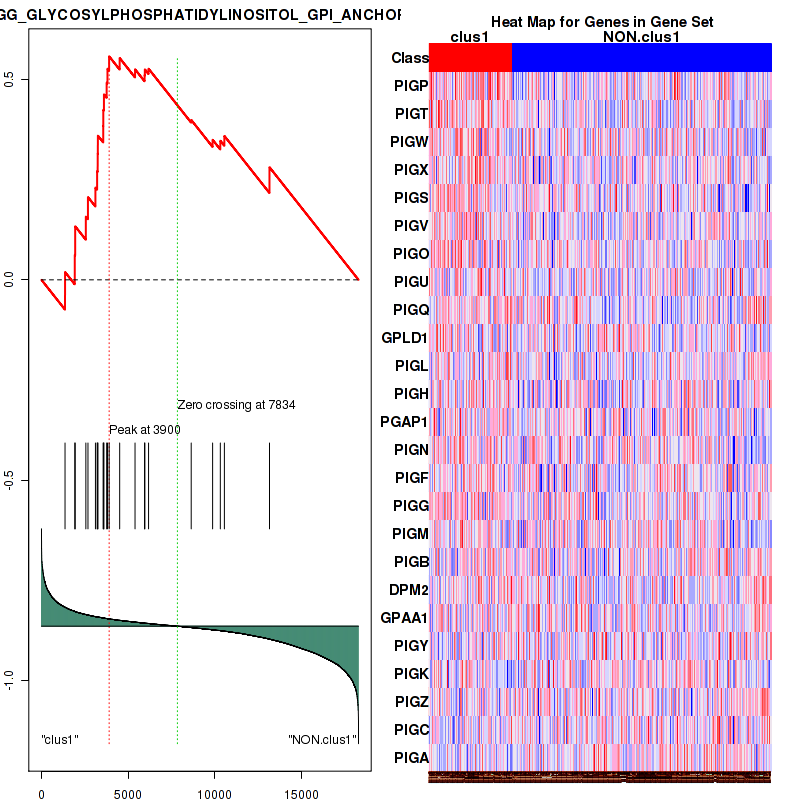
Figure S2. Get High-res Image For the top 5 core enriched genes in the pathway: KEGG GLYCOSYLPHOSPHATIDYLINOSITOL GPI ANCHOR BIOSYNTHESIS, this volcano plot shows how much they are up/down-regulated and significant. The significance was calculated by empirical bayesian fit

Table S2. Get Full Table This table shows a Running Enrichment Score (RES) of each gene in this pathway, that is, the enrichment score at this point in the ranked list of genes. All genes are ranked by Signal-to-Noise (S2N), a measure of similarity as default and are used to obtain ES matrix of all genes. In this way, GSEA tool uses expression pattern of not only overlapped genes but also not-overlapped genes to produce ES matrix.
| Rank | GENE | SYMBOL | DESC | LIST.LOC | S2N | RES | CORE_ENRICHMENT |
|---|---|---|---|---|---|---|---|
| 1 | MNAT1 | MNAT1 | MNAT1 | 1672 | 0.12 | -0.019 | YES |
| 2 | SUPT4H1 | SUPT4H1 | SUPT4H1 | 1870 | 0.11 | 0.037 | YES |
| 3 | POLR2K | POLR2K | POLR2K | 1958 | 0.1 | 0.096 | YES |
| 4 | CCNT1 | CCNT1 | CCNT1 | 2047 | 0.1 | 0.15 | YES |
| 5 | GTF2H2 | GTF2H2 | GTF2H2 | 2139 | 0.097 | 0.21 | YES |
| 6 | TCEB1 | TCEB1 | TCEB1 | 2292 | 0.092 | 0.26 | YES |
| 7 | WHSC2 | WHSC2 | WHSC2 | 3118 | 0.068 | 0.25 | YES |
| 8 | GTF2H3 | GTF2H3 | GTF2H3 | 3426 | 0.062 | 0.28 | YES |
| 9 | CCNH | CCNH | CCNH | 3467 | 0.061 | 0.31 | YES |
| 10 | TH1L | TH1L | TH1L | 3510 | 0.06 | 0.34 | YES |
| 11 | TCEA1 | TCEA1 | TCEA1 | 3536 | 0.06 | 0.38 | YES |
| 12 | GTF2H2B | GTF2H2B | GTF2H2B | 3945 | 0.051 | 0.39 | YES |
| 13 | SUPT16H | SUPT16H | SUPT16H | 4397 | 0.044 | 0.39 | YES |
| 14 | POLR2C | POLR2C | POLR2C | 4594 | 0.041 | 0.41 | YES |
| 15 | CDK7 | CDK7 | CDK7 | 5436 | 0.029 | 0.38 | NO |
| 16 | ERCC3 | ERCC3 | ERCC3 | 5833 | 0.023 | 0.37 | NO |
| 17 | POLR2E | POLR2E | POLR2E | 5916 | 0.022 | 0.38 | NO |
| 18 | POLR2I | POLR2I | POLR2I | 5986 | 0.022 | 0.39 | NO |
| 19 | TCEB2 | TCEB2 | TCEB2 | 6046 | 0.021 | 0.4 | NO |
| 20 | POLR2G | POLR2G | POLR2G | 6326 | 0.017 | 0.4 | NO |
| 21 | POLR2B | POLR2B | POLR2B | 6796 | 0.012 | 0.38 | NO |
| 22 | POLR2A | POLR2A | POLR2A | 6833 | 0.011 | 0.38 | NO |
| 23 | GTF2F1 | GTF2F1 | GTF2F1 | 7115 | 0.008 | 0.37 | NO |
| 24 | CCNT2 | CCNT2 | CCNT2 | 7168 | 0.0075 | 0.37 | NO |
| 25 | NCBP2 | NCBP2 | NCBP2 | 7248 | 0.0066 | 0.37 | NO |
| 26 | POLR2L | POLR2L | POLR2L | 7368 | 0.0053 | 0.37 | NO |
| 27 | POLR2H | POLR2H | POLR2H | 7579 | 0.0029 | 0.36 | NO |
| 28 | TCEB3 | TCEB3 | TCEB3 | 7584 | 0.0028 | 0.36 | NO |
| 29 | POLR2J | POLR2J | POLR2J | 7666 | 0.0018 | 0.36 | NO |
| 30 | GTF2H1 | GTF2H1 | GTF2H1 | 7947 | -0.0013 | 0.34 | NO |
| 31 | RDBP | RDBP | RDBP | 7954 | -0.0014 | 0.34 | NO |
| 32 | COBRA1 | COBRA1 | COBRA1 | 8791 | -0.012 | 0.3 | NO |
| 33 | POLR2D | POLR2D | POLR2D | 8857 | -0.012 | 0.31 | NO |
| 34 | NCBP1 | NCBP1 | NCBP1 | 8873 | -0.013 | 0.32 | NO |
| 35 | CDK9 | CDK9 | CDK9 | 8905 | -0.013 | 0.32 | NO |
| 36 | ERCC2 | ERCC2 | ERCC2 | 9046 | -0.015 | 0.32 | NO |
| 37 | CTDP1 | CTDP1 | CTDP1 | 9990 | -0.028 | 0.29 | NO |
| 38 | SSRP1 | SSRP1 | SSRP1 | 10091 | -0.029 | 0.3 | NO |
| 39 | ELL | ELL | ELL | 10340 | -0.032 | 0.31 | NO |
| 40 | GTF2F2 | GTF2F2 | GTF2F2 | 10857 | -0.041 | 0.3 | NO |
| 41 | SUPT5H | SUPT5H | SUPT5H | 11335 | -0.049 | 0.31 | NO |
| 42 | POLR2F | POLR2F | POLR2F | 11393 | -0.05 | 0.34 | NO |
| 43 | GTF2H4 | GTF2H4 | GTF2H4 | 12113 | -0.066 | 0.34 | NO |
Figure S3. Get High-res Image This plot shows mRNAseq_cNMF expression data heatmap (on the left) a RunningEnrichmentScore(RES) plot (on the top right) and a Signal2Noise(S2N) plot (on the bottom right) of genes in the pathway: KEGG BASE EXCISION REPAIR.
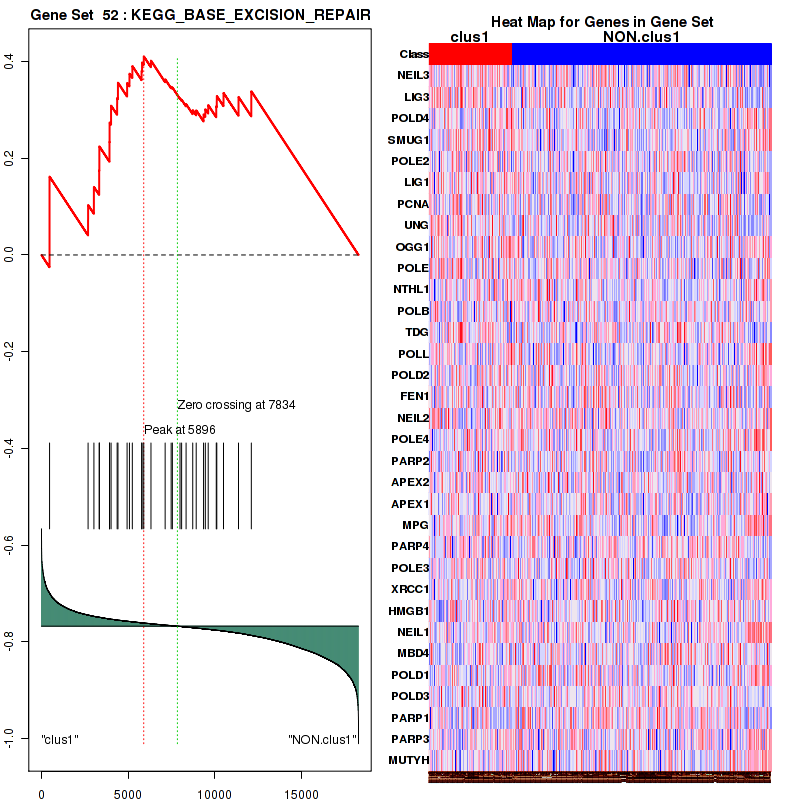
Figure S4. Get High-res Image For the top 5 core enriched genes in the pathway: KEGG BASE EXCISION REPAIR, this volcano plot shows how much they are up/down-regulated and significant. The significance was calculated by empirical bayesian fit
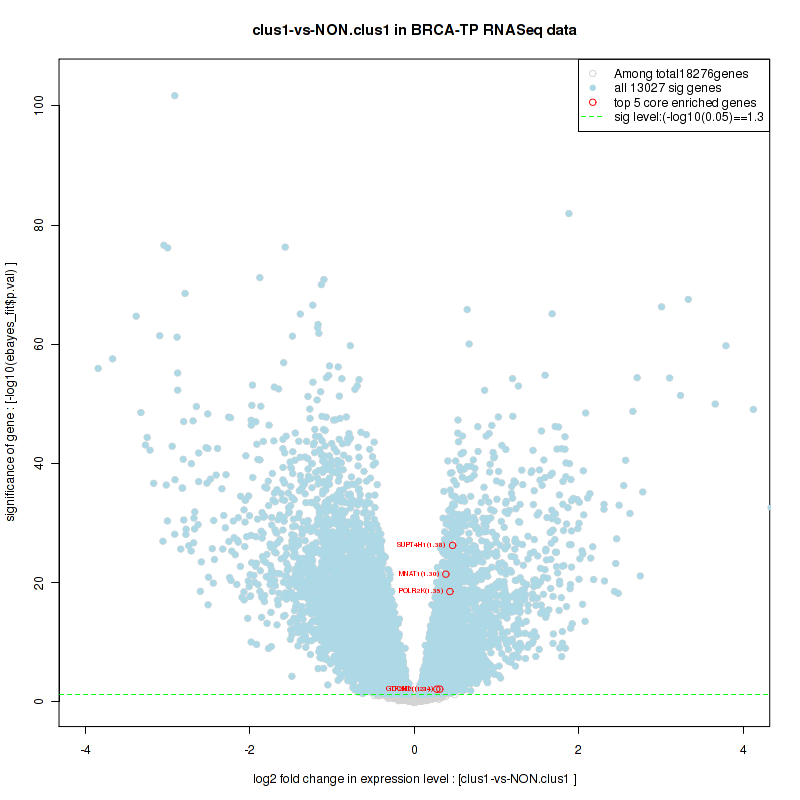
Table S3. Get Full Table This table shows a Running Enrichment Score (RES) of each gene in this pathway, that is, the enrichment score at this point in the ranked list of genes. All genes are ranked by Signal-to-Noise (S2N), a measure of similarity as default and are used to obtain ES matrix of all genes. In this way, GSEA tool uses expression pattern of not only overlapped genes but also not-overlapped genes to produce ES matrix.
| Rank | GENE | SYMBOL | DESC | LIST.LOC | S2N | RES | CORE_ENRICHMENT |
|---|---|---|---|---|---|---|---|
| 1 | SLC46A1 | SLC46A1 | SLC46A1 | 787 | 0.18 | 0.0048 | YES |
| 2 | SLC19A2 | SLC19A2 | SLC19A2 | 878 | 0.18 | 0.046 | YES |
| 3 | SLC23A1 | SLC23A1 | SLC23A1 | 999 | 0.16 | 0.081 | YES |
| 4 | NMNAT3 | NMNAT3 | NMNAT3 | 1066 | 0.16 | 0.12 | YES |
| 5 | GPHN | GPHN | GPHN | 1077 | 0.16 | 0.16 | YES |
| 6 | GSTO2 | GSTO2 | GSTO2 | 1135 | 0.15 | 0.2 | YES |
| 7 | PNPO | PNPO | PNPO | 1452 | 0.13 | 0.21 | YES |
| 8 | ENPP1 | ENPP1 | ENPP1 | 1487 | 0.13 | 0.24 | YES |
| 9 | DHFR | DHFR | DHFR | 1538 | 0.12 | 0.27 | YES |
| 10 | PANK3 | PANK3 | PANK3 | 1661 | 0.12 | 0.3 | YES |
| 11 | NFS1 | NFS1 | NFS1 | 1817 | 0.11 | 0.32 | YES |
| 12 | COASY | COASY | COASY | 2083 | 0.099 | 0.33 | YES |
| 13 | RFK | RFK | RFK | 2204 | 0.095 | 0.35 | YES |
| 14 | MOCS3 | MOCS3 | MOCS3 | 2235 | 0.094 | 0.37 | YES |
| 15 | MOCS2 | MOCS2 | MOCS2 | 2331 | 0.09 | 0.39 | YES |
| 16 | SLC19A1 | SLC19A1 | SLC19A1 | 2400 | 0.088 | 0.41 | YES |
| 17 | THTPA | THTPA | THTPA | 2517 | 0.084 | 0.42 | YES |
| 18 | FASN | FASN | FASN | 2666 | 0.08 | 0.43 | YES |
| 19 | NADSYN1 | NADSYN1 | NADSYN1 | 3980 | 0.051 | 0.38 | NO |
| 20 | NMNAT2 | NMNAT2 | NMNAT2 | 4009 | 0.05 | 0.39 | NO |
| 21 | SLC25A32 | SLC25A32 | SLC25A32 | 4851 | 0.037 | 0.35 | NO |
| 22 | MTHFD1 | MTHFD1 | MTHFD1 | 5240 | 0.031 | 0.34 | NO |
| 23 | PPCS | PPCS | PPCS | 5729 | 0.025 | 0.32 | NO |
| 24 | PANK4 | PANK4 | PANK4 | 6013 | 0.021 | 0.31 | NO |
| 25 | PPCDC | PPCDC | PPCDC | 6045 | 0.021 | 0.31 | NO |
| 26 | SLC2A1 | SLC2A1 | SLC2A1 | 6162 | 0.019 | 0.31 | NO |
| 27 | MOCS1 | MOCS1 | MOCS1 | 6186 | 0.019 | 0.31 | NO |
| 28 | ACP5 | ACP5 | ACP5 | 6485 | 0.016 | 0.3 | NO |
| 29 | PANK1 | PANK1 | PANK1 | 6499 | 0.015 | 0.3 | NO |
| 30 | AASDHPPT | AASDHPPT | AASDHPPT | 7091 | 0.0083 | 0.27 | NO |
| 31 | QPRT | QPRT | QPRT | 7823 | 0.00012 | 0.23 | NO |
| 32 | PANK2 | PANK2 | PANK2 | 8169 | -0.004 | 0.22 | NO |
| 33 | SHMT1 | SHMT1 | SHMT1 | 8463 | -0.0079 | 0.2 | NO |
| 34 | NADK | NADK | NADK | 8594 | -0.0094 | 0.2 | NO |
| 35 | SLC23A2 | SLC23A2 | SLC23A2 | 8598 | -0.0095 | 0.2 | NO |
| 36 | MOCOS | MOCOS | MOCOS | 9549 | -0.022 | 0.15 | NO |
| 37 | CYB5A | CYB5A | CYB5A | 9771 | -0.024 | 0.15 | NO |
| 38 | NMNAT1 | NMNAT1 | NMNAT1 | 9798 | -0.025 | 0.15 | NO |
| 39 | GSTO1 | GSTO1 | GSTO1 | 9815 | -0.025 | 0.16 | NO |
| 40 | FLAD1 | FLAD1 | FLAD1 | 10724 | -0.038 | 0.12 | NO |
| 41 | MTHFR | MTHFR | MTHFR | 11210 | -0.047 | 0.1 | NO |
| 42 | SLC25A16 | SLC25A16 | SLC25A16 | 11449 | -0.051 | 0.1 | NO |
| 43 | FPGS | FPGS | FPGS | 11467 | -0.052 | 0.12 | NO |
| 44 | CYB5R3 | CYB5R3 | CYB5R3 | 11718 | -0.057 | 0.12 | NO |
| 45 | PDXK | PDXK | PDXK | 13456 | -0.1 | 0.049 | NO |
| 46 | TPK1 | TPK1 | TPK1 | 14087 | -0.12 | 0.047 | NO |
| 47 | SLC5A6 | SLC5A6 | SLC5A6 | 14503 | -0.14 | 0.06 | NO |
| 48 | NAMPT | NAMPT | NAMPT | 14532 | -0.14 | 0.095 | NO |
| 49 | SLC2A3 | SLC2A3 | SLC2A3 | 15037 | -0.16 | 0.11 | NO |
| 50 | SLC19A3 | SLC19A3 | SLC19A3 | 16832 | -0.26 | 0.079 | NO |
Figure S5. Get High-res Image This plot shows mRNAseq_cNMF expression data heatmap (on the left) a RunningEnrichmentScore(RES) plot (on the top right) and a Signal2Noise(S2N) plot (on the bottom right) of genes in the pathway: BIOCARTA CARM ER PATHWAY.
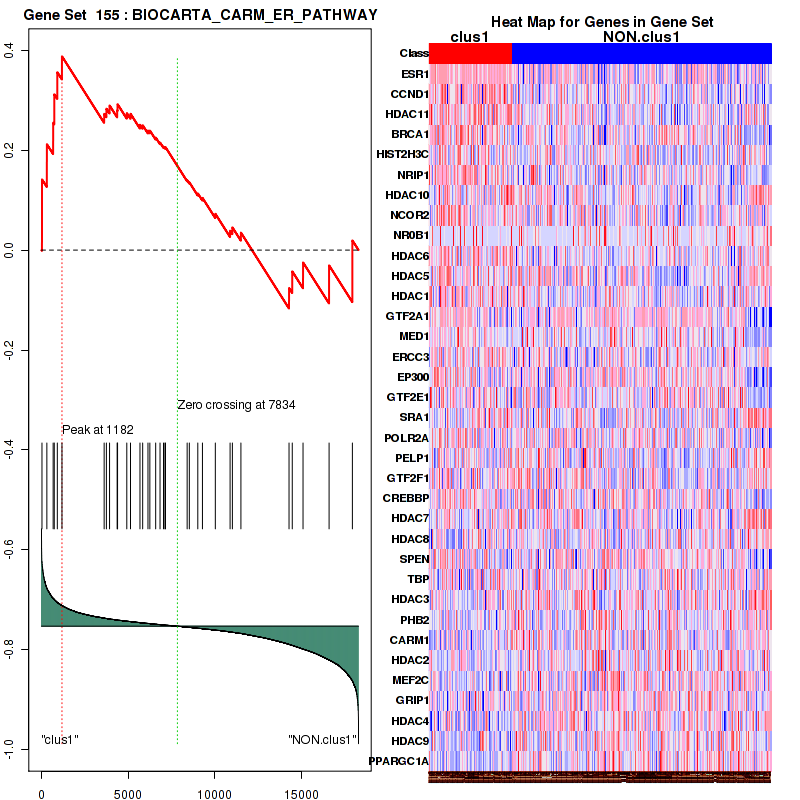
Figure S6. Get High-res Image For the top 5 core enriched genes in the pathway: BIOCARTA CARM ER PATHWAY, this volcano plot shows how much they are up/down-regulated and significant. The significance was calculated by empirical bayesian fit

Table S4. Get Full Table This table shows a Running Enrichment Score (RES) of each gene in this pathway, that is, the enrichment score at this point in the ranked list of genes. All genes are ranked by Signal-to-Noise (S2N), a measure of similarity as default and are used to obtain ES matrix of all genes. In this way, GSEA tool uses expression pattern of not only overlapped genes but also not-overlapped genes to produce ES matrix.
| Rank | GENE | SYMBOL | DESC | LIST.LOC | S2N | RES | CORE_ENRICHMENT |
|---|---|---|---|---|---|---|---|
| 1 | MYT1 | MYT1 | MYT1 | 3 | 0.63 | 0.2 | YES |
| 2 | ADCY1 | ADCY1 | ADCY1 | 160 | 0.33 | 0.3 | YES |
| 3 | CDC25C | CDC25C | CDC25C | 514 | 0.23 | 0.35 | YES |
| 4 | PGR | PGR | PGR | 1008 | 0.16 | 0.37 | YES |
| 5 | PAQR5 | PAQR5 | PAQR5 | 1136 | 0.15 | 0.41 | YES |
| 6 | GNGT1 | GNGT1 | GNGT1 | 1745 | 0.11 | 0.41 | YES |
| 7 | MAPK3 | MAPK3 | MAPK3 | 2050 | 0.1 | 0.43 | YES |
| 8 | PRKAR1A | PRKAR1A | PRKAR1A | 2274 | 0.092 | 0.45 | YES |
| 9 | CDK1 | CDK1 | CDK1 | 2488 | 0.086 | 0.46 | YES |
| 10 | HRAS | HRAS | HRAS | 2624 | 0.082 | 0.48 | YES |
| 11 | CCNB1 | CCNB1 | CCNB1 | 2922 | 0.073 | 0.49 | YES |
| 12 | PRKAR2B | PRKAR2B | PRKAR2B | 3279 | 0.065 | 0.49 | YES |
| 13 | PAQR7 | PAQR7 | PAQR7 | 3531 | 0.06 | 0.49 | YES |
| 14 | SRC | SRC | SRC | 3958 | 0.051 | 0.48 | NO |
| 15 | PIN1 | PIN1 | PIN1 | 4757 | 0.038 | 0.45 | NO |
| 16 | GNB1 | GNB1 | GNB1 | 5608 | 0.026 | 0.42 | NO |
| 17 | PRKAR2A | PRKAR2A | PRKAR2A | 5614 | 0.026 | 0.42 | NO |
| 18 | ARPC3 | ARPC3 | ARPC3 | 6076 | 0.02 | 0.4 | NO |
| 19 | MAPK1 | MAPK1 | MAPK1 | 6839 | 0.011 | 0.37 | NO |
| 20 | GNAS | GNAS | GNAS | 7633 | 0.0022 | 0.32 | NO |
| 21 | ARPC1A | ARPC1A | ARPC1A | 8384 | -0.0068 | 0.28 | NO |
| 22 | PRKACB | PRKACB | PRKACB | 9546 | -0.022 | 0.23 | NO |
| 23 | PRKAR1B | PRKAR1B | PRKAR1B | 9578 | -0.022 | 0.23 | NO |
| 24 | ACTR2 | ACTR2 | ACTR2 | 9896 | -0.026 | 0.22 | NO |
| 25 | ARPC4 | ARPC4 | ARPC4 | 10090 | -0.029 | 0.22 | NO |
| 26 | CAP1 | CAP1 | CAP1 | 11743 | -0.058 | 0.15 | NO |
| 27 | ARPC2 | ARPC2 | ARPC2 | 11785 | -0.058 | 0.17 | NO |
| 28 | ARPC5 | ARPC5 | ARPC5 | 11910 | -0.062 | 0.18 | NO |
| 29 | ACTA1 | ACTA1 | ACTA1 | 12084 | -0.066 | 0.19 | NO |
| 30 | ACTR3 | ACTR3 | ACTR3 | 12458 | -0.075 | 0.19 | NO |
| 31 | ARPC1B | ARPC1B | ARPC1B | 12874 | -0.085 | 0.2 | NO |
| 32 | RPS6KA1 | RPS6KA1 | RPS6KA1 | 13319 | -0.098 | 0.2 | NO |
| 33 | GNAI1 | GNAI1 | GNAI1 | 16152 | -0.22 | 0.12 | NO |
Figure S7. Get High-res Image This plot shows mRNAseq_cNMF expression data heatmap (on the left) a RunningEnrichmentScore(RES) plot (on the top right) and a Signal2Noise(S2N) plot (on the bottom right) of genes in the pathway: BIOCARTA MPR PATHWAY.
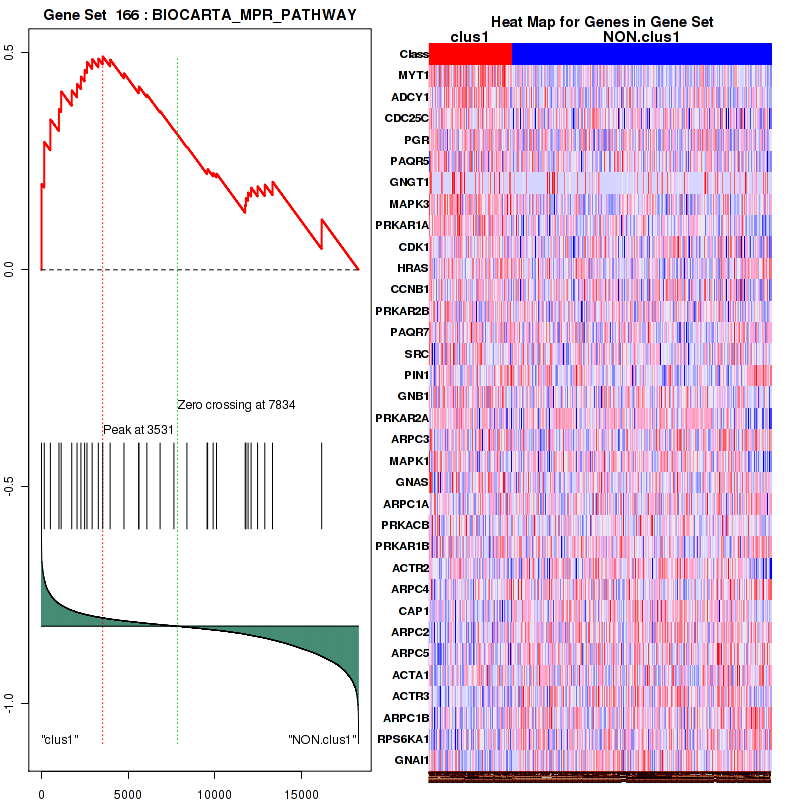
Figure S8. Get High-res Image For the top 5 core enriched genes in the pathway: BIOCARTA MPR PATHWAY, this volcano plot shows how much they are up/down-regulated and significant. The significance was calculated by empirical bayesian fit

Table S5. Get Full Table This table shows a Running Enrichment Score (RES) of each gene in this pathway, that is, the enrichment score at this point in the ranked list of genes. All genes are ranked by Signal-to-Noise (S2N), a measure of similarity as default and are used to obtain ES matrix of all genes. In this way, GSEA tool uses expression pattern of not only overlapped genes but also not-overlapped genes to produce ES matrix.
| Rank | GENE | SYMBOL | DESC | LIST.LOC | S2N | RES | CORE_ENRICHMENT |
|---|---|---|---|---|---|---|---|
| 1 | VPS37D | VPS37D | VPS37D | 766 | 0.19 | 0.082 | YES |
| 2 | CHMP4C | CHMP4C | CHMP4C | 1729 | 0.12 | 0.1 | YES |
| 3 | VPS25 | VPS25 | VPS25 | 1732 | 0.12 | 0.18 | YES |
| 4 | CHMP5 | CHMP5 | CHMP5 | 2089 | 0.099 | 0.22 | YES |
| 5 | TSG101 | TSG101 | TSG101 | 2189 | 0.095 | 0.28 | YES |
| 6 | VPS28 | VPS28 | VPS28 | 2596 | 0.082 | 0.31 | YES |
| 7 | VPS37A | VPS37A | VPS37A | 2853 | 0.075 | 0.35 | YES |
| 8 | CHMP2A | CHMP2A | CHMP2A | 3716 | 0.056 | 0.34 | YES |
| 9 | VPS37C | VPS37C | VPS37C | 3781 | 0.054 | 0.37 | YES |
| 10 | STAM2 | STAM2 | STAM2 | 3910 | 0.052 | 0.4 | YES |
| 11 | VPS4A | VPS4A | VPS4A | 4804 | 0.038 | 0.37 | YES |
| 12 | CHMP6 | CHMP6 | CHMP6 | 4995 | 0.035 | 0.39 | YES |
| 13 | SNF8 | SNF8 | SNF8 | 5007 | 0.035 | 0.41 | YES |
| 14 | VPS4B | VPS4B | VPS4B | 5231 | 0.032 | 0.42 | YES |
| 15 | HGS | HGS | HGS | 5615 | 0.026 | 0.41 | YES |
| 16 | CHMP4B | CHMP4B | CHMP4B | 5769 | 0.024 | 0.42 | YES |
| 17 | STAM | STAM | STAM | 5785 | 0.024 | 0.44 | YES |
| 18 | CHMP4A | CHMP4A | CHMP4A | 6085 | 0.02 | 0.43 | NO |
| 19 | CHMP2B | CHMP2B | CHMP2B | 6442 | 0.016 | 0.42 | NO |
| 20 | VPS36 | VPS36 | VPS36 | 7251 | 0.0065 | 0.38 | NO |
| 21 | VTA1 | VTA1 | VTA1 | 8915 | -0.013 | 0.3 | NO |
| 22 | CHMP7 | CHMP7 | CHMP7 | 10786 | -0.039 | 0.23 | NO |
| 23 | UBA52 | UBA52 | UBA52 | 11240 | -0.048 | 0.23 | NO |
| 24 | RPS27A | RPS27A | RPS27A | 13191 | -0.094 | 0.19 | NO |
| 25 | VPS37B | VPS37B | VPS37B | 14468 | -0.14 | 0.21 | NO |
Figure S9. Get High-res Image This plot shows mRNAseq_cNMF expression data heatmap (on the left) a RunningEnrichmentScore(RES) plot (on the top right) and a Signal2Noise(S2N) plot (on the bottom right) of genes in the pathway: REACTOME METABOLISM OF VITAMINS AND COFACTORS.
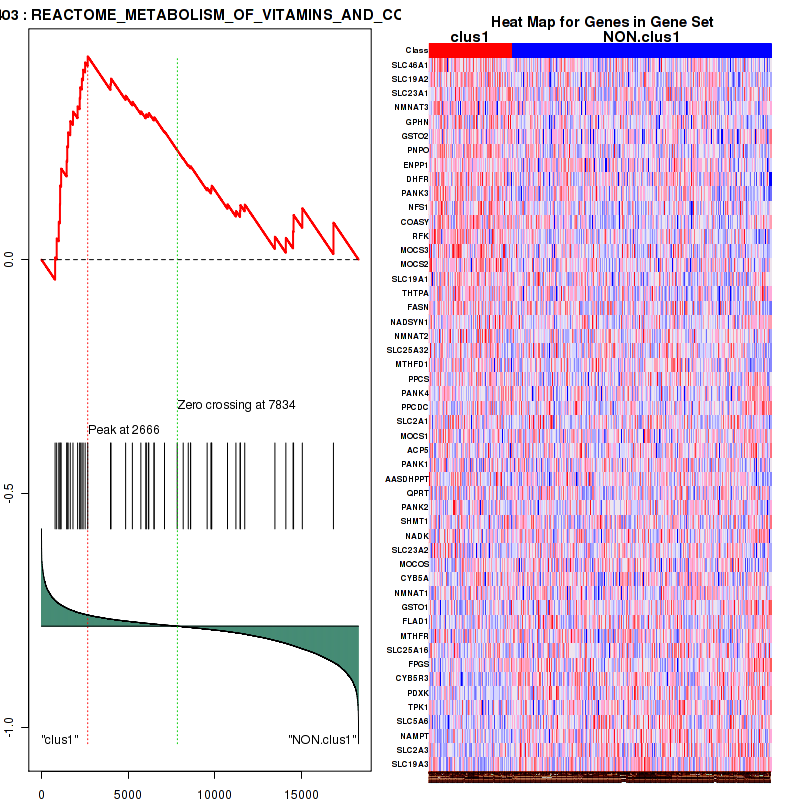
Figure S10. Get High-res Image For the top 5 core enriched genes in the pathway: REACTOME METABOLISM OF VITAMINS AND COFACTORS, this volcano plot shows how much they are up/down-regulated and significant. The significance was calculated by empirical bayesian fit
Table S6. Get Full Table This table shows a Running Enrichment Score (RES) of each gene in this pathway, that is, the enrichment score at this point in the ranked list of genes. All genes are ranked by Signal-to-Noise (S2N), a measure of similarity as default and are used to obtain ES matrix of all genes. In this way, GSEA tool uses expression pattern of not only overlapped genes but also not-overlapped genes to produce ES matrix.
| Rank | GENE | SYMBOL | DESC | LIST.LOC | S2N | RES | CORE_ENRICHMENT |
|---|---|---|---|---|---|---|---|
| 1 | MNAT1 | MNAT1 | MNAT1 | 1672 | 0.12 | -0.028 | YES |
| 2 | POLR2K | POLR2K | POLR2K | 1958 | 0.1 | 0.013 | YES |
| 3 | GTF2H2 | GTF2H2 | GTF2H2 | 2139 | 0.097 | 0.056 | YES |
| 4 | RFC5 | RFC5 | RFC5 | 2437 | 0.087 | 0.086 | YES |
| 5 | ERCC4 | ERCC4 | ERCC4 | 2848 | 0.075 | 0.1 | YES |
| 6 | POLD4 | POLD4 | POLD4 | 3023 | 0.071 | 0.13 | YES |
| 7 | POLE2 | POLE2 | POLE2 | 3337 | 0.064 | 0.15 | YES |
| 8 | GTF2H3 | GTF2H3 | GTF2H3 | 3426 | 0.062 | 0.18 | YES |
| 9 | CCNH | CCNH | CCNH | 3467 | 0.061 | 0.21 | YES |
| 10 | TCEA1 | TCEA1 | TCEA1 | 3536 | 0.06 | 0.24 | YES |
| 11 | LIG1 | LIG1 | LIG1 | 3921 | 0.052 | 0.25 | YES |
| 12 | PCNA | PCNA | PCNA | 3928 | 0.052 | 0.27 | YES |
| 13 | GTF2H2B | GTF2H2B | GTF2H2B | 3945 | 0.051 | 0.3 | YES |
| 14 | XPC | XPC | XPC | 4389 | 0.044 | 0.3 | YES |
| 15 | DDB2 | DDB2 | DDB2 | 4400 | 0.044 | 0.32 | YES |
| 16 | POLE | POLE | POLE | 4410 | 0.043 | 0.35 | YES |
| 17 | POLR2C | POLR2C | POLR2C | 4594 | 0.041 | 0.36 | YES |
| 18 | RPA3 | RPA3 | RPA3 | 5396 | 0.03 | 0.33 | YES |
| 19 | CDK7 | CDK7 | CDK7 | 5436 | 0.029 | 0.34 | YES |
| 20 | POLD2 | POLD2 | POLD2 | 5799 | 0.024 | 0.34 | YES |
| 21 | ERCC3 | ERCC3 | ERCC3 | 5833 | 0.023 | 0.35 | YES |
| 22 | POLR2E | POLR2E | POLR2E | 5916 | 0.022 | 0.36 | YES |
| 23 | POLR2I | POLR2I | POLR2I | 5986 | 0.022 | 0.36 | YES |
| 24 | DDB1 | DDB1 | DDB1 | 6190 | 0.019 | 0.36 | YES |
| 25 | XPA | XPA | XPA | 6277 | 0.018 | 0.37 | YES |
| 26 | POLR2G | POLR2G | POLR2G | 6326 | 0.017 | 0.38 | YES |
| 27 | XAB2 | XAB2 | XAB2 | 6474 | 0.016 | 0.38 | YES |
| 28 | RFC3 | RFC3 | RFC3 | 6704 | 0.013 | 0.37 | NO |
| 29 | POLR2B | POLR2B | POLR2B | 6796 | 0.012 | 0.37 | NO |
| 30 | POLR2A | POLR2A | POLR2A | 6833 | 0.011 | 0.38 | NO |
| 31 | RAD23B | RAD23B | RAD23B | 6994 | 0.0093 | 0.37 | NO |
| 32 | ERCC6 | ERCC6 | ERCC6 | 7152 | 0.0076 | 0.37 | NO |
| 33 | ERCC8 | ERCC8 | ERCC8 | 7364 | 0.0053 | 0.36 | NO |
| 34 | POLR2L | POLR2L | POLR2L | 7368 | 0.0053 | 0.36 | NO |
| 35 | POLR2H | POLR2H | POLR2H | 7579 | 0.0029 | 0.35 | NO |
| 36 | POLR2J | POLR2J | POLR2J | 7666 | 0.0018 | 0.35 | NO |
| 37 | GTF2H1 | GTF2H1 | GTF2H1 | 7947 | -0.0013 | 0.33 | NO |
| 38 | POLR2D | POLR2D | POLR2D | 8857 | -0.012 | 0.29 | NO |
| 39 | ERCC2 | ERCC2 | ERCC2 | 9046 | -0.015 | 0.29 | NO |
| 40 | RFC2 | RFC2 | RFC2 | 9931 | -0.027 | 0.25 | NO |
| 41 | POLD1 | POLD1 | POLD1 | 10076 | -0.029 | 0.26 | NO |
| 42 | POLD3 | POLD3 | POLD3 | 10107 | -0.029 | 0.28 | NO |
| 43 | RPA1 | RPA1 | RPA1 | 10482 | -0.035 | 0.27 | NO |
| 44 | RFC4 | RFC4 | RFC4 | 10811 | -0.04 | 0.28 | NO |
| 45 | RPA2 | RPA2 | RPA2 | 10848 | -0.04 | 0.3 | NO |
| 46 | ERCC5 | ERCC5 | ERCC5 | 10960 | -0.043 | 0.31 | NO |
| 47 | ERCC1 | ERCC1 | ERCC1 | 11035 | -0.044 | 0.33 | NO |
| 48 | POLR2F | POLR2F | POLR2F | 11393 | -0.05 | 0.34 | NO |
| 49 | GTF2H4 | GTF2H4 | GTF2H4 | 12113 | -0.066 | 0.34 | NO |
Figure S11. Get High-res Image This plot shows mRNAseq_cNMF expression data heatmap (on the left) a RunningEnrichmentScore(RES) plot (on the top right) and a Signal2Noise(S2N) plot (on the bottom right) of genes in the pathway: REACTOME GLUCONEOGENESIS.
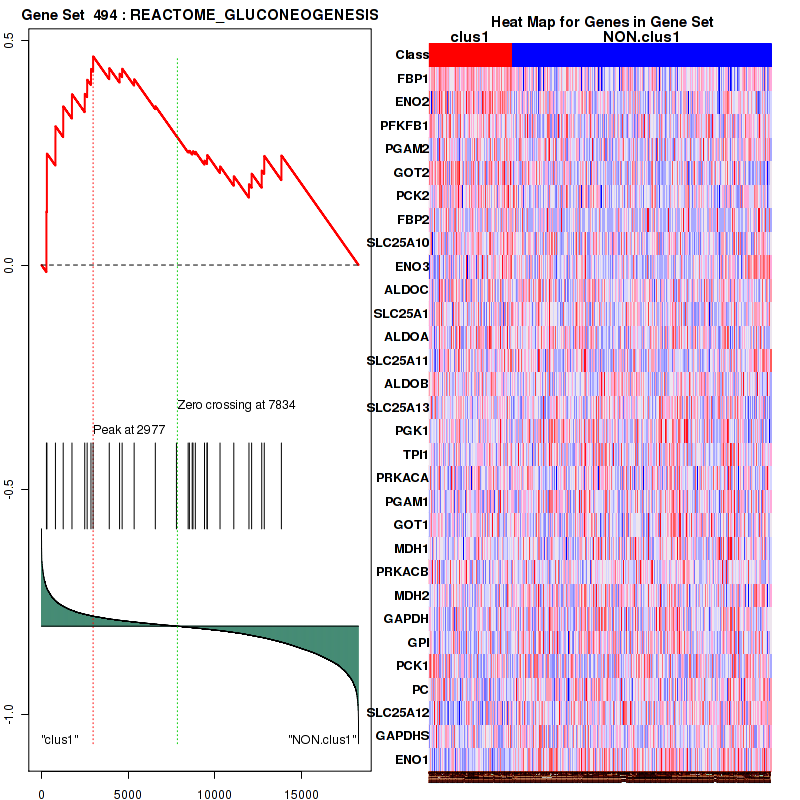
Figure S12. Get High-res Image For the top 5 core enriched genes in the pathway: REACTOME GLUCONEOGENESIS, this volcano plot shows how much they are up/down-regulated and significant. The significance was calculated by empirical bayesian fit

Table S7. Get Full Table This table shows a Running Enrichment Score (RES) of each gene in this pathway, that is, the enrichment score at this point in the ranked list of genes. All genes are ranked by Signal-to-Noise (S2N), a measure of similarity as default and are used to obtain ES matrix of all genes. In this way, GSEA tool uses expression pattern of not only overlapped genes but also not-overlapped genes to produce ES matrix.
| Rank | GENE | SYMBOL | DESC | LIST.LOC | S2N | RES | CORE_ENRICHMENT |
|---|---|---|---|---|---|---|---|
| 1 | HIST4H4 | HIST4H4 | HIST4H4 | 49 | 0.43 | 0.074 | YES |
| 2 | HIST1H2BD | HIST1H2BD | HIST1H2BD | 463 | 0.24 | 0.094 | YES |
| 3 | HIST1H2BF | HIST1H2BF | HIST1H2BF | 474 | 0.24 | 0.14 | YES |
| 4 | HIST1H2BL | HIST1H2BL | HIST1H2BL | 493 | 0.23 | 0.18 | YES |
| 5 | HIST1H4D | HIST1H4D | HIST1H4D | 632 | 0.2 | 0.2 | YES |
| 6 | HIST1H2AJ | HIST1H2AJ | HIST1H2AJ | 665 | 0.2 | 0.24 | YES |
| 7 | HIST1H2BC | HIST1H2BC | HIST1H2BC | 673 | 0.2 | 0.28 | YES |
| 8 | HIST2H2BE | HIST2H2BE | HIST2H2BE | 677 | 0.2 | 0.31 | YES |
| 9 | HIST2H4A | HIST2H4A | HIST2H4A | 768 | 0.19 | 0.34 | YES |
| 10 | HIST1H2BO | HIST1H2BO | HIST1H2BO | 779 | 0.18 | 0.37 | YES |
| 11 | HIST3H2BB | HIST3H2BB | HIST3H2BB | 791 | 0.18 | 0.4 | YES |
| 12 | HIST1H4I | HIST1H4I | HIST1H4I | 797 | 0.18 | 0.44 | YES |
| 13 | HIST1H4H | HIST1H4H | HIST1H4H | 841 | 0.18 | 0.47 | YES |
| 14 | HIST1H2AD | HIST1H2AD | HIST1H2AD | 1020 | 0.16 | 0.48 | YES |
| 15 | HIST1H2BN | HIST1H2BN | HIST1H2BN | 1115 | 0.15 | 0.51 | YES |
| 16 | HIST1H2BE | HIST1H2BE | HIST1H2BE | 1162 | 0.15 | 0.53 | YES |
| 17 | MLF1IP | MLF1IP | MLF1IP | 1185 | 0.15 | 0.56 | YES |
| 18 | CENPK | CENPK | CENPK | 1229 | 0.14 | 0.58 | YES |
| 19 | HIST1H4J | HIST1H4J | HIST1H4J | 1474 | 0.13 | 0.59 | YES |
| 20 | CASC5 | CASC5 | CASC5 | 1818 | 0.11 | 0.59 | YES |
| 21 | CENPI | CENPI | CENPI | 1868 | 0.11 | 0.61 | YES |
| 22 | HIST2H2AA3 | HIST2H2AA3 | HIST2H2AA3 | 1971 | 0.1 | 0.62 | YES |
| 23 | HIST1H2AC | HIST1H2AC | HIST1H2AC | 2026 | 0.1 | 0.64 | YES |
| 24 | HIST1H4K | HIST1H4K | HIST1H4K | 2058 | 0.1 | 0.65 | YES |
| 25 | CENPQ | CENPQ | CENPQ | 2130 | 0.097 | 0.66 | YES |
| 26 | OIP5 | OIP5 | OIP5 | 2133 | 0.097 | 0.68 | YES |
| 27 | HIST1H2BB | HIST1H2BB | HIST1H2BB | 2362 | 0.09 | 0.69 | YES |
| 28 | CENPA | CENPA | CENPA | 2964 | 0.072 | 0.67 | NO |
| 29 | HJURP | HJURP | HJURP | 3013 | 0.071 | 0.68 | NO |
| 30 | HIST1H2BM | HIST1H2BM | HIST1H2BM | 3061 | 0.07 | 0.69 | NO |
| 31 | CENPH | CENPH | CENPH | 3435 | 0.062 | 0.68 | NO |
| 32 | HIST1H2BK | HIST1H2BK | HIST1H2BK | 3486 | 0.061 | 0.68 | NO |
| 33 | RBBP7 | RBBP7 | RBBP7 | 3899 | 0.052 | 0.67 | NO |
| 34 | HIST1H2AB | HIST1H2AB | HIST1H2AB | 4158 | 0.048 | 0.67 | NO |
| 35 | HIST2H2AC | HIST2H2AC | HIST2H2AC | 4309 | 0.045 | 0.67 | NO |
| 36 | H2AFZ | H2AFZ | H2AFZ | 4569 | 0.041 | 0.66 | NO |
| 37 | HIST1H4A | HIST1H4A | HIST1H4A | 4709 | 0.039 | 0.66 | NO |
| 38 | CENPO | CENPO | CENPO | 4921 | 0.036 | 0.65 | NO |
| 39 | HIST1H4E | HIST1H4E | HIST1H4E | 5066 | 0.034 | 0.65 | NO |
| 40 | SMARCA5 | SMARCA5 | SMARCA5 | 5122 | 0.033 | 0.65 | NO |
| 41 | RBBP4 | RBBP4 | RBBP4 | 5350 | 0.03 | 0.65 | NO |
| 42 | RUVBL1 | RUVBL1 | RUVBL1 | 5654 | 0.026 | 0.64 | NO |
| 43 | RSF1 | RSF1 | RSF1 | 6007 | 0.022 | 0.62 | NO |
| 44 | ITGB3BP | ITGB3BP | ITGB3BP | 6054 | 0.021 | 0.62 | NO |
| 45 | HIST1H4B | HIST1H4B | HIST1H4B | 6981 | 0.0095 | 0.57 | NO |
| 46 | HIST1H2BI | HIST1H2BI | HIST1H2BI | 7003 | 0.0092 | 0.57 | NO |
| 47 | NPM1 | NPM1 | NPM1 | 7024 | 0.009 | 0.57 | NO |
| 48 | H2AFX | H2AFX | H2AFX | 7655 | 0.0019 | 0.54 | NO |
| 49 | HIST1H2BJ | HIST1H2BJ | HIST1H2BJ | 7892 | -0.00067 | 0.52 | NO |
| 50 | CENPN | CENPN | CENPN | 7985 | -0.0017 | 0.52 | NO |
| 51 | HIST1H4C | HIST1H4C | HIST1H4C | 8047 | -0.0025 | 0.52 | NO |
| 52 | HIST1H2BG | HIST1H2BG | HIST1H2BG | 8785 | -0.012 | 0.48 | NO |
| 53 | HIST1H2BH | HIST1H2BH | HIST1H2BH | 11543 | -0.053 | 0.34 | NO |
| 54 | CENPP | CENPP | CENPP | 12909 | -0.086 | 0.28 | NO |
| 55 | HIST1H2AE | HIST1H2AE | HIST1H2AE | 13132 | -0.092 | 0.28 | NO |
Figure S13. Get High-res Image This plot shows mRNAseq_cNMF expression data heatmap (on the left) a RunningEnrichmentScore(RES) plot (on the top right) and a Signal2Noise(S2N) plot (on the bottom right) of genes in the pathway: REACTOME TRANSCRIPTION COUPLED NER TC NER.
Figure S14. Get High-res Image For the top 5 core enriched genes in the pathway: REACTOME TRANSCRIPTION COUPLED NER TC NER, this volcano plot shows how much they are up/down-regulated and significant. The significance was calculated by empirical bayesian fit
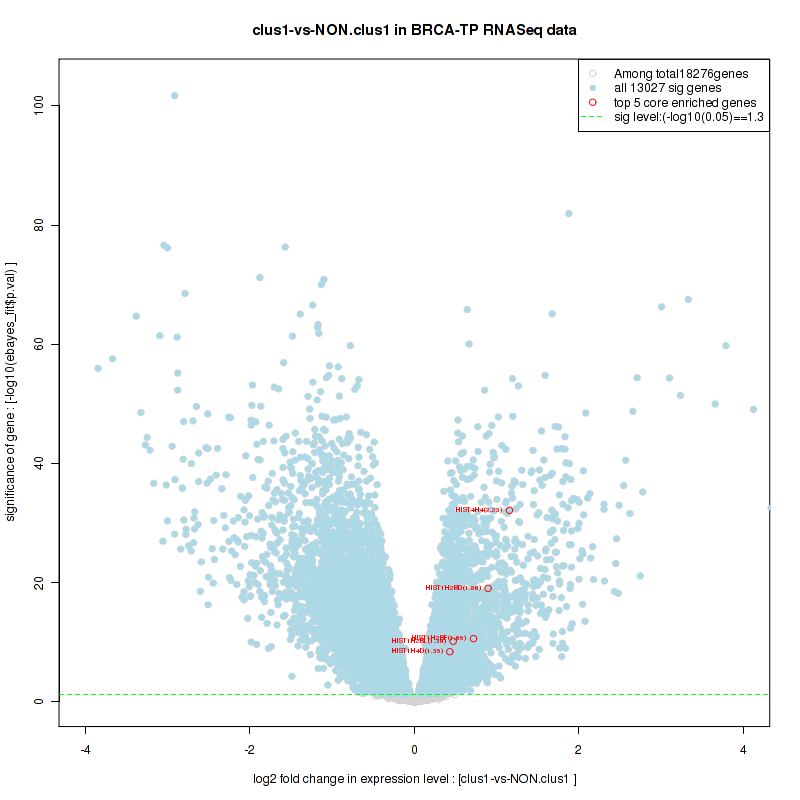
Table S8. Get Full Table This table shows a Running Enrichment Score (RES) of each gene in this pathway, that is, the enrichment score at this point in the ranked list of genes. All genes are ranked by Signal-to-Noise (S2N), a measure of similarity as default and are used to obtain ES matrix of all genes. In this way, GSEA tool uses expression pattern of not only overlapped genes but also not-overlapped genes to produce ES matrix.
| Rank | GENE | SYMBOL | DESC | LIST.LOC | S2N | RES | CORE_ENRICHMENT |
|---|---|---|---|---|---|---|---|
| 1 | HIST4H4 | HIST4H4 | HIST4H4 | 49 | 0.43 | 0.071 | YES |
| 2 | HIST1H2BD | HIST1H2BD | HIST1H2BD | 463 | 0.24 | 0.089 | YES |
| 3 | HIST1H2BF | HIST1H2BF | HIST1H2BF | 474 | 0.24 | 0.13 | YES |
| 4 | HIST1H2BL | HIST1H2BL | HIST1H2BL | 493 | 0.23 | 0.17 | YES |
| 5 | HIST1H4D | HIST1H4D | HIST1H4D | 632 | 0.2 | 0.2 | YES |
| 6 | HIST1H2AJ | HIST1H2AJ | HIST1H2AJ | 665 | 0.2 | 0.23 | YES |
| 7 | HIST1H2BC | HIST1H2BC | HIST1H2BC | 673 | 0.2 | 0.26 | YES |
| 8 | HIST2H2BE | HIST2H2BE | HIST2H2BE | 677 | 0.2 | 0.3 | YES |
| 9 | HIST2H4A | HIST2H4A | HIST2H4A | 768 | 0.19 | 0.32 | YES |
| 10 | HIST1H2BO | HIST1H2BO | HIST1H2BO | 779 | 0.18 | 0.36 | YES |
| 11 | HIST3H2BB | HIST3H2BB | HIST3H2BB | 791 | 0.18 | 0.39 | YES |
| 12 | HIST1H4I | HIST1H4I | HIST1H4I | 797 | 0.18 | 0.42 | YES |
| 13 | HIST1H4H | HIST1H4H | HIST1H4H | 841 | 0.18 | 0.44 | YES |
| 14 | HIST1H2AD | HIST1H2AD | HIST1H2AD | 1020 | 0.16 | 0.46 | YES |
| 15 | HIST1H2BN | HIST1H2BN | HIST1H2BN | 1115 | 0.15 | 0.48 | YES |
| 16 | HIST1H2BE | HIST1H2BE | HIST1H2BE | 1162 | 0.15 | 0.51 | YES |
| 17 | PRIM1 | PRIM1 | PRIM1 | 1285 | 0.14 | 0.52 | YES |
| 18 | HIST1H4J | HIST1H4J | HIST1H4J | 1474 | 0.13 | 0.54 | YES |
| 19 | HIST2H2AA3 | HIST2H2AA3 | HIST2H2AA3 | 1971 | 0.1 | 0.53 | YES |
| 20 | HIST1H2AC | HIST1H2AC | HIST1H2AC | 2026 | 0.1 | 0.54 | YES |
| 21 | HIST1H4K | HIST1H4K | HIST1H4K | 2058 | 0.1 | 0.56 | YES |
| 22 | HIST1H2BB | HIST1H2BB | HIST1H2BB | 2362 | 0.09 | 0.56 | YES |
| 23 | RFC5 | RFC5 | RFC5 | 2437 | 0.087 | 0.57 | YES |
| 24 | TERF1 | TERF1 | TERF1 | 2471 | 0.086 | 0.58 | YES |
| 25 | TERF2IP | TERF2IP | TERF2IP | 2578 | 0.083 | 0.59 | YES |
| 26 | POLA1 | POLA1 | POLA1 | 2916 | 0.073 | 0.58 | YES |
| 27 | POLD4 | POLD4 | POLD4 | 3023 | 0.071 | 0.59 | YES |
| 28 | HIST1H2BM | HIST1H2BM | HIST1H2BM | 3061 | 0.07 | 0.6 | YES |
| 29 | POLE2 | POLE2 | POLE2 | 3337 | 0.064 | 0.59 | YES |
| 30 | HIST1H2BK | HIST1H2BK | HIST1H2BK | 3486 | 0.061 | 0.6 | YES |
| 31 | NHP2 | NHP2 | NHP2 | 3702 | 0.056 | 0.59 | YES |
| 32 | ACD | ACD | ACD | 3766 | 0.055 | 0.6 | YES |
| 33 | LIG1 | LIG1 | LIG1 | 3921 | 0.052 | 0.6 | YES |
| 34 | PCNA | PCNA | PCNA | 3928 | 0.052 | 0.61 | YES |
| 35 | HIST1H2AB | HIST1H2AB | HIST1H2AB | 4158 | 0.048 | 0.6 | YES |
| 36 | HIST2H2AC | HIST2H2AC | HIST2H2AC | 4309 | 0.045 | 0.6 | YES |
| 37 | POLE | POLE | POLE | 4410 | 0.043 | 0.61 | YES |
| 38 | TERF2 | TERF2 | TERF2 | 4555 | 0.041 | 0.6 | YES |
| 39 | H2AFZ | H2AFZ | H2AFZ | 4569 | 0.041 | 0.61 | YES |
| 40 | HIST1H4A | HIST1H4A | HIST1H4A | 4709 | 0.039 | 0.61 | NO |
| 41 | POT1 | POT1 | POT1 | 5052 | 0.034 | 0.6 | NO |
| 42 | HIST1H4E | HIST1H4E | HIST1H4E | 5066 | 0.034 | 0.6 | NO |
| 43 | TINF2 | TINF2 | TINF2 | 5284 | 0.031 | 0.6 | NO |
| 44 | RUVBL2 | RUVBL2 | RUVBL2 | 5362 | 0.03 | 0.6 | NO |
| 45 | RPA3 | RPA3 | RPA3 | 5396 | 0.03 | 0.6 | NO |
| 46 | RUVBL1 | RUVBL1 | RUVBL1 | 5654 | 0.026 | 0.59 | NO |
| 47 | POLD2 | POLD2 | POLD2 | 5799 | 0.024 | 0.59 | NO |
| 48 | FEN1 | FEN1 | FEN1 | 5896 | 0.023 | 0.58 | NO |
| 49 | RFC3 | RFC3 | RFC3 | 6704 | 0.013 | 0.54 | NO |
| 50 | DNA2 | DNA2 | DNA2 | 6756 | 0.012 | 0.54 | NO |
| 51 | POLA2 | POLA2 | POLA2 | 6962 | 0.0096 | 0.53 | NO |
| 52 | HIST1H4B | HIST1H4B | HIST1H4B | 6981 | 0.0095 | 0.53 | NO |
| 53 | HIST1H2BI | HIST1H2BI | HIST1H2BI | 7003 | 0.0092 | 0.53 | NO |
| 54 | DKC1 | DKC1 | DKC1 | 7565 | 0.003 | 0.5 | NO |
| 55 | H2AFX | H2AFX | H2AFX | 7655 | 0.0019 | 0.5 | NO |
| 56 | HIST1H2BJ | HIST1H2BJ | HIST1H2BJ | 7892 | -0.00067 | 0.49 | NO |
| 57 | HIST1H4C | HIST1H4C | HIST1H4C | 8047 | -0.0025 | 0.48 | NO |
| 58 | HIST1H2BG | HIST1H2BG | HIST1H2BG | 8785 | -0.012 | 0.44 | NO |
| 59 | TERT | TERT | TERT | 8786 | -0.012 | 0.44 | NO |
| 60 | WRAP53 | WRAP53 | WRAP53 | 9726 | -0.024 | 0.39 | NO |
| 61 | RFC2 | RFC2 | RFC2 | 9931 | -0.027 | 0.39 | NO |
| 62 | POLD1 | POLD1 | POLD1 | 10076 | -0.029 | 0.38 | NO |
| 63 | POLD3 | POLD3 | POLD3 | 10107 | -0.029 | 0.39 | NO |
| 64 | RPA1 | RPA1 | RPA1 | 10482 | -0.035 | 0.37 | NO |
| 65 | PRIM2 | PRIM2 | PRIM2 | 10493 | -0.035 | 0.38 | NO |
| 66 | RFC4 | RFC4 | RFC4 | 10811 | -0.04 | 0.37 | NO |
| 67 | RPA2 | RPA2 | RPA2 | 10848 | -0.04 | 0.37 | NO |
| 68 | HIST1H2BH | HIST1H2BH | HIST1H2BH | 11543 | -0.053 | 0.34 | NO |
| 69 | HIST3H3 | HIST3H3 | HIST3H3 | 11741 | -0.058 | 0.34 | NO |
| 70 | HIST1H2AE | HIST1H2AE | HIST1H2AE | 13132 | -0.092 | 0.28 | NO |
Figure S15. Get High-res Image This plot shows mRNAseq_cNMF expression data heatmap (on the left) a RunningEnrichmentScore(RES) plot (on the top right) and a Signal2Noise(S2N) plot (on the bottom right) of genes in the pathway: REACTOME NUCLEOTIDE EXCISION REPAIR.
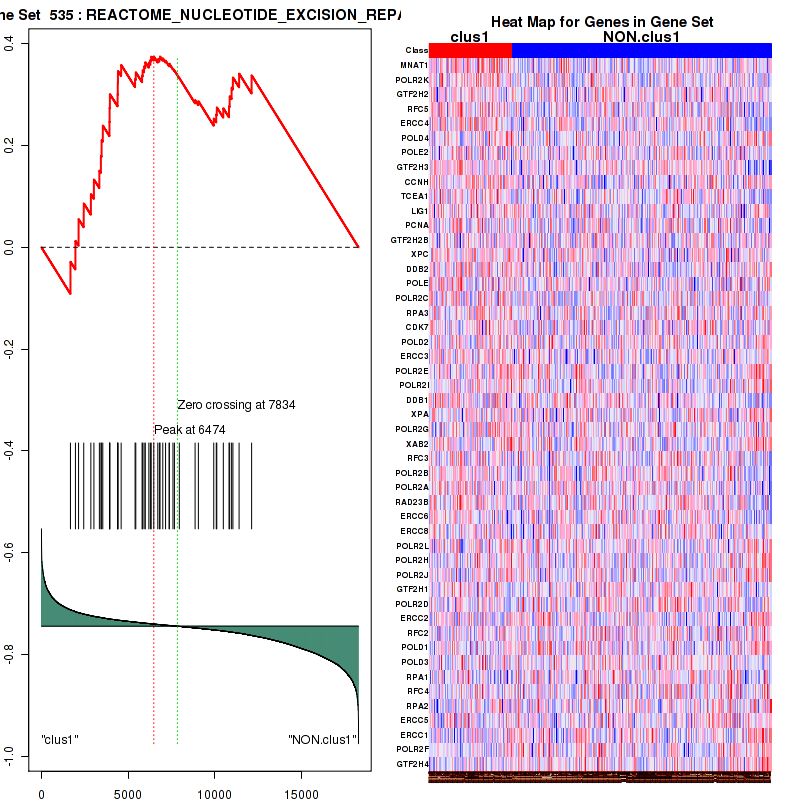
Figure S16. Get High-res Image For the top 5 core enriched genes in the pathway: REACTOME NUCLEOTIDE EXCISION REPAIR, this volcano plot shows how much they are up/down-regulated and significant. The significance was calculated by empirical bayesian fit

Table S9. Get Full Table This table shows a Running Enrichment Score (RES) of each gene in this pathway, that is, the enrichment score at this point in the ranked list of genes. All genes are ranked by Signal-to-Noise (S2N), a measure of similarity as default and are used to obtain ES matrix of all genes. In this way, GSEA tool uses expression pattern of not only overlapped genes but also not-overlapped genes to produce ES matrix.
| Rank | GENE | SYMBOL | DESC | LIST.LOC | S2N | RES | CORE_ENRICHMENT |
|---|---|---|---|---|---|---|---|
| 1 | SUPT4H1 | SUPT4H1 | SUPT4H1 | 1870 | 0.11 | -0.0016 | YES |
| 2 | POLR2K | POLR2K | POLR2K | 1958 | 0.1 | 0.09 | YES |
| 3 | CCNT1 | CCNT1 | CCNT1 | 2047 | 0.1 | 0.18 | YES |
| 4 | TCEB1 | TCEB1 | TCEB1 | 2292 | 0.092 | 0.25 | YES |
| 5 | WHSC2 | WHSC2 | WHSC2 | 3118 | 0.068 | 0.27 | YES |
| 6 | TH1L | TH1L | TH1L | 3510 | 0.06 | 0.3 | YES |
| 7 | TCEA1 | TCEA1 | TCEA1 | 3536 | 0.06 | 0.36 | YES |
| 8 | SUPT16H | SUPT16H | SUPT16H | 4397 | 0.044 | 0.35 | YES |
| 9 | POLR2C | POLR2C | POLR2C | 4594 | 0.041 | 0.38 | YES |
| 10 | POLR2E | POLR2E | POLR2E | 5916 | 0.022 | 0.32 | YES |
| 11 | POLR2I | POLR2I | POLR2I | 5986 | 0.022 | 0.34 | YES |
| 12 | TCEB2 | TCEB2 | TCEB2 | 6046 | 0.021 | 0.36 | YES |
| 13 | POLR2G | POLR2G | POLR2G | 6326 | 0.017 | 0.36 | YES |
| 14 | POLR2B | POLR2B | POLR2B | 6796 | 0.012 | 0.34 | YES |
| 15 | POLR2A | POLR2A | POLR2A | 6833 | 0.011 | 0.35 | YES |
| 16 | GTF2F1 | GTF2F1 | GTF2F1 | 7115 | 0.008 | 0.34 | YES |
| 17 | CCNT2 | CCNT2 | CCNT2 | 7168 | 0.0075 | 0.35 | YES |
| 18 | POLR2L | POLR2L | POLR2L | 7368 | 0.0053 | 0.34 | YES |
| 19 | POLR2H | POLR2H | POLR2H | 7579 | 0.0029 | 0.33 | YES |
| 20 | TCEB3 | TCEB3 | TCEB3 | 7584 | 0.0028 | 0.34 | YES |
| 21 | POLR2J | POLR2J | POLR2J | 7666 | 0.0018 | 0.33 | YES |
| 22 | RDBP | RDBP | RDBP | 7954 | -0.0014 | 0.32 | YES |
| 23 | COBRA1 | COBRA1 | COBRA1 | 8791 | -0.012 | 0.28 | YES |
| 24 | POLR2D | POLR2D | POLR2D | 8857 | -0.012 | 0.29 | YES |
| 25 | CDK9 | CDK9 | CDK9 | 8905 | -0.013 | 0.3 | YES |
| 26 | CTDP1 | CTDP1 | CTDP1 | 9990 | -0.028 | 0.27 | YES |
| 27 | SSRP1 | SSRP1 | SSRP1 | 10091 | -0.029 | 0.29 | YES |
| 28 | ELL | ELL | ELL | 10340 | -0.032 | 0.3 | YES |
| 29 | GTF2F2 | GTF2F2 | GTF2F2 | 10857 | -0.041 | 0.31 | YES |
| 30 | SUPT5H | SUPT5H | SUPT5H | 11335 | -0.049 | 0.33 | YES |
| 31 | POLR2F | POLR2F | POLR2F | 11393 | -0.05 | 0.38 | YES |
Figure S17. Get High-res Image This plot shows mRNAseq_cNMF expression data heatmap (on the left) a RunningEnrichmentScore(RES) plot (on the top right) and a Signal2Noise(S2N) plot (on the bottom right) of genes in the pathway: REACTOME FORMATION OF RNA POL II ELONGATION COMPLEX .

Figure S18. Get High-res Image For the top 5 core enriched genes in the pathway: REACTOME FORMATION OF RNA POL II ELONGATION COMPLEX , this volcano plot shows how much they are up/down-regulated and significant. The significance was calculated by empirical bayesian fit

Table S10. Get Full Table This table shows a Running Enrichment Score (RES) of each gene in this pathway, that is, the enrichment score at this point in the ranked list of genes. All genes are ranked by Signal-to-Noise (S2N), a measure of similarity as default and are used to obtain ES matrix of all genes. In this way, GSEA tool uses expression pattern of not only overlapped genes but also not-overlapped genes to produce ES matrix.
| Rank | GENE | SYMBOL | DESC | LIST.LOC | S2N | RES | CORE_ENRICHMENT |
|---|---|---|---|---|---|---|---|
| 1 | ESR1 | ESR1 | ESR1 | 30 | 0.46 | 0.14 | YES |
| 2 | CCND1 | CCND1 | CCND1 | 311 | 0.27 | 0.21 | YES |
| 3 | HDAC11 | HDAC11 | HDAC11 | 674 | 0.2 | 0.26 | YES |
| 4 | BRCA1 | BRCA1 | BRCA1 | 739 | 0.19 | 0.31 | YES |
| 5 | HIST2H3C | HIST2H3C | HIST2H3C | 913 | 0.17 | 0.36 | YES |
| 6 | NRIP1 | NRIP1 | NRIP1 | 1182 | 0.15 | 0.39 | YES |
| 7 | HDAC10 | HDAC10 | HDAC10 | 3614 | 0.058 | 0.27 | NO |
| 8 | NCOR2 | NCOR2 | NCOR2 | 3743 | 0.055 | 0.28 | NO |
| 9 | NR0B1 | NR0B1 | NR0B1 | 3925 | 0.052 | 0.29 | NO |
| 10 | HDAC6 | HDAC6 | HDAC6 | 4364 | 0.044 | 0.28 | NO |
| 11 | HDAC5 | HDAC5 | HDAC5 | 4385 | 0.044 | 0.29 | NO |
| 12 | HDAC1 | HDAC1 | HDAC1 | 4918 | 0.036 | 0.27 | NO |
| 13 | GTF2A1 | GTF2A1 | GTF2A1 | 5133 | 0.033 | 0.27 | NO |
| 14 | MED1 | MED1 | MED1 | 5679 | 0.025 | 0.25 | NO |
| 15 | ERCC3 | ERCC3 | ERCC3 | 5833 | 0.023 | 0.25 | NO |
| 16 | EP300 | EP300 | EP300 | 6140 | 0.02 | 0.24 | NO |
| 17 | GTF2E1 | GTF2E1 | GTF2E1 | 6249 | 0.018 | 0.24 | NO |
| 18 | SRA1 | SRA1 | SRA1 | 6585 | 0.014 | 0.22 | NO |
| 19 | POLR2A | POLR2A | POLR2A | 6833 | 0.011 | 0.22 | NO |
| 20 | PELP1 | PELP1 | PELP1 | 7034 | 0.0089 | 0.21 | NO |
| 21 | GTF2F1 | GTF2F1 | GTF2F1 | 7115 | 0.008 | 0.2 | NO |
| 22 | CREBBP | CREBBP | CREBBP | 7149 | 0.0077 | 0.21 | NO |
| 23 | HDAC7 | HDAC7 | HDAC7 | 8399 | -0.007 | 0.14 | NO |
| 24 | HDAC8 | HDAC8 | HDAC8 | 8523 | -0.0086 | 0.14 | NO |
| 25 | SPEN | SPEN | SPEN | 9012 | -0.015 | 0.11 | NO |
| 26 | TBP | TBP | TBP | 9279 | -0.018 | 0.1 | NO |
| 27 | HDAC3 | HDAC3 | HDAC3 | 10021 | -0.028 | 0.073 | NO |
| 28 | PHB2 | PHB2 | PHB2 | 10874 | -0.041 | 0.039 | NO |
| 29 | CARM1 | CARM1 | CARM1 | 11005 | -0.044 | 0.046 | NO |
| 30 | HDAC2 | HDAC2 | HDAC2 | 11495 | -0.052 | 0.035 | NO |
| 31 | MEF2C | MEF2C | MEF2C | 14271 | -0.13 | -0.076 | NO |
| 32 | GRIP1 | GRIP1 | GRIP1 | 14456 | -0.14 | -0.042 | NO |
| 33 | HDAC4 | HDAC4 | HDAC4 | 15078 | -0.16 | -0.025 | NO |
| 34 | HDAC9 | HDAC9 | HDAC9 | 16578 | -0.24 | -0.03 | NO |
| 35 | PPARGC1A | PPARGC1A | PPARGC1A | 17922 | -0.39 | 0.019 | NO |
Figure S19. Get High-res Image This plot shows mRNAseq_cNMF expression data heatmap (on the left) a RunningEnrichmentScore(RES) plot (on the top right) and a Signal2Noise(S2N) plot (on the bottom right) of genes in the pathway: REACTOME POST TRANSLATIONAL MODIFICATION SYNTHESIS OF GPI ANCHORED PROTEINS.
Figure S20. Get High-res Image For the top 5 core enriched genes in the pathway: REACTOME POST TRANSLATIONAL MODIFICATION SYNTHESIS OF GPI ANCHORED PROTEINS, this volcano plot shows how much they are up/down-regulated and significant. The significance was calculated by empirical bayesian fit

For the top enriched genes, if you want to check whether they are
-
up-regulated, please check the list of up-regulated genes
-
down-regulated, please check the list of down-regulated genes
For the top enriched genes, if you want to check whether they are
-
highly expressed genes, please check the list of high (top 30%) expressed genes
-
low expressed genes, please check the list of low (bottom 30%) expressed genes
An expression pattern of top(30%)/middle(30%)/low(30%) in this subtype against other subtypes is available in a heatmap
For the top enriched genes, if you want to check whether they are
-
significantly differently expressed genes by eBayes lm fit, please check the list of significant genes
Table 4. Get Full Table This table shows top 10 pathways which are significantly enriched in cluster clus2. It displays only significant gene sets satisfying nom.p.val.threshold (-1), fwer.p.val.threshold (-1) , fdr.q.val.threshold (0.25) and the default table is sorted by Normalized Enrichment Score (NES). Further details on NES statistics, please visit The Broad GSEA website.
| GeneSet(GS) | Size(#genes) | genes.ES.table | ES | NES | NOM.p.val | FDR.q.val | FWER.p.val | Tag.. | Gene.. | Signal | FDR..median. | glob.p.val |
|---|---|---|---|---|---|---|---|---|---|---|---|---|
| KEGG STEROID HORMONE BIOSYNTHESIS | 41 | genes.ES.table | 0.68 | 1.7 | 0.0044 | 0.25 | 0.83 | 0.46 | 0.079 | 0.43 | 0.099 | 0.053 |
| KEGG PORPHYRIN AND CHLOROPHYLL METABOLISM | 29 | genes.ES.table | 0.63 | 1.8 | 0.021 | 0.2 | 0.69 | 0.24 | 0.054 | 0.23 | 0.068 | 0.043 |
| KEGG PROTEASOME | 43 | genes.ES.table | 0.62 | 1.8 | 0.02 | 0.16 | 0.5 | 0.74 | 0.31 | 0.52 | 0 | 0.038 |
| BIOCARTA PROTEASOME PATHWAY | 28 | genes.ES.table | 0.65 | 1.8 | 0 | 0.2 | 0.66 | 0.82 | 0.32 | 0.56 | 0.064 | 0.047 |
| BIOCARTA VEGF PATHWAY | 29 | genes.ES.table | 0.49 | 1.7 | 0.037 | 0.25 | 0.82 | 0.31 | 0.21 | 0.25 | 0.098 | 0.051 |
| PID INTEGRIN3 PATHWAY | 43 | genes.ES.table | 0.64 | 1.7 | 0.008 | 0.24 | 0.8 | 0.6 | 0.22 | 0.48 | 0.091 | 0.056 |
| REACTOME SIGNALING BY WNT | 63 | genes.ES.table | 0.48 | 1.9 | 0.02 | 0.22 | 0.27 | 0.59 | 0.31 | 0.41 | 0 | 0.057 |
| REACTOME CROSS PRESENTATION OF SOLUBLE EXOGENOUS ANTIGENS ENDOSOMES | 47 | genes.ES.table | 0.56 | 1.8 | 0.021 | 0.2 | 0.66 | 0.62 | 0.24 | 0.47 | 0.065 | 0.048 |
| REACTOME ANTIGEN PROCESSING CROSS PRESENTATION | 72 | genes.ES.table | 0.55 | 1.8 | 0.012 | 0.19 | 0.67 | 0.71 | 0.32 | 0.49 | 0.064 | 0.044 |
| REACTOME ER PHAGOSOME PATHWAY | 58 | genes.ES.table | 0.59 | 1.8 | 0.018 | 0.18 | 0.59 | 0.67 | 0.32 | 0.46 | 0.049 | 0.043 |
Table S11. Get Full Table This table shows a Running Enrichment Score (RES) of each gene in this pathway, that is, the enrichment score at this point in the ranked list of genes. All genes are ranked by Signal-to-Noise (S2N), a measure of similarity as default and are used to obtain ES matrix of all genes. In this way, GSEA tool uses expression pattern of not only overlapped genes but also not-overlapped genes to produce ES matrix.
| Rank | GENE | SYMBOL | DESC | LIST.LOC | S2N | RES | CORE_ENRICHMENT |
|---|---|---|---|---|---|---|---|
| 1 | NQO1 | NQO1 | NQO1 | 517 | 0.22 | 0.051 | YES |
| 2 | PSMD3 | PSMD3 | PSMD3 | 564 | 0.22 | 0.12 | YES |
| 3 | OAZ3 | OAZ3 | OAZ3 | 779 | 0.18 | 0.18 | YES |
| 4 | PSMD5 | PSMD5 | PSMD5 | 1194 | 0.15 | 0.21 | YES |
| 5 | PSMD12 | PSMD12 | PSMD12 | 1810 | 0.11 | 0.22 | YES |
| 6 | PSMA3 | PSMA3 | PSMA3 | 2293 | 0.093 | 0.22 | YES |
| 7 | PSME4 | PSME4 | PSME4 | 2353 | 0.091 | 0.25 | YES |
| 8 | PSMD7 | PSMD7 | PSMD7 | 2399 | 0.089 | 0.28 | YES |
| 9 | PSMC1 | PSMC1 | PSMC1 | 2534 | 0.085 | 0.3 | YES |
| 10 | PSMD14 | PSMD14 | PSMD14 | 2554 | 0.085 | 0.33 | YES |
| 11 | PSMB3 | PSMB3 | PSMB3 | 2605 | 0.083 | 0.36 | YES |
| 12 | PSMA6 | PSMA6 | PSMA6 | 2683 | 0.081 | 0.38 | YES |
| 13 | PSMD11 | PSMD11 | PSMD11 | 2814 | 0.078 | 0.4 | YES |
| 14 | PSMA7 | PSMA7 | PSMA7 | 3137 | 0.07 | 0.41 | YES |
| 15 | PSMB9 | PSMB9 | PSMB9 | 3292 | 0.067 | 0.43 | YES |
| 16 | PSMD1 | PSMD1 | PSMD1 | 3309 | 0.066 | 0.45 | YES |
| 17 | PSMC6 | PSMC6 | PSMC6 | 3326 | 0.066 | 0.47 | YES |
| 18 | PSMB5 | PSMB5 | PSMB5 | 3633 | 0.06 | 0.48 | YES |
| 19 | PSME2 | PSME2 | PSME2 | 3788 | 0.057 | 0.49 | YES |
| 20 | PSMA2 | PSMA2 | PSMA2 | 3927 | 0.055 | 0.5 | YES |
| 21 | PSMB1 | PSMB1 | PSMB1 | 4044 | 0.053 | 0.52 | YES |
| 22 | PSMC5 | PSMC5 | PSMC5 | 4128 | 0.051 | 0.53 | YES |
| 23 | PSMC2 | PSMC2 | PSMC2 | 4132 | 0.051 | 0.55 | YES |
| 24 | PSMA4 | PSMA4 | PSMA4 | 4230 | 0.05 | 0.56 | YES |
| 25 | PSMD10 | PSMD10 | PSMD10 | 4256 | 0.049 | 0.57 | YES |
| 26 | PSMB7 | PSMB7 | PSMB7 | 4259 | 0.049 | 0.59 | YES |
| 27 | PSMD2 | PSMD2 | PSMD2 | 4373 | 0.047 | 0.6 | YES |
| 28 | PSMA5 | PSMA5 | PSMA5 | 4985 | 0.039 | 0.58 | YES |
| 29 | PSMD6 | PSMD6 | PSMD6 | 5043 | 0.038 | 0.59 | YES |
| 30 | PSMB2 | PSMB2 | PSMB2 | 5081 | 0.038 | 0.6 | YES |
| 31 | PSMA1 | PSMA1 | PSMA1 | 5433 | 0.033 | 0.6 | YES |
| 32 | PSMF1 | PSMF1 | PSMF1 | 5477 | 0.032 | 0.61 | YES |
| 33 | PSMC4 | PSMC4 | PSMC4 | 5657 | 0.03 | 0.61 | YES |
| 34 | PSMB10 | PSMB10 | PSMB10 | 6021 | 0.026 | 0.6 | NO |
| 35 | AZIN1 | AZIN1 | AZIN1 | 6223 | 0.024 | 0.6 | NO |
| 36 | PSMB8 | PSMB8 | PSMB8 | 6694 | 0.019 | 0.58 | NO |
| 37 | PSMD13 | PSMD13 | PSMD13 | 6926 | 0.017 | 0.57 | NO |
| 38 | ODC1 | ODC1 | ODC1 | 7140 | 0.014 | 0.56 | NO |
| 39 | PSMD8 | PSMD8 | PSMD8 | 7460 | 0.011 | 0.55 | NO |
| 40 | PSMC3 | PSMC3 | PSMC3 | 7604 | 0.0099 | 0.55 | NO |
| 41 | PSME1 | PSME1 | PSME1 | 7765 | 0.0081 | 0.54 | NO |
| 42 | PSMB4 | PSMB4 | PSMB4 | 8280 | 0.0028 | 0.51 | NO |
| 43 | OAZ1 | OAZ1 | OAZ1 | 8554 | -0.00018 | 0.5 | NO |
| 44 | PSMD4 | PSMD4 | PSMD4 | 8572 | -0.00038 | 0.5 | NO |
| 45 | PSMB6 | PSMB6 | PSMB6 | 9012 | -0.0046 | 0.47 | NO |
| 46 | PSMD9 | PSMD9 | PSMD9 | 9236 | -0.0071 | 0.46 | NO |
| 47 | OAZ2 | OAZ2 | OAZ2 | 12133 | -0.041 | 0.32 | NO |
| 48 | PSMA8 | PSMA8 | PSMA8 | 12721 | -0.05 | 0.3 | NO |
Figure S21. Get High-res Image This plot shows mRNAseq_cNMF expression data heatmap (on the left) a RunningEnrichmentScore(RES) plot (on the top right) and a Signal2Noise(S2N) plot (on the bottom right) of genes in the pathway: KEGG STEROID HORMONE BIOSYNTHESIS.
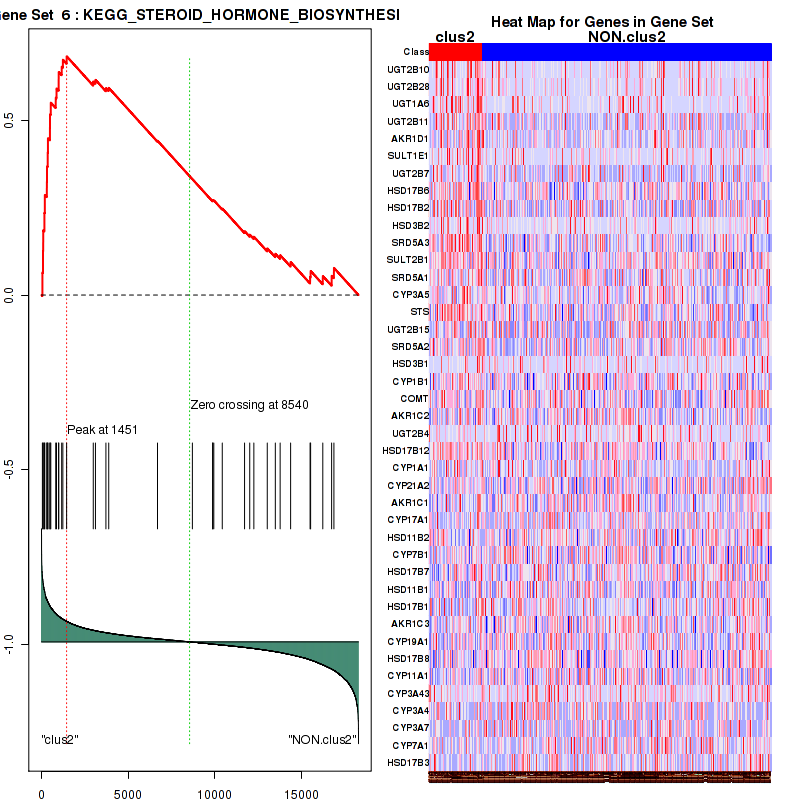
Figure S22. Get High-res Image For the top 5 core enriched genes in the pathway: KEGG STEROID HORMONE BIOSYNTHESIS, this volcano plot shows how much they are up/down-regulated and significant. The significance was calculated by empirical bayesian fit

Table S12. Get Full Table This table shows a Running Enrichment Score (RES) of each gene in this pathway, that is, the enrichment score at this point in the ranked list of genes. All genes are ranked by Signal-to-Noise (S2N), a measure of similarity as default and are used to obtain ES matrix of all genes. In this way, GSEA tool uses expression pattern of not only overlapped genes but also not-overlapped genes to produce ES matrix.
| Rank | GENE | SYMBOL | DESC | LIST.LOC | S2N | RES | CORE_ENRICHMENT |
|---|---|---|---|---|---|---|---|
| 1 | UNC5A | UNC5A | UNC5A | 215 | 0.3 | 0.072 | YES |
| 2 | PSMD3 | PSMD3 | PSMD3 | 564 | 0.22 | 0.11 | YES |
| 3 | PSMD5 | PSMD5 | PSMD5 | 1194 | 0.15 | 0.12 | YES |
| 4 | DAPK1 | DAPK1 | DAPK1 | 1567 | 0.12 | 0.13 | YES |
| 5 | PSMD12 | PSMD12 | PSMD12 | 1810 | 0.11 | 0.15 | YES |
| 6 | CASP3 | CASP3 | CASP3 | 2219 | 0.096 | 0.16 | YES |
| 7 | PSMA3 | PSMA3 | PSMA3 | 2293 | 0.093 | 0.18 | YES |
| 8 | PSME4 | PSME4 | PSME4 | 2353 | 0.091 | 0.2 | YES |
| 9 | MAGED1 | MAGED1 | MAGED1 | 2398 | 0.089 | 0.22 | YES |
| 10 | PSMD7 | PSMD7 | PSMD7 | 2399 | 0.089 | 0.25 | YES |
| 11 | ARHGAP10 | ARHGAP10 | ARHGAP10 | 2432 | 0.088 | 0.27 | YES |
| 12 | PSMC1 | PSMC1 | PSMC1 | 2534 | 0.085 | 0.29 | YES |
| 13 | PSMD14 | PSMD14 | PSMD14 | 2554 | 0.085 | 0.31 | YES |
| 14 | PSMB3 | PSMB3 | PSMB3 | 2605 | 0.083 | 0.33 | YES |
| 15 | PSMA6 | PSMA6 | PSMA6 | 2683 | 0.081 | 0.35 | YES |
| 16 | PSMD11 | PSMD11 | PSMD11 | 2814 | 0.078 | 0.36 | YES |
| 17 | PSMA7 | PSMA7 | PSMA7 | 3137 | 0.07 | 0.37 | YES |
| 18 | PSMB9 | PSMB9 | PSMB9 | 3292 | 0.067 | 0.38 | YES |
| 19 | PSMD1 | PSMD1 | PSMD1 | 3309 | 0.066 | 0.39 | YES |
| 20 | PSMC6 | PSMC6 | PSMC6 | 3326 | 0.066 | 0.41 | YES |
| 21 | UNC5B | UNC5B | UNC5B | 3434 | 0.064 | 0.42 | YES |
| 22 | PSMB5 | PSMB5 | PSMB5 | 3633 | 0.06 | 0.43 | YES |
| 23 | PSME2 | PSME2 | PSME2 | 3788 | 0.057 | 0.44 | YES |
| 24 | PSMA2 | PSMA2 | PSMA2 | 3927 | 0.055 | 0.44 | YES |
| 25 | PSMB1 | PSMB1 | PSMB1 | 4044 | 0.053 | 0.45 | YES |
| 26 | PSMC5 | PSMC5 | PSMC5 | 4128 | 0.051 | 0.46 | YES |
| 27 | PSMC2 | PSMC2 | PSMC2 | 4132 | 0.051 | 0.48 | YES |
| 28 | PSMA4 | PSMA4 | PSMA4 | 4230 | 0.05 | 0.48 | YES |
| 29 | PSMD10 | PSMD10 | PSMD10 | 4256 | 0.049 | 0.5 | YES |
| 30 | PSMB7 | PSMB7 | PSMB7 | 4259 | 0.049 | 0.51 | YES |
| 31 | PSMD2 | PSMD2 | PSMD2 | 4373 | 0.047 | 0.52 | YES |
| 32 | PSMA5 | PSMA5 | PSMA5 | 4985 | 0.039 | 0.5 | NO |
| 33 | PSMD6 | PSMD6 | PSMD6 | 5043 | 0.038 | 0.5 | NO |
| 34 | PSMB2 | PSMB2 | PSMB2 | 5081 | 0.038 | 0.51 | NO |
| 35 | PSMA1 | PSMA1 | PSMA1 | 5433 | 0.033 | 0.5 | NO |
| 36 | PSMF1 | PSMF1 | PSMF1 | 5477 | 0.032 | 0.51 | NO |
| 37 | PSMC4 | PSMC4 | PSMC4 | 5657 | 0.03 | 0.51 | NO |
| 38 | DCC | DCC | DCC | 5763 | 0.029 | 0.51 | NO |
| 39 | PAK2 | PAK2 | PAK2 | 5983 | 0.027 | 0.5 | NO |
| 40 | PSMB10 | PSMB10 | PSMB10 | 6021 | 0.026 | 0.51 | NO |
| 41 | DAPK3 | DAPK3 | DAPK3 | 6635 | 0.02 | 0.48 | NO |
| 42 | PSMB8 | PSMB8 | PSMB8 | 6694 | 0.019 | 0.48 | NO |
| 43 | PSMD13 | PSMD13 | PSMD13 | 6926 | 0.017 | 0.48 | NO |
| 44 | PSMD8 | PSMD8 | PSMD8 | 7460 | 0.011 | 0.45 | NO |
| 45 | PSMC3 | PSMC3 | PSMC3 | 7604 | 0.0099 | 0.44 | NO |
| 46 | PSME1 | PSME1 | PSME1 | 7765 | 0.0081 | 0.44 | NO |
| 47 | PSMB4 | PSMB4 | PSMB4 | 8280 | 0.0028 | 0.41 | NO |
| 48 | PSMD4 | PSMD4 | PSMD4 | 8572 | -0.00038 | 0.39 | NO |
| 49 | PSMB6 | PSMB6 | PSMB6 | 9012 | -0.0046 | 0.37 | NO |
| 50 | PSMD9 | PSMD9 | PSMD9 | 9236 | -0.0071 | 0.36 | NO |
| 51 | UBA52 | UBA52 | UBA52 | 10430 | -0.02 | 0.3 | NO |
| 52 | RPS27A | RPS27A | RPS27A | 11335 | -0.03 | 0.26 | NO |
| 53 | CASP9 | CASP9 | CASP9 | 12270 | -0.043 | 0.22 | NO |
| 54 | PSMA8 | PSMA8 | PSMA8 | 12721 | -0.05 | 0.21 | NO |
| 55 | APPL1 | APPL1 | APPL1 | 13187 | -0.057 | 0.2 | NO |
| 56 | DAPK2 | DAPK2 | DAPK2 | 17824 | -0.28 | 0.025 | NO |
Figure S23. Get High-res Image This plot shows mRNAseq_cNMF expression data heatmap (on the left) a RunningEnrichmentScore(RES) plot (on the top right) and a Signal2Noise(S2N) plot (on the bottom right) of genes in the pathway: KEGG PORPHYRIN AND CHLOROPHYLL METABOLISM.

Figure S24. Get High-res Image For the top 5 core enriched genes in the pathway: KEGG PORPHYRIN AND CHLOROPHYLL METABOLISM, this volcano plot shows how much they are up/down-regulated and significant. The significance was calculated by empirical bayesian fit

Table S13. Get Full Table This table shows a Running Enrichment Score (RES) of each gene in this pathway, that is, the enrichment score at this point in the ranked list of genes. All genes are ranked by Signal-to-Noise (S2N), a measure of similarity as default and are used to obtain ES matrix of all genes. In this way, GSEA tool uses expression pattern of not only overlapped genes but also not-overlapped genes to produce ES matrix.
| Rank | GENE | SYMBOL | DESC | LIST.LOC | S2N | RES | CORE_ENRICHMENT |
|---|---|---|---|---|---|---|---|
| 1 | PSMD3 | PSMD3 | PSMD3 | 564 | 0.22 | 0.051 | YES |
| 2 | PSMD5 | PSMD5 | PSMD5 | 1194 | 0.15 | 0.072 | YES |
| 3 | CDC25A | CDC25A | CDC25A | 1285 | 0.14 | 0.12 | YES |
| 4 | PSMD12 | PSMD12 | PSMD12 | 1810 | 0.11 | 0.13 | YES |
| 5 | PSMA3 | PSMA3 | PSMA3 | 2293 | 0.093 | 0.14 | YES |
| 6 | CHEK1 | CHEK1 | CHEK1 | 2299 | 0.093 | 0.18 | YES |
| 7 | PSME4 | PSME4 | PSME4 | 2353 | 0.091 | 0.21 | YES |
| 8 | PSMD7 | PSMD7 | PSMD7 | 2399 | 0.089 | 0.24 | YES |
| 9 | PSMC1 | PSMC1 | PSMC1 | 2534 | 0.085 | 0.27 | YES |
| 10 | PSMD14 | PSMD14 | PSMD14 | 2554 | 0.085 | 0.3 | YES |
| 11 | PSMB3 | PSMB3 | PSMB3 | 2605 | 0.083 | 0.33 | YES |
| 12 | PSMA6 | PSMA6 | PSMA6 | 2683 | 0.081 | 0.35 | YES |
| 13 | PSMD11 | PSMD11 | PSMD11 | 2814 | 0.078 | 0.38 | YES |
| 14 | PSMA7 | PSMA7 | PSMA7 | 3137 | 0.07 | 0.38 | YES |
| 15 | PSMB9 | PSMB9 | PSMB9 | 3292 | 0.067 | 0.4 | YES |
| 16 | PSMD1 | PSMD1 | PSMD1 | 3309 | 0.066 | 0.42 | YES |
| 17 | PSMC6 | PSMC6 | PSMC6 | 3326 | 0.066 | 0.45 | YES |
| 18 | PSMB5 | PSMB5 | PSMB5 | 3633 | 0.06 | 0.46 | YES |
| 19 | PSME2 | PSME2 | PSME2 | 3788 | 0.057 | 0.47 | YES |
| 20 | PSMA2 | PSMA2 | PSMA2 | 3927 | 0.055 | 0.48 | YES |
| 21 | PSMB1 | PSMB1 | PSMB1 | 4044 | 0.053 | 0.5 | YES |
| 22 | PSMC5 | PSMC5 | PSMC5 | 4128 | 0.051 | 0.51 | YES |
| 23 | PSMC2 | PSMC2 | PSMC2 | 4132 | 0.051 | 0.53 | YES |
| 24 | PSMA4 | PSMA4 | PSMA4 | 4230 | 0.05 | 0.54 | YES |
| 25 | PSMD10 | PSMD10 | PSMD10 | 4256 | 0.049 | 0.56 | YES |
| 26 | PSMB7 | PSMB7 | PSMB7 | 4259 | 0.049 | 0.58 | YES |
| 27 | PSMD2 | PSMD2 | PSMD2 | 4373 | 0.047 | 0.59 | YES |
| 28 | PSMA5 | PSMA5 | PSMA5 | 4985 | 0.039 | 0.57 | YES |
| 29 | PSMD6 | PSMD6 | PSMD6 | 5043 | 0.038 | 0.58 | YES |
| 30 | PSMB2 | PSMB2 | PSMB2 | 5081 | 0.038 | 0.6 | YES |
| 31 | CHEK2 | CHEK2 | CHEK2 | 5278 | 0.035 | 0.6 | YES |
| 32 | PSMA1 | PSMA1 | PSMA1 | 5433 | 0.033 | 0.6 | YES |
| 33 | PSMF1 | PSMF1 | PSMF1 | 5477 | 0.032 | 0.61 | YES |
| 34 | PSMC4 | PSMC4 | PSMC4 | 5657 | 0.03 | 0.61 | YES |
| 35 | PSMB10 | PSMB10 | PSMB10 | 6021 | 0.026 | 0.6 | NO |
| 36 | PSMB8 | PSMB8 | PSMB8 | 6694 | 0.019 | 0.57 | NO |
| 37 | PSMD13 | PSMD13 | PSMD13 | 6926 | 0.017 | 0.57 | NO |
| 38 | PSMD8 | PSMD8 | PSMD8 | 7460 | 0.011 | 0.54 | NO |
| 39 | PSMC3 | PSMC3 | PSMC3 | 7604 | 0.0099 | 0.54 | NO |
| 40 | PSME1 | PSME1 | PSME1 | 7765 | 0.0081 | 0.53 | NO |
| 41 | PSMB4 | PSMB4 | PSMB4 | 8280 | 0.0028 | 0.5 | NO |
| 42 | ATM | ATM | ATM | 8447 | 0.001 | 0.5 | NO |
| 43 | PSMD4 | PSMD4 | PSMD4 | 8572 | -0.00038 | 0.49 | NO |
| 44 | PSMB6 | PSMB6 | PSMB6 | 9012 | -0.0046 | 0.47 | NO |
| 45 | PSMD9 | PSMD9 | PSMD9 | 9236 | -0.0071 | 0.46 | NO |
| 46 | UBA52 | UBA52 | UBA52 | 10430 | -0.02 | 0.4 | NO |
| 47 | RPS27A | RPS27A | RPS27A | 11335 | -0.03 | 0.36 | NO |
| 48 | PSMA8 | PSMA8 | PSMA8 | 12721 | -0.05 | 0.3 | NO |
Figure S25. Get High-res Image This plot shows mRNAseq_cNMF expression data heatmap (on the left) a RunningEnrichmentScore(RES) plot (on the top right) and a Signal2Noise(S2N) plot (on the bottom right) of genes in the pathway: KEGG PROTEASOME.

Figure S26. Get High-res Image For the top 5 core enriched genes in the pathway: KEGG PROTEASOME, this volcano plot shows how much they are up/down-regulated and significant. The significance was calculated by empirical bayesian fit

Table S14. Get Full Table This table shows a Running Enrichment Score (RES) of each gene in this pathway, that is, the enrichment score at this point in the ranked list of genes. All genes are ranked by Signal-to-Noise (S2N), a measure of similarity as default and are used to obtain ES matrix of all genes. In this way, GSEA tool uses expression pattern of not only overlapped genes but also not-overlapped genes to produce ES matrix.
| Rank | GENE | SYMBOL | DESC | LIST.LOC | S2N | RES | CORE_ENRICHMENT |
|---|---|---|---|---|---|---|---|
| 1 | PSMD3 | PSMD3 | PSMD3 | 564 | 0.22 | 0.032 | YES |
| 2 | PSMD5 | PSMD5 | PSMD5 | 1194 | 0.15 | 0.041 | YES |
| 3 | PSMD12 | PSMD12 | PSMD12 | 1810 | 0.11 | 0.04 | YES |
| 4 | AKT1 | AKT1 | AKT1 | 2021 | 0.1 | 0.058 | YES |
| 5 | PSMA3 | PSMA3 | PSMA3 | 2293 | 0.093 | 0.071 | YES |
| 6 | PSME4 | PSME4 | PSME4 | 2353 | 0.091 | 0.094 | YES |
| 7 | PSMD7 | PSMD7 | PSMD7 | 2399 | 0.089 | 0.12 | YES |
| 8 | PSMC1 | PSMC1 | PSMC1 | 2534 | 0.085 | 0.14 | YES |
| 9 | PSMD14 | PSMD14 | PSMD14 | 2554 | 0.085 | 0.16 | YES |
| 10 | PSMB3 | PSMB3 | PSMB3 | 2605 | 0.083 | 0.18 | YES |
| 11 | PSMA6 | PSMA6 | PSMA6 | 2683 | 0.081 | 0.2 | YES |
| 12 | PSMD11 | PSMD11 | PSMD11 | 2814 | 0.078 | 0.22 | YES |
| 13 | PSMA7 | PSMA7 | PSMA7 | 3137 | 0.07 | 0.22 | YES |
| 14 | PSMB9 | PSMB9 | PSMB9 | 3292 | 0.067 | 0.23 | YES |
| 15 | PSMD1 | PSMD1 | PSMD1 | 3309 | 0.066 | 0.25 | YES |
| 16 | PSMC6 | PSMC6 | PSMC6 | 3326 | 0.066 | 0.27 | YES |
| 17 | PSMB5 | PSMB5 | PSMB5 | 3633 | 0.06 | 0.27 | YES |
| 18 | PSME2 | PSME2 | PSME2 | 3788 | 0.057 | 0.28 | YES |
| 19 | PSMA2 | PSMA2 | PSMA2 | 3927 | 0.055 | 0.28 | YES |
| 20 | HSPA8 | HSPA8 | HSPA8 | 4034 | 0.053 | 0.3 | YES |
| 21 | PSMB1 | PSMB1 | PSMB1 | 4044 | 0.053 | 0.31 | YES |
| 22 | PSMC5 | PSMC5 | PSMC5 | 4128 | 0.051 | 0.32 | YES |
| 23 | PSMC2 | PSMC2 | PSMC2 | 4132 | 0.051 | 0.34 | YES |
| 24 | PSMA4 | PSMA4 | PSMA4 | 4230 | 0.05 | 0.34 | YES |
| 25 | PSMD10 | PSMD10 | PSMD10 | 4256 | 0.049 | 0.36 | YES |
| 26 | PSMB7 | PSMB7 | PSMB7 | 4259 | 0.049 | 0.37 | YES |
| 27 | PSMD2 | PSMD2 | PSMD2 | 4373 | 0.047 | 0.38 | YES |
| 28 | YWHAB | YWHAB | YWHAB | 4652 | 0.043 | 0.38 | YES |
| 29 | PSMA5 | PSMA5 | PSMA5 | 4985 | 0.039 | 0.37 | YES |
| 30 | PSMD6 | PSMD6 | PSMD6 | 5043 | 0.038 | 0.38 | YES |
| 31 | PSMB2 | PSMB2 | PSMB2 | 5081 | 0.038 | 0.39 | YES |
| 32 | YWHAZ | YWHAZ | YWHAZ | 5101 | 0.037 | 0.4 | YES |
| 33 | PRKCD | PRKCD | PRKCD | 5157 | 0.036 | 0.4 | YES |
| 34 | MAPK14 | MAPK14 | MAPK14 | 5246 | 0.035 | 0.41 | YES |
| 35 | EIF4G1 | EIF4G1 | EIF4G1 | 5370 | 0.034 | 0.41 | YES |
| 36 | PSMA1 | PSMA1 | PSMA1 | 5433 | 0.033 | 0.42 | YES |
| 37 | PSMF1 | PSMF1 | PSMF1 | 5477 | 0.032 | 0.43 | YES |
| 38 | TNPO1 | TNPO1 | TNPO1 | 5483 | 0.032 | 0.44 | YES |
| 39 | PABPC1 | PABPC1 | PABPC1 | 5564 | 0.031 | 0.44 | YES |
| 40 | PSMC4 | PSMC4 | PSMC4 | 5657 | 0.03 | 0.44 | YES |
| 41 | ZFP36L1 | ZFP36L1 | ZFP36L1 | 5984 | 0.027 | 0.43 | YES |
| 42 | PSMB10 | PSMB10 | PSMB10 | 6021 | 0.026 | 0.44 | YES |
| 43 | EXOSC2 | EXOSC2 | EXOSC2 | 6098 | 0.025 | 0.44 | YES |
| 44 | TNFSF13 | TNFSF13 | TNFSF13 | 6324 | 0.023 | 0.44 | YES |
| 45 | HSPB1 | HSPB1 | HSPB1 | 6350 | 0.022 | 0.44 | YES |
| 46 | NUP214 | NUP214 | NUP214 | 6470 | 0.021 | 0.44 | YES |
| 47 | EXOSC8 | EXOSC8 | EXOSC8 | 6472 | 0.021 | 0.45 | YES |
| 48 | EXOSC6 | EXOSC6 | EXOSC6 | 6642 | 0.02 | 0.44 | YES |
| 49 | PSMB8 | PSMB8 | PSMB8 | 6694 | 0.019 | 0.45 | YES |
| 50 | MAPK11 | MAPK11 | MAPK11 | 6739 | 0.019 | 0.45 | YES |
| 51 | PSMD13 | PSMD13 | PSMD13 | 6926 | 0.017 | 0.44 | NO |
| 52 | XPO1 | XPO1 | XPO1 | 7119 | 0.015 | 0.44 | NO |
| 53 | DCP2 | DCP2 | DCP2 | 7256 | 0.013 | 0.44 | NO |
| 54 | PSMD8 | PSMD8 | PSMD8 | 7460 | 0.011 | 0.43 | NO |
| 55 | XRN1 | XRN1 | XRN1 | 7490 | 0.011 | 0.43 | NO |
| 56 | PSMC3 | PSMC3 | PSMC3 | 7604 | 0.0099 | 0.43 | NO |
| 57 | PSME1 | PSME1 | PSME1 | 7765 | 0.0081 | 0.42 | NO |
| 58 | EXOSC1 | EXOSC1 | EXOSC1 | 8122 | 0.0043 | 0.4 | NO |
| 59 | PARN | PARN | PARN | 8188 | 0.0036 | 0.4 | NO |
| 60 | PSMB4 | PSMB4 | PSMB4 | 8280 | 0.0028 | 0.4 | NO |
| 61 | DIS3 | DIS3 | DIS3 | 8337 | 0.0021 | 0.39 | NO |
| 62 | PSMD4 | PSMD4 | PSMD4 | 8572 | -0.00038 | 0.38 | NO |
| 63 | EXOSC7 | EXOSC7 | EXOSC7 | 8574 | -0.00041 | 0.38 | NO |
| 64 | KHSRP | KHSRP | KHSRP | 8998 | -0.0045 | 0.36 | NO |
| 65 | PSMB6 | PSMB6 | PSMB6 | 9012 | -0.0046 | 0.36 | NO |
| 66 | PRKCA | PRKCA | PRKCA | 9148 | -0.0063 | 0.35 | NO |
| 67 | PSMD9 | PSMD9 | PSMD9 | 9236 | -0.0071 | 0.35 | NO |
| 68 | EXOSC9 | EXOSC9 | EXOSC9 | 9527 | -0.01 | 0.34 | NO |
| 69 | HNRNPD | HNRNPD | HNRNPD | 9576 | -0.011 | 0.34 | NO |
| 70 | ELAVL1 | ELAVL1 | ELAVL1 | 9849 | -0.014 | 0.33 | NO |
| 71 | MAPKAPK2 | MAPKAPK2 | MAPKAPK2 | 9949 | -0.015 | 0.33 | NO |
| 72 | EXOSC4 | EXOSC4 | EXOSC4 | 10147 | -0.017 | 0.32 | NO |
| 73 | UBA52 | UBA52 | UBA52 | 10430 | -0.02 | 0.31 | NO |
| 74 | ANP32A | ANP32A | ANP32A | 10744 | -0.024 | 0.3 | NO |
| 75 | HSPA1B | HSPA1B | HSPA1B | 10865 | -0.025 | 0.3 | NO |
| 76 | RPS27A | RPS27A | RPS27A | 11335 | -0.03 | 0.28 | NO |
| 77 | DCP1A | DCP1A | DCP1A | 12652 | -0.048 | 0.23 | NO |
| 78 | PSMA8 | PSMA8 | PSMA8 | 12721 | -0.05 | 0.24 | NO |
| 79 | EXOSC3 | EXOSC3 | EXOSC3 | 12787 | -0.05 | 0.25 | NO |
| 80 | ZFP36 | ZFP36 | ZFP36 | 13563 | -0.064 | 0.22 | NO |
| 81 | EXOSC5 | EXOSC5 | EXOSC5 | 15644 | -0.12 | 0.14 | NO |
Figure S27. Get High-res Image This plot shows mRNAseq_cNMF expression data heatmap (on the left) a RunningEnrichmentScore(RES) plot (on the top right) and a Signal2Noise(S2N) plot (on the bottom right) of genes in the pathway: BIOCARTA PROTEASOME PATHWAY.
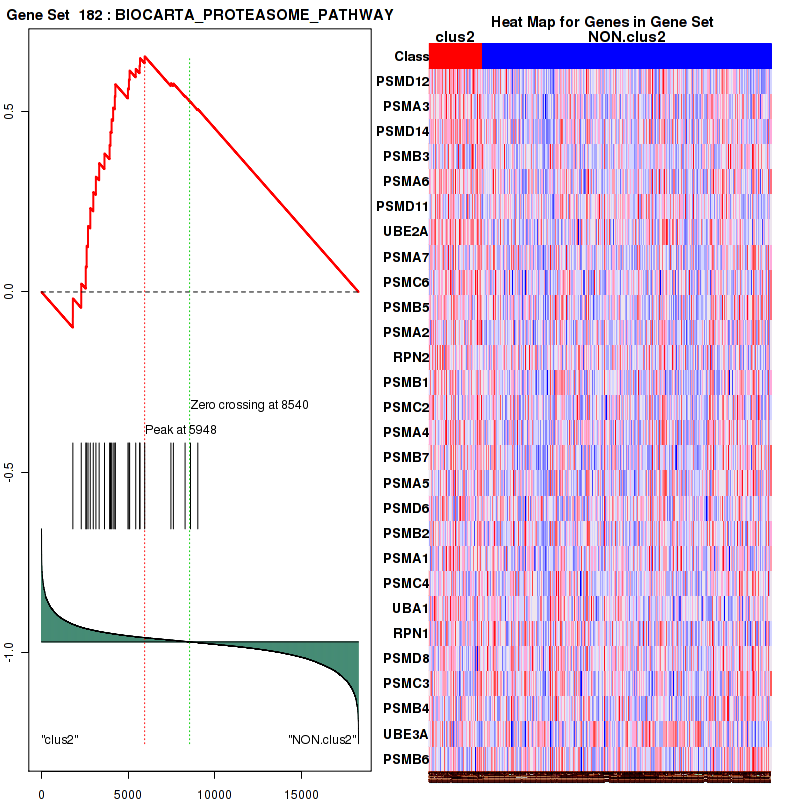
Figure S28. Get High-res Image For the top 5 core enriched genes in the pathway: BIOCARTA PROTEASOME PATHWAY, this volcano plot shows how much they are up/down-regulated and significant. The significance was calculated by empirical bayesian fit

Table S15. Get Full Table This table shows a Running Enrichment Score (RES) of each gene in this pathway, that is, the enrichment score at this point in the ranked list of genes. All genes are ranked by Signal-to-Noise (S2N), a measure of similarity as default and are used to obtain ES matrix of all genes. In this way, GSEA tool uses expression pattern of not only overlapped genes but also not-overlapped genes to produce ES matrix.
| Rank | GENE | SYMBOL | DESC | LIST.LOC | S2N | RES | CORE_ENRICHMENT |
|---|---|---|---|---|---|---|---|
| 1 | PSMD3 | PSMD3 | PSMD3 | 564 | 0.22 | 0.039 | YES |
| 2 | PSMD5 | PSMD5 | PSMD5 | 1194 | 0.15 | 0.052 | YES |
| 3 | PSMD12 | PSMD12 | PSMD12 | 1810 | 0.11 | 0.055 | YES |
| 4 | PSMA3 | PSMA3 | PSMA3 | 2293 | 0.093 | 0.058 | YES |
| 5 | PSME4 | PSME4 | PSME4 | 2353 | 0.091 | 0.085 | YES |
| 6 | PSMD7 | PSMD7 | PSMD7 | 2399 | 0.089 | 0.11 | YES |
| 7 | PSMC1 | PSMC1 | PSMC1 | 2534 | 0.085 | 0.13 | YES |
| 8 | PSMD14 | PSMD14 | PSMD14 | 2554 | 0.085 | 0.16 | YES |
| 9 | PSMB3 | PSMB3 | PSMB3 | 2605 | 0.083 | 0.18 | YES |
| 10 | PSMA6 | PSMA6 | PSMA6 | 2683 | 0.081 | 0.2 | YES |
| 11 | PPP2R5E | PPP2R5E | PPP2R5E | 2705 | 0.081 | 0.23 | YES |
| 12 | PSMD11 | PSMD11 | PSMD11 | 2814 | 0.078 | 0.25 | YES |
| 13 | PSMA7 | PSMA7 | PSMA7 | 3137 | 0.07 | 0.26 | YES |
| 14 | PSMB9 | PSMB9 | PSMB9 | 3292 | 0.067 | 0.27 | YES |
| 15 | PSMD1 | PSMD1 | PSMD1 | 3309 | 0.066 | 0.29 | YES |
| 16 | PSMC6 | PSMC6 | PSMC6 | 3326 | 0.066 | 0.31 | YES |
| 17 | PSMB5 | PSMB5 | PSMB5 | 3633 | 0.06 | 0.31 | YES |
| 18 | PSME2 | PSME2 | PSME2 | 3788 | 0.057 | 0.32 | YES |
| 19 | PSMA2 | PSMA2 | PSMA2 | 3927 | 0.055 | 0.33 | YES |
| 20 | PSMB1 | PSMB1 | PSMB1 | 4044 | 0.053 | 0.34 | YES |
| 21 | PSMC5 | PSMC5 | PSMC5 | 4128 | 0.051 | 0.36 | YES |
| 22 | PSMC2 | PSMC2 | PSMC2 | 4132 | 0.051 | 0.37 | YES |
| 23 | PSMA4 | PSMA4 | PSMA4 | 4230 | 0.05 | 0.38 | YES |
| 24 | PSMD10 | PSMD10 | PSMD10 | 4256 | 0.049 | 0.4 | YES |
| 25 | PSMB7 | PSMB7 | PSMB7 | 4259 | 0.049 | 0.41 | YES |
| 26 | PSMD2 | PSMD2 | PSMD2 | 4373 | 0.047 | 0.42 | YES |
| 27 | PPP2R1B | PPP2R1B | PPP2R1B | 4474 | 0.046 | 0.43 | YES |
| 28 | APC | APC | APC | 4494 | 0.046 | 0.44 | YES |
| 29 | PSMA5 | PSMA5 | PSMA5 | 4985 | 0.039 | 0.43 | YES |
| 30 | PSMD6 | PSMD6 | PSMD6 | 5043 | 0.038 | 0.44 | YES |
| 31 | PSMB2 | PSMB2 | PSMB2 | 5081 | 0.038 | 0.45 | YES |
| 32 | PPP2R5C | PPP2R5C | PPP2R5C | 5366 | 0.034 | 0.45 | YES |
| 33 | PSMA1 | PSMA1 | PSMA1 | 5433 | 0.033 | 0.45 | YES |
| 34 | PSMF1 | PSMF1 | PSMF1 | 5477 | 0.032 | 0.46 | YES |
| 35 | PPP2CA | PPP2CA | PPP2CA | 5506 | 0.032 | 0.47 | YES |
| 36 | CSNK1A1 | CSNK1A1 | CSNK1A1 | 5538 | 0.032 | 0.48 | YES |
| 37 | PSMC4 | PSMC4 | PSMC4 | 5657 | 0.03 | 0.48 | YES |
| 38 | PSMB10 | PSMB10 | PSMB10 | 6021 | 0.026 | 0.47 | NO |
| 39 | FAM123B | FAM123B | FAM123B | 6632 | 0.02 | 0.44 | NO |
| 40 | FRAT2 | FRAT2 | FRAT2 | 6647 | 0.019 | 0.45 | NO |
| 41 | PSMB8 | PSMB8 | PSMB8 | 6694 | 0.019 | 0.45 | NO |
| 42 | PPP2R5B | PPP2R5B | PPP2R5B | 6826 | 0.018 | 0.45 | NO |
| 43 | PSMD13 | PSMD13 | PSMD13 | 6926 | 0.017 | 0.45 | NO |
| 44 | PPP2R5D | PPP2R5D | PPP2R5D | 6996 | 0.016 | 0.45 | NO |
| 45 | PPP2R1A | PPP2R1A | PPP2R1A | 7076 | 0.015 | 0.45 | NO |
| 46 | PSMD8 | PSMD8 | PSMD8 | 7460 | 0.011 | 0.44 | NO |
| 47 | PSMC3 | PSMC3 | PSMC3 | 7604 | 0.0099 | 0.43 | NO |
| 48 | PPP2CB | PPP2CB | PPP2CB | 7764 | 0.0081 | 0.42 | NO |
| 49 | PSME1 | PSME1 | PSME1 | 7765 | 0.0081 | 0.43 | NO |
| 50 | PSMB4 | PSMB4 | PSMB4 | 8280 | 0.0028 | 0.4 | NO |
| 51 | PSMD4 | PSMD4 | PSMD4 | 8572 | -0.00038 | 0.38 | NO |
| 52 | PSMB6 | PSMB6 | PSMB6 | 9012 | -0.0046 | 0.36 | NO |
| 53 | SKP1 | SKP1 | SKP1 | 9192 | -0.0066 | 0.35 | NO |
| 54 | PSMD9 | PSMD9 | PSMD9 | 9236 | -0.0071 | 0.35 | NO |
| 55 | PPP2R5A | PPP2R5A | PPP2R5A | 9369 | -0.0086 | 0.35 | NO |
| 56 | CUL1 | CUL1 | CUL1 | 9525 | -0.01 | 0.34 | NO |
| 57 | UBA52 | UBA52 | UBA52 | 10430 | -0.02 | 0.3 | NO |
| 58 | CTNNB1 | CTNNB1 | CTNNB1 | 10940 | -0.026 | 0.28 | NO |
| 59 | RPS27A | RPS27A | RPS27A | 11335 | -0.03 | 0.27 | NO |
| 60 | PSMA8 | PSMA8 | PSMA8 | 12721 | -0.05 | 0.21 | NO |
| 61 | AXIN1 | AXIN1 | AXIN1 | 13391 | -0.061 | 0.19 | NO |
| 62 | BTRC | BTRC | BTRC | 15434 | -0.11 | 0.12 | NO |
| 63 | FRAT1 | FRAT1 | FRAT1 | 15620 | -0.12 | 0.15 | NO |
Figure S29. Get High-res Image This plot shows mRNAseq_cNMF expression data heatmap (on the left) a RunningEnrichmentScore(RES) plot (on the top right) and a Signal2Noise(S2N) plot (on the bottom right) of genes in the pathway: BIOCARTA VEGF PATHWAY.
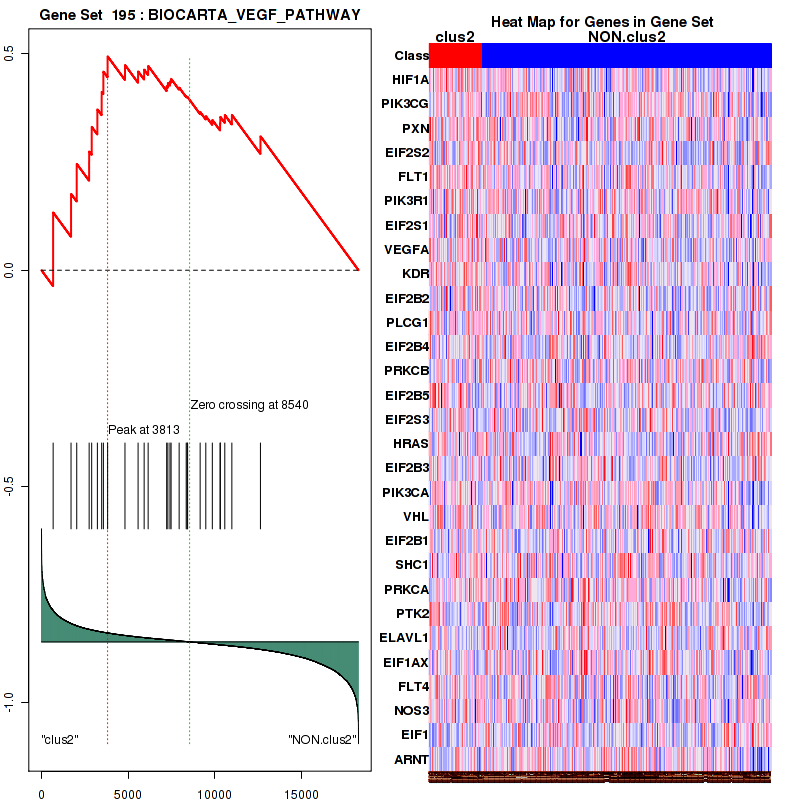
Figure S30. Get High-res Image For the top 5 core enriched genes in the pathway: BIOCARTA VEGF PATHWAY, this volcano plot shows how much they are up/down-regulated and significant. The significance was calculated by empirical bayesian fit

Table S16. Get Full Table This table shows a Running Enrichment Score (RES) of each gene in this pathway, that is, the enrichment score at this point in the ranked list of genes. All genes are ranked by Signal-to-Noise (S2N), a measure of similarity as default and are used to obtain ES matrix of all genes. In this way, GSEA tool uses expression pattern of not only overlapped genes but also not-overlapped genes to produce ES matrix.
| Rank | GENE | SYMBOL | DESC | LIST.LOC | S2N | RES | CORE_ENRICHMENT |
|---|---|---|---|---|---|---|---|
| 1 | PSMD3 | PSMD3 | PSMD3 | 564 | 0.22 | 0.012 | YES |
| 2 | PSMD5 | PSMD5 | PSMD5 | 1194 | 0.15 | 0.0073 | YES |
| 3 | CD28 | CD28 | CD28 | 1692 | 0.12 | 0.0037 | YES |
| 4 | PSMD12 | PSMD12 | PSMD12 | 1810 | 0.11 | 0.02 | YES |
| 5 | DOCK2 | DOCK2 | DOCK2 | 2241 | 0.095 | 0.015 | YES |
| 6 | PSMA3 | PSMA3 | PSMA3 | 2293 | 0.093 | 0.031 | YES |
| 7 | PSME4 | PSME4 | PSME4 | 2353 | 0.091 | 0.046 | YES |
| 8 | PSMD7 | PSMD7 | PSMD7 | 2399 | 0.089 | 0.062 | YES |
| 9 | PSMC1 | PSMC1 | PSMC1 | 2534 | 0.085 | 0.072 | YES |
| 10 | PSMD14 | PSMD14 | PSMD14 | 2554 | 0.085 | 0.088 | YES |
| 11 | PSMB3 | PSMB3 | PSMB3 | 2605 | 0.083 | 0.1 | YES |
| 12 | SLC25A5 | SLC25A5 | SLC25A5 | 2628 | 0.083 | 0.12 | YES |
| 13 | PSMA6 | PSMA6 | PSMA6 | 2683 | 0.081 | 0.13 | YES |
| 14 | PSMD11 | PSMD11 | PSMD11 | 2814 | 0.078 | 0.14 | YES |
| 15 | PSMA7 | PSMA7 | PSMA7 | 3137 | 0.07 | 0.14 | YES |
| 16 | AP1B1 | AP1B1 | AP1B1 | 3264 | 0.068 | 0.14 | YES |
| 17 | PSMB9 | PSMB9 | PSMB9 | 3292 | 0.067 | 0.15 | YES |
| 18 | PSMD1 | PSMD1 | PSMD1 | 3309 | 0.066 | 0.17 | YES |
| 19 | PSMC6 | PSMC6 | PSMC6 | 3326 | 0.066 | 0.18 | YES |
| 20 | PSMB5 | PSMB5 | PSMB5 | 3633 | 0.06 | 0.18 | YES |
| 21 | PSME2 | PSME2 | PSME2 | 3788 | 0.057 | 0.18 | YES |
| 22 | NUP93 | NUP93 | NUP93 | 3868 | 0.056 | 0.18 | YES |
| 23 | LCK | LCK | LCK | 3875 | 0.056 | 0.2 | YES |
| 24 | NUP155 | NUP155 | NUP155 | 3911 | 0.055 | 0.2 | YES |
| 25 | PSMA2 | PSMA2 | PSMA2 | 3927 | 0.055 | 0.22 | YES |
| 26 | AP2S1 | AP2S1 | AP2S1 | 3997 | 0.054 | 0.22 | YES |
| 27 | SLC25A4 | SLC25A4 | SLC25A4 | 4027 | 0.053 | 0.23 | YES |
| 28 | PSMB1 | PSMB1 | PSMB1 | 4044 | 0.053 | 0.24 | YES |
| 29 | CD4 | CD4 | CD4 | 4069 | 0.052 | 0.25 | YES |
| 30 | KPNA1 | KPNA1 | KPNA1 | 4072 | 0.052 | 0.26 | YES |
| 31 | B2M | B2M | B2M | 4082 | 0.052 | 0.27 | YES |
| 32 | PSMC5 | PSMC5 | PSMC5 | 4128 | 0.051 | 0.28 | YES |
| 33 | PSMC2 | PSMC2 | PSMC2 | 4132 | 0.051 | 0.29 | YES |
| 34 | AP1G1 | AP1G1 | AP1G1 | 4142 | 0.051 | 0.3 | YES |
| 35 | CCNT1 | CCNT1 | CCNT1 | 4184 | 0.05 | 0.31 | YES |
| 36 | PSMA4 | PSMA4 | PSMA4 | 4230 | 0.05 | 0.31 | YES |
| 37 | PSMD10 | PSMD10 | PSMD10 | 4256 | 0.049 | 0.32 | YES |
| 38 | PSMB7 | PSMB7 | PSMB7 | 4259 | 0.049 | 0.33 | YES |
| 39 | PSMD2 | PSMD2 | PSMD2 | 4373 | 0.047 | 0.34 | YES |
| 40 | RAC1 | RAC1 | RAC1 | 4504 | 0.046 | 0.34 | YES |
| 41 | HMGA1 | HMGA1 | HMGA1 | 4615 | 0.044 | 0.34 | YES |
| 42 | NUP188 | NUP188 | NUP188 | 4807 | 0.041 | 0.34 | YES |
| 43 | RAE1 | RAE1 | RAE1 | 4856 | 0.04 | 0.34 | YES |
| 44 | PPIA | PPIA | PPIA | 4931 | 0.039 | 0.35 | YES |
| 45 | CD247 | CD247 | CD247 | 4978 | 0.039 | 0.35 | YES |
| 46 | RCC1 | RCC1 | RCC1 | 4980 | 0.039 | 0.36 | YES |
| 47 | PSMA5 | PSMA5 | PSMA5 | 4985 | 0.039 | 0.37 | YES |
| 48 | RBX1 | RBX1 | RBX1 | 5035 | 0.038 | 0.37 | YES |
| 49 | PSMD6 | PSMD6 | PSMD6 | 5043 | 0.038 | 0.38 | YES |
| 50 | PSMB2 | PSMB2 | PSMB2 | 5081 | 0.038 | 0.39 | YES |
| 51 | NUP43 | NUP43 | NUP43 | 5111 | 0.037 | 0.39 | YES |
| 52 | NUP50 | NUP50 | NUP50 | 5208 | 0.036 | 0.39 | YES |
| 53 | AP1S2 | AP1S2 | AP1S2 | 5211 | 0.036 | 0.4 | YES |
| 54 | BANF1 | BANF1 | BANF1 | 5243 | 0.035 | 0.41 | YES |
| 55 | PACS1 | PACS1 | PACS1 | 5417 | 0.033 | 0.4 | YES |
| 56 | PSMA1 | PSMA1 | PSMA1 | 5433 | 0.033 | 0.41 | YES |
| 57 | RANBP1 | RANBP1 | RANBP1 | 5443 | 0.032 | 0.42 | YES |
| 58 | PSMF1 | PSMF1 | PSMF1 | 5477 | 0.032 | 0.42 | YES |
| 59 | ARF1 | ARF1 | ARF1 | 5539 | 0.032 | 0.42 | YES |
| 60 | PSMC4 | PSMC4 | PSMC4 | 5657 | 0.03 | 0.42 | YES |
| 61 | RAN | RAN | RAN | 5713 | 0.03 | 0.42 | YES |
| 62 | RANGAP1 | RANGAP1 | RANGAP1 | 5821 | 0.028 | 0.42 | YES |
| 63 | TCEB1 | TCEB1 | TCEB1 | 5899 | 0.028 | 0.43 | YES |
| 64 | AP1S1 | AP1S1 | AP1S1 | 5903 | 0.027 | 0.43 | YES |
| 65 | RANBP2 | RANBP2 | RANBP2 | 5920 | 0.027 | 0.44 | YES |
| 66 | PAK2 | PAK2 | PAK2 | 5983 | 0.027 | 0.44 | YES |
| 67 | PSMB10 | PSMB10 | PSMB10 | 6021 | 0.026 | 0.44 | YES |
| 68 | NUP205 | NUP205 | NUP205 | 6073 | 0.026 | 0.44 | YES |
| 69 | CDK9 | CDK9 | CDK9 | 6088 | 0.026 | 0.45 | YES |
| 70 | AP2M1 | AP2M1 | AP2M1 | 6328 | 0.023 | 0.44 | NO |
| 71 | NUP214 | NUP214 | NUP214 | 6470 | 0.021 | 0.44 | NO |
| 72 | PSMB8 | PSMB8 | PSMB8 | 6694 | 0.019 | 0.43 | NO |
| 73 | PSMD13 | PSMD13 | PSMD13 | 6926 | 0.017 | 0.42 | NO |
| 74 | NUP37 | NUP37 | NUP37 | 6978 | 0.016 | 0.42 | NO |
| 75 | APOBEC3G | APOBEC3G | APOBEC3G | 7003 | 0.016 | 0.42 | NO |
| 76 | HCK | HCK | HCK | 7044 | 0.016 | 0.42 | NO |
| 77 | XPO1 | XPO1 | XPO1 | 7119 | 0.015 | 0.42 | NO |
| 78 | HLA-A | HLA-A | HLA-A | 7200 | 0.014 | 0.42 | NO |
| 79 | NUP153 | NUP153 | NUP153 | 7328 | 0.013 | 0.42 | NO |
| 80 | PSMD8 | PSMD8 | PSMD8 | 7460 | 0.011 | 0.41 | NO |
| 81 | PSMC3 | PSMC3 | PSMC3 | 7604 | 0.0099 | 0.4 | NO |
| 82 | PSME1 | PSME1 | PSME1 | 7765 | 0.0081 | 0.4 | NO |
| 83 | AP1M2 | AP1M2 | AP1M2 | 7851 | 0.0071 | 0.39 | NO |
| 84 | NUP107 | NUP107 | NUP107 | 7883 | 0.0068 | 0.39 | NO |
| 85 | NUP85 | NUP85 | NUP85 | 7964 | 0.0058 | 0.39 | NO |
| 86 | FYN | FYN | FYN | 8113 | 0.0043 | 0.38 | NO |
| 87 | NUP54 | NUP54 | NUP54 | 8272 | 0.0028 | 0.38 | NO |
| 88 | AP2A1 | AP2A1 | AP2A1 | 8274 | 0.0028 | 0.38 | NO |
| 89 | PSMB4 | PSMB4 | PSMB4 | 8280 | 0.0028 | 0.38 | NO |
| 90 | AP1M1 | AP1M1 | AP1M1 | 8414 | 0.0015 | 0.37 | NO |
| 91 | NPM1 | NPM1 | NPM1 | 8565 | -0.00032 | 0.36 | NO |
| 92 | PSMD4 | PSMD4 | PSMD4 | 8572 | -0.00038 | 0.36 | NO |
| 93 | CUL5 | CUL5 | CUL5 | 8576 | -0.00042 | 0.36 | NO |
| 94 | NUPL1 | NUPL1 | NUPL1 | 8615 | -0.00082 | 0.36 | NO |
| 95 | NUP35 | NUP35 | NUP35 | 8653 | -0.0012 | 0.36 | NO |
| 96 | PSMB6 | PSMB6 | PSMB6 | 9012 | -0.0046 | 0.34 | NO |
| 97 | TPR | TPR | TPR | 9051 | -0.0051 | 0.34 | NO |
| 98 | ELMO1 | ELMO1 | ELMO1 | 9056 | -0.0052 | 0.34 | NO |
| 99 | SKP1 | SKP1 | SKP1 | 9192 | -0.0066 | 0.33 | NO |
| 100 | KPNB1 | KPNB1 | KPNB1 | 9203 | -0.0068 | 0.33 | NO |
| 101 | PSMD9 | PSMD9 | PSMD9 | 9236 | -0.0071 | 0.33 | NO |
| 102 | SLC25A6 | SLC25A6 | SLC25A6 | 9394 | -0.0088 | 0.32 | NO |
| 103 | TCEB2 | TCEB2 | TCEB2 | 9514 | -0.01 | 0.32 | NO |
| 104 | NUP133 | NUP133 | NUP133 | 9676 | -0.012 | 0.31 | NO |
| 105 | CD8B | CD8B | CD8B | 9927 | -0.015 | 0.3 | NO |
| 106 | UBA52 | UBA52 | UBA52 | 10430 | -0.02 | 0.28 | NO |
| 107 | NUP62 | NUP62 | NUP62 | 10436 | -0.02 | 0.28 | NO |
| 108 | AAAS | AAAS | AAAS | 11155 | -0.028 | 0.25 | NO |
| 109 | AP2A2 | AP2A2 | AP2A2 | 11297 | -0.03 | 0.25 | NO |
| 110 | RPS27A | RPS27A | RPS27A | 11335 | -0.03 | 0.25 | NO |
| 111 | ATP6V1H | ATP6V1H | ATP6V1H | 11373 | -0.031 | 0.26 | NO |
| 112 | POM121 | POM121 | POM121 | 11461 | -0.032 | 0.26 | NO |
| 113 | NUP88 | NUP88 | NUP88 | 11501 | -0.032 | 0.26 | NO |
| 114 | AP2B1 | AP2B1 | AP2B1 | 11731 | -0.035 | 0.26 | NO |
| 115 | PSMA8 | PSMA8 | PSMA8 | 12721 | -0.05 | 0.21 | NO |
| 116 | SEH1L | SEH1L | SEH1L | 13047 | -0.055 | 0.2 | NO |
| 117 | NUPL2 | NUPL2 | NUPL2 | 14190 | -0.077 | 0.16 | NO |
| 118 | NUP210 | NUP210 | NUP210 | 14740 | -0.091 | 0.15 | NO |
| 119 | BTRC | BTRC | BTRC | 15434 | -0.11 | 0.13 | NO |
| 120 | PSIP1 | PSIP1 | PSIP1 | 15898 | -0.13 | 0.13 | NO |
Figure S31. Get High-res Image This plot shows mRNAseq_cNMF expression data heatmap (on the left) a RunningEnrichmentScore(RES) plot (on the top right) and a Signal2Noise(S2N) plot (on the bottom right) of genes in the pathway: PID INTEGRIN3 PATHWAY.
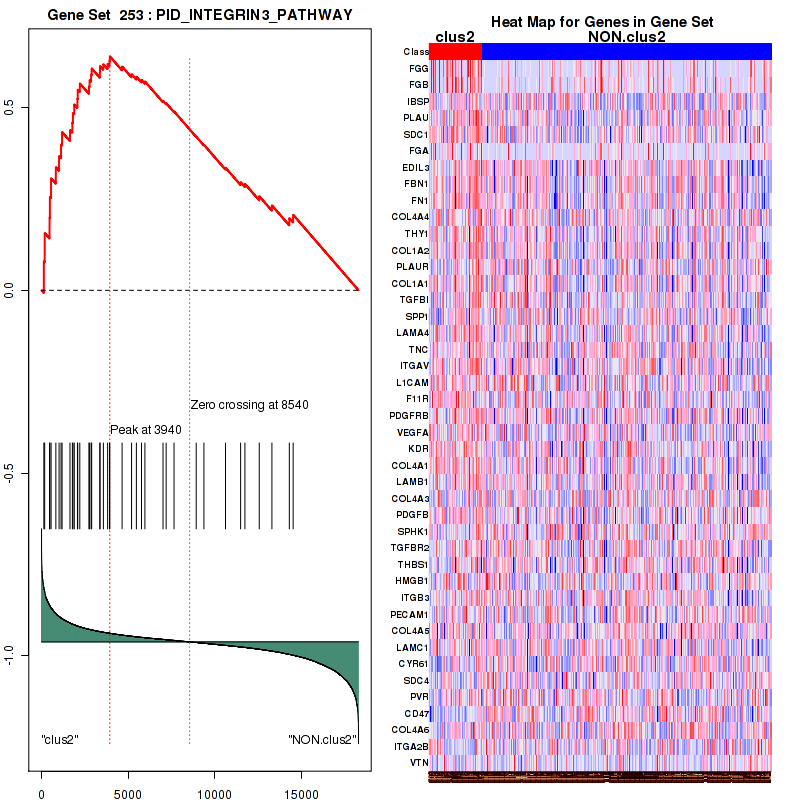
Figure S32. Get High-res Image For the top 5 core enriched genes in the pathway: PID INTEGRIN3 PATHWAY, this volcano plot shows how much they are up/down-regulated and significant. The significance was calculated by empirical bayesian fit

Table S17. Get Full Table This table shows a Running Enrichment Score (RES) of each gene in this pathway, that is, the enrichment score at this point in the ranked list of genes. All genes are ranked by Signal-to-Noise (S2N), a measure of similarity as default and are used to obtain ES matrix of all genes. In this way, GSEA tool uses expression pattern of not only overlapped genes but also not-overlapped genes to produce ES matrix.
| Rank | GENE | SYMBOL | DESC | LIST.LOC | S2N | RES | CORE_ENRICHMENT |
|---|---|---|---|---|---|---|---|
| 1 | PSMD3 | PSMD3 | PSMD3 | 564 | 0.22 | 0.057 | YES |
| 2 | PSMD5 | PSMD5 | PSMD5 | 1194 | 0.15 | 0.082 | YES |
| 3 | PSMD12 | PSMD12 | PSMD12 | 1810 | 0.11 | 0.094 | YES |
| 4 | PSMA3 | PSMA3 | PSMA3 | 2293 | 0.093 | 0.11 | YES |
| 5 | PSME4 | PSME4 | PSME4 | 2353 | 0.091 | 0.14 | YES |
| 6 | PSMD7 | PSMD7 | PSMD7 | 2399 | 0.089 | 0.17 | YES |
| 7 | PSMC1 | PSMC1 | PSMC1 | 2534 | 0.085 | 0.2 | YES |
| 8 | PSMD14 | PSMD14 | PSMD14 | 2554 | 0.085 | 0.24 | YES |
| 9 | PSMB3 | PSMB3 | PSMB3 | 2605 | 0.083 | 0.27 | YES |
| 10 | PSMA6 | PSMA6 | PSMA6 | 2683 | 0.081 | 0.3 | YES |
| 11 | PSMD11 | PSMD11 | PSMD11 | 2814 | 0.078 | 0.32 | YES |
| 12 | PSMA7 | PSMA7 | PSMA7 | 3137 | 0.07 | 0.33 | YES |
| 13 | PSMB9 | PSMB9 | PSMB9 | 3292 | 0.067 | 0.35 | YES |
| 14 | PSMD1 | PSMD1 | PSMD1 | 3309 | 0.066 | 0.38 | YES |
| 15 | PSMC6 | PSMC6 | PSMC6 | 3326 | 0.066 | 0.4 | YES |
| 16 | PSMB5 | PSMB5 | PSMB5 | 3633 | 0.06 | 0.41 | YES |
| 17 | PSME2 | PSME2 | PSME2 | 3788 | 0.057 | 0.42 | YES |
| 18 | PSMA2 | PSMA2 | PSMA2 | 3927 | 0.055 | 0.44 | YES |
| 19 | PSMB1 | PSMB1 | PSMB1 | 4044 | 0.053 | 0.46 | YES |
| 20 | PSMC5 | PSMC5 | PSMC5 | 4128 | 0.051 | 0.47 | YES |
| 21 | PSMC2 | PSMC2 | PSMC2 | 4132 | 0.051 | 0.49 | YES |
| 22 | PSMA4 | PSMA4 | PSMA4 | 4230 | 0.05 | 0.51 | YES |
| 23 | PSMD10 | PSMD10 | PSMD10 | 4256 | 0.049 | 0.53 | YES |
| 24 | PSMB7 | PSMB7 | PSMB7 | 4259 | 0.049 | 0.55 | YES |
| 25 | PSMD2 | PSMD2 | PSMD2 | 4373 | 0.047 | 0.56 | YES |
| 26 | PSMA5 | PSMA5 | PSMA5 | 4985 | 0.039 | 0.54 | YES |
| 27 | PSMD6 | PSMD6 | PSMD6 | 5043 | 0.038 | 0.55 | YES |
| 28 | PSMB2 | PSMB2 | PSMB2 | 5081 | 0.038 | 0.57 | YES |
| 29 | RFWD2 | RFWD2 | RFWD2 | 5411 | 0.033 | 0.56 | YES |
| 30 | PSMA1 | PSMA1 | PSMA1 | 5433 | 0.033 | 0.57 | YES |
| 31 | PSMF1 | PSMF1 | PSMF1 | 5477 | 0.032 | 0.59 | YES |
| 32 | PSMC4 | PSMC4 | PSMC4 | 5657 | 0.03 | 0.59 | YES |
| 33 | PSMB10 | PSMB10 | PSMB10 | 6021 | 0.026 | 0.58 | NO |
| 34 | PSMB8 | PSMB8 | PSMB8 | 6694 | 0.019 | 0.55 | NO |
| 35 | PSMD13 | PSMD13 | PSMD13 | 6926 | 0.017 | 0.54 | NO |
| 36 | PSMD8 | PSMD8 | PSMD8 | 7460 | 0.011 | 0.52 | NO |
| 37 | PSMC3 | PSMC3 | PSMC3 | 7604 | 0.0099 | 0.52 | NO |
| 38 | PSME1 | PSME1 | PSME1 | 7765 | 0.0081 | 0.51 | NO |
| 39 | PSMB4 | PSMB4 | PSMB4 | 8280 | 0.0028 | 0.48 | NO |
| 40 | ATM | ATM | ATM | 8447 | 0.001 | 0.47 | NO |
| 41 | PSMD4 | PSMD4 | PSMD4 | 8572 | -0.00038 | 0.47 | NO |
| 42 | PSMB6 | PSMB6 | PSMB6 | 9012 | -0.0046 | 0.44 | NO |
| 43 | PSMD9 | PSMD9 | PSMD9 | 9236 | -0.0071 | 0.44 | NO |
| 44 | UBA52 | UBA52 | UBA52 | 10430 | -0.02 | 0.38 | NO |
| 45 | RPS27A | RPS27A | RPS27A | 11335 | -0.03 | 0.34 | NO |
| 46 | TP53 | TP53 | TP53 | 12514 | -0.046 | 0.3 | NO |
| 47 | PSMA8 | PSMA8 | PSMA8 | 12721 | -0.05 | 0.3 | NO |
Figure S33. Get High-res Image This plot shows mRNAseq_cNMF expression data heatmap (on the left) a RunningEnrichmentScore(RES) plot (on the top right) and a Signal2Noise(S2N) plot (on the bottom right) of genes in the pathway: REACTOME SIGNALING BY WNT.
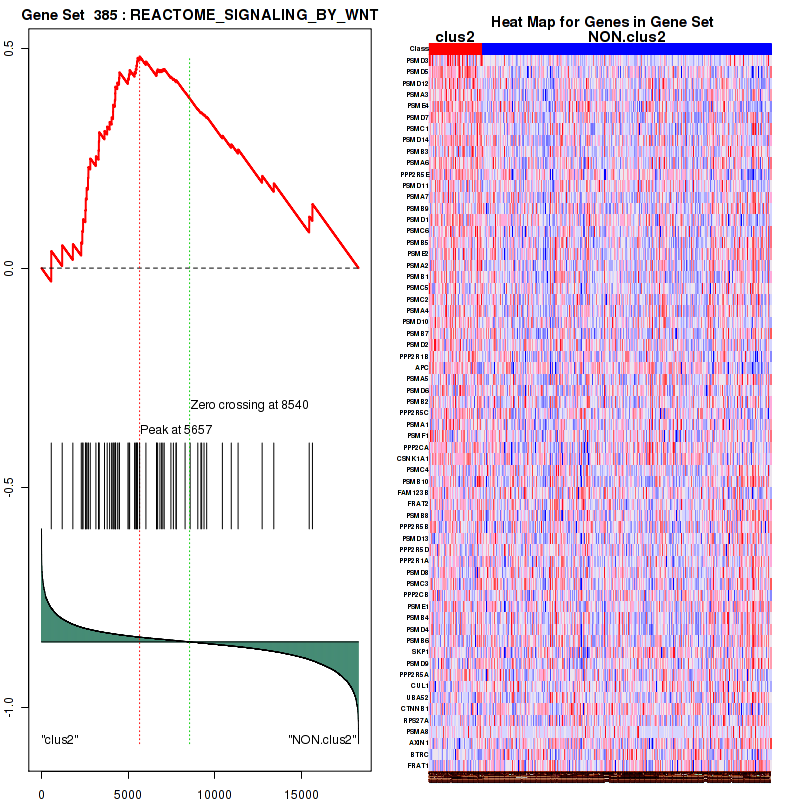
Figure S34. Get High-res Image For the top 5 core enriched genes in the pathway: REACTOME SIGNALING BY WNT, this volcano plot shows how much they are up/down-regulated and significant. The significance was calculated by empirical bayesian fit
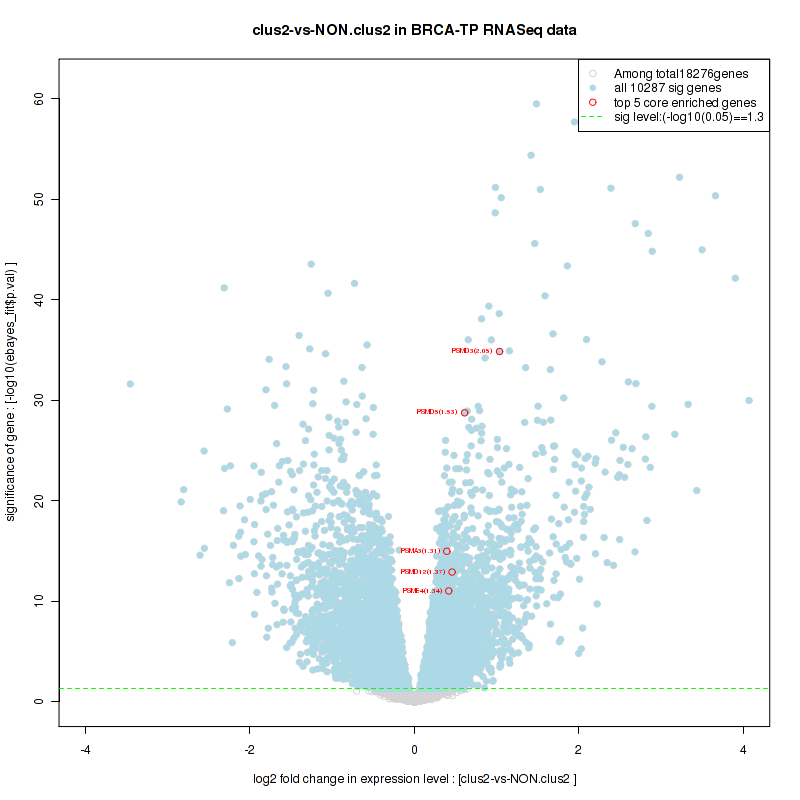
Table S18. Get Full Table This table shows a Running Enrichment Score (RES) of each gene in this pathway, that is, the enrichment score at this point in the ranked list of genes. All genes are ranked by Signal-to-Noise (S2N), a measure of similarity as default and are used to obtain ES matrix of all genes. In this way, GSEA tool uses expression pattern of not only overlapped genes but also not-overlapped genes to produce ES matrix.
| Rank | GENE | SYMBOL | DESC | LIST.LOC | S2N | RES | CORE_ENRICHMENT |
|---|---|---|---|---|---|---|---|
| 1 | CDC6 | CDC6 | CDC6 | 316 | 0.27 | 0.075 | YES |
| 2 | PSMD3 | PSMD3 | PSMD3 | 564 | 0.22 | 0.14 | YES |
| 3 | PSMD5 | PSMD5 | PSMD5 | 1194 | 0.15 | 0.15 | YES |
| 4 | MCM8 | MCM8 | MCM8 | 1683 | 0.12 | 0.17 | YES |
| 5 | PSMD12 | PSMD12 | PSMD12 | 1810 | 0.11 | 0.2 | YES |
| 6 | PSMA3 | PSMA3 | PSMA3 | 2293 | 0.093 | 0.2 | YES |
| 7 | PSME4 | PSME4 | PSME4 | 2353 | 0.091 | 0.23 | YES |
| 8 | PSMD7 | PSMD7 | PSMD7 | 2399 | 0.089 | 0.26 | YES |
| 9 | PSMC1 | PSMC1 | PSMC1 | 2534 | 0.085 | 0.28 | YES |
| 10 | PSMD14 | PSMD14 | PSMD14 | 2554 | 0.085 | 0.31 | YES |
| 11 | PSMB3 | PSMB3 | PSMB3 | 2605 | 0.083 | 0.34 | YES |
| 12 | CDT1 | CDT1 | CDT1 | 2669 | 0.082 | 0.36 | YES |
| 13 | PSMA6 | PSMA6 | PSMA6 | 2683 | 0.081 | 0.39 | YES |
| 14 | PSMD11 | PSMD11 | PSMD11 | 2814 | 0.078 | 0.41 | YES |
| 15 | PSMA7 | PSMA7 | PSMA7 | 3137 | 0.07 | 0.42 | YES |
| 16 | PSMB9 | PSMB9 | PSMB9 | 3292 | 0.067 | 0.43 | YES |
| 17 | PSMD1 | PSMD1 | PSMD1 | 3309 | 0.066 | 0.45 | YES |
| 18 | PSMC6 | PSMC6 | PSMC6 | 3326 | 0.066 | 0.47 | YES |
| 19 | GMNN | GMNN | GMNN | 3584 | 0.061 | 0.48 | YES |
| 20 | PSMB5 | PSMB5 | PSMB5 | 3633 | 0.06 | 0.5 | YES |
| 21 | PSME2 | PSME2 | PSME2 | 3788 | 0.057 | 0.51 | YES |
| 22 | PSMA2 | PSMA2 | PSMA2 | 3927 | 0.055 | 0.52 | YES |
| 23 | PSMB1 | PSMB1 | PSMB1 | 4044 | 0.053 | 0.53 | YES |
| 24 | PSMC5 | PSMC5 | PSMC5 | 4128 | 0.051 | 0.55 | YES |
| 25 | PSMC2 | PSMC2 | PSMC2 | 4132 | 0.051 | 0.56 | YES |
| 26 | PSMA4 | PSMA4 | PSMA4 | 4230 | 0.05 | 0.58 | YES |
| 27 | PSMD10 | PSMD10 | PSMD10 | 4256 | 0.049 | 0.59 | YES |
| 28 | PSMB7 | PSMB7 | PSMB7 | 4259 | 0.049 | 0.61 | YES |
| 29 | PSMD2 | PSMD2 | PSMD2 | 4373 | 0.047 | 0.62 | YES |
| 30 | PSMA5 | PSMA5 | PSMA5 | 4985 | 0.039 | 0.6 | YES |
| 31 | PSMD6 | PSMD6 | PSMD6 | 5043 | 0.038 | 0.61 | YES |
| 32 | PSMB2 | PSMB2 | PSMB2 | 5081 | 0.038 | 0.62 | YES |
| 33 | PSMA1 | PSMA1 | PSMA1 | 5433 | 0.033 | 0.61 | YES |
| 34 | PSMF1 | PSMF1 | PSMF1 | 5477 | 0.032 | 0.62 | YES |
| 35 | PSMC4 | PSMC4 | PSMC4 | 5657 | 0.03 | 0.62 | YES |
| 36 | PSMB10 | PSMB10 | PSMB10 | 6021 | 0.026 | 0.61 | NO |
| 37 | PSMB8 | PSMB8 | PSMB8 | 6694 | 0.019 | 0.58 | NO |
| 38 | PSMD13 | PSMD13 | PSMD13 | 6926 | 0.017 | 0.57 | NO |
| 39 | PSMD8 | PSMD8 | PSMD8 | 7460 | 0.011 | 0.55 | NO |
| 40 | PSMC3 | PSMC3 | PSMC3 | 7604 | 0.0099 | 0.54 | NO |
| 41 | PSME1 | PSME1 | PSME1 | 7765 | 0.0081 | 0.54 | NO |
| 42 | PSMB4 | PSMB4 | PSMB4 | 8280 | 0.0028 | 0.51 | NO |
| 43 | PSMD4 | PSMD4 | PSMD4 | 8572 | -0.00038 | 0.49 | NO |
| 44 | PSMB6 | PSMB6 | PSMB6 | 9012 | -0.0046 | 0.47 | NO |
| 45 | PSMD9 | PSMD9 | PSMD9 | 9236 | -0.0071 | 0.46 | NO |
| 46 | UBA52 | UBA52 | UBA52 | 10430 | -0.02 | 0.4 | NO |
| 47 | RPS27A | RPS27A | RPS27A | 11335 | -0.03 | 0.36 | NO |
| 48 | PSMA8 | PSMA8 | PSMA8 | 12721 | -0.05 | 0.3 | NO |
Figure S35. Get High-res Image This plot shows mRNAseq_cNMF expression data heatmap (on the left) a RunningEnrichmentScore(RES) plot (on the top right) and a Signal2Noise(S2N) plot (on the bottom right) of genes in the pathway: REACTOME CROSS PRESENTATION OF SOLUBLE EXOGENOUS ANTIGENS ENDOSOMES.
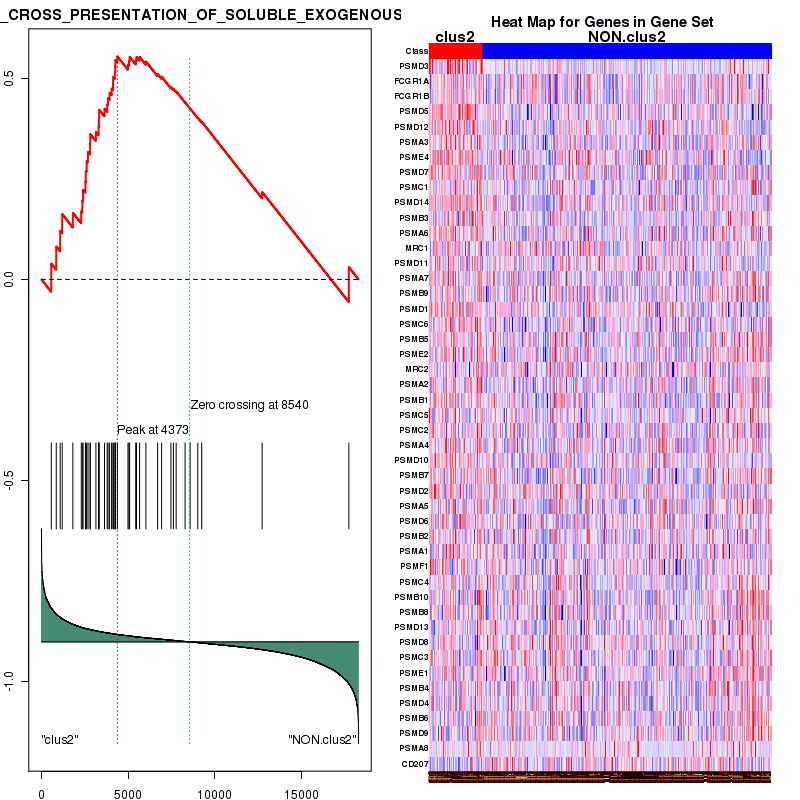
Figure S36. Get High-res Image For the top 5 core enriched genes in the pathway: REACTOME CROSS PRESENTATION OF SOLUBLE EXOGENOUS ANTIGENS ENDOSOMES, this volcano plot shows how much they are up/down-regulated and significant. The significance was calculated by empirical bayesian fit

Table S19. Get Full Table This table shows a Running Enrichment Score (RES) of each gene in this pathway, that is, the enrichment score at this point in the ranked list of genes. All genes are ranked by Signal-to-Noise (S2N), a measure of similarity as default and are used to obtain ES matrix of all genes. In this way, GSEA tool uses expression pattern of not only overlapped genes but also not-overlapped genes to produce ES matrix.
| Rank | GENE | SYMBOL | DESC | LIST.LOC | S2N | RES | CORE_ENRICHMENT |
|---|---|---|---|---|---|---|---|
| 1 | CCNE2 | CCNE2 | CCNE2 | 401 | 0.25 | 0.059 | YES |
| 2 | PSMD3 | PSMD3 | PSMD3 | 564 | 0.22 | 0.12 | YES |
| 3 | CCNE1 | CCNE1 | CCNE1 | 911 | 0.17 | 0.16 | YES |
| 4 | PSMD5 | PSMD5 | PSMD5 | 1194 | 0.15 | 0.19 | YES |
| 5 | PSMD12 | PSMD12 | PSMD12 | 1810 | 0.11 | 0.19 | YES |
| 6 | PSMA3 | PSMA3 | PSMA3 | 2293 | 0.093 | 0.2 | YES |
| 7 | PSME4 | PSME4 | PSME4 | 2353 | 0.091 | 0.22 | YES |
| 8 | PSMD7 | PSMD7 | PSMD7 | 2399 | 0.089 | 0.25 | YES |
| 9 | PSMC1 | PSMC1 | PSMC1 | 2534 | 0.085 | 0.27 | YES |
| 10 | PSMD14 | PSMD14 | PSMD14 | 2554 | 0.085 | 0.3 | YES |
| 11 | PSMB3 | PSMB3 | PSMB3 | 2605 | 0.083 | 0.32 | YES |
| 12 | PSMA6 | PSMA6 | PSMA6 | 2683 | 0.081 | 0.34 | YES |
| 13 | PSMD11 | PSMD11 | PSMD11 | 2814 | 0.078 | 0.36 | YES |
| 14 | PSMA7 | PSMA7 | PSMA7 | 3137 | 0.07 | 0.37 | YES |
| 15 | PSMB9 | PSMB9 | PSMB9 | 3292 | 0.067 | 0.38 | YES |
| 16 | PSMD1 | PSMD1 | PSMD1 | 3309 | 0.066 | 0.4 | YES |
| 17 | PSMC6 | PSMC6 | PSMC6 | 3326 | 0.066 | 0.42 | YES |
| 18 | PSMB5 | PSMB5 | PSMB5 | 3633 | 0.06 | 0.43 | YES |
| 19 | PSME2 | PSME2 | PSME2 | 3788 | 0.057 | 0.44 | YES |
| 20 | PSMA2 | PSMA2 | PSMA2 | 3927 | 0.055 | 0.45 | YES |
| 21 | PSMB1 | PSMB1 | PSMB1 | 4044 | 0.053 | 0.46 | YES |
| 22 | PSMC5 | PSMC5 | PSMC5 | 4128 | 0.051 | 0.47 | YES |
| 23 | PSMC2 | PSMC2 | PSMC2 | 4132 | 0.051 | 0.49 | YES |
| 24 | PSMA4 | PSMA4 | PSMA4 | 4230 | 0.05 | 0.5 | YES |
| 25 | PSMD10 | PSMD10 | PSMD10 | 4256 | 0.049 | 0.51 | YES |
| 26 | PSMB7 | PSMB7 | PSMB7 | 4259 | 0.049 | 0.53 | YES |
| 27 | PSMD2 | PSMD2 | PSMD2 | 4373 | 0.047 | 0.54 | YES |
| 28 | PSMA5 | PSMA5 | PSMA5 | 4985 | 0.039 | 0.52 | YES |
| 29 | PSMD6 | PSMD6 | PSMD6 | 5043 | 0.038 | 0.53 | YES |
| 30 | PSMB2 | PSMB2 | PSMB2 | 5081 | 0.038 | 0.54 | YES |
| 31 | RFWD2 | RFWD2 | RFWD2 | 5411 | 0.033 | 0.53 | YES |
| 32 | PSMA1 | PSMA1 | PSMA1 | 5433 | 0.033 | 0.54 | YES |
| 33 | PSMF1 | PSMF1 | PSMF1 | 5477 | 0.032 | 0.55 | YES |
| 34 | PSMC4 | PSMC4 | PSMC4 | 5657 | 0.03 | 0.55 | YES |
| 35 | PSMB10 | PSMB10 | PSMB10 | 6021 | 0.026 | 0.54 | NO |
| 36 | CDK2 | CDK2 | CDK2 | 6097 | 0.025 | 0.54 | NO |
| 37 | PSMB8 | PSMB8 | PSMB8 | 6694 | 0.019 | 0.52 | NO |
| 38 | PSMD13 | PSMD13 | PSMD13 | 6926 | 0.017 | 0.51 | NO |
| 39 | PSMD8 | PSMD8 | PSMD8 | 7460 | 0.011 | 0.48 | NO |
| 40 | PSMC3 | PSMC3 | PSMC3 | 7604 | 0.0099 | 0.48 | NO |
| 41 | PSME1 | PSME1 | PSME1 | 7765 | 0.0081 | 0.47 | NO |
| 42 | CDKN1A | CDKN1A | CDKN1A | 8156 | 0.0039 | 0.45 | NO |
| 43 | PSMB4 | PSMB4 | PSMB4 | 8280 | 0.0028 | 0.44 | NO |
| 44 | ATM | ATM | ATM | 8447 | 0.001 | 0.44 | NO |
| 45 | PSMD4 | PSMD4 | PSMD4 | 8572 | -0.00038 | 0.43 | NO |
| 46 | PSMB6 | PSMB6 | PSMB6 | 9012 | -0.0046 | 0.41 | NO |
| 47 | PSMD9 | PSMD9 | PSMD9 | 9236 | -0.0071 | 0.4 | NO |
| 48 | UBA52 | UBA52 | UBA52 | 10430 | -0.02 | 0.34 | NO |
| 49 | RPS27A | RPS27A | RPS27A | 11335 | -0.03 | 0.3 | NO |
| 50 | TP53 | TP53 | TP53 | 12514 | -0.046 | 0.25 | NO |
| 51 | PSMA8 | PSMA8 | PSMA8 | 12721 | -0.05 | 0.25 | NO |
| 52 | MDM2 | MDM2 | MDM2 | 13009 | -0.054 | 0.26 | NO |
| 53 | CDKN1B | CDKN1B | CDKN1B | 15055 | -0.1 | 0.18 | NO |
Figure S37. Get High-res Image This plot shows mRNAseq_cNMF expression data heatmap (on the left) a RunningEnrichmentScore(RES) plot (on the top right) and a Signal2Noise(S2N) plot (on the bottom right) of genes in the pathway: REACTOME ANTIGEN PROCESSING CROSS PRESENTATION.

Figure S38. Get High-res Image For the top 5 core enriched genes in the pathway: REACTOME ANTIGEN PROCESSING CROSS PRESENTATION, this volcano plot shows how much they are up/down-regulated and significant. The significance was calculated by empirical bayesian fit
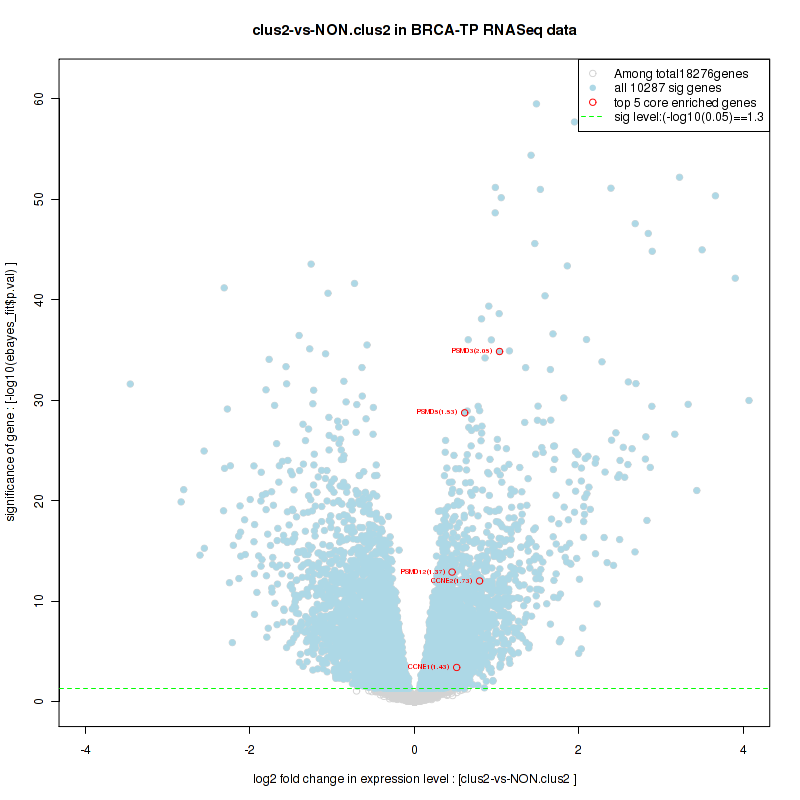
Table S20. Get Full Table This table shows a Running Enrichment Score (RES) of each gene in this pathway, that is, the enrichment score at this point in the ranked list of genes. All genes are ranked by Signal-to-Noise (S2N), a measure of similarity as default and are used to obtain ES matrix of all genes. In this way, GSEA tool uses expression pattern of not only overlapped genes but also not-overlapped genes to produce ES matrix.
| Rank | GENE | SYMBOL | DESC | LIST.LOC | S2N | RES | CORE_ENRICHMENT |
|---|---|---|---|---|---|---|---|
| 1 | PSMD3 | PSMD3 | PSMD3 | 564 | 0.22 | 0.03 | YES |
| 2 | UBE2C | UBE2C | UBE2C | 1085 | 0.16 | 0.046 | YES |
| 3 | PSMD5 | PSMD5 | PSMD5 | 1194 | 0.15 | 0.081 | YES |
| 4 | CDK1 | CDK1 | CDK1 | 1353 | 0.14 | 0.11 | YES |
| 5 | BUB1B | BUB1B | BUB1B | 1455 | 0.13 | 0.14 | YES |
| 6 | PTTG1 | PTTG1 | PTTG1 | 1744 | 0.11 | 0.16 | YES |
| 7 | CDC20 | CDC20 | CDC20 | 1785 | 0.11 | 0.19 | YES |
| 8 | PSMD12 | PSMD12 | PSMD12 | 1810 | 0.11 | 0.22 | YES |
| 9 | CCNB1 | CCNB1 | CCNB1 | 1865 | 0.11 | 0.25 | YES |
| 10 | PSMA3 | PSMA3 | PSMA3 | 2293 | 0.093 | 0.25 | YES |
| 11 | PSME4 | PSME4 | PSME4 | 2353 | 0.091 | 0.27 | YES |
| 12 | PSMD7 | PSMD7 | PSMD7 | 2399 | 0.089 | 0.3 | YES |
| 13 | PSMC1 | PSMC1 | PSMC1 | 2534 | 0.085 | 0.31 | YES |
| 14 | PSMD14 | PSMD14 | PSMD14 | 2554 | 0.085 | 0.34 | YES |
| 15 | PSMB3 | PSMB3 | PSMB3 | 2605 | 0.083 | 0.36 | YES |
| 16 | PSMA6 | PSMA6 | PSMA6 | 2683 | 0.081 | 0.38 | YES |
| 17 | MAD2L1 | MAD2L1 | MAD2L1 | 2744 | 0.08 | 0.39 | YES |
| 18 | PSMD11 | PSMD11 | PSMD11 | 2814 | 0.078 | 0.41 | YES |
| 19 | UBE2D1 | UBE2D1 | UBE2D1 | 2840 | 0.078 | 0.43 | YES |
| 20 | PSMA7 | PSMA7 | PSMA7 | 3137 | 0.07 | 0.44 | YES |
| 21 | PSMB9 | PSMB9 | PSMB9 | 3292 | 0.067 | 0.45 | YES |
| 22 | PSMD1 | PSMD1 | PSMD1 | 3309 | 0.066 | 0.46 | YES |
| 23 | PSMC6 | PSMC6 | PSMC6 | 3326 | 0.066 | 0.48 | YES |
| 24 | PSMB5 | PSMB5 | PSMB5 | 3633 | 0.06 | 0.48 | YES |
| 25 | PSME2 | PSME2 | PSME2 | 3788 | 0.057 | 0.49 | YES |
| 26 | PSMA2 | PSMA2 | PSMA2 | 3927 | 0.055 | 0.5 | YES |
| 27 | PSMB1 | PSMB1 | PSMB1 | 4044 | 0.053 | 0.51 | YES |
| 28 | PSMC5 | PSMC5 | PSMC5 | 4128 | 0.051 | 0.52 | YES |
| 29 | PSMC2 | PSMC2 | PSMC2 | 4132 | 0.051 | 0.53 | YES |
| 30 | PSMA4 | PSMA4 | PSMA4 | 4230 | 0.05 | 0.54 | YES |
| 31 | PSMD10 | PSMD10 | PSMD10 | 4256 | 0.049 | 0.55 | YES |
| 32 | PSMB7 | PSMB7 | PSMB7 | 4259 | 0.049 | 0.57 | YES |
| 33 | PSMD2 | PSMD2 | PSMD2 | 4373 | 0.047 | 0.57 | YES |
| 34 | CDC26 | CDC26 | CDC26 | 4833 | 0.041 | 0.56 | YES |
| 35 | PSMA5 | PSMA5 | PSMA5 | 4985 | 0.039 | 0.56 | YES |
| 36 | PSMD6 | PSMD6 | PSMD6 | 5043 | 0.038 | 0.57 | YES |
| 37 | PSMB2 | PSMB2 | PSMB2 | 5081 | 0.038 | 0.58 | YES |
| 38 | PSMA1 | PSMA1 | PSMA1 | 5433 | 0.033 | 0.57 | NO |
| 39 | PSMF1 | PSMF1 | PSMF1 | 5477 | 0.032 | 0.58 | NO |
| 40 | PSMC4 | PSMC4 | PSMC4 | 5657 | 0.03 | 0.57 | NO |
| 41 | PSMB10 | PSMB10 | PSMB10 | 6021 | 0.026 | 0.56 | NO |
| 42 | ANAPC7 | ANAPC7 | ANAPC7 | 6560 | 0.02 | 0.54 | NO |
| 43 | PSMB8 | PSMB8 | PSMB8 | 6694 | 0.019 | 0.54 | NO |
| 44 | PSMD13 | PSMD13 | PSMD13 | 6926 | 0.017 | 0.53 | NO |
| 45 | PSMD8 | PSMD8 | PSMD8 | 7460 | 0.011 | 0.5 | NO |
| 46 | ANAPC1 | ANAPC1 | ANAPC1 | 7526 | 0.011 | 0.5 | NO |
| 47 | PSMC3 | PSMC3 | PSMC3 | 7604 | 0.0099 | 0.5 | NO |
| 48 | UBE2E1 | UBE2E1 | UBE2E1 | 7718 | 0.0086 | 0.5 | NO |
| 49 | PSME1 | PSME1 | PSME1 | 7765 | 0.0081 | 0.5 | NO |
| 50 | CDC23 | CDC23 | CDC23 | 7774 | 0.0081 | 0.5 | NO |
| 51 | BUB3 | BUB3 | BUB3 | 8144 | 0.004 | 0.48 | NO |
| 52 | PSMB4 | PSMB4 | PSMB4 | 8280 | 0.0028 | 0.47 | NO |
| 53 | PSMD4 | PSMD4 | PSMD4 | 8572 | -0.00038 | 0.46 | NO |
| 54 | ANAPC10 | ANAPC10 | ANAPC10 | 8764 | -0.0024 | 0.45 | NO |
| 55 | PSMB6 | PSMB6 | PSMB6 | 9012 | -0.0046 | 0.44 | NO |
| 56 | PSMD9 | PSMD9 | PSMD9 | 9236 | -0.0071 | 0.42 | NO |
| 57 | ANAPC2 | ANAPC2 | ANAPC2 | 9395 | -0.0088 | 0.42 | NO |
| 58 | ANAPC11 | ANAPC11 | ANAPC11 | 9719 | -0.012 | 0.4 | NO |
| 59 | ANAPC5 | ANAPC5 | ANAPC5 | 9905 | -0.014 | 0.4 | NO |
| 60 | UBA52 | UBA52 | UBA52 | 10430 | -0.02 | 0.38 | NO |
| 61 | CDC16 | CDC16 | CDC16 | 10883 | -0.025 | 0.36 | NO |
| 62 | RPS27A | RPS27A | RPS27A | 11335 | -0.03 | 0.34 | NO |
| 63 | CDC27 | CDC27 | CDC27 | 11403 | -0.031 | 0.35 | NO |
| 64 | PSMA8 | PSMA8 | PSMA8 | 12721 | -0.05 | 0.29 | NO |
| 65 | ANAPC4 | ANAPC4 | ANAPC4 | 13444 | -0.062 | 0.26 | NO |
Figure S39. Get High-res Image This plot shows mRNAseq_cNMF expression data heatmap (on the left) a RunningEnrichmentScore(RES) plot (on the top right) and a Signal2Noise(S2N) plot (on the bottom right) of genes in the pathway: REACTOME ER PHAGOSOME PATHWAY.
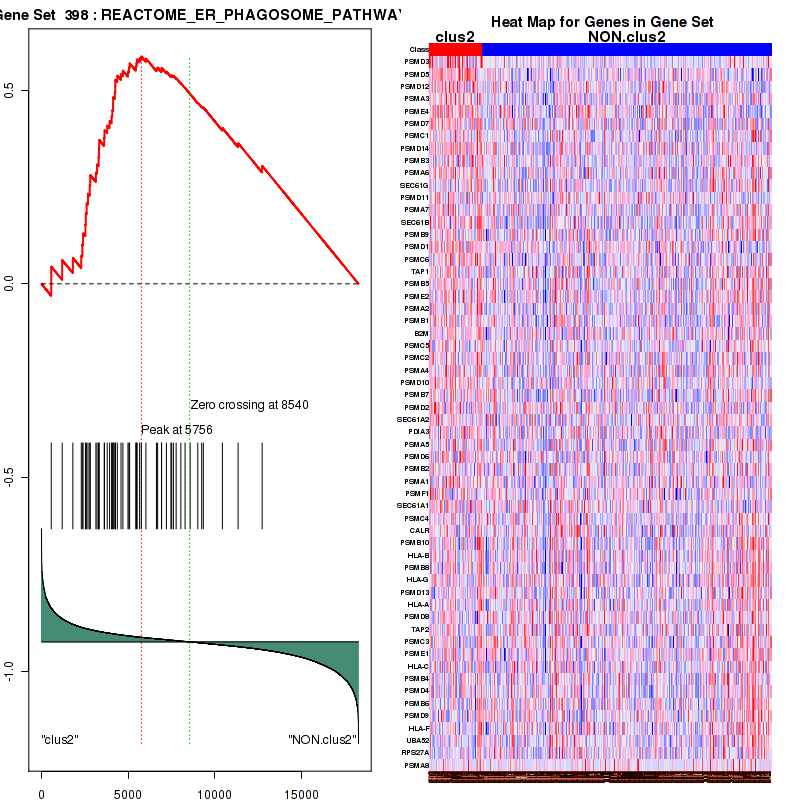
Figure S40. Get High-res Image For the top 5 core enriched genes in the pathway: REACTOME ER PHAGOSOME PATHWAY, this volcano plot shows how much they are up/down-regulated and significant. The significance was calculated by empirical bayesian fit
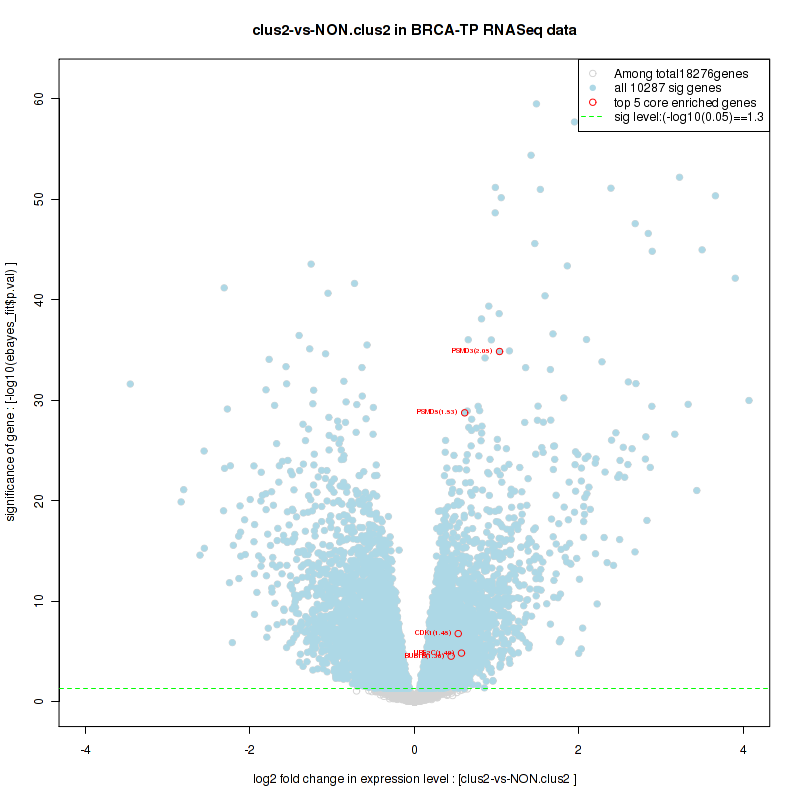
For the top enriched genes, if you want to check whether they are
-
up-regulated, please check the list of up-regulated genes
-
down-regulated, please check the list of down-regulated genes
For the top enriched genes, if you want to check whether they are
-
highly expressed genes, please check the list of high (top 30%) expressed genes
-
low expressed genes, please check the list of low (bottom 30%) expressed genes
An expression pattern of top(30%)/middle(30%)/low(30%) in this subtype against other subtypes is available in a heatmap
For the top enriched genes, if you want to check whether they are
-
significantly differently expressed genes by eBayes lm fit, please check the list of significant genes
Table 5. Get Full Table This table shows top 10 pathways which are significantly enriched in cluster clus3. It displays only significant gene sets satisfying nom.p.val.threshold (-1), fwer.p.val.threshold (-1) , fdr.q.val.threshold (0.25) and the default table is sorted by Normalized Enrichment Score (NES). Further details on NES statistics, please visit The Broad GSEA website.
| GeneSet(GS) | Size(#genes) | genes.ES.table | ES | NES | NOM.p.val | FDR.q.val | FWER.p.val | Tag.. | Gene.. | Signal | FDR..median. | glob.p.val |
|---|---|---|---|---|---|---|---|---|---|---|---|---|
| KEGG FATTY ACID METABOLISM | 39 | genes.ES.table | 0.59 | 1.8 | 0 | 0.11 | 0.57 | 0.38 | 0.24 | 0.29 | 0.031 | 0.015 |
| KEGG STEROID HORMONE BIOSYNTHESIS | 41 | genes.ES.table | 0.57 | 1.4 | 0.076 | 0.22 | 1 | 0.63 | 0.29 | 0.45 | 0.16 | 0.002 |
| KEGG PURINE METABOLISM | 153 | genes.ES.table | 0.39 | 1.7 | 0.0021 | 0.13 | 0.85 | 0.18 | 0.17 | 0.15 | 0.053 | 0.01 |
| KEGG TYROSINE METABOLISM | 40 | genes.ES.table | 0.63 | 1.7 | 0.008 | 0.13 | 0.88 | 0.35 | 0.091 | 0.32 | 0.058 | 0.007 |
| KEGG O GLYCAN BIOSYNTHESIS | 28 | genes.ES.table | 0.57 | 1.5 | 0.033 | 0.17 | 0.98 | 0.46 | 0.24 | 0.36 | 0.11 | 0.001 |
| KEGG INOSITOL PHOSPHATE METABOLISM | 53 | genes.ES.table | 0.37 | 1.4 | 0.075 | 0.23 | 1 | 0.26 | 0.25 | 0.2 | 0.17 | 0.001 |
| KEGG GLYCEROPHOSPHOLIPID METABOLISM | 71 | genes.ES.table | 0.49 | 1.8 | 0 | 0.11 | 0.56 | 0.44 | 0.3 | 0.3 | 0.03 | 0.017 |
| KEGG ETHER LIPID METABOLISM | 28 | genes.ES.table | 0.52 | 1.5 | 0.052 | 0.18 | 0.99 | 0.57 | 0.3 | 0.4 | 0.12 | 0.001 |
| KEGG ARACHIDONIC ACID METABOLISM | 50 | genes.ES.table | 0.54 | 1.4 | 0.05 | 0.2 | 1 | 0.54 | 0.26 | 0.4 | 0.13 | 0.001 |
| KEGG BUTANOATE METABOLISM | 30 | genes.ES.table | 0.51 | 1.5 | 0.059 | 0.19 | 0.99 | 0.33 | 0.24 | 0.25 | 0.12 | 0.001 |
Table S21. Get Full Table This table shows a Running Enrichment Score (RES) of each gene in this pathway, that is, the enrichment score at this point in the ranked list of genes. All genes are ranked by Signal-to-Noise (S2N), a measure of similarity as default and are used to obtain ES matrix of all genes. In this way, GSEA tool uses expression pattern of not only overlapped genes but also not-overlapped genes to produce ES matrix.
| Rank | GENE | SYMBOL | DESC | LIST.LOC | S2N | RES | CORE_ENRICHMENT |
|---|---|---|---|---|---|---|---|
| 1 | GFAP | GFAP | GFAP | 18 | 0.85 | 0.089 | YES |
| 2 | NRG1 | NRG1 | NRG1 | 94 | 0.7 | 0.16 | YES |
| 3 | NRG2 | NRG2 | NRG2 | 253 | 0.55 | 0.21 | YES |
| 4 | PGR | PGR | PGR | 549 | 0.44 | 0.24 | YES |
| 5 | EGFR | EGFR | EGFR | 662 | 0.41 | 0.28 | YES |
| 6 | S100B | S100B | S100B | 999 | 0.35 | 0.3 | YES |
| 7 | ERBB4 | ERBB4 | ERBB4 | 1109 | 0.33 | 0.32 | YES |
| 8 | EGF | EGF | EGF | 1694 | 0.26 | 0.32 | YES |
| 9 | EREG | EREG | EREG | 1695 | 0.26 | 0.35 | YES |
| 10 | CXCL12 | CXCL12 | CXCL12 | 1996 | 0.24 | 0.36 | YES |
| 11 | AKT3 | AKT3 | AKT3 | 2006 | 0.24 | 0.38 | YES |
| 12 | FOXO1 | FOXO1 | FOXO1 | 2015 | 0.24 | 0.41 | YES |
| 13 | GHR | GHR | GHR | 2059 | 0.24 | 0.43 | YES |
| 14 | NR4A1 | NR4A1 | NR4A1 | 2213 | 0.22 | 0.44 | YES |
| 15 | PIK3R1 | PIK3R1 | PIK3R1 | 2460 | 0.21 | 0.45 | YES |
| 16 | ESR1 | ESR1 | ESR1 | 2807 | 0.19 | 0.45 | YES |
| 17 | FOXO4 | FOXO4 | FOXO4 | 3250 | 0.16 | 0.45 | YES |
| 18 | GH1 | GH1 | GH1 | 3416 | 0.16 | 0.45 | YES |
| 19 | NEDD4 | NEDD4 | NEDD4 | 3857 | 0.14 | 0.44 | YES |
| 20 | STAT5A | STAT5A | STAT5A | 3932 | 0.14 | 0.46 | YES |
| 21 | HBEGF | HBEGF | HBEGF | 3950 | 0.14 | 0.47 | YES |
| 22 | YAP1 | YAP1 | YAP1 | 3961 | 0.14 | 0.48 | YES |
| 23 | APH1B | APH1B | APH1B | 3995 | 0.13 | 0.5 | YES |
| 24 | BTC | BTC | BTC | 4418 | 0.12 | 0.48 | YES |
| 25 | STAT5B | STAT5B | STAT5B | 4441 | 0.12 | 0.5 | YES |
| 26 | JAK2 | JAK2 | JAK2 | 4537 | 0.12 | 0.5 | YES |
| 27 | PRLR | PRLR | PRLR | 4864 | 0.1 | 0.5 | NO |
| 28 | FOXO3 | FOXO3 | FOXO3 | 5512 | 0.086 | 0.47 | NO |
| 29 | RICTOR | RICTOR | RICTOR | 5990 | 0.076 | 0.45 | NO |
| 30 | BTRC | BTRC | BTRC | 6249 | 0.07 | 0.44 | NO |
| 31 | PTEN | PTEN | PTEN | 6361 | 0.068 | 0.45 | NO |
| 32 | CASP9 | CASP9 | CASP9 | 6428 | 0.067 | 0.45 | NO |
| 33 | CDKN1B | CDKN1B | CDKN1B | 6544 | 0.065 | 0.45 | NO |
| 34 | ERBB3 | ERBB3 | ERBB3 | 6649 | 0.063 | 0.45 | NO |
| 35 | CREB1 | CREB1 | CREB1 | 7195 | 0.053 | 0.43 | NO |
| 36 | CDKN1A | CDKN1A | CDKN1A | 7488 | 0.048 | 0.42 | NO |
| 37 | PIK3CA | PIK3CA | PIK3CA | 7603 | 0.047 | 0.41 | NO |
| 38 | WWP1 | WWP1 | WWP1 | 7620 | 0.046 | 0.42 | NO |
| 39 | NCOR1 | NCOR1 | NCOR1 | 7632 | 0.046 | 0.42 | NO |
| 40 | PHLPP1 | PHLPP1 | PHLPP1 | 8131 | 0.038 | 0.4 | NO |
| 41 | ADAM17 | ADAM17 | ADAM17 | 8389 | 0.034 | 0.39 | NO |
| 42 | RPS27A | RPS27A | RPS27A | 8555 | 0.032 | 0.38 | NO |
| 43 | TAB2 | TAB2 | TAB2 | 8616 | 0.031 | 0.38 | NO |
| 44 | PDPK1 | PDPK1 | PDPK1 | 8838 | 0.028 | 0.37 | NO |
| 45 | MTOR | MTOR | MTOR | 9043 | 0.026 | 0.37 | NO |
| 46 | SHC1 | SHC1 | SHC1 | 9127 | 0.024 | 0.36 | NO |
| 47 | SKP1 | SKP1 | SKP1 | 9199 | 0.024 | 0.36 | NO |
| 48 | SH2B1 | SH2B1 | SH2B1 | 9406 | 0.021 | 0.35 | NO |
| 49 | PSEN1 | PSEN1 | PSEN1 | 9697 | 0.018 | 0.34 | NO |
| 50 | THEM4 | THEM4 | THEM4 | 10129 | 0.012 | 0.32 | NO |
| 51 | TSC2 | TSC2 | TSC2 | 10208 | 0.011 | 0.31 | NO |
| 52 | SOS1 | SOS1 | SOS1 | 10229 | 0.011 | 0.31 | NO |
| 53 | MAPK1 | MAPK1 | MAPK1 | 10356 | 0.0092 | 0.31 | NO |
| 54 | BAD | BAD | BAD | 10804 | 0.004 | 0.28 | NO |
| 55 | AKT2 | AKT2 | AKT2 | 10984 | 0.0022 | 0.27 | NO |
| 56 | MAPK3 | MAPK3 | MAPK3 | 11179 | -0.00013 | 0.26 | NO |
| 57 | MDM2 | MDM2 | MDM2 | 11185 | -0.00018 | 0.26 | NO |
| 58 | WWOX | WWOX | WWOX | 11421 | -0.0031 | 0.25 | NO |
| 59 | NRAS | NRAS | NRAS | 11512 | -0.0041 | 0.25 | NO |
| 60 | MAPKAP1 | MAPKAP1 | MAPKAP1 | 11721 | -0.0066 | 0.24 | NO |
| 61 | GRB2 | GRB2 | GRB2 | 12115 | -0.012 | 0.22 | NO |
| 62 | RAF1 | RAF1 | RAF1 | 12270 | -0.014 | 0.21 | NO |
| 63 | UBA52 | UBA52 | UBA52 | 12325 | -0.014 | 0.21 | NO |
| 64 | AKT1 | AKT1 | AKT1 | 12363 | -0.015 | 0.21 | NO |
| 65 | CHUK | CHUK | CHUK | 12459 | -0.016 | 0.2 | NO |
| 66 | MAP2K2 | MAP2K2 | MAP2K2 | 12523 | -0.017 | 0.2 | NO |
| 67 | KRAS | KRAS | KRAS | 12738 | -0.02 | 0.19 | NO |
| 68 | PRL | PRL | PRL | 12782 | -0.02 | 0.19 | NO |
| 69 | CUL1 | CUL1 | CUL1 | 12930 | -0.022 | 0.18 | NO |
| 70 | YWHAB | YWHAB | YWHAB | 12933 | -0.022 | 0.19 | NO |
| 71 | NCSTN | NCSTN | NCSTN | 13003 | -0.023 | 0.19 | NO |
| 72 | AKT1S1 | AKT1S1 | AKT1S1 | 13211 | -0.026 | 0.18 | NO |
| 73 | APH1A | APH1A | APH1A | 13493 | -0.03 | 0.16 | NO |
| 74 | GSK3A | GSK3A | GSK3A | 13784 | -0.035 | 0.15 | NO |
| 75 | PSEN2 | PSEN2 | PSEN2 | 14077 | -0.039 | 0.14 | NO |
| 76 | TRIB3 | TRIB3 | TRIB3 | 14364 | -0.043 | 0.13 | NO |
| 77 | MAP2K1 | MAP2K1 | MAP2K1 | 14607 | -0.048 | 0.12 | NO |
| 78 | NRG4 | NRG4 | NRG4 | 14668 | -0.049 | 0.12 | NO |
| 79 | PSENEN | PSENEN | PSENEN | 14912 | -0.053 | 0.12 | NO |
| 80 | MLST8 | MLST8 | MLST8 | 15131 | -0.056 | 0.11 | NO |
| 81 | HRAS | HRAS | HRAS | 16142 | -0.081 | 0.062 | NO |
| 82 | RBX1 | RBX1 | RBX1 | 16161 | -0.082 | 0.07 | NO |
| 83 | RPS6KB2 | RPS6KB2 | RPS6KB2 | 16368 | -0.089 | 0.068 | NO |
| 84 | CDK1 | CDK1 | CDK1 | 18137 | -0.34 | 0.0076 | NO |
Figure S41. Get High-res Image This plot shows mRNAseq_cNMF expression data heatmap (on the left) a RunningEnrichmentScore(RES) plot (on the top right) and a Signal2Noise(S2N) plot (on the bottom right) of genes in the pathway: KEGG FATTY ACID METABOLISM.
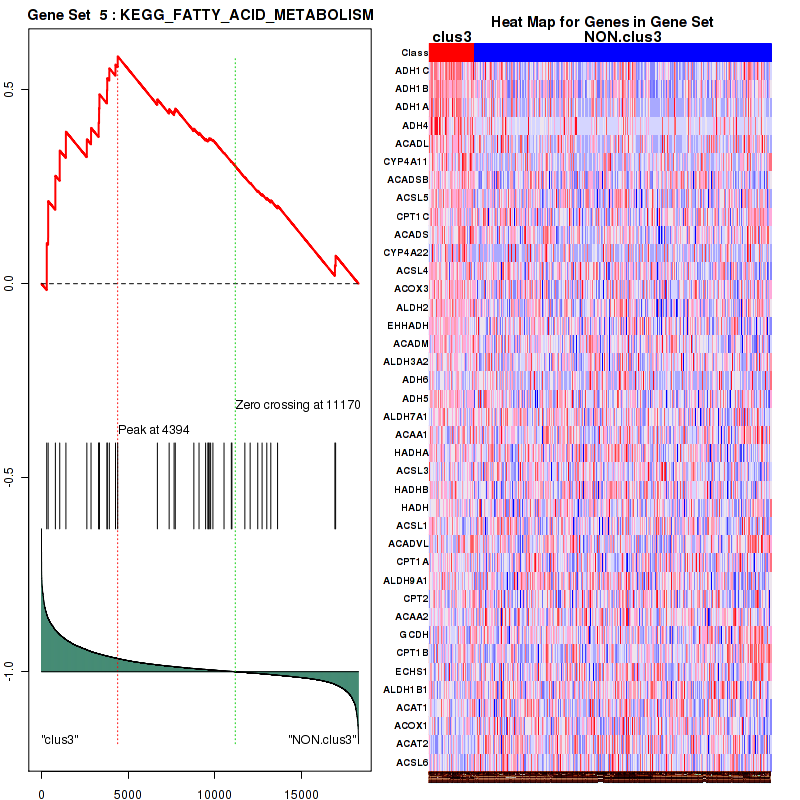
Figure S42. Get High-res Image For the top 5 core enriched genes in the pathway: KEGG FATTY ACID METABOLISM, this volcano plot shows how much they are up/down-regulated and significant. The significance was calculated by empirical bayesian fit
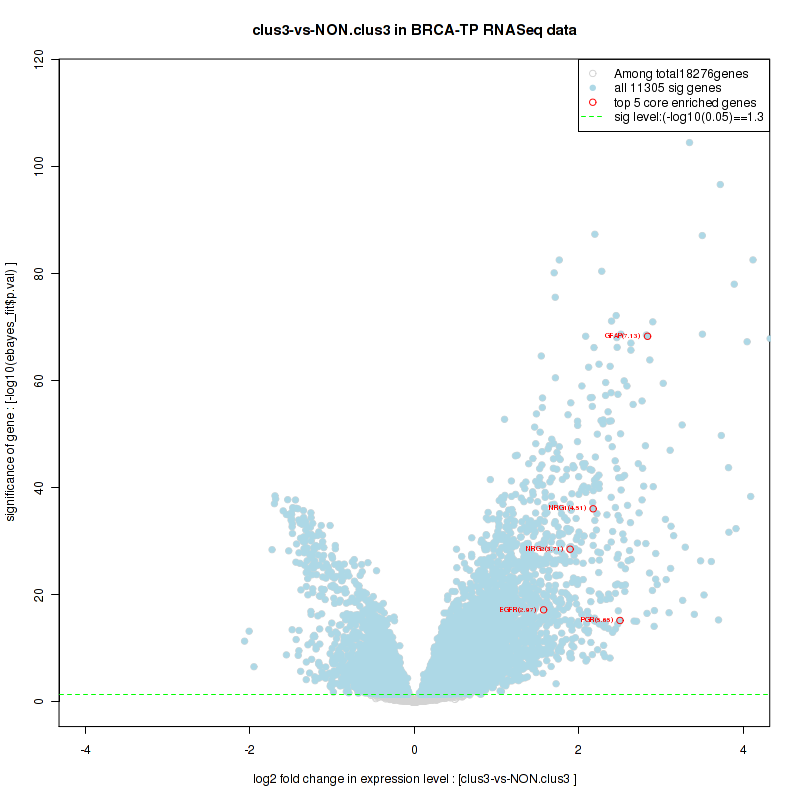
Table S22. Get Full Table This table shows a Running Enrichment Score (RES) of each gene in this pathway, that is, the enrichment score at this point in the ranked list of genes. All genes are ranked by Signal-to-Noise (S2N), a measure of similarity as default and are used to obtain ES matrix of all genes. In this way, GSEA tool uses expression pattern of not only overlapped genes but also not-overlapped genes to produce ES matrix.
| Rank | GENE | SYMBOL | DESC | LIST.LOC | S2N | RES | CORE_ENRICHMENT |
|---|---|---|---|---|---|---|---|
| 1 | PAK7 | PAK7 | PAK7 | 2 | 1.3 | 0.38 | YES |
| 2 | SLIT2 | SLIT2 | SLIT2 | 557 | 0.44 | 0.49 | YES |
| 3 | ROBO3 | ROBO3 | ROBO3 | 559 | 0.43 | 0.62 | YES |
| 4 | CAP2 | CAP2 | CAP2 | 4339 | 0.12 | 0.45 | NO |
| 5 | SRGAP3 | SRGAP3 | SRGAP3 | 5012 | 0.1 | 0.44 | NO |
| 6 | EVL | EVL | EVL | 5077 | 0.098 | 0.47 | NO |
| 7 | ROBO1 | ROBO1 | ROBO1 | 5099 | 0.098 | 0.5 | NO |
| 8 | SOS2 | SOS2 | SOS2 | 6199 | 0.072 | 0.46 | NO |
| 9 | GPC1 | GPC1 | GPC1 | 6282 | 0.07 | 0.48 | NO |
| 10 | ABL1 | ABL1 | ABL1 | 6357 | 0.068 | 0.5 | NO |
| 11 | PAK6 | PAK6 | PAK6 | 6807 | 0.06 | 0.49 | NO |
| 12 | NCK2 | NCK2 | NCK2 | 8356 | 0.035 | 0.42 | NO |
| 13 | SRGAP1 | SRGAP1 | SRGAP1 | 8417 | 0.034 | 0.42 | NO |
| 14 | ROBO2 | ROBO2 | ROBO2 | 8574 | 0.032 | 0.42 | NO |
| 15 | CDC42 | CDC42 | CDC42 | 9207 | 0.023 | 0.4 | NO |
| 16 | CLASP1 | CLASP1 | CLASP1 | 9318 | 0.022 | 0.4 | NO |
| 17 | ABL2 | ABL2 | ABL2 | 9721 | 0.017 | 0.38 | NO |
| 18 | SOS1 | SOS1 | SOS1 | 10229 | 0.011 | 0.36 | NO |
| 19 | ENAH | ENAH | ENAH | 10728 | 0.0048 | 0.33 | NO |
| 20 | CAP1 | CAP1 | CAP1 | 10794 | 0.0041 | 0.33 | NO |
| 21 | VASP | VASP | VASP | 11676 | -0.0062 | 0.28 | NO |
| 22 | NCK1 | NCK1 | NCK1 | 11706 | -0.0064 | 0.28 | NO |
| 23 | PAK2 | PAK2 | PAK2 | 12225 | -0.013 | 0.26 | NO |
| 24 | RAC1 | RAC1 | RAC1 | 12462 | -0.016 | 0.25 | NO |
| 25 | PAK4 | PAK4 | PAK4 | 13228 | -0.026 | 0.22 | NO |
| 26 | PAK1 | PAK1 | PAK1 | 13459 | -0.03 | 0.21 | NO |
| 27 | SRGAP2 | SRGAP2 | SRGAP2 | 14789 | -0.05 | 0.16 | NO |
| 28 | PFN2 | PFN2 | PFN2 | 14870 | -0.052 | 0.17 | NO |
| 29 | PFN1 | PFN1 | PFN1 | 15607 | -0.066 | 0.15 | NO |
Figure S43. Get High-res Image This plot shows mRNAseq_cNMF expression data heatmap (on the left) a RunningEnrichmentScore(RES) plot (on the top right) and a Signal2Noise(S2N) plot (on the bottom right) of genes in the pathway: KEGG STEROID HORMONE BIOSYNTHESIS.
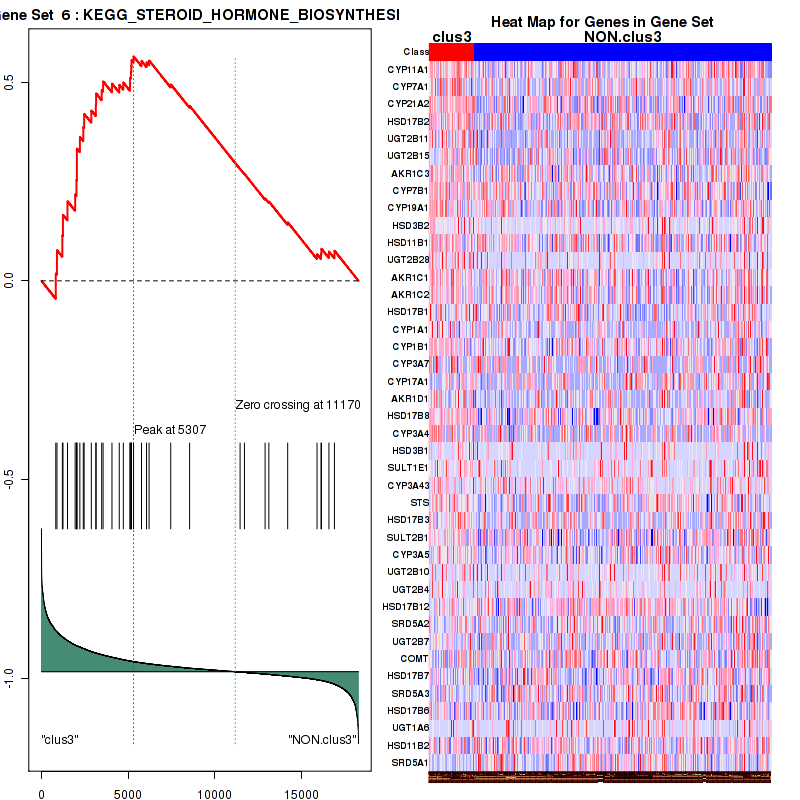
Figure S44. Get High-res Image For the top 5 core enriched genes in the pathway: KEGG STEROID HORMONE BIOSYNTHESIS, this volcano plot shows how much they are up/down-regulated and significant. The significance was calculated by empirical bayesian fit

Table S23. Get Full Table This table shows a Running Enrichment Score (RES) of each gene in this pathway, that is, the enrichment score at this point in the ranked list of genes. All genes are ranked by Signal-to-Noise (S2N), a measure of similarity as default and are used to obtain ES matrix of all genes. In this way, GSEA tool uses expression pattern of not only overlapped genes but also not-overlapped genes to produce ES matrix.
| Rank | GENE | SYMBOL | DESC | LIST.LOC | S2N | RES | CORE_ENRICHMENT |
|---|---|---|---|---|---|---|---|
| 1 | PAK7 | PAK7 | PAK7 | 2 | 1.3 | 0.18 | YES |
| 2 | FIGF | FIGF | FIGF | 306 | 0.52 | 0.23 | YES |
| 3 | PAK3 | PAK3 | PAK3 | 367 | 0.49 | 0.3 | YES |
| 4 | HGF | HGF | HGF | 524 | 0.44 | 0.35 | YES |
| 5 | MET | MET | MET | 867 | 0.37 | 0.38 | YES |
| 6 | TGFB2 | TGFB2 | TGFB2 | 1427 | 0.29 | 0.39 | YES |
| 7 | TGFB3 | TGFB3 | TGFB3 | 1768 | 0.26 | 0.41 | YES |
| 8 | AKT3 | AKT3 | AKT3 | 2006 | 0.24 | 0.43 | YES |
| 9 | PIK3R1 | PIK3R1 | PIK3R1 | 2460 | 0.21 | 0.44 | YES |
| 10 | PIK3CG | PIK3CG | PIK3CG | 2960 | 0.18 | 0.43 | YES |
| 11 | VEGFC | VEGFC | VEGFC | 3217 | 0.17 | 0.44 | YES |
| 12 | PGF | PGF | PGF | 3291 | 0.16 | 0.46 | YES |
| 13 | EPAS1 | EPAS1 | EPAS1 | 3452 | 0.16 | 0.48 | YES |
| 14 | PIK3CD | PIK3CD | PIK3CD | 3458 | 0.16 | 0.5 | YES |
| 15 | JUN | JUN | JUN | 3526 | 0.15 | 0.51 | YES |
| 16 | ETS1 | ETS1 | ETS1 | 3938 | 0.14 | 0.51 | NO |
| 17 | TGFA | TGFA | TGFA | 4468 | 0.12 | 0.5 | NO |
| 18 | GAB1 | GAB1 | GAB1 | 4671 | 0.11 | 0.5 | NO |
| 19 | TGFB1 | TGFB1 | TGFB1 | 5927 | 0.077 | 0.44 | NO |
| 20 | SOS2 | SOS2 | SOS2 | 6199 | 0.072 | 0.44 | NO |
| 21 | PAK6 | PAK6 | PAK6 | 6807 | 0.06 | 0.42 | NO |
| 22 | FLCN | FLCN | FLCN | 6928 | 0.058 | 0.42 | NO |
| 23 | CREBBP | CREBBP | CREBBP | 7238 | 0.052 | 0.41 | NO |
| 24 | RAPGEF1 | RAPGEF1 | RAPGEF1 | 7252 | 0.052 | 0.41 | NO |
| 25 | PIK3CA | PIK3CA | PIK3CA | 7603 | 0.047 | 0.4 | NO |
| 26 | CRK | CRK | CRK | 7745 | 0.044 | 0.4 | NO |
| 27 | EP300 | EP300 | EP300 | 8058 | 0.039 | 0.39 | NO |
| 28 | ARNT2 | ARNT2 | ARNT2 | 8081 | 0.039 | 0.39 | NO |
| 29 | ARNT | ARNT | ARNT | 8460 | 0.033 | 0.38 | NO |
| 30 | PIK3R5 | PIK3R5 | PIK3R5 | 8967 | 0.026 | 0.35 | NO |
| 31 | PIK3R3 | PIK3R3 | PIK3R3 | 9088 | 0.025 | 0.35 | NO |
| 32 | CDC42 | CDC42 | CDC42 | 9207 | 0.023 | 0.34 | NO |
| 33 | EGLN3 | EGLN3 | EGLN3 | 9791 | 0.016 | 0.32 | NO |
| 34 | VHL | VHL | VHL | 9823 | 0.016 | 0.32 | NO |
| 35 | RAP1A | RAP1A | RAP1A | 10087 | 0.012 | 0.3 | NO |
| 36 | SOS1 | SOS1 | SOS1 | 10229 | 0.011 | 0.3 | NO |
| 37 | VEGFB | VEGFB | VEGFB | 10330 | 0.0094 | 0.29 | NO |
| 38 | MAPK1 | MAPK1 | MAPK1 | 10356 | 0.0092 | 0.29 | NO |
| 39 | RAP1B | RAP1B | RAP1B | 10462 | 0.0079 | 0.29 | NO |
| 40 | BRAF | BRAF | BRAF | 10508 | 0.0072 | 0.29 | NO |
| 41 | PDGFB | PDGFB | PDGFB | 10788 | 0.0042 | 0.27 | NO |
| 42 | ARAF | ARAF | ARAF | 10940 | 0.0027 | 0.26 | NO |
| 43 | AKT2 | AKT2 | AKT2 | 10984 | 0.0022 | 0.26 | NO |
| 44 | PIK3R2 | PIK3R2 | PIK3R2 | 11037 | 0.0017 | 0.26 | NO |
| 45 | CRKL | CRKL | CRKL | 11176 | -0.000069 | 0.25 | NO |
| 46 | MAPK3 | MAPK3 | MAPK3 | 11179 | -0.00013 | 0.25 | NO |
| 47 | NRAS | NRAS | NRAS | 11512 | -0.0041 | 0.23 | NO |
| 48 | HIF1A | HIF1A | HIF1A | 11868 | -0.009 | 0.22 | NO |
| 49 | GRB2 | GRB2 | GRB2 | 12115 | -0.012 | 0.2 | NO |
| 50 | PAK2 | PAK2 | PAK2 | 12225 | -0.013 | 0.2 | NO |
| 51 | PTPN11 | PTPN11 | PTPN11 | 12242 | -0.013 | 0.2 | NO |
| 52 | RAF1 | RAF1 | RAF1 | 12270 | -0.014 | 0.2 | NO |
| 53 | EGLN2 | EGLN2 | EGLN2 | 12289 | -0.014 | 0.2 | NO |
| 54 | AKT1 | AKT1 | AKT1 | 12363 | -0.015 | 0.2 | NO |
| 55 | RAC1 | RAC1 | RAC1 | 12462 | -0.016 | 0.2 | NO |
| 56 | MAP2K2 | MAP2K2 | MAP2K2 | 12523 | -0.017 | 0.2 | NO |
| 57 | KRAS | KRAS | KRAS | 12738 | -0.02 | 0.19 | NO |
| 58 | PIK3CB | PIK3CB | PIK3CB | 12931 | -0.022 | 0.18 | NO |
| 59 | PAK4 | PAK4 | PAK4 | 13228 | -0.026 | 0.17 | NO |
| 60 | PAK1 | PAK1 | PAK1 | 13459 | -0.03 | 0.16 | NO |
| 61 | EGLN1 | EGLN1 | EGLN1 | 13930 | -0.037 | 0.14 | NO |
| 62 | CUL2 | CUL2 | CUL2 | 14204 | -0.041 | 0.13 | NO |
| 63 | MAP2K1 | MAP2K1 | MAP2K1 | 14607 | -0.048 | 0.11 | NO |
| 64 | SLC2A1 | SLC2A1 | SLC2A1 | 15674 | -0.068 | 0.064 | NO |
| 65 | TCEB2 | TCEB2 | TCEB2 | 15817 | -0.071 | 0.066 | NO |
| 66 | FH | FH | FH | 16132 | -0.08 | 0.06 | NO |
| 67 | HRAS | HRAS | HRAS | 16142 | -0.081 | 0.071 | NO |
| 68 | RBX1 | RBX1 | RBX1 | 16161 | -0.082 | 0.082 | NO |
| 69 | VEGFA | VEGFA | VEGFA | 16658 | -0.1 | 0.068 | NO |
| 70 | TCEB1 | TCEB1 | TCEB1 | 17292 | -0.14 | 0.054 | NO |
Figure S45. Get High-res Image This plot shows mRNAseq_cNMF expression data heatmap (on the left) a RunningEnrichmentScore(RES) plot (on the top right) and a Signal2Noise(S2N) plot (on the bottom right) of genes in the pathway: KEGG PURINE METABOLISM.
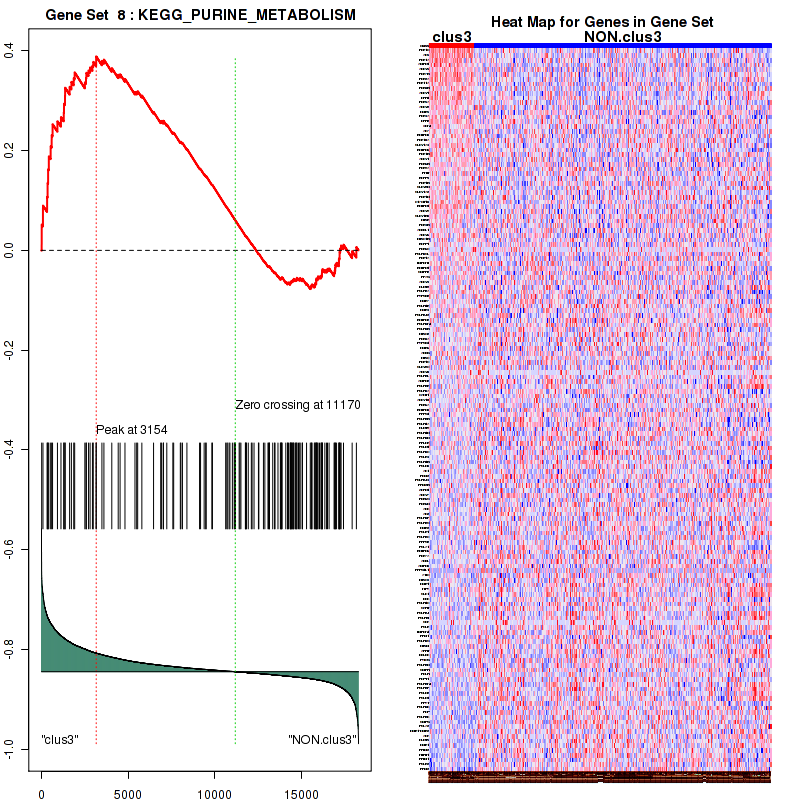
Figure S46. Get High-res Image For the top 5 core enriched genes in the pathway: KEGG PURINE METABOLISM, this volcano plot shows how much they are up/down-regulated and significant. The significance was calculated by empirical bayesian fit
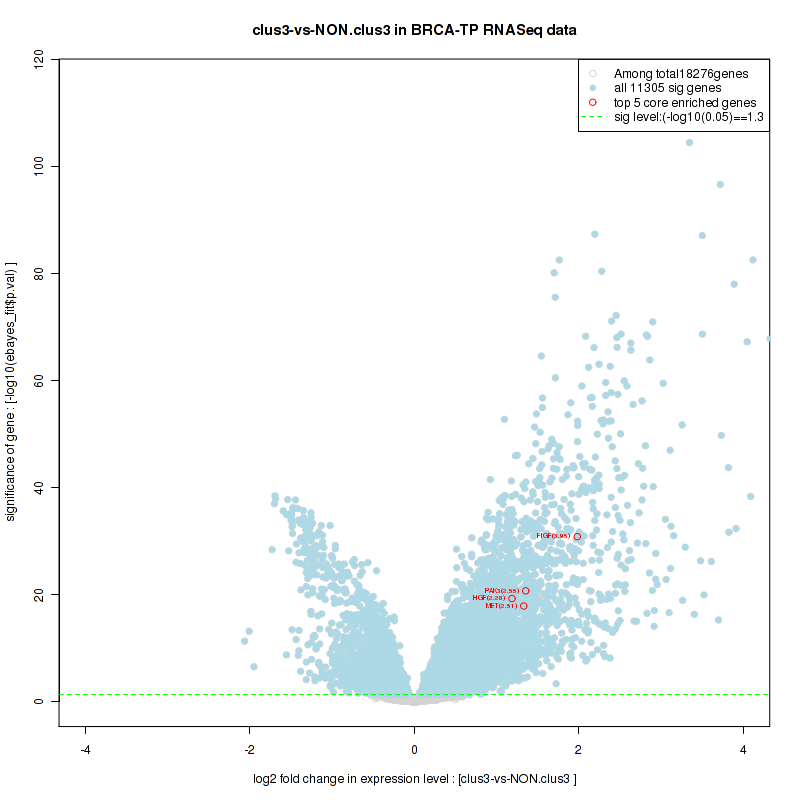
Table S24. Get Full Table This table shows a Running Enrichment Score (RES) of each gene in this pathway, that is, the enrichment score at this point in the ranked list of genes. All genes are ranked by Signal-to-Noise (S2N), a measure of similarity as default and are used to obtain ES matrix of all genes. In this way, GSEA tool uses expression pattern of not only overlapped genes but also not-overlapped genes to produce ES matrix.
| Rank | GENE | SYMBOL | DESC | LIST.LOC | S2N | RES | CORE_ENRICHMENT |
|---|---|---|---|---|---|---|---|
| 1 | PAK7 | PAK7 | PAK7 | 2 | 1.3 | 0.2 | YES |
| 2 | NRG1 | NRG1 | NRG1 | 94 | 0.7 | 0.3 | YES |
| 3 | NRG2 | NRG2 | NRG2 | 253 | 0.55 | 0.38 | YES |
| 4 | LAMA2 | LAMA2 | LAMA2 | 356 | 0.5 | 0.45 | YES |
| 5 | PAK3 | PAK3 | PAK3 | 367 | 0.49 | 0.53 | YES |
| 6 | DMD | DMD | DMD | 372 | 0.49 | 0.61 | YES |
| 7 | EGFR | EGFR | EGFR | 662 | 0.41 | 0.66 | YES |
| 8 | LAMA3 | LAMA3 | LAMA3 | 706 | 0.4 | 0.72 | YES |
| 9 | UTRN | UTRN | UTRN | 3068 | 0.17 | 0.62 | NO |
| 10 | CHRM1 | CHRM1 | CHRM1 | 3404 | 0.16 | 0.62 | NO |
| 11 | JUN | JUN | JUN | 3526 | 0.15 | 0.64 | NO |
| 12 | ITGA1 | ITGA1 | ITGA1 | 4890 | 0.1 | 0.58 | NO |
| 13 | MAPK8 | MAPK8 | MAPK8 | 5445 | 0.088 | 0.57 | NO |
| 14 | LAMA4 | LAMA4 | LAMA4 | 5988 | 0.076 | 0.55 | NO |
| 15 | PAK6 | PAK6 | PAK6 | 6807 | 0.06 | 0.51 | NO |
| 16 | PXN | PXN | PXN | 7170 | 0.053 | 0.5 | NO |
| 17 | SP1 | SP1 | SP1 | 7500 | 0.048 | 0.49 | NO |
| 18 | GIT2 | GIT2 | GIT2 | 7735 | 0.044 | 0.48 | NO |
| 19 | NRG3 | NRG3 | NRG3 | 8511 | 0.032 | 0.45 | NO |
| 20 | ITGB1 | ITGB1 | ITGB1 | 8661 | 0.03 | 0.44 | NO |
| 21 | CDC42 | CDC42 | CDC42 | 9207 | 0.023 | 0.42 | NO |
| 22 | DAG1 | DAG1 | DAG1 | 9478 | 0.02 | 0.41 | NO |
| 23 | MUSK | MUSK | MUSK | 9919 | 0.015 | 0.38 | NO |
| 24 | MAPK1 | MAPK1 | MAPK1 | 10356 | 0.0092 | 0.36 | NO |
| 25 | MAPK3 | MAPK3 | MAPK3 | 11179 | -0.00013 | 0.32 | NO |
| 26 | ACTA1 | ACTA1 | ACTA1 | 11184 | -0.00017 | 0.32 | NO |
| 27 | DVL1 | DVL1 | DVL1 | 11459 | -0.0035 | 0.3 | NO |
| 28 | PAK2 | PAK2 | PAK2 | 12225 | -0.013 | 0.26 | NO |
| 29 | RAC1 | RAC1 | RAC1 | 12462 | -0.016 | 0.25 | NO |
| 30 | CTTN | CTTN | CTTN | 12597 | -0.018 | 0.25 | NO |
| 31 | PAK4 | PAK4 | PAK4 | 13228 | -0.026 | 0.22 | NO |
| 32 | PAK1 | PAK1 | PAK1 | 13459 | -0.03 | 0.21 | NO |
| 33 | SRC | SRC | SRC | 13795 | -0.035 | 0.2 | NO |
| 34 | PTK2 | PTK2 | PTK2 | 14263 | -0.042 | 0.18 | NO |
| 35 | RAPSN | RAPSN | RAPSN | 16289 | -0.086 | 0.08 | NO |
| 36 | CHRNA1 | CHRNA1 | CHRNA1 | 17582 | -0.18 | 0.038 | NO |
Figure S47. Get High-res Image This plot shows mRNAseq_cNMF expression data heatmap (on the left) a RunningEnrichmentScore(RES) plot (on the top right) and a Signal2Noise(S2N) plot (on the bottom right) of genes in the pathway: KEGG TYROSINE METABOLISM.

Figure S48. Get High-res Image For the top 5 core enriched genes in the pathway: KEGG TYROSINE METABOLISM, this volcano plot shows how much they are up/down-regulated and significant. The significance was calculated by empirical bayesian fit

Table S25. Get Full Table This table shows a Running Enrichment Score (RES) of each gene in this pathway, that is, the enrichment score at this point in the ranked list of genes. All genes are ranked by Signal-to-Noise (S2N), a measure of similarity as default and are used to obtain ES matrix of all genes. In this way, GSEA tool uses expression pattern of not only overlapped genes but also not-overlapped genes to produce ES matrix.
| Rank | GENE | SYMBOL | DESC | LIST.LOC | S2N | RES | CORE_ENRICHMENT |
|---|---|---|---|---|---|---|---|
| 1 | CALML3 | CALML3 | CALML3 | 30 | 0.8 | 0.061 | YES |
| 2 | NGFR | NGFR | NGFR | 69 | 0.73 | 0.12 | YES |
| 3 | NTF4 | NTF4 | NTF4 | 78 | 0.72 | 0.17 | YES |
| 4 | NTRK3 | NTRK3 | NTRK3 | 176 | 0.6 | 0.21 | YES |
| 5 | NTRK2 | NTRK2 | NTRK2 | 276 | 0.54 | 0.25 | YES |
| 6 | SHC4 | SHC4 | SHC4 | 1219 | 0.32 | 0.22 | YES |
| 7 | IRAK3 | IRAK3 | IRAK3 | 1309 | 0.3 | 0.24 | YES |
| 8 | NTF3 | NTF3 | NTF3 | 1337 | 0.3 | 0.26 | YES |
| 9 | NTRK1 | NTRK1 | NTRK1 | 1804 | 0.25 | 0.26 | YES |
| 10 | CAMK4 | CAMK4 | CAMK4 | 1829 | 0.25 | 0.28 | YES |
| 11 | NGF | NGF | NGF | 1838 | 0.25 | 0.3 | YES |
| 12 | AKT3 | AKT3 | AKT3 | 2006 | 0.24 | 0.31 | YES |
| 13 | IRS1 | IRS1 | IRS1 | 2040 | 0.24 | 0.32 | YES |
| 14 | SHC2 | SHC2 | SHC2 | 2269 | 0.22 | 0.33 | YES |
| 15 | PIK3R1 | PIK3R1 | PIK3R1 | 2460 | 0.21 | 0.33 | YES |
| 16 | RPS6KA6 | RPS6KA6 | RPS6KA6 | 2527 | 0.2 | 0.35 | YES |
| 17 | BDNF | BDNF | BDNF | 2544 | 0.2 | 0.36 | YES |
| 18 | RPS6KA5 | RPS6KA5 | RPS6KA5 | 2620 | 0.2 | 0.37 | YES |
| 19 | MAP3K1 | MAP3K1 | MAP3K1 | 2660 | 0.2 | 0.39 | YES |
| 20 | BCL2 | BCL2 | BCL2 | 2771 | 0.19 | 0.4 | YES |
| 21 | RPS6KA2 | RPS6KA2 | RPS6KA2 | 2855 | 0.18 | 0.4 | YES |
| 22 | CAMK2B | CAMK2B | CAMK2B | 2923 | 0.18 | 0.42 | YES |
| 23 | PIK3CG | PIK3CG | PIK3CG | 2960 | 0.18 | 0.43 | YES |
| 24 | IRS2 | IRS2 | IRS2 | 3297 | 0.16 | 0.42 | YES |
| 25 | IRS4 | IRS4 | IRS4 | 3328 | 0.16 | 0.43 | YES |
| 26 | PIK3CD | PIK3CD | PIK3CD | 3458 | 0.16 | 0.44 | YES |
| 27 | JUN | JUN | JUN | 3526 | 0.15 | 0.44 | YES |
| 28 | TP73 | TP73 | TP73 | 3602 | 0.15 | 0.45 | YES |
| 29 | RPS6KA3 | RPS6KA3 | RPS6KA3 | 3638 | 0.15 | 0.46 | YES |
| 30 | CAMK2A | CAMK2A | CAMK2A | 3645 | 0.15 | 0.47 | YES |
| 31 | MAPK10 | MAPK10 | MAPK10 | 4457 | 0.12 | 0.44 | NO |
| 32 | IRAK2 | IRAK2 | IRAK2 | 4610 | 0.11 | 0.44 | NO |
| 33 | PLCG2 | PLCG2 | PLCG2 | 4632 | 0.11 | 0.45 | NO |
| 34 | GAB1 | GAB1 | GAB1 | 4671 | 0.11 | 0.45 | NO |
| 35 | CAMK2D | CAMK2D | CAMK2D | 5370 | 0.09 | 0.42 | NO |
| 36 | MAPK8 | MAPK8 | MAPK8 | 5445 | 0.088 | 0.42 | NO |
| 37 | MAP3K3 | MAP3K3 | MAP3K3 | 5455 | 0.088 | 0.43 | NO |
| 38 | FRS2 | FRS2 | FRS2 | 5482 | 0.087 | 0.44 | NO |
| 39 | FOXO3 | FOXO3 | FOXO3 | 5512 | 0.086 | 0.44 | NO |
| 40 | MAP2K5 | MAP2K5 | MAP2K5 | 5730 | 0.082 | 0.44 | NO |
| 41 | MAPK11 | MAPK11 | MAPK11 | 5795 | 0.08 | 0.44 | NO |
| 42 | SOS2 | SOS2 | SOS2 | 6199 | 0.072 | 0.42 | NO |
| 43 | ABL1 | ABL1 | ABL1 | 6357 | 0.068 | 0.42 | NO |
| 44 | KIDINS220 | KIDINS220 | KIDINS220 | 6553 | 0.065 | 0.41 | NO |
| 45 | SH2B3 | SH2B3 | SH2B3 | 6657 | 0.063 | 0.41 | NO |
| 46 | ARHGDIB | ARHGDIB | ARHGDIB | 6669 | 0.062 | 0.42 | NO |
| 47 | ZNF274 | ZNF274 | ZNF274 | 6749 | 0.061 | 0.42 | NO |
| 48 | TRAF6 | TRAF6 | TRAF6 | 6890 | 0.058 | 0.41 | NO |
| 49 | MAP3K5 | MAP3K5 | MAP3K5 | 7048 | 0.056 | 0.41 | NO |
| 50 | NFKB1 | NFKB1 | NFKB1 | 7062 | 0.055 | 0.41 | NO |
| 51 | RAPGEF1 | RAPGEF1 | RAPGEF1 | 7252 | 0.052 | 0.41 | NO |
| 52 | IKBKB | IKBKB | IKBKB | 7374 | 0.05 | 0.4 | NO |
| 53 | PIK3CA | PIK3CA | PIK3CA | 7603 | 0.047 | 0.4 | NO |
| 54 | CRK | CRK | CRK | 7745 | 0.044 | 0.39 | NO |
| 55 | PRDM4 | PRDM4 | PRDM4 | 7980 | 0.041 | 0.38 | NO |
| 56 | FASLG | FASLG | FASLG | 8037 | 0.04 | 0.38 | NO |
| 57 | TP53 | TP53 | TP53 | 8372 | 0.035 | 0.37 | NO |
| 58 | MAPK7 | MAPK7 | MAPK7 | 8554 | 0.032 | 0.36 | NO |
| 59 | NGFRAP1 | NGFRAP1 | NGFRAP1 | 8781 | 0.029 | 0.35 | NO |
| 60 | PIK3R5 | PIK3R5 | PIK3R5 | 8967 | 0.026 | 0.34 | NO |
| 61 | NFKBIA | NFKBIA | NFKBIA | 9018 | 0.026 | 0.34 | NO |
| 62 | PIK3R3 | PIK3R3 | PIK3R3 | 9088 | 0.025 | 0.34 | NO |
| 63 | SHC1 | SHC1 | SHC1 | 9127 | 0.024 | 0.34 | NO |
| 64 | CDC42 | CDC42 | CDC42 | 9207 | 0.023 | 0.34 | NO |
| 65 | SH2B1 | SH2B1 | SH2B1 | 9406 | 0.021 | 0.33 | NO |
| 66 | CALML6 | CALML6 | CALML6 | 9523 | 0.02 | 0.32 | NO |
| 67 | IRAK4 | IRAK4 | IRAK4 | 9603 | 0.019 | 0.32 | NO |
| 68 | PSEN1 | PSEN1 | PSEN1 | 9697 | 0.018 | 0.31 | NO |
| 69 | RPS6KA1 | RPS6KA1 | RPS6KA1 | 10002 | 0.014 | 0.3 | NO |
| 70 | RAP1A | RAP1A | RAP1A | 10087 | 0.012 | 0.3 | NO |
| 71 | RELA | RELA | RELA | 10108 | 0.012 | 0.3 | NO |
| 72 | SOS1 | SOS1 | SOS1 | 10229 | 0.011 | 0.29 | NO |
| 73 | MAPK1 | MAPK1 | MAPK1 | 10356 | 0.0092 | 0.28 | NO |
| 74 | MAP2K7 | MAP2K7 | MAP2K7 | 10374 | 0.0091 | 0.28 | NO |
| 75 | RAP1B | RAP1B | RAP1B | 10462 | 0.0079 | 0.28 | NO |
| 76 | BRAF | BRAF | BRAF | 10508 | 0.0072 | 0.28 | NO |
| 77 | BAD | BAD | BAD | 10804 | 0.004 | 0.26 | NO |
| 78 | MAPK14 | MAPK14 | MAPK14 | 10858 | 0.0034 | 0.26 | NO |
| 79 | AKT2 | AKT2 | AKT2 | 10984 | 0.0022 | 0.25 | NO |
| 80 | PIK3R2 | PIK3R2 | PIK3R2 | 11037 | 0.0017 | 0.25 | NO |
| 81 | PLCG1 | PLCG1 | PLCG1 | 11071 | 0.0013 | 0.25 | NO |
| 82 | CRKL | CRKL | CRKL | 11176 | -0.000069 | 0.24 | NO |
| 83 | MAPK3 | MAPK3 | MAPK3 | 11179 | -0.00013 | 0.24 | NO |
| 84 | RHOA | RHOA | RHOA | 11358 | -0.0023 | 0.23 | NO |
| 85 | CAMK2G | CAMK2G | CAMK2G | 11456 | -0.0035 | 0.23 | NO |
| 86 | NRAS | NRAS | NRAS | 11512 | -0.0041 | 0.22 | NO |
| 87 | RPS6KA4 | RPS6KA4 | RPS6KA4 | 12060 | -0.011 | 0.19 | NO |
| 88 | SORT1 | SORT1 | SORT1 | 12102 | -0.012 | 0.19 | NO |
| 89 | GRB2 | GRB2 | GRB2 | 12115 | -0.012 | 0.19 | NO |
| 90 | PTPN11 | PTPN11 | PTPN11 | 12242 | -0.013 | 0.19 | NO |
| 91 | MAPK9 | MAPK9 | MAPK9 | 12246 | -0.013 | 0.19 | NO |
| 92 | RAF1 | RAF1 | RAF1 | 12270 | -0.014 | 0.19 | NO |
| 93 | AKT1 | AKT1 | AKT1 | 12363 | -0.015 | 0.18 | NO |
| 94 | RAC1 | RAC1 | RAC1 | 12462 | -0.016 | 0.18 | NO |
| 95 | CALM3 | CALM3 | CALM3 | 12482 | -0.016 | 0.18 | NO |
| 96 | MAP2K2 | MAP2K2 | MAP2K2 | 12523 | -0.017 | 0.18 | NO |
| 97 | GSK3B | GSK3B | GSK3B | 12638 | -0.018 | 0.17 | NO |
| 98 | MAPKAPK2 | MAPKAPK2 | MAPKAPK2 | 12646 | -0.018 | 0.18 | NO |
| 99 | KRAS | KRAS | KRAS | 12738 | -0.02 | 0.17 | NO |
| 100 | PIK3CB | PIK3CB | PIK3CB | 12931 | -0.022 | 0.16 | NO |
| 101 | YWHAB | YWHAB | YWHAB | 12933 | -0.022 | 0.16 | NO |
| 102 | CALML5 | CALML5 | CALML5 | 13088 | -0.024 | 0.16 | NO |
| 103 | YWHAQ | YWHAQ | YWHAQ | 13306 | -0.028 | 0.15 | NO |
| 104 | MAGED1 | MAGED1 | MAGED1 | 13329 | -0.028 | 0.15 | NO |
| 105 | YWHAE | YWHAE | YWHAE | 13595 | -0.032 | 0.14 | NO |
| 106 | CALM1 | CALM1 | CALM1 | 13680 | -0.033 | 0.14 | NO |
| 107 | CSK | CSK | CSK | 13805 | -0.035 | 0.13 | NO |
| 108 | CALM2 | CALM2 | CALM2 | 13837 | -0.036 | 0.13 | NO |
| 109 | ATF4 | ATF4 | ATF4 | 14131 | -0.04 | 0.12 | NO |
| 110 | PRKCD | PRKCD | PRKCD | 14248 | -0.042 | 0.12 | NO |
| 111 | ARHGDIA | ARHGDIA | ARHGDIA | 14258 | -0.042 | 0.12 | NO |
| 112 | MAP2K1 | MAP2K1 | MAP2K1 | 14607 | -0.048 | 0.1 | NO |
| 113 | YWHAH | YWHAH | YWHAH | 14662 | -0.048 | 0.1 | NO |
| 114 | MAPK13 | MAPK13 | MAPK13 | 14963 | -0.054 | 0.092 | NO |
| 115 | YWHAG | YWHAG | YWHAG | 15336 | -0.06 | 0.076 | NO |
| 116 | NFKBIB | NFKBIB | NFKBIB | 15571 | -0.066 | 0.068 | NO |
| 117 | SHC3 | SHC3 | SHC3 | 15704 | -0.069 | 0.066 | NO |
| 118 | BAX | BAX | BAX | 15784 | -0.07 | 0.068 | NO |
| 119 | IRAK1 | IRAK1 | IRAK1 | 15829 | -0.072 | 0.071 | NO |
| 120 | NFKBIE | NFKBIE | NFKBIE | 15841 | -0.072 | 0.076 | NO |
| 121 | HRAS | HRAS | HRAS | 16142 | -0.081 | 0.066 | NO |
| 122 | YWHAZ | YWHAZ | YWHAZ | 16278 | -0.086 | 0.065 | NO |
| 123 | MAPK12 | MAPK12 | MAPK12 | 17127 | -0.13 | 0.028 | NO |
| 124 | RIPK2 | RIPK2 | RIPK2 | 17269 | -0.14 | 0.032 | NO |
| 125 | SH2B2 | SH2B2 | SH2B2 | 17326 | -0.15 | 0.04 | NO |
| 126 | PDK1 | PDK1 | PDK1 | 17340 | -0.15 | 0.052 | NO |
Figure S49. Get High-res Image This plot shows mRNAseq_cNMF expression data heatmap (on the left) a RunningEnrichmentScore(RES) plot (on the top right) and a Signal2Noise(S2N) plot (on the bottom right) of genes in the pathway: KEGG O GLYCAN BIOSYNTHESIS.
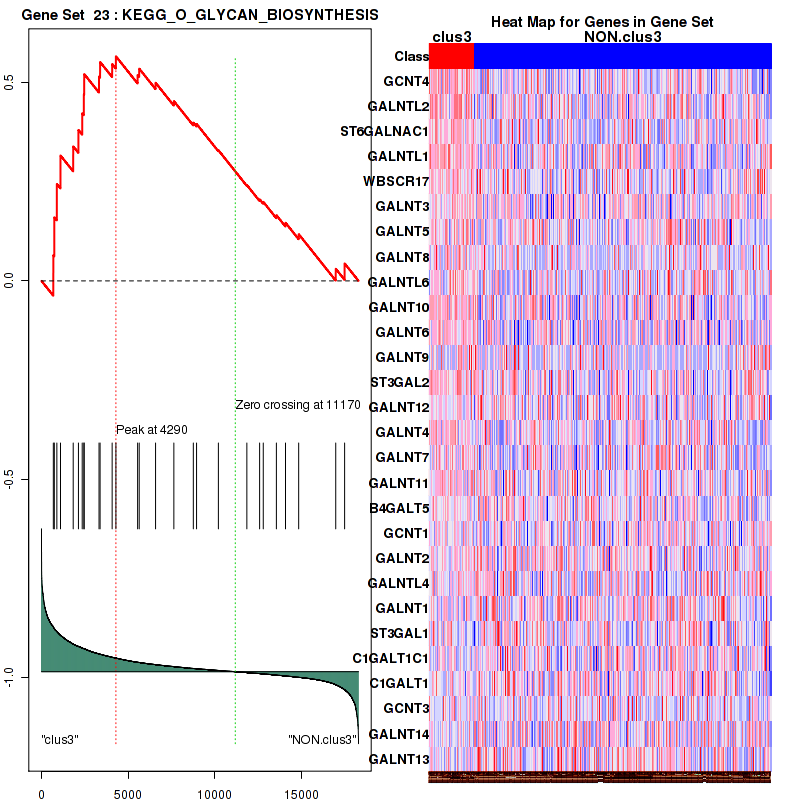
Figure S50. Get High-res Image For the top 5 core enriched genes in the pathway: KEGG O GLYCAN BIOSYNTHESIS, this volcano plot shows how much they are up/down-regulated and significant. The significance was calculated by empirical bayesian fit
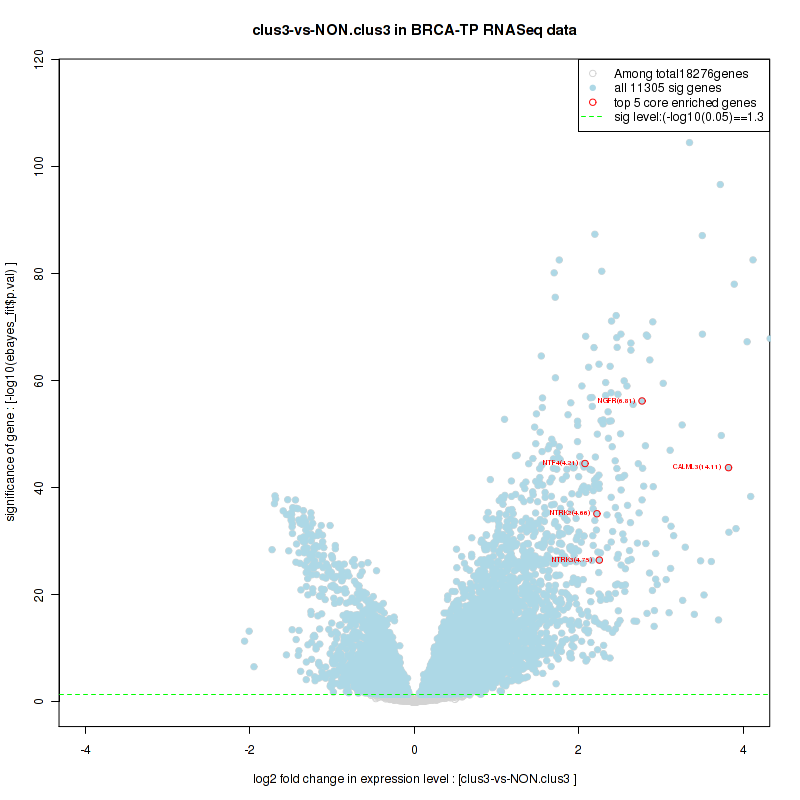
Table S26. Get Full Table This table shows a Running Enrichment Score (RES) of each gene in this pathway, that is, the enrichment score at this point in the ranked list of genes. All genes are ranked by Signal-to-Noise (S2N), a measure of similarity as default and are used to obtain ES matrix of all genes. In this way, GSEA tool uses expression pattern of not only overlapped genes but also not-overlapped genes to produce ES matrix.
| Rank | GENE | SYMBOL | DESC | LIST.LOC | S2N | RES | CORE_ENRICHMENT |
|---|---|---|---|---|---|---|---|
| 1 | ADCYAP1R1 | ADCYAP1R1 | ADCYAP1R1 | 179 | 0.6 | 0.04 | YES |
| 2 | NTRK2 | NTRK2 | NTRK2 | 276 | 0.54 | 0.08 | YES |
| 3 | PDE1A | PDE1A | PDE1A | 325 | 0.51 | 0.12 | YES |
| 4 | ADCY5 | ADCY5 | ADCY5 | 384 | 0.49 | 0.16 | YES |
| 5 | ADCY4 | ADCY4 | ADCY4 | 921 | 0.36 | 0.16 | YES |
| 6 | ADCY2 | ADCY2 | ADCY2 | 1301 | 0.31 | 0.16 | YES |
| 7 | ADCYAP1 | ADCYAP1 | ADCYAP1 | 1431 | 0.29 | 0.18 | YES |
| 8 | DUSP4 | DUSP4 | DUSP4 | 1525 | 0.28 | 0.2 | YES |
| 9 | PRKCA | PRKCA | PRKCA | 1614 | 0.27 | 0.22 | YES |
| 10 | NTRK1 | NTRK1 | NTRK1 | 1804 | 0.25 | 0.23 | YES |
| 11 | CAMK4 | CAMK4 | CAMK4 | 1829 | 0.25 | 0.25 | YES |
| 12 | NGF | NGF | NGF | 1838 | 0.25 | 0.27 | YES |
| 13 | AKT3 | AKT3 | AKT3 | 2006 | 0.24 | 0.28 | YES |
| 14 | FOXO1 | FOXO1 | FOXO1 | 2015 | 0.24 | 0.3 | YES |
| 15 | IRS1 | IRS1 | IRS1 | 2040 | 0.24 | 0.32 | YES |
| 16 | NR4A1 | NR4A1 | NR4A1 | 2213 | 0.22 | 0.32 | YES |
| 17 | SHC2 | SHC2 | SHC2 | 2269 | 0.22 | 0.34 | YES |
| 18 | PIK3R1 | PIK3R1 | PIK3R1 | 2460 | 0.21 | 0.35 | YES |
| 19 | DUSP6 | DUSP6 | DUSP6 | 2610 | 0.2 | 0.36 | YES |
| 20 | RPS6KA5 | RPS6KA5 | RPS6KA5 | 2620 | 0.2 | 0.37 | YES |
| 21 | PDE1B | PDE1B | PDE1B | 2713 | 0.19 | 0.38 | YES |
| 22 | ADCY1 | ADCY1 | ADCY1 | 2804 | 0.19 | 0.39 | YES |
| 23 | RPS6KA2 | RPS6KA2 | RPS6KA2 | 2855 | 0.18 | 0.4 | YES |
| 24 | MEF2C | MEF2C | MEF2C | 3018 | 0.18 | 0.41 | YES |
| 25 | FOXO4 | FOXO4 | FOXO4 | 3250 | 0.16 | 0.41 | YES |
| 26 | IRS2 | IRS2 | IRS2 | 3297 | 0.16 | 0.42 | YES |
| 27 | DNM1 | DNM1 | DNM1 | 3342 | 0.16 | 0.43 | YES |
| 28 | RPS6KA3 | RPS6KA3 | RPS6KA3 | 3638 | 0.15 | 0.43 | NO |
| 29 | ITPR2 | ITPR2 | ITPR2 | 4508 | 0.12 | 0.39 | NO |
| 30 | PRKCE | PRKCE | PRKCE | 4553 | 0.11 | 0.4 | NO |
| 31 | PRKAR1B | PRKAR1B | PRKAR1B | 4825 | 0.11 | 0.39 | NO |
| 32 | PRKACB | PRKACB | PRKACB | 5133 | 0.097 | 0.38 | NO |
| 33 | ADCY9 | ADCY9 | ADCY9 | 5391 | 0.09 | 0.38 | NO |
| 34 | PRKAR2A | PRKAR2A | PRKAR2A | 5422 | 0.089 | 0.38 | NO |
| 35 | FRS2 | FRS2 | FRS2 | 5482 | 0.087 | 0.39 | NO |
| 36 | FOXO3 | FOXO3 | FOXO3 | 5512 | 0.086 | 0.39 | NO |
| 37 | MAP2K5 | MAP2K5 | MAP2K5 | 5730 | 0.082 | 0.39 | NO |
| 38 | MAPK11 | MAPK11 | MAPK11 | 5795 | 0.08 | 0.39 | NO |
| 39 | RICTOR | RICTOR | RICTOR | 5990 | 0.076 | 0.39 | NO |
| 40 | PTEN | PTEN | PTEN | 6361 | 0.068 | 0.37 | NO |
| 41 | CASP9 | CASP9 | CASP9 | 6428 | 0.067 | 0.37 | NO |
| 42 | ADORA2A | ADORA2A | ADORA2A | 6453 | 0.067 | 0.38 | NO |
| 43 | CDKN1B | CDKN1B | CDKN1B | 6544 | 0.065 | 0.38 | NO |
| 44 | KIDINS220 | KIDINS220 | KIDINS220 | 6553 | 0.065 | 0.38 | NO |
| 45 | ADCY6 | ADCY6 | ADCY6 | 6875 | 0.058 | 0.37 | NO |
| 46 | MEF2A | MEF2A | MEF2A | 6902 | 0.058 | 0.37 | NO |
| 47 | PRKAR2B | PRKAR2B | PRKAR2B | 7083 | 0.055 | 0.37 | NO |
| 48 | ATF1 | ATF1 | ATF1 | 7123 | 0.054 | 0.37 | NO |
| 49 | CREB1 | CREB1 | CREB1 | 7195 | 0.053 | 0.37 | NO |
| 50 | RAPGEF1 | RAPGEF1 | RAPGEF1 | 7252 | 0.052 | 0.37 | NO |
| 51 | PPP2CB | PPP2CB | PPP2CB | 7290 | 0.051 | 0.38 | NO |
| 52 | STAT3 | STAT3 | STAT3 | 7371 | 0.05 | 0.38 | NO |
| 53 | CDKN1A | CDKN1A | CDKN1A | 7488 | 0.048 | 0.37 | NO |
| 54 | RALGDS | RALGDS | RALGDS | 7537 | 0.048 | 0.37 | NO |
| 55 | RALB | RALB | RALB | 7553 | 0.048 | 0.38 | NO |
| 56 | PIK3CA | PIK3CA | PIK3CA | 7603 | 0.047 | 0.38 | NO |
| 57 | DUSP7 | DUSP7 | DUSP7 | 7610 | 0.046 | 0.38 | NO |
| 58 | CRK | CRK | CRK | 7745 | 0.044 | 0.38 | NO |
| 59 | PHLPP1 | PHLPP1 | PHLPP1 | 8131 | 0.038 | 0.36 | NO |
| 60 | DUSP3 | DUSP3 | DUSP3 | 8351 | 0.035 | 0.35 | NO |
| 61 | ADCY3 | ADCY3 | ADCY3 | 8385 | 0.034 | 0.35 | NO |
| 62 | MAPK7 | MAPK7 | MAPK7 | 8554 | 0.032 | 0.34 | NO |
| 63 | AP2B1 | AP2B1 | AP2B1 | 8688 | 0.03 | 0.34 | NO |
| 64 | PRKAR1A | PRKAR1A | PRKAR1A | 8730 | 0.03 | 0.34 | NO |
| 65 | PDPK1 | PDPK1 | PDPK1 | 8838 | 0.028 | 0.34 | NO |
| 66 | MTOR | MTOR | MTOR | 9043 | 0.026 | 0.33 | NO |
| 67 | SHC1 | SHC1 | SHC1 | 9127 | 0.024 | 0.32 | NO |
| 68 | RPS6KA1 | RPS6KA1 | RPS6KA1 | 10002 | 0.014 | 0.28 | NO |
| 69 | AP2A2 | AP2A2 | AP2A2 | 10046 | 0.013 | 0.28 | NO |
| 70 | RAP1A | RAP1A | RAP1A | 10087 | 0.012 | 0.28 | NO |
| 71 | THEM4 | THEM4 | THEM4 | 10129 | 0.012 | 0.28 | NO |
| 72 | TSC2 | TSC2 | TSC2 | 10208 | 0.011 | 0.27 | NO |
| 73 | SOS1 | SOS1 | SOS1 | 10229 | 0.011 | 0.27 | NO |
| 74 | MAPK1 | MAPK1 | MAPK1 | 10356 | 0.0092 | 0.26 | NO |
| 75 | BRAF | BRAF | BRAF | 10508 | 0.0072 | 0.26 | NO |
| 76 | BAD | BAD | BAD | 10804 | 0.004 | 0.24 | NO |
| 77 | MAPK14 | MAPK14 | MAPK14 | 10858 | 0.0034 | 0.24 | NO |
| 78 | AKT2 | AKT2 | AKT2 | 10984 | 0.0022 | 0.23 | NO |
| 79 | PIK3R2 | PIK3R2 | PIK3R2 | 11037 | 0.0017 | 0.23 | NO |
| 80 | PLCG1 | PLCG1 | PLCG1 | 11071 | 0.0013 | 0.23 | NO |
| 81 | MAPK3 | MAPK3 | MAPK3 | 11179 | -0.00013 | 0.22 | NO |
| 82 | MDM2 | MDM2 | MDM2 | 11185 | -0.00018 | 0.22 | NO |
| 83 | RHOA | RHOA | RHOA | 11358 | -0.0023 | 0.21 | NO |
| 84 | ADCY8 | ADCY8 | ADCY8 | 11495 | -0.0039 | 0.2 | NO |
| 85 | NRAS | NRAS | NRAS | 11512 | -0.0041 | 0.2 | NO |
| 86 | RIT1 | RIT1 | RIT1 | 11533 | -0.0044 | 0.2 | NO |
| 87 | PPP2CA | PPP2CA | PPP2CA | 11573 | -0.0048 | 0.2 | NO |
| 88 | MAPKAPK3 | MAPKAPK3 | MAPKAPK3 | 11594 | -0.005 | 0.2 | NO |
| 89 | MAPKAP1 | MAPKAP1 | MAPKAP1 | 11721 | -0.0066 | 0.2 | NO |
| 90 | PRKACA | PRKACA | PRKACA | 11749 | -0.007 | 0.19 | NO |
| 91 | GRB2 | GRB2 | GRB2 | 12115 | -0.012 | 0.18 | NO |
| 92 | RALA | RALA | RALA | 12188 | -0.013 | 0.17 | NO |
| 93 | RAF1 | RAF1 | RAF1 | 12270 | -0.014 | 0.17 | NO |
| 94 | DNAL4 | DNAL4 | DNAL4 | 12291 | -0.014 | 0.17 | NO |
| 95 | AKT1 | AKT1 | AKT1 | 12363 | -0.015 | 0.17 | NO |
| 96 | PPP2R1A | PPP2R1A | PPP2R1A | 12413 | -0.015 | 0.16 | NO |
| 97 | CHUK | CHUK | CHUK | 12459 | -0.016 | 0.16 | NO |
| 98 | CALM3 | CALM3 | CALM3 | 12482 | -0.016 | 0.16 | NO |
| 99 | MAP2K2 | MAP2K2 | MAP2K2 | 12523 | -0.017 | 0.16 | NO |
| 100 | DNM2 | DNM2 | DNM2 | 12561 | -0.017 | 0.16 | NO |
| 101 | ADRBK1 | ADRBK1 | ADRBK1 | 12603 | -0.018 | 0.16 | NO |
| 102 | MAPKAPK2 | MAPKAPK2 | MAPKAPK2 | 12646 | -0.018 | 0.16 | NO |
| 103 | KRAS | KRAS | KRAS | 12738 | -0.02 | 0.16 | NO |
| 104 | AP2A1 | AP2A1 | AP2A1 | 12793 | -0.02 | 0.16 | NO |
| 105 | PIK3CB | PIK3CB | PIK3CB | 12931 | -0.022 | 0.15 | NO |
| 106 | YWHAB | YWHAB | YWHAB | 12933 | -0.022 | 0.15 | NO |
| 107 | ELK1 | ELK1 | ELK1 | 12985 | -0.023 | 0.15 | NO |
| 108 | AKT1S1 | AKT1S1 | AKT1S1 | 13211 | -0.026 | 0.14 | NO |
| 109 | CLTC | CLTC | CLTC | 13430 | -0.029 | 0.13 | NO |
| 110 | AP2M1 | AP2M1 | AP2M1 | 13512 | -0.031 | 0.13 | NO |
| 111 | CALM1 | CALM1 | CALM1 | 13680 | -0.033 | 0.12 | NO |
| 112 | GSK3A | GSK3A | GSK3A | 13784 | -0.035 | 0.12 | NO |
| 113 | SRC | SRC | SRC | 13795 | -0.035 | 0.12 | NO |
| 114 | CALM2 | CALM2 | CALM2 | 13837 | -0.036 | 0.12 | NO |
| 115 | ADCY7 | ADCY7 | ADCY7 | 14085 | -0.039 | 0.11 | NO |
| 116 | PRKCD | PRKCD | PRKCD | 14248 | -0.042 | 0.11 | NO |
| 117 | CLTA | CLTA | CLTA | 14359 | -0.043 | 0.1 | NO |
| 118 | TRIB3 | TRIB3 | TRIB3 | 14364 | -0.043 | 0.11 | NO |
| 119 | ITPR3 | ITPR3 | ITPR3 | 14501 | -0.046 | 0.1 | NO |
| 120 | MAP2K1 | MAP2K1 | MAP2K1 | 14607 | -0.048 | 0.1 | NO |
| 121 | PPP2R1B | PPP2R1B | PPP2R1B | 14690 | -0.049 | 0.1 | NO |
| 122 | PPP2R5D | PPP2R5D | PPP2R5D | 14793 | -0.05 | 0.1 | NO |
| 123 | MAPK13 | MAPK13 | MAPK13 | 14963 | -0.054 | 0.096 | NO |
| 124 | MLST8 | MLST8 | MLST8 | 15131 | -0.056 | 0.092 | NO |
| 125 | AP2S1 | AP2S1 | AP2S1 | 15677 | -0.068 | 0.067 | NO |
| 126 | SHC3 | SHC3 | SHC3 | 15704 | -0.069 | 0.072 | NO |
| 127 | SH3GL2 | SH3GL2 | SH3GL2 | 15992 | -0.077 | 0.062 | NO |
| 128 | HRAS | HRAS | HRAS | 16142 | -0.081 | 0.061 | NO |
| 129 | RPS6KB2 | RPS6KB2 | RPS6KB2 | 16368 | -0.089 | 0.056 | NO |
| 130 | PRKCG | PRKCG | PRKCG | 16911 | -0.12 | 0.035 | NO |
| 131 | MAPK12 | MAPK12 | MAPK12 | 17127 | -0.13 | 0.034 | NO |
| 132 | CDK1 | CDK1 | CDK1 | 18137 | -0.34 | 0.0077 | NO |
Figure S51. Get High-res Image This plot shows mRNAseq_cNMF expression data heatmap (on the left) a RunningEnrichmentScore(RES) plot (on the top right) and a Signal2Noise(S2N) plot (on the bottom right) of genes in the pathway: KEGG INOSITOL PHOSPHATE METABOLISM.
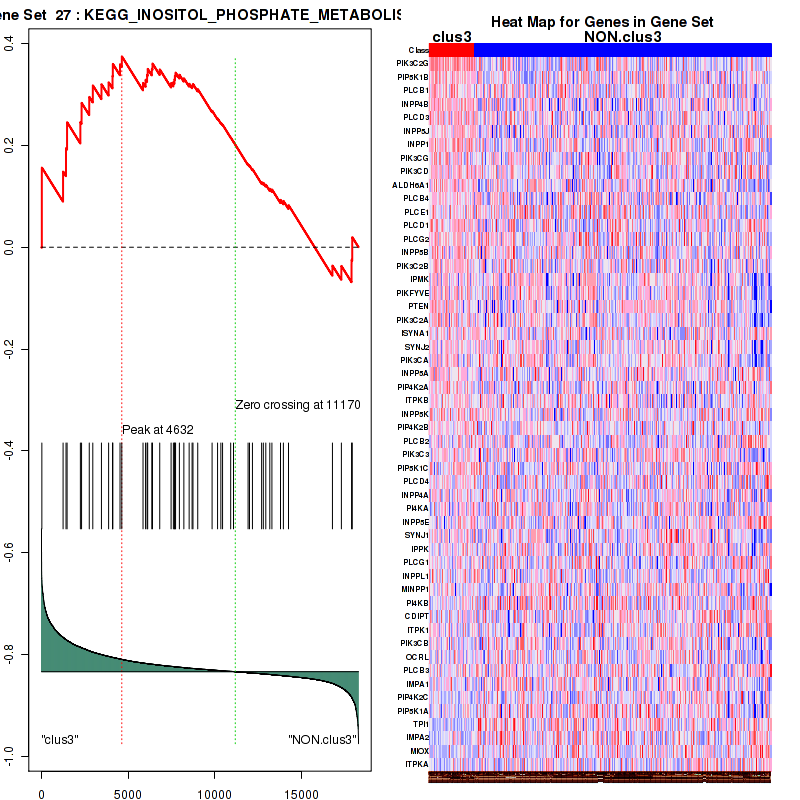
Figure S52. Get High-res Image For the top 5 core enriched genes in the pathway: KEGG INOSITOL PHOSPHATE METABOLISM, this volcano plot shows how much they are up/down-regulated and significant. The significance was calculated by empirical bayesian fit

Table S27. Get Full Table This table shows a Running Enrichment Score (RES) of each gene in this pathway, that is, the enrichment score at this point in the ranked list of genes. All genes are ranked by Signal-to-Noise (S2N), a measure of similarity as default and are used to obtain ES matrix of all genes. In this way, GSEA tool uses expression pattern of not only overlapped genes but also not-overlapped genes to produce ES matrix.
| Rank | GENE | SYMBOL | DESC | LIST.LOC | S2N | RES | CORE_ENRICHMENT |
|---|---|---|---|---|---|---|---|
| 1 | WIF1 | WIF1 | WIF1 | 91 | 0.7 | 0.15 | YES |
| 2 | SFRP1 | SFRP1 | SFRP1 | 195 | 0.59 | 0.28 | YES |
| 3 | DKK2 | DKK2 | DKK2 | 1121 | 0.33 | 0.3 | YES |
| 4 | NKD2 | NKD2 | NKD2 | 1192 | 0.32 | 0.37 | YES |
| 5 | DKK3 | DKK3 | DKK3 | 1771 | 0.26 | 0.4 | YES |
| 6 | AKT3 | AKT3 | AKT3 | 2006 | 0.24 | 0.44 | YES |
| 7 | AXIN2 | AXIN2 | AXIN2 | 2062 | 0.23 | 0.49 | YES |
| 8 | ANKRD6 | ANKRD6 | ANKRD6 | 2137 | 0.23 | 0.54 | YES |
| 9 | NKD1 | NKD1 | NKD1 | 2632 | 0.2 | 0.56 | YES |
| 10 | DACT1 | DACT1 | DACT1 | 2703 | 0.19 | 0.59 | YES |
| 11 | CXXC4 | CXXC4 | CXXC4 | 2986 | 0.18 | 0.62 | YES |
| 12 | LRP1 | LRP1 | LRP1 | 3332 | 0.16 | 0.64 | YES |
| 13 | DKK4 | DKK4 | DKK4 | 3544 | 0.15 | 0.66 | YES |
| 14 | FSTL1 | FSTL1 | FSTL1 | 3802 | 0.14 | 0.68 | YES |
| 15 | FRAT1 | FRAT1 | FRAT1 | 6080 | 0.074 | 0.57 | NO |
| 16 | CTNNB1 | CTNNB1 | CTNNB1 | 6678 | 0.062 | 0.55 | NO |
| 17 | APC | APC | APC | 6711 | 0.062 | 0.56 | NO |
| 18 | DKK1 | DKK1 | DKK1 | 8182 | 0.037 | 0.49 | NO |
| 19 | PTPRA | PTPRA | PTPRA | 8256 | 0.036 | 0.49 | NO |
| 20 | CSNK1A1 | CSNK1A1 | CSNK1A1 | 8435 | 0.034 | 0.49 | NO |
| 21 | MVP | MVP | MVP | 8446 | 0.033 | 0.5 | NO |
| 22 | PSEN1 | PSEN1 | PSEN1 | 9697 | 0.018 | 0.44 | NO |
| 23 | CBY1 | CBY1 | CBY1 | 10367 | 0.0091 | 0.4 | NO |
| 24 | AKT2 | AKT2 | AKT2 | 10984 | 0.0022 | 0.37 | NO |
| 25 | RPSA | RPSA | RPSA | 11345 | -0.0022 | 0.35 | NO |
| 26 | DVL1 | DVL1 | DVL1 | 11459 | -0.0035 | 0.34 | NO |
| 27 | SENP2 | SENP2 | SENP2 | 11752 | -0.0071 | 0.33 | NO |
| 28 | AKT1 | AKT1 | AKT1 | 12363 | -0.015 | 0.3 | NO |
| 29 | PIN1 | PIN1 | PIN1 | 12582 | -0.018 | 0.29 | NO |
| 30 | GSK3B | GSK3B | GSK3B | 12638 | -0.018 | 0.29 | NO |
| 31 | GSK3A | GSK3A | GSK3A | 13784 | -0.035 | 0.24 | NO |
| 32 | AXIN1 | AXIN1 | AXIN1 | 14534 | -0.046 | 0.2 | NO |
Figure S53. Get High-res Image This plot shows mRNAseq_cNMF expression data heatmap (on the left) a RunningEnrichmentScore(RES) plot (on the top right) and a Signal2Noise(S2N) plot (on the bottom right) of genes in the pathway: KEGG GLYCEROPHOSPHOLIPID METABOLISM.
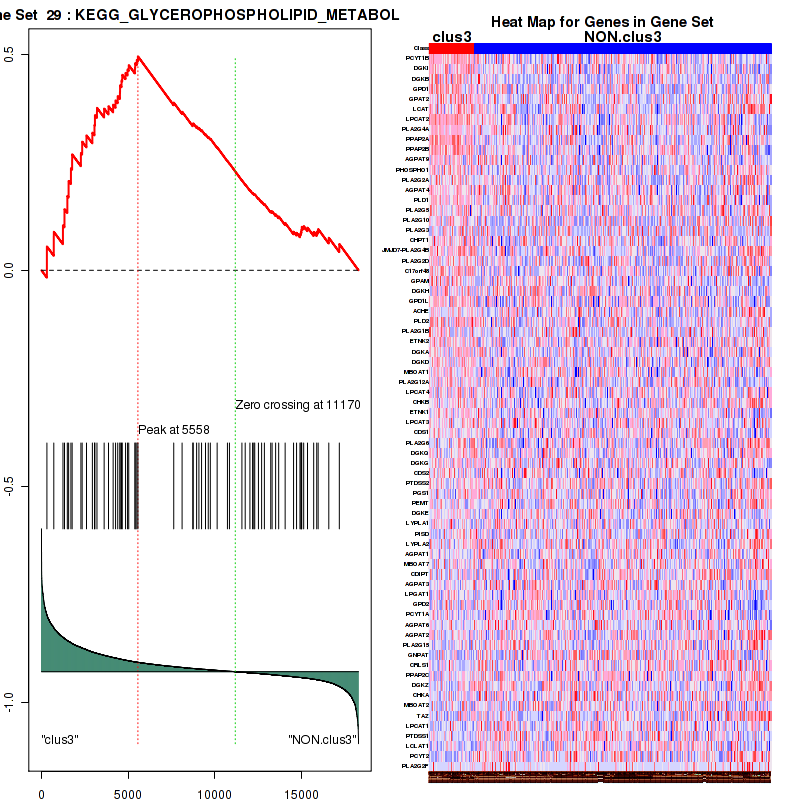
Figure S54. Get High-res Image For the top 5 core enriched genes in the pathway: KEGG GLYCEROPHOSPHOLIPID METABOLISM, this volcano plot shows how much they are up/down-regulated and significant. The significance was calculated by empirical bayesian fit
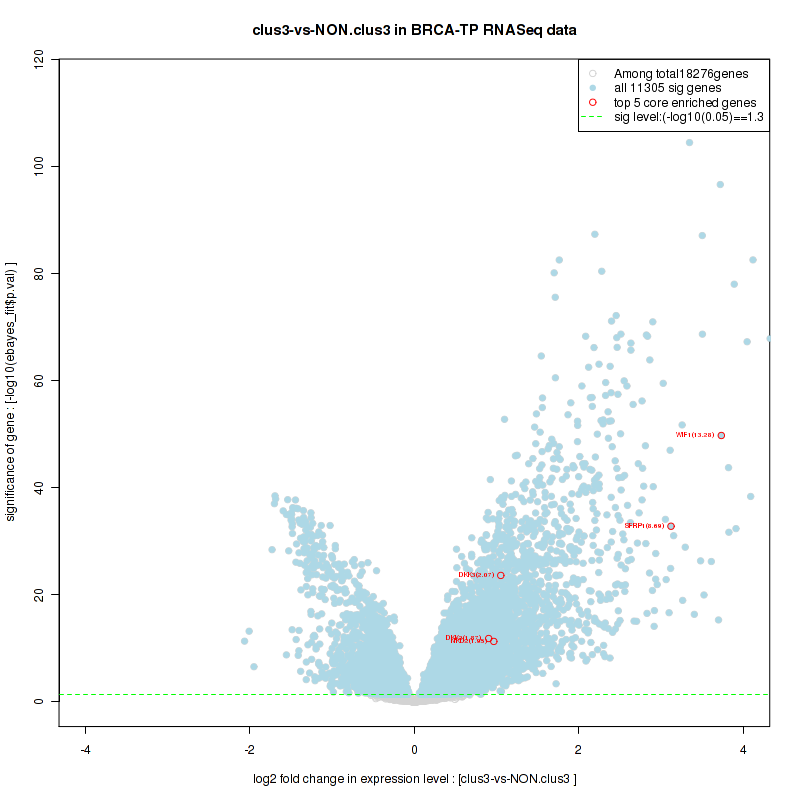
Table S28. Get Full Table This table shows a Running Enrichment Score (RES) of each gene in this pathway, that is, the enrichment score at this point in the ranked list of genes. All genes are ranked by Signal-to-Noise (S2N), a measure of similarity as default and are used to obtain ES matrix of all genes. In this way, GSEA tool uses expression pattern of not only overlapped genes but also not-overlapped genes to produce ES matrix.
| Rank | GENE | SYMBOL | DESC | LIST.LOC | S2N | RES | CORE_ENRICHMENT |
|---|---|---|---|---|---|---|---|
| 1 | PAK7 | PAK7 | PAK7 | 2 | 1.3 | 0.15 | YES |
| 2 | IGF1 | IGF1 | IGF1 | 221 | 0.57 | 0.2 | YES |
| 3 | F2RL2 | F2RL2 | F2RL2 | 344 | 0.5 | 0.26 | YES |
| 4 | PAK3 | PAK3 | PAK3 | 367 | 0.49 | 0.32 | YES |
| 5 | MET | MET | MET | 867 | 0.37 | 0.33 | YES |
| 6 | ERBB4 | ERBB4 | ERBB4 | 1109 | 0.33 | 0.36 | YES |
| 7 | SLC2A4 | SLC2A4 | SLC2A4 | 1413 | 0.29 | 0.38 | YES |
| 8 | CREB5 | CREB5 | CREB5 | 1569 | 0.28 | 0.4 | YES |
| 9 | AKT3 | AKT3 | AKT3 | 2006 | 0.24 | 0.4 | YES |
| 10 | IRS1 | IRS1 | IRS1 | 2040 | 0.24 | 0.43 | YES |
| 11 | IGFBP1 | IGFBP1 | IGFBP1 | 2162 | 0.23 | 0.45 | YES |
| 12 | RPS6KA2 | RPS6KA2 | RPS6KA2 | 2855 | 0.18 | 0.44 | YES |
| 13 | IRS2 | IRS2 | IRS2 | 3297 | 0.16 | 0.43 | YES |
| 14 | IRS4 | IRS4 | IRS4 | 3328 | 0.16 | 0.45 | YES |
| 15 | PIK3CD | PIK3CD | PIK3CD | 3458 | 0.16 | 0.46 | YES |
| 16 | RPS6KA3 | RPS6KA3 | RPS6KA3 | 3638 | 0.15 | 0.47 | YES |
| 17 | GADD45A | GADD45A | GADD45A | 3760 | 0.14 | 0.48 | YES |
| 18 | CYTH3 | CYTH3 | CYTH3 | 3842 | 0.14 | 0.49 | YES |
| 19 | PREX1 | PREX1 | PREX1 | 3943 | 0.14 | 0.5 | YES |
| 20 | GAB1 | GAB1 | GAB1 | 4671 | 0.11 | 0.47 | NO |
| 21 | MYC | MYC | MYC | 4873 | 0.1 | 0.48 | NO |
| 22 | FOXO3 | FOXO3 | FOXO3 | 5512 | 0.086 | 0.45 | NO |
| 23 | SOS2 | SOS2 | SOS2 | 6199 | 0.072 | 0.42 | NO |
| 24 | PTEN | PTEN | PTEN | 6361 | 0.068 | 0.42 | NO |
| 25 | CDKN1B | CDKN1B | CDKN1B | 6544 | 0.065 | 0.42 | NO |
| 26 | PAK6 | PAK6 | PAK6 | 6807 | 0.06 | 0.41 | NO |
| 27 | TSC1 | TSC1 | TSC1 | 6888 | 0.058 | 0.41 | NO |
| 28 | PPP1R13B | PPP1R13B | PPP1R13B | 7137 | 0.054 | 0.41 | NO |
| 29 | CREB1 | CREB1 | CREB1 | 7195 | 0.053 | 0.41 | NO |
| 30 | PIK3CA | PIK3CA | PIK3CA | 7603 | 0.047 | 0.39 | NO |
| 31 | PARD3 | PARD3 | PARD3 | 8254 | 0.036 | 0.36 | NO |
| 32 | SFN | SFN | SFN | 8773 | 0.029 | 0.34 | NO |
| 33 | PIK3R5 | PIK3R5 | PIK3R5 | 8967 | 0.026 | 0.33 | NO |
| 34 | MTOR | MTOR | MTOR | 9043 | 0.026 | 0.33 | NO |
| 35 | SHC1 | SHC1 | SHC1 | 9127 | 0.024 | 0.32 | NO |
| 36 | CDC42 | CDC42 | CDC42 | 9207 | 0.023 | 0.32 | NO |
| 37 | RPS6KA1 | RPS6KA1 | RPS6KA1 | 10002 | 0.014 | 0.28 | NO |
| 38 | TSC2 | TSC2 | TSC2 | 10208 | 0.011 | 0.27 | NO |
| 39 | SOS1 | SOS1 | SOS1 | 10229 | 0.011 | 0.27 | NO |
| 40 | BCL2L1 | BCL2L1 | BCL2L1 | 10575 | 0.0064 | 0.25 | NO |
| 41 | BAD | BAD | BAD | 10804 | 0.004 | 0.24 | NO |
| 42 | AKT2 | AKT2 | AKT2 | 10984 | 0.0022 | 0.23 | NO |
| 43 | CREB3 | CREB3 | CREB3 | 11671 | -0.0061 | 0.2 | NO |
| 44 | RPS6KB1 | RPS6KB1 | RPS6KB1 | 11853 | -0.0087 | 0.19 | NO |
| 45 | INPPL1 | INPPL1 | INPPL1 | 11909 | -0.0095 | 0.18 | NO |
| 46 | GRB2 | GRB2 | GRB2 | 12115 | -0.012 | 0.18 | NO |
| 47 | PAK2 | PAK2 | PAK2 | 12225 | -0.013 | 0.17 | NO |
| 48 | AKT1 | AKT1 | AKT1 | 12363 | -0.015 | 0.16 | NO |
| 49 | GSK3B | GSK3B | GSK3B | 12638 | -0.018 | 0.15 | NO |
| 50 | YWHAB | YWHAB | YWHAB | 12933 | -0.022 | 0.14 | NO |
| 51 | PAK4 | PAK4 | PAK4 | 13228 | -0.026 | 0.12 | NO |
| 52 | YWHAQ | YWHAQ | YWHAQ | 13306 | -0.028 | 0.12 | NO |
| 53 | PAK1 | PAK1 | PAK1 | 13459 | -0.03 | 0.12 | NO |
| 54 | YWHAE | YWHAE | YWHAE | 13595 | -0.032 | 0.12 | NO |
| 55 | GSK3A | GSK3A | GSK3A | 13784 | -0.035 | 0.11 | NO |
| 56 | NOLC1 | NOLC1 | NOLC1 | 14047 | -0.038 | 0.1 | NO |
| 57 | PTK2 | PTK2 | PTK2 | 14263 | -0.042 | 0.093 | NO |
| 58 | YWHAH | YWHAH | YWHAH | 14662 | -0.048 | 0.077 | NO |
| 59 | PTPN1 | PTPN1 | PTPN1 | 14982 | -0.054 | 0.066 | NO |
| 60 | YWHAG | YWHAG | YWHAG | 15336 | -0.06 | 0.054 | NO |
| 61 | CDK2 | CDK2 | CDK2 | 15530 | -0.065 | 0.051 | NO |
| 62 | YWHAZ | YWHAZ | YWHAZ | 16278 | -0.086 | 0.02 | NO |
| 63 | PARD6A | PARD6A | PARD6A | 16315 | -0.087 | 0.028 | NO |
| 64 | IFI27 | IFI27 | IFI27 | 17277 | -0.14 | -0.0075 | NO |
| 65 | EBP | EBP | EBP | 17317 | -0.15 | 0.008 | NO |
| 66 | PDK1 | PDK1 | PDK1 | 17340 | -0.15 | 0.025 | NO |
| 67 | CDKN2A | CDKN2A | CDKN2A | 17841 | -0.22 | 0.024 | NO |
Figure S55. Get High-res Image This plot shows mRNAseq_cNMF expression data heatmap (on the left) a RunningEnrichmentScore(RES) plot (on the top right) and a Signal2Noise(S2N) plot (on the bottom right) of genes in the pathway: KEGG ETHER LIPID METABOLISM.
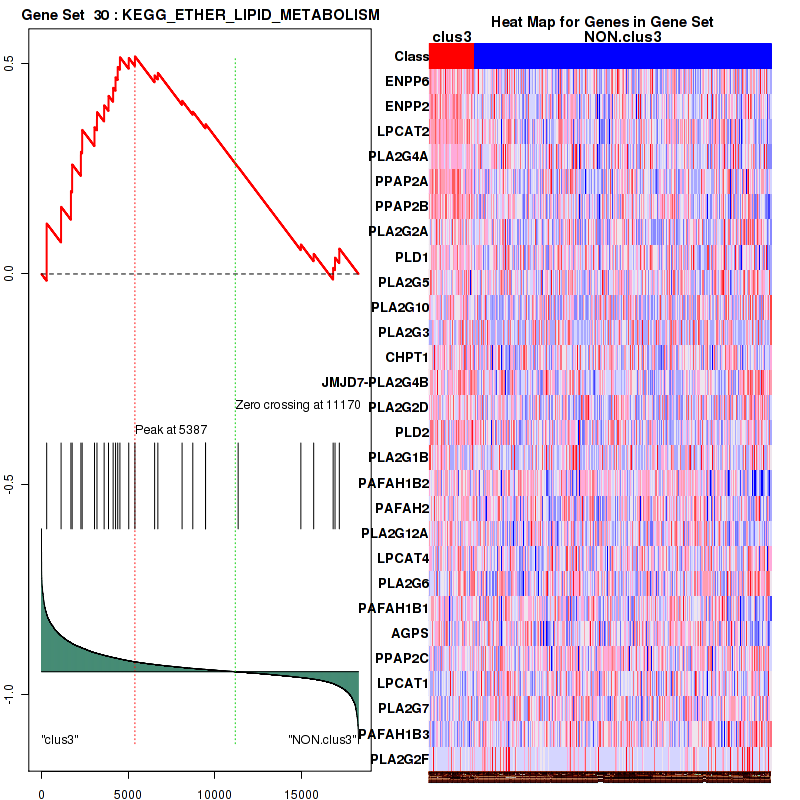
Figure S56. Get High-res Image For the top 5 core enriched genes in the pathway: KEGG ETHER LIPID METABOLISM, this volcano plot shows how much they are up/down-regulated and significant. The significance was calculated by empirical bayesian fit

Table S29. Get Full Table This table shows a Running Enrichment Score (RES) of each gene in this pathway, that is, the enrichment score at this point in the ranked list of genes. All genes are ranked by Signal-to-Noise (S2N), a measure of similarity as default and are used to obtain ES matrix of all genes. In this way, GSEA tool uses expression pattern of not only overlapped genes but also not-overlapped genes to produce ES matrix.
| Rank | GENE | SYMBOL | DESC | LIST.LOC | S2N | RES | CORE_ENRICHMENT |
|---|---|---|---|---|---|---|---|
| 1 | IGF1 | IGF1 | IGF1 | 221 | 0.57 | 0.11 | YES |
| 2 | FIGF | FIGF | FIGF | 306 | 0.52 | 0.22 | YES |
| 3 | AKT3 | AKT3 | AKT3 | 2006 | 0.24 | 0.18 | YES |
| 4 | PRKAA2 | PRKAA2 | PRKAA2 | 2256 | 0.22 | 0.22 | YES |
| 5 | PIK3R1 | PIK3R1 | PIK3R1 | 2460 | 0.21 | 0.25 | YES |
| 6 | RPS6KA6 | RPS6KA6 | RPS6KA6 | 2527 | 0.2 | 0.29 | YES |
| 7 | CAB39L | CAB39L | CAB39L | 2808 | 0.19 | 0.32 | YES |
| 8 | RPS6KA2 | RPS6KA2 | RPS6KA2 | 2855 | 0.18 | 0.36 | YES |
| 9 | PIK3CG | PIK3CG | PIK3CG | 2960 | 0.18 | 0.39 | YES |
| 10 | VEGFC | VEGFC | VEGFC | 3217 | 0.17 | 0.41 | YES |
| 11 | PGF | PGF | PGF | 3291 | 0.16 | 0.44 | YES |
| 12 | PIK3CD | PIK3CD | PIK3CD | 3458 | 0.16 | 0.47 | YES |
| 13 | RPS6KA3 | RPS6KA3 | RPS6KA3 | 3638 | 0.15 | 0.49 | YES |
| 14 | PRKAA1 | PRKAA1 | PRKAA1 | 4699 | 0.11 | 0.46 | NO |
| 15 | RICTOR | RICTOR | RICTOR | 5990 | 0.076 | 0.4 | NO |
| 16 | EIF4B | EIF4B | EIF4B | 6819 | 0.059 | 0.37 | NO |
| 17 | TSC1 | TSC1 | TSC1 | 6888 | 0.058 | 0.38 | NO |
| 18 | RPS6 | RPS6 | RPS6 | 7516 | 0.048 | 0.36 | NO |
| 19 | PIK3CA | PIK3CA | PIK3CA | 7603 | 0.047 | 0.36 | NO |
| 20 | CAB39 | CAB39 | CAB39 | 8441 | 0.033 | 0.32 | NO |
| 21 | PDPK1 | PDPK1 | PDPK1 | 8838 | 0.028 | 0.31 | NO |
| 22 | PIK3R5 | PIK3R5 | PIK3R5 | 8967 | 0.026 | 0.3 | NO |
| 23 | MTOR | MTOR | MTOR | 9043 | 0.026 | 0.31 | NO |
| 24 | PIK3R3 | PIK3R3 | PIK3R3 | 9088 | 0.025 | 0.31 | NO |
| 25 | STK11 | STK11 | STK11 | 9104 | 0.025 | 0.31 | NO |
| 26 | RPS6KA1 | RPS6KA1 | RPS6KA1 | 10002 | 0.014 | 0.27 | NO |
| 27 | TSC2 | TSC2 | TSC2 | 10208 | 0.011 | 0.26 | NO |
| 28 | VEGFB | VEGFB | VEGFB | 10330 | 0.0094 | 0.26 | NO |
| 29 | MAPK1 | MAPK1 | MAPK1 | 10356 | 0.0092 | 0.26 | NO |
| 30 | BRAF | BRAF | BRAF | 10508 | 0.0072 | 0.25 | NO |
| 31 | ULK2 | ULK2 | ULK2 | 10752 | 0.0046 | 0.24 | NO |
| 32 | AKT2 | AKT2 | AKT2 | 10984 | 0.0022 | 0.22 | NO |
| 33 | PIK3R2 | PIK3R2 | PIK3R2 | 11037 | 0.0017 | 0.22 | NO |
| 34 | MAPK3 | MAPK3 | MAPK3 | 11179 | -0.00013 | 0.21 | NO |
| 35 | ULK1 | ULK1 | ULK1 | 11199 | -0.00031 | 0.21 | NO |
| 36 | STRADA | STRADA | STRADA | 11419 | -0.003 | 0.2 | NO |
| 37 | DDIT4 | DDIT4 | DDIT4 | 11668 | -0.006 | 0.19 | NO |
| 38 | RPS6KB1 | RPS6KB1 | RPS6KB1 | 11853 | -0.0087 | 0.18 | NO |
| 39 | HIF1A | HIF1A | HIF1A | 11868 | -0.009 | 0.18 | NO |
| 40 | RPTOR | RPTOR | RPTOR | 12227 | -0.013 | 0.17 | NO |
| 41 | AKT1 | AKT1 | AKT1 | 12363 | -0.015 | 0.16 | NO |
| 42 | EIF4E | EIF4E | EIF4E | 12655 | -0.018 | 0.15 | NO |
| 43 | EIF4E2 | EIF4E2 | EIF4E2 | 12811 | -0.02 | 0.14 | NO |
| 44 | ULK3 | ULK3 | ULK3 | 12883 | -0.022 | 0.15 | NO |
| 45 | PIK3CB | PIK3CB | PIK3CB | 12931 | -0.022 | 0.15 | NO |
| 46 | MLST8 | MLST8 | MLST8 | 15131 | -0.056 | 0.04 | NO |
| 47 | RHEB | RHEB | RHEB | 16150 | -0.081 | 0.0021 | NO |
| 48 | RPS6KB2 | RPS6KB2 | RPS6KB2 | 16368 | -0.089 | 0.0097 | NO |
| 49 | VEGFA | VEGFA | VEGFA | 16658 | -0.1 | 0.016 | NO |
| 50 | EIF4E1B | EIF4E1B | EIF4E1B | 17132 | -0.13 | 0.019 | NO |
| 51 | EIF4EBP1 | EIF4EBP1 | EIF4EBP1 | 17718 | -0.2 | 0.031 | NO |
Figure S57. Get High-res Image This plot shows mRNAseq_cNMF expression data heatmap (on the left) a RunningEnrichmentScore(RES) plot (on the top right) and a Signal2Noise(S2N) plot (on the bottom right) of genes in the pathway: KEGG ARACHIDONIC ACID METABOLISM.
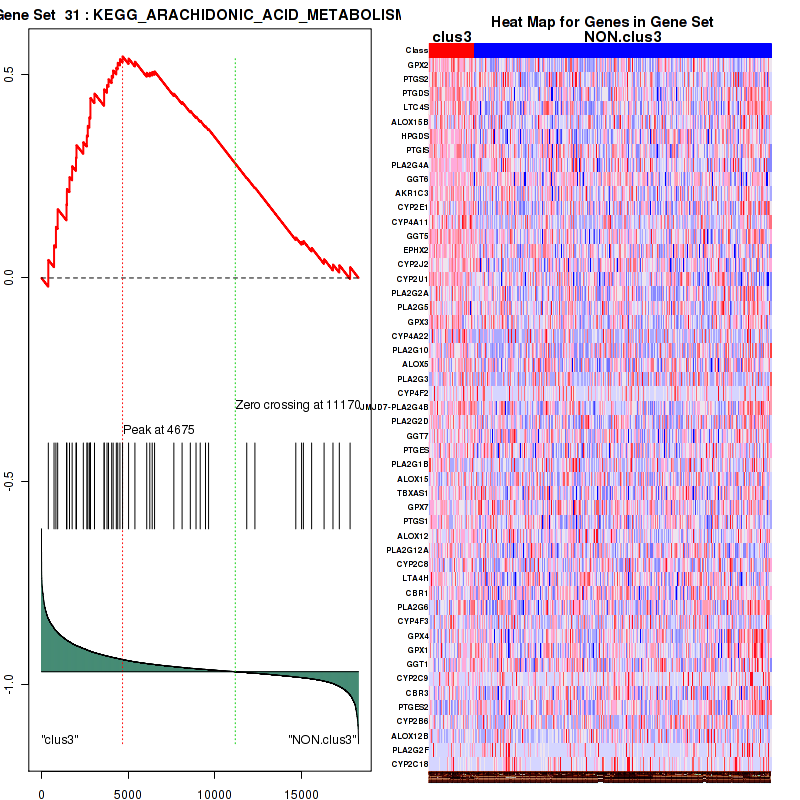
Figure S58. Get High-res Image For the top 5 core enriched genes in the pathway: KEGG ARACHIDONIC ACID METABOLISM, this volcano plot shows how much they are up/down-regulated and significant. The significance was calculated by empirical bayesian fit
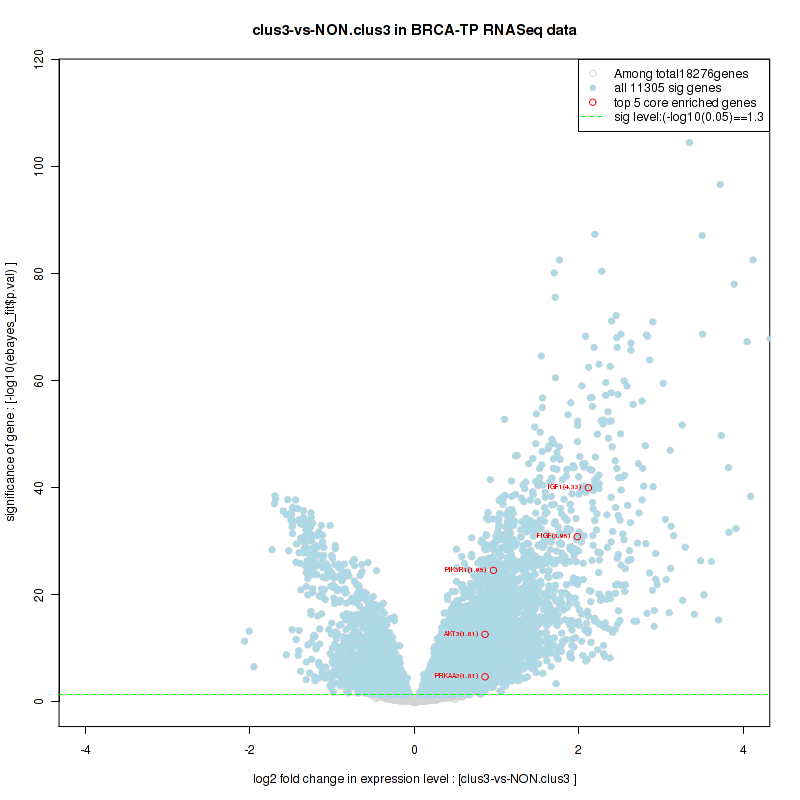
Table S30. Get Full Table This table shows a Running Enrichment Score (RES) of each gene in this pathway, that is, the enrichment score at this point in the ranked list of genes. All genes are ranked by Signal-to-Noise (S2N), a measure of similarity as default and are used to obtain ES matrix of all genes. In this way, GSEA tool uses expression pattern of not only overlapped genes but also not-overlapped genes to produce ES matrix.
| Rank | GENE | SYMBOL | DESC | LIST.LOC | S2N | RES | CORE_ENRICHMENT |
|---|---|---|---|---|---|---|---|
| 1 | PDE1A | PDE1A | PDE1A | 325 | 0.51 | 0.025 | YES |
| 2 | KL | KL | KL | 328 | 0.51 | 0.068 | YES |
| 3 | FGF2 | FGF2 | FGF2 | 361 | 0.5 | 0.11 | YES |
| 4 | ADCY5 | ADCY5 | ADCY5 | 384 | 0.49 | 0.15 | YES |
| 5 | FGF1 | FGF1 | FGF1 | 432 | 0.47 | 0.18 | YES |
| 6 | SPRY2 | SPRY2 | SPRY2 | 567 | 0.43 | 0.21 | YES |
| 7 | FGF19 | FGF19 | FGF19 | 578 | 0.43 | 0.25 | YES |
| 8 | FGF18 | FGF18 | FGF18 | 611 | 0.42 | 0.28 | YES |
| 9 | FGF7 | FGF7 | FGF7 | 869 | 0.37 | 0.3 | YES |
| 10 | ADCY4 | ADCY4 | ADCY4 | 921 | 0.36 | 0.33 | YES |
| 11 | IL17RD | IL17RD | IL17RD | 938 | 0.36 | 0.36 | YES |
| 12 | FGF9 | FGF9 | FGF9 | 1176 | 0.32 | 0.37 | YES |
| 13 | ADCY2 | ADCY2 | ADCY2 | 1301 | 0.31 | 0.39 | YES |
| 14 | PRKCA | PRKCA | PRKCA | 1614 | 0.27 | 0.4 | YES |
| 15 | CAMK4 | CAMK4 | CAMK4 | 1829 | 0.25 | 0.4 | YES |
| 16 | AKT3 | AKT3 | AKT3 | 2006 | 0.24 | 0.42 | YES |
| 17 | FOXO1 | FOXO1 | FOXO1 | 2015 | 0.24 | 0.43 | YES |
| 18 | FGF20 | FGF20 | FGF20 | 2176 | 0.23 | 0.44 | YES |
| 19 | NR4A1 | NR4A1 | NR4A1 | 2213 | 0.22 | 0.46 | YES |
| 20 | FGF17 | FGF17 | FGF17 | 2347 | 0.22 | 0.47 | YES |
| 21 | PIK3R1 | PIK3R1 | PIK3R1 | 2460 | 0.21 | 0.48 | YES |
| 22 | PDE1B | PDE1B | PDE1B | 2713 | 0.19 | 0.49 | YES |
| 23 | ADCY1 | ADCY1 | ADCY1 | 2804 | 0.19 | 0.5 | YES |
| 24 | FOXO4 | FOXO4 | FOXO4 | 3250 | 0.16 | 0.49 | YES |
| 25 | KLB | KLB | KLB | 3254 | 0.16 | 0.5 | YES |
| 26 | FGF10 | FGF10 | FGF10 | 3335 | 0.16 | 0.51 | YES |
| 27 | FGFR2 | FGFR2 | FGFR2 | 3834 | 0.14 | 0.49 | NO |
| 28 | ITPR2 | ITPR2 | ITPR2 | 4508 | 0.12 | 0.47 | NO |
| 29 | PRKCE | PRKCE | PRKCE | 4553 | 0.11 | 0.47 | NO |
| 30 | GAB1 | GAB1 | GAB1 | 4671 | 0.11 | 0.48 | NO |
| 31 | FGFR1 | FGFR1 | FGFR1 | 4709 | 0.11 | 0.48 | NO |
| 32 | PRKAR1B | PRKAR1B | PRKAR1B | 4825 | 0.11 | 0.49 | NO |
| 33 | PRKACB | PRKACB | PRKACB | 5133 | 0.097 | 0.48 | NO |
| 34 | ADCY9 | ADCY9 | ADCY9 | 5391 | 0.09 | 0.47 | NO |
| 35 | PRKAR2A | PRKAR2A | PRKAR2A | 5422 | 0.089 | 0.48 | NO |
| 36 | FRS2 | FRS2 | FRS2 | 5482 | 0.087 | 0.48 | NO |
| 37 | FOXO3 | FOXO3 | FOXO3 | 5512 | 0.086 | 0.49 | NO |
| 38 | RICTOR | RICTOR | RICTOR | 5990 | 0.076 | 0.47 | NO |
| 39 | FGFR4 | FGFR4 | FGFR4 | 6337 | 0.069 | 0.45 | NO |
| 40 | PTEN | PTEN | PTEN | 6361 | 0.068 | 0.46 | NO |
| 41 | CASP9 | CASP9 | CASP9 | 6428 | 0.067 | 0.46 | NO |
| 42 | CDKN1B | CDKN1B | CDKN1B | 6544 | 0.065 | 0.46 | NO |
| 43 | ADCY6 | ADCY6 | ADCY6 | 6875 | 0.058 | 0.44 | NO |
| 44 | FGFR3 | FGFR3 | FGFR3 | 6991 | 0.056 | 0.44 | NO |
| 45 | PRKAR2B | PRKAR2B | PRKAR2B | 7083 | 0.055 | 0.44 | NO |
| 46 | CREB1 | CREB1 | CREB1 | 7195 | 0.053 | 0.44 | NO |
| 47 | PPP2CB | PPP2CB | PPP2CB | 7290 | 0.051 | 0.44 | NO |
| 48 | CDKN1A | CDKN1A | CDKN1A | 7488 | 0.048 | 0.43 | NO |
| 49 | PIK3CA | PIK3CA | PIK3CA | 7603 | 0.047 | 0.43 | NO |
| 50 | CBL | CBL | CBL | 7884 | 0.042 | 0.42 | NO |
| 51 | PHLPP1 | PHLPP1 | PHLPP1 | 8131 | 0.038 | 0.41 | NO |
| 52 | ADCY3 | ADCY3 | ADCY3 | 8385 | 0.034 | 0.4 | NO |
| 53 | RPS27A | RPS27A | RPS27A | 8555 | 0.032 | 0.39 | NO |
| 54 | PRKAR1A | PRKAR1A | PRKAR1A | 8730 | 0.03 | 0.38 | NO |
| 55 | PDPK1 | PDPK1 | PDPK1 | 8838 | 0.028 | 0.38 | NO |
| 56 | MKNK1 | MKNK1 | MKNK1 | 8976 | 0.026 | 0.38 | NO |
| 57 | MTOR | MTOR | MTOR | 9043 | 0.026 | 0.37 | NO |
| 58 | SHC1 | SHC1 | SHC1 | 9127 | 0.024 | 0.37 | NO |
| 59 | FGF22 | FGF22 | FGF22 | 9973 | 0.014 | 0.33 | NO |
| 60 | THEM4 | THEM4 | THEM4 | 10129 | 0.012 | 0.32 | NO |
| 61 | TSC2 | TSC2 | TSC2 | 10208 | 0.011 | 0.32 | NO |
| 62 | SOS1 | SOS1 | SOS1 | 10229 | 0.011 | 0.32 | NO |
| 63 | MAPK1 | MAPK1 | MAPK1 | 10356 | 0.0092 | 0.31 | NO |
| 64 | BRAF | BRAF | BRAF | 10508 | 0.0072 | 0.3 | NO |
| 65 | BAD | BAD | BAD | 10804 | 0.004 | 0.28 | NO |
| 66 | AKT2 | AKT2 | AKT2 | 10984 | 0.0022 | 0.28 | NO |
| 67 | PLCG1 | PLCG1 | PLCG1 | 11071 | 0.0013 | 0.27 | NO |
| 68 | MAPK3 | MAPK3 | MAPK3 | 11179 | -0.00013 | 0.26 | NO |
| 69 | MDM2 | MDM2 | MDM2 | 11185 | -0.00018 | 0.26 | NO |
| 70 | ADCY8 | ADCY8 | ADCY8 | 11495 | -0.0039 | 0.25 | NO |
| 71 | NRAS | NRAS | NRAS | 11512 | -0.0041 | 0.25 | NO |
| 72 | FRS3 | FRS3 | FRS3 | 11519 | -0.0042 | 0.25 | NO |
| 73 | PPP2CA | PPP2CA | PPP2CA | 11573 | -0.0048 | 0.24 | NO |
| 74 | MAPKAP1 | MAPKAP1 | MAPKAP1 | 11721 | -0.0066 | 0.24 | NO |
| 75 | PRKACA | PRKACA | PRKACA | 11749 | -0.007 | 0.24 | NO |
| 76 | GRB2 | GRB2 | GRB2 | 12115 | -0.012 | 0.22 | NO |
| 77 | RAF1 | RAF1 | RAF1 | 12270 | -0.014 | 0.21 | NO |
| 78 | UBA52 | UBA52 | UBA52 | 12325 | -0.014 | 0.21 | NO |
| 79 | AKT1 | AKT1 | AKT1 | 12363 | -0.015 | 0.21 | NO |
| 80 | PPP2R1A | PPP2R1A | PPP2R1A | 12413 | -0.015 | 0.21 | NO |
| 81 | CHUK | CHUK | CHUK | 12459 | -0.016 | 0.2 | NO |
| 82 | CALM3 | CALM3 | CALM3 | 12482 | -0.016 | 0.21 | NO |
| 83 | MAP2K2 | MAP2K2 | MAP2K2 | 12523 | -0.017 | 0.2 | NO |
| 84 | ADRBK1 | ADRBK1 | ADRBK1 | 12603 | -0.018 | 0.2 | NO |
| 85 | KRAS | KRAS | KRAS | 12738 | -0.02 | 0.2 | NO |
| 86 | YWHAB | YWHAB | YWHAB | 12933 | -0.022 | 0.19 | NO |
| 87 | AKT1S1 | AKT1S1 | AKT1S1 | 13211 | -0.026 | 0.17 | NO |
| 88 | CALM1 | CALM1 | CALM1 | 13680 | -0.033 | 0.15 | NO |
| 89 | GSK3A | GSK3A | GSK3A | 13784 | -0.035 | 0.15 | NO |
| 90 | SRC | SRC | SRC | 13795 | -0.035 | 0.15 | NO |
| 91 | CALM2 | CALM2 | CALM2 | 13837 | -0.036 | 0.15 | NO |
| 92 | ADCY7 | ADCY7 | ADCY7 | 14085 | -0.039 | 0.14 | NO |
| 93 | PRKCD | PRKCD | PRKCD | 14248 | -0.042 | 0.14 | NO |
| 94 | TRIB3 | TRIB3 | TRIB3 | 14364 | -0.043 | 0.13 | NO |
| 95 | ITPR3 | ITPR3 | ITPR3 | 14501 | -0.046 | 0.13 | NO |
| 96 | MAP2K1 | MAP2K1 | MAP2K1 | 14607 | -0.048 | 0.13 | NO |
| 97 | MLST8 | MLST8 | MLST8 | 15131 | -0.056 | 0.1 | NO |
| 98 | HRAS | HRAS | HRAS | 16142 | -0.081 | 0.055 | NO |
| 99 | FGF5 | FGF5 | FGF5 | 16154 | -0.081 | 0.061 | NO |
| 100 | RPS6KB2 | RPS6KB2 | RPS6KB2 | 16368 | -0.089 | 0.057 | NO |
| 101 | FGF8 | FGF8 | FGF8 | 16758 | -0.11 | 0.045 | NO |
| 102 | PRKCG | PRKCG | PRKCG | 16911 | -0.12 | 0.046 | NO |
| 103 | CDK1 | CDK1 | CDK1 | 18137 | -0.34 | 0.0076 | NO |
Figure S59. Get High-res Image This plot shows mRNAseq_cNMF expression data heatmap (on the left) a RunningEnrichmentScore(RES) plot (on the top right) and a Signal2Noise(S2N) plot (on the bottom right) of genes in the pathway: KEGG BUTANOATE METABOLISM.
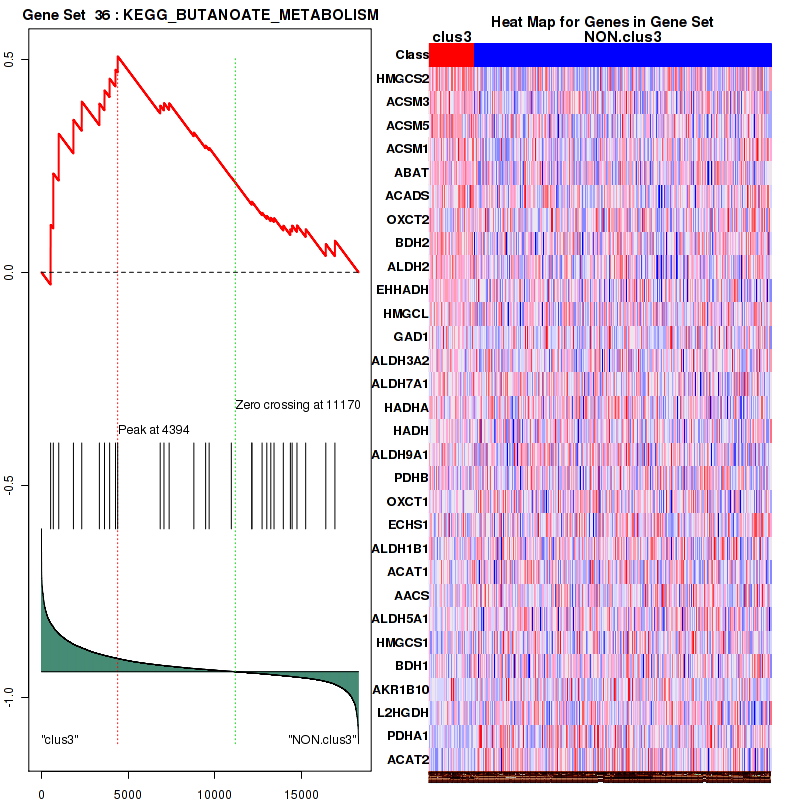
Figure S60. Get High-res Image For the top 5 core enriched genes in the pathway: KEGG BUTANOATE METABOLISM, this volcano plot shows how much they are up/down-regulated and significant. The significance was calculated by empirical bayesian fit
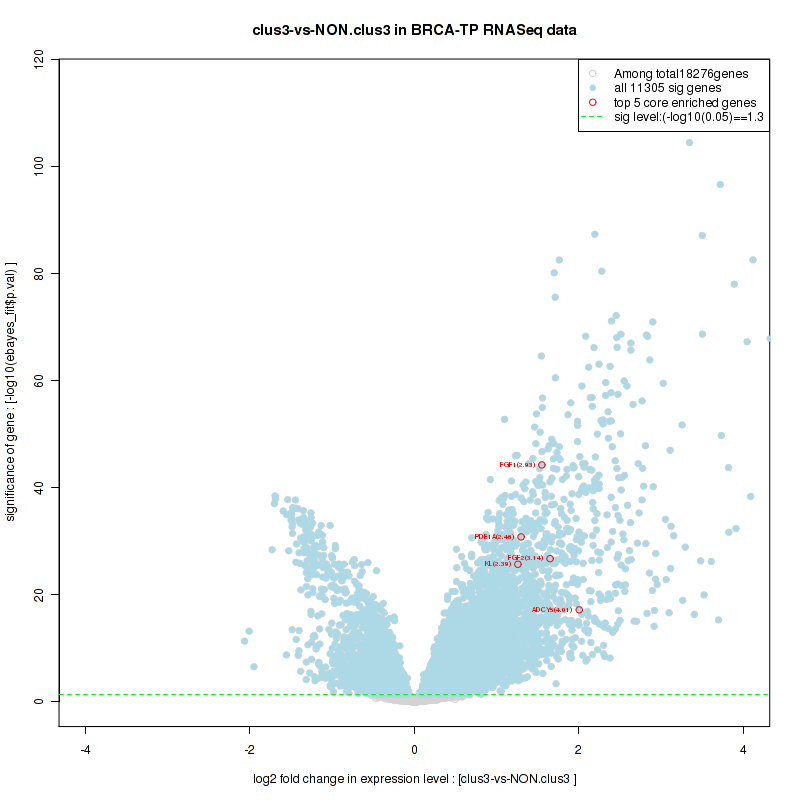
For the top enriched genes, if you want to check whether they are
-
up-regulated, please check the list of up-regulated genes
-
down-regulated, please check the list of down-regulated genes
For the top enriched genes, if you want to check whether they are
-
highly expressed genes, please check the list of high (top 30%) expressed genes
-
low expressed genes, please check the list of low (bottom 30%) expressed genes
An expression pattern of top(30%)/middle(30%)/low(30%) in this subtype against other subtypes is available in a heatmap
For the top enriched genes, if you want to check whether they are
-
significantly differently expressed genes by eBayes lm fit, please check the list of significant genes
Table 6. Get Full Table This table shows top 10 pathways which are significantly enriched in cluster clus4. It displays only significant gene sets satisfying nom.p.val.threshold (-1), fwer.p.val.threshold (-1) , fdr.q.val.threshold (0.25) and the default table is sorted by Normalized Enrichment Score (NES). Further details on NES statistics, please visit The Broad GSEA website.
| GeneSet(GS) | Size(#genes) | genes.ES.table | ES | NES | NOM.p.val | FDR.q.val | FWER.p.val | Tag.. | Gene.. | Signal | FDR..median. | glob.p.val |
|---|---|---|---|---|---|---|---|---|---|---|---|---|
| KEGG FATTY ACID METABOLISM | 39 | genes.ES.table | 0.35 | 1.1 | 0.37 | 1 | 1 | 0.46 | 0.26 | 0.34 | 1 | 0.95 |
| KEGG PURINE METABOLISM | 153 | genes.ES.table | 0.27 | 1.2 | 0.21 | 1 | 1 | 0.18 | 0.15 | 0.15 | 1 | 0.95 |
| KEGG ALANINE ASPARTATE AND GLUTAMATE METABOLISM | 31 | genes.ES.table | 0.44 | 1.4 | 0.067 | 1 | 1 | 0.26 | 0.1 | 0.23 | 1 | 0.87 |
| KEGG VALINE LEUCINE AND ISOLEUCINE DEGRADATION | 44 | genes.ES.table | 0.45 | 1.7 | 0.028 | 1 | 0.8 | 0.36 | 0.19 | 0.3 | 0.94 | 0.48 |
| KEGG PROPANOATE METABOLISM | 32 | genes.ES.table | 0.37 | 1.3 | 0.22 | 1 | 1 | 0.41 | 0.27 | 0.3 | 1 | 0.9 |
| KEGG BUTANOATE METABOLISM | 30 | genes.ES.table | 0.53 | 1.6 | 0.029 | 1 | 0.93 | 0.43 | 0.19 | 0.35 | 1 | 0.55 |
| KEGG PEROXISOME | 76 | genes.ES.table | 0.39 | 1.5 | 0.062 | 1 | 0.99 | 0.36 | 0.21 | 0.28 | 1 | 0.74 |
| ST GA13 PATHWAY | 35 | genes.ES.table | 0.36 | 1.3 | 0.13 | 1 | 1 | 0.17 | 0.08 | 0.16 | 1 | 0.87 |
| PID AR PATHWAY | 61 | genes.ES.table | 0.27 | 1.1 | 0.37 | 1 | 1 | 0.28 | 0.26 | 0.21 | 1 | 0.96 |
| PID TRAIL PATHWAY | 28 | genes.ES.table | 0.39 | 1.3 | 0.22 | 1 | 1 | 0.32 | 0.22 | 0.25 | 1 | 0.88 |
Table S31. Get Full Table This table shows a Running Enrichment Score (RES) of each gene in this pathway, that is, the enrichment score at this point in the ranked list of genes. All genes are ranked by Signal-to-Noise (S2N), a measure of similarity as default and are used to obtain ES matrix of all genes. In this way, GSEA tool uses expression pattern of not only overlapped genes but also not-overlapped genes to produce ES matrix.
| Rank | GENE | SYMBOL | DESC | LIST.LOC | S2N | RES | CORE_ENRICHMENT |
|---|---|---|---|---|---|---|---|
| 1 | ABAT | ABAT | ABAT | 85 | 0.47 | 0.12 | YES |
| 2 | HMGCS2 | HMGCS2 | HMGCS2 | 511 | 0.27 | 0.18 | YES |
| 3 | ACADSB | ACADSB | ACADSB | 766 | 0.23 | 0.22 | YES |
| 4 | ALDH6A1 | ALDH6A1 | ALDH6A1 | 1090 | 0.19 | 0.26 | YES |
| 5 | MCCC2 | MCCC2 | MCCC2 | 1339 | 0.16 | 0.29 | YES |
| 6 | HMGCL | HMGCL | HMGCL | 1856 | 0.13 | 0.3 | YES |
| 7 | ACADS | ACADS | ACADS | 2117 | 0.12 | 0.31 | YES |
| 8 | IVD | IVD | IVD | 2180 | 0.11 | 0.34 | YES |
| 9 | BCAT2 | BCAT2 | BCAT2 | 2427 | 0.1 | 0.36 | YES |
| 10 | AUH | AUH | AUH | 2737 | 0.09 | 0.36 | YES |
| 11 | ACAA1 | ACAA1 | ACAA1 | 2781 | 0.089 | 0.38 | YES |
| 12 | ACAT1 | ACAT1 | ACAT1 | 2919 | 0.085 | 0.4 | YES |
| 13 | BCKDHB | BCKDHB | BCKDHB | 3302 | 0.075 | 0.4 | YES |
| 14 | ALDH3A2 | ALDH3A2 | ALDH3A2 | 3326 | 0.074 | 0.42 | YES |
| 15 | MCEE | MCEE | MCEE | 3411 | 0.072 | 0.44 | YES |
| 16 | ALDH9A1 | ALDH9A1 | ALDH9A1 | 3497 | 0.07 | 0.45 | YES |
| 17 | ALDH2 | ALDH2 | ALDH2 | 4304 | 0.054 | 0.42 | NO |
| 18 | PCCB | PCCB | PCCB | 4544 | 0.049 | 0.42 | NO |
| 19 | OXCT2 | OXCT2 | OXCT2 | 4559 | 0.049 | 0.43 | NO |
| 20 | EHHADH | EHHADH | EHHADH | 4805 | 0.045 | 0.43 | NO |
| 21 | HIBCH | HIBCH | HIBCH | 4942 | 0.042 | 0.44 | NO |
| 22 | BCKDHA | BCKDHA | BCKDHA | 5202 | 0.039 | 0.43 | NO |
| 23 | PCCA | PCCA | PCCA | 5461 | 0.035 | 0.43 | NO |
| 24 | ACAD8 | ACAD8 | ACAD8 | 5470 | 0.035 | 0.44 | NO |
| 25 | HADHB | HADHB | HADHB | 5608 | 0.033 | 0.44 | NO |
| 26 | HADH | HADH | HADH | 6038 | 0.027 | 0.42 | NO |
| 27 | ECHS1 | ECHS1 | ECHS1 | 6618 | 0.02 | 0.4 | NO |
| 28 | AOX1 | AOX1 | AOX1 | 6794 | 0.018 | 0.39 | NO |
| 29 | ACADM | ACADM | ACADM | 6848 | 0.017 | 0.39 | NO |
| 30 | HADHA | HADHA | HADHA | 7273 | 0.012 | 0.37 | NO |
| 31 | HIBADH | HIBADH | HIBADH | 7416 | 0.01 | 0.37 | NO |
| 32 | MUT | MUT | MUT | 7882 | 0.0049 | 0.34 | NO |
| 33 | DBT | DBT | DBT | 8407 | -0.00059 | 0.32 | NO |
| 34 | ALDH7A1 | ALDH7A1 | ALDH7A1 | 9217 | -0.0095 | 0.27 | NO |
| 35 | ALDH1B1 | ALDH1B1 | ALDH1B1 | 10224 | -0.02 | 0.22 | NO |
| 36 | HSD17B10 | HSD17B10 | HSD17B10 | 10574 | -0.025 | 0.21 | NO |
| 37 | DLD | DLD | DLD | 10914 | -0.028 | 0.2 | NO |
| 38 | HMGCS1 | HMGCS1 | HMGCS1 | 13371 | -0.067 | 0.084 | NO |
| 39 | BCAT1 | BCAT1 | BCAT1 | 13461 | -0.068 | 0.098 | NO |
| 40 | ACAA2 | ACAA2 | ACAA2 | 13519 | -0.07 | 0.11 | NO |
| 41 | ACAT2 | ACAT2 | ACAT2 | 14139 | -0.084 | 0.1 | NO |
| 42 | MCCC1 | MCCC1 | MCCC1 | 14588 | -0.096 | 0.1 | NO |
| 43 | OXCT1 | OXCT1 | OXCT1 | 16424 | -0.17 | 0.05 | NO |
| 44 | IL4I1 | IL4I1 | IL4I1 | 16760 | -0.19 | 0.083 | NO |
Figure S61. Get High-res Image This plot shows mRNAseq_cNMF expression data heatmap (on the left) a RunningEnrichmentScore(RES) plot (on the top right) and a Signal2Noise(S2N) plot (on the bottom right) of genes in the pathway: KEGG FATTY ACID METABOLISM.
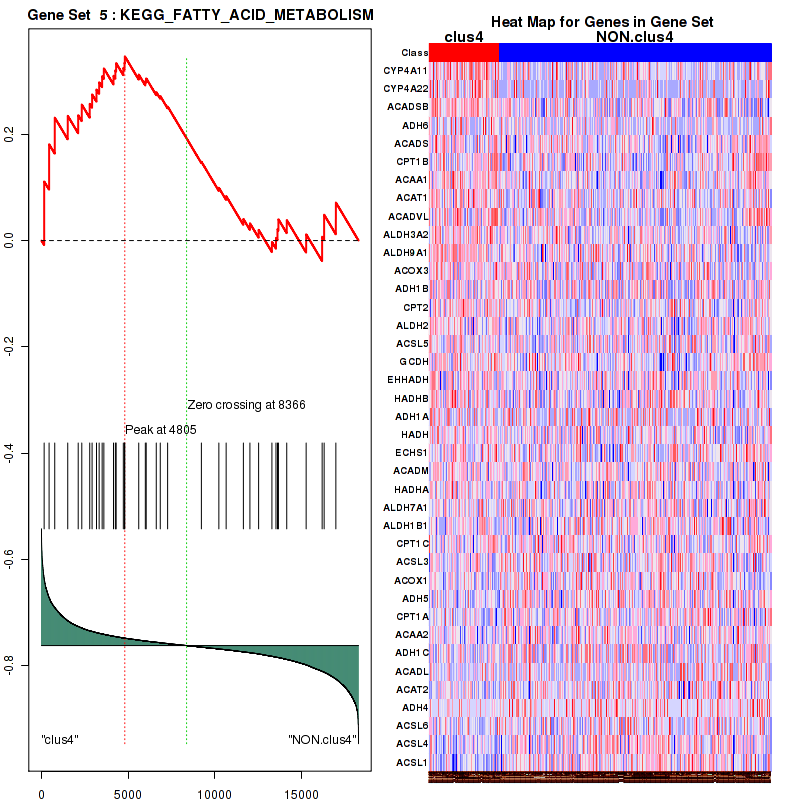
Figure S62. Get High-res Image For the top 5 core enriched genes in the pathway: KEGG FATTY ACID METABOLISM, this volcano plot shows how much they are up/down-regulated and significant. The significance was calculated by empirical bayesian fit
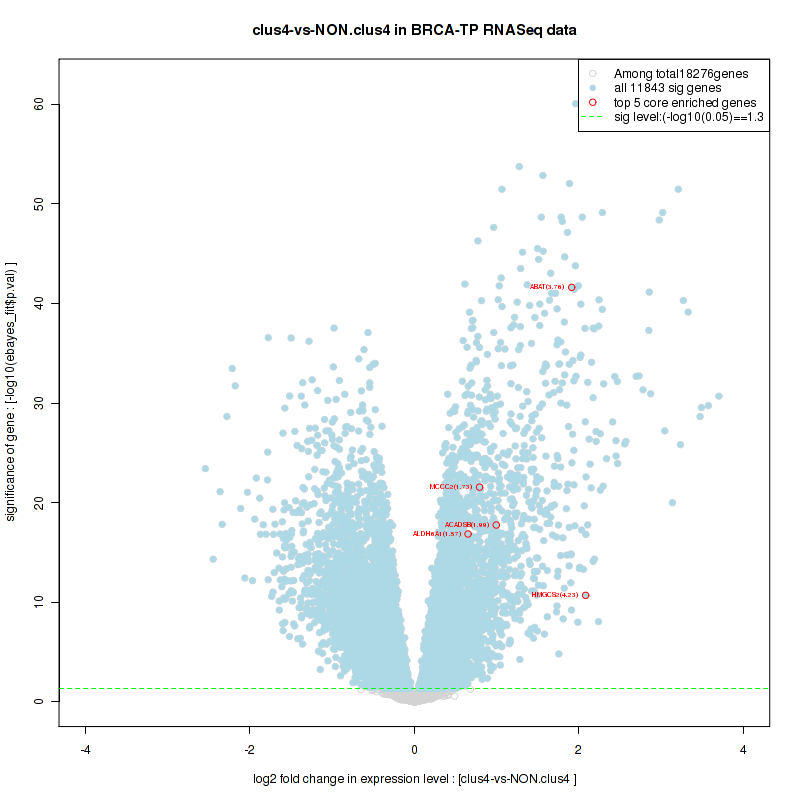
Table S32. Get Full Table This table shows a Running Enrichment Score (RES) of each gene in this pathway, that is, the enrichment score at this point in the ranked list of genes. All genes are ranked by Signal-to-Noise (S2N), a measure of similarity as default and are used to obtain ES matrix of all genes. In this way, GSEA tool uses expression pattern of not only overlapped genes but also not-overlapped genes to produce ES matrix.
| Rank | GENE | SYMBOL | DESC | LIST.LOC | S2N | RES | CORE_ENRICHMENT |
|---|---|---|---|---|---|---|---|
| 1 | ABAT | ABAT | ABAT | 85 | 0.47 | 0.14 | YES |
| 2 | GAD1 | GAD1 | GAD1 | 165 | 0.4 | 0.26 | YES |
| 3 | ACSM1 | ACSM1 | ACSM1 | 255 | 0.35 | 0.36 | YES |
| 4 | HMGCS2 | HMGCS2 | HMGCS2 | 511 | 0.27 | 0.42 | YES |
| 5 | HMGCL | HMGCL | HMGCL | 1856 | 0.13 | 0.39 | YES |
| 6 | ACSM5 | ACSM5 | ACSM5 | 1960 | 0.12 | 0.42 | YES |
| 7 | ACADS | ACADS | ACADS | 2117 | 0.12 | 0.45 | YES |
| 8 | BDH2 | BDH2 | BDH2 | 2377 | 0.1 | 0.47 | YES |
| 9 | PDHB | PDHB | PDHB | 2865 | 0.087 | 0.47 | YES |
| 10 | ACAT1 | ACAT1 | ACAT1 | 2919 | 0.085 | 0.49 | YES |
| 11 | BDH1 | BDH1 | BDH1 | 3227 | 0.077 | 0.5 | YES |
| 12 | ALDH3A2 | ALDH3A2 | ALDH3A2 | 3326 | 0.074 | 0.51 | YES |
| 13 | ALDH9A1 | ALDH9A1 | ALDH9A1 | 3497 | 0.07 | 0.52 | YES |
| 14 | ALDH2 | ALDH2 | ALDH2 | 4304 | 0.054 | 0.5 | NO |
| 15 | OXCT2 | OXCT2 | OXCT2 | 4559 | 0.049 | 0.5 | NO |
| 16 | EHHADH | EHHADH | EHHADH | 4805 | 0.045 | 0.5 | NO |
| 17 | HADH | HADH | HADH | 6038 | 0.027 | 0.44 | NO |
| 18 | ECHS1 | ECHS1 | ECHS1 | 6618 | 0.02 | 0.41 | NO |
| 19 | AACS | AACS | AACS | 7246 | 0.012 | 0.38 | NO |
| 20 | HADHA | HADHA | HADHA | 7273 | 0.012 | 0.38 | NO |
| 21 | ALDH7A1 | ALDH7A1 | ALDH7A1 | 9217 | -0.0095 | 0.28 | NO |
| 22 | L2HGDH | L2HGDH | L2HGDH | 9589 | -0.014 | 0.27 | NO |
| 23 | ALDH1B1 | ALDH1B1 | ALDH1B1 | 10224 | -0.02 | 0.24 | NO |
| 24 | ACSM3 | ACSM3 | ACSM3 | 13366 | -0.066 | 0.085 | NO |
| 25 | HMGCS1 | HMGCS1 | HMGCS1 | 13371 | -0.067 | 0.1 | NO |
| 26 | ACAT2 | ACAT2 | ACAT2 | 14139 | -0.084 | 0.089 | NO |
| 27 | ALDH5A1 | ALDH5A1 | ALDH5A1 | 14484 | -0.093 | 0.098 | NO |
| 28 | PDHA1 | PDHA1 | PDHA1 | 14552 | -0.095 | 0.12 | NO |
| 29 | AKR1B10 | AKR1B10 | AKR1B10 | 14615 | -0.096 | 0.15 | NO |
| 30 | OXCT1 | OXCT1 | OXCT1 | 16424 | -0.17 | 0.1 | NO |
Figure S63. Get High-res Image This plot shows mRNAseq_cNMF expression data heatmap (on the left) a RunningEnrichmentScore(RES) plot (on the top right) and a Signal2Noise(S2N) plot (on the bottom right) of genes in the pathway: KEGG PURINE METABOLISM.
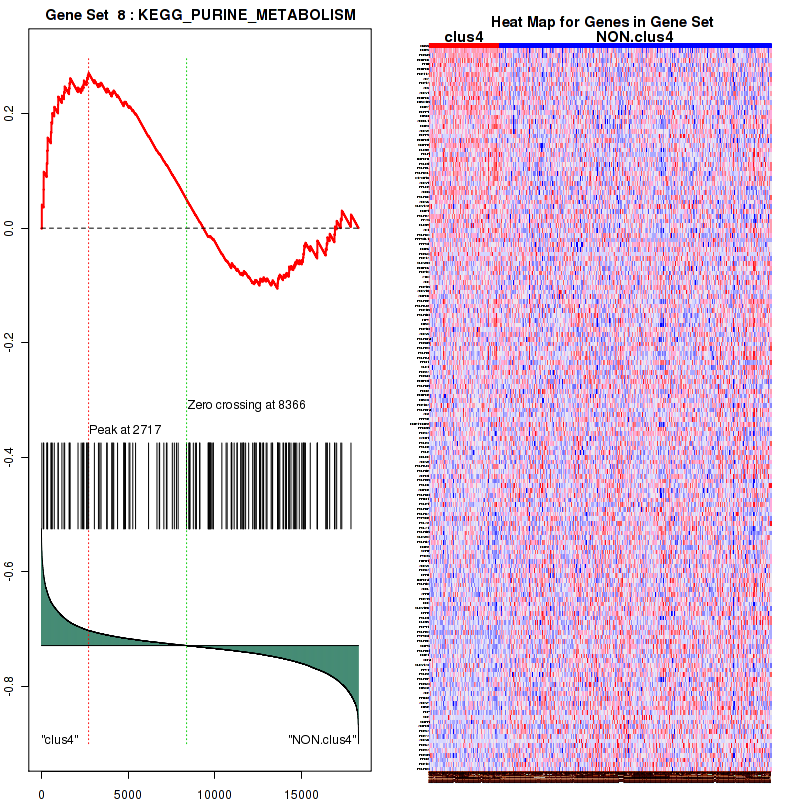
Figure S64. Get High-res Image For the top 5 core enriched genes in the pathway: KEGG PURINE METABOLISM, this volcano plot shows how much they are up/down-regulated and significant. The significance was calculated by empirical bayesian fit
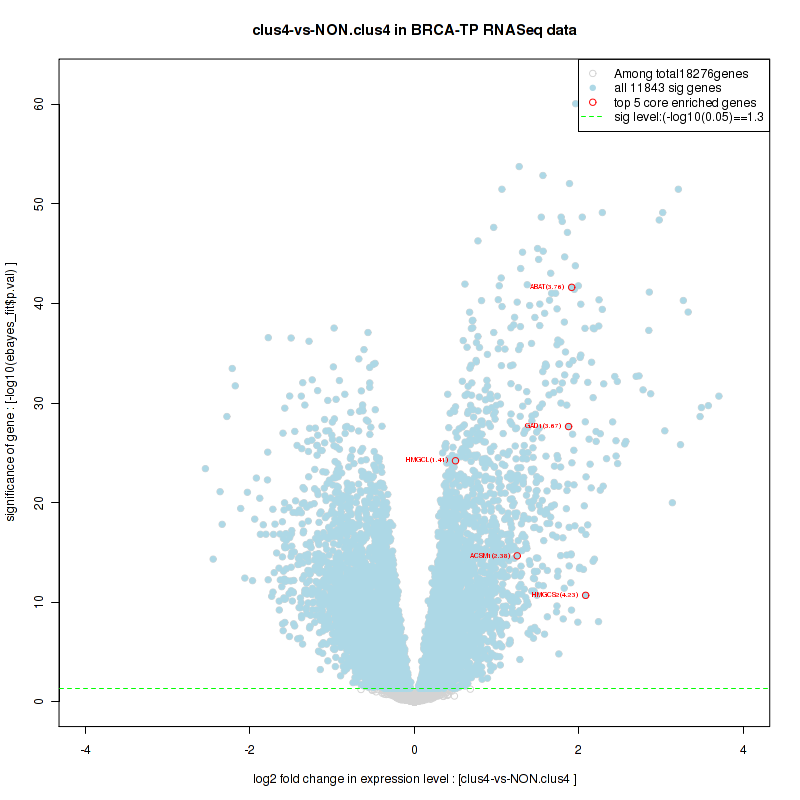
Table S33. Get Full Table This table shows a Running Enrichment Score (RES) of each gene in this pathway, that is, the enrichment score at this point in the ranked list of genes. All genes are ranked by Signal-to-Noise (S2N), a measure of similarity as default and are used to obtain ES matrix of all genes. In this way, GSEA tool uses expression pattern of not only overlapped genes but also not-overlapped genes to produce ES matrix.
| Rank | GENE | SYMBOL | DESC | LIST.LOC | S2N | RES | CORE_ENRICHMENT |
|---|---|---|---|---|---|---|---|
| 1 | ACOX2 | ACOX2 | ACOX2 | 174 | 0.39 | 0.045 | YES |
| 2 | DDO | DDO | DDO | 213 | 0.37 | 0.094 | YES |
| 3 | MPV17L | MPV17L | MPV17L | 401 | 0.3 | 0.12 | YES |
| 4 | CRAT | CRAT | CRAT | 468 | 0.28 | 0.16 | YES |
| 5 | EPHX2 | EPHX2 | EPHX2 | 481 | 0.28 | 0.2 | YES |
| 6 | PEX11G | PEX11G | PEX11G | 492 | 0.28 | 0.24 | YES |
| 7 | SLC27A2 | SLC27A2 | SLC27A2 | 537 | 0.26 | 0.27 | YES |
| 8 | NUDT12 | NUDT12 | NUDT12 | 918 | 0.21 | 0.28 | YES |
| 9 | CROT | CROT | CROT | 929 | 0.21 | 0.31 | YES |
| 10 | PEX11A | PEX11A | PEX11A | 1445 | 0.16 | 0.3 | YES |
| 11 | PEX12 | PEX12 | PEX12 | 1759 | 0.13 | 0.3 | YES |
| 12 | HMGCL | HMGCL | HMGCL | 1856 | 0.13 | 0.32 | YES |
| 13 | DECR2 | DECR2 | DECR2 | 1890 | 0.13 | 0.33 | YES |
| 14 | PEX7 | PEX7 | PEX7 | 1986 | 0.12 | 0.34 | YES |
| 15 | HSD17B4 | HSD17B4 | HSD17B4 | 2076 | 0.12 | 0.35 | YES |
| 16 | PXMP4 | PXMP4 | PXMP4 | 2486 | 0.099 | 0.34 | YES |
| 17 | PEX11B | PEX11B | PEX11B | 2557 | 0.096 | 0.35 | YES |
| 18 | PMVK | PMVK | PMVK | 2577 | 0.096 | 0.37 | YES |
| 19 | ACAA1 | ACAA1 | ACAA1 | 2781 | 0.089 | 0.37 | YES |
| 20 | ABCD3 | ABCD3 | ABCD3 | 3142 | 0.079 | 0.36 | YES |
| 21 | DHRS4 | DHRS4 | DHRS4 | 3183 | 0.078 | 0.37 | YES |
| 22 | PEX19 | PEX19 | PEX19 | 3217 | 0.077 | 0.38 | YES |
| 23 | PECR | PECR | PECR | 3355 | 0.073 | 0.38 | YES |
| 24 | PAOX | PAOX | PAOX | 3470 | 0.071 | 0.38 | YES |
| 25 | ACOX3 | ACOX3 | ACOX3 | 3596 | 0.068 | 0.38 | YES |
| 26 | HACL1 | HACL1 | HACL1 | 3684 | 0.066 | 0.39 | YES |
| 27 | ABCD4 | ABCD4 | ABCD4 | 3809 | 0.063 | 0.39 | YES |
| 28 | GNPAT | GNPAT | GNPAT | 4137 | 0.057 | 0.38 | NO |
| 29 | AMACR | AMACR | AMACR | 4219 | 0.055 | 0.38 | NO |
| 30 | AGPS | AGPS | AGPS | 4528 | 0.05 | 0.37 | NO |
| 31 | ACSL5 | ACSL5 | ACSL5 | 4719 | 0.046 | 0.37 | NO |
| 32 | EHHADH | EHHADH | EHHADH | 4805 | 0.045 | 0.37 | NO |
| 33 | PEX6 | PEX6 | PEX6 | 4970 | 0.042 | 0.37 | NO |
| 34 | PEX10 | PEX10 | PEX10 | 4972 | 0.042 | 0.37 | NO |
| 35 | CAT | CAT | CAT | 5256 | 0.038 | 0.36 | NO |
| 36 | SCP2 | SCP2 | SCP2 | 5271 | 0.038 | 0.37 | NO |
| 37 | GSTK1 | GSTK1 | GSTK1 | 5548 | 0.034 | 0.36 | NO |
| 38 | PXMP2 | PXMP2 | PXMP2 | 5583 | 0.033 | 0.36 | NO |
| 39 | PEX16 | PEX16 | PEX16 | 5671 | 0.032 | 0.36 | NO |
| 40 | MPV17 | MPV17 | MPV17 | 5738 | 0.031 | 0.36 | NO |
| 41 | ECH1 | ECH1 | ECH1 | 6586 | 0.02 | 0.32 | NO |
| 42 | PEX14 | PEX14 | PEX14 | 6703 | 0.019 | 0.31 | NO |
| 43 | PEX1 | PEX1 | PEX1 | 7146 | 0.014 | 0.29 | NO |
| 44 | PEX5 | PEX5 | PEX5 | 8437 | -0.00086 | 0.22 | NO |
| 45 | HAO2 | HAO2 | HAO2 | 9033 | -0.0074 | 0.19 | NO |
| 46 | PEX2 | PEX2 | PEX2 | 9377 | -0.011 | 0.17 | NO |
| 47 | FAR1 | FAR1 | FAR1 | 9653 | -0.014 | 0.16 | NO |
| 48 | PEX26 | PEX26 | PEX26 | 10110 | -0.019 | 0.14 | NO |
| 49 | MLYCD | MLYCD | MLYCD | 10135 | -0.019 | 0.14 | NO |
| 50 | PRDX5 | PRDX5 | PRDX5 | 10235 | -0.021 | 0.14 | NO |
| 51 | SLC25A17 | SLC25A17 | SLC25A17 | 10312 | -0.021 | 0.13 | NO |
| 52 | ACOT8 | ACOT8 | ACOT8 | 10360 | -0.022 | 0.13 | NO |
| 53 | SOD1 | SOD1 | SOD1 | 10400 | -0.022 | 0.14 | NO |
| 54 | PHYH | PHYH | PHYH | 10758 | -0.026 | 0.12 | NO |
| 55 | PEX3 | PEX3 | PEX3 | 10811 | -0.027 | 0.12 | NO |
| 56 | DAO | DAO | DAO | 11256 | -0.033 | 0.1 | NO |
| 57 | PEX13 | PEX13 | PEX13 | 11370 | -0.035 | 0.099 | NO |
| 58 | ACSL3 | ACSL3 | ACSL3 | 11638 | -0.038 | 0.089 | NO |
| 59 | ACOX1 | ACOX1 | ACOX1 | 12017 | -0.043 | 0.074 | NO |
| 60 | PRDX1 | PRDX1 | PRDX1 | 12536 | -0.051 | 0.053 | NO |
| 61 | IDH2 | IDH2 | IDH2 | 12570 | -0.052 | 0.058 | NO |
| 62 | IDH1 | IDH1 | IDH1 | 12861 | -0.057 | 0.05 | NO |
| 63 | AGXT | AGXT | AGXT | 12947 | -0.059 | 0.054 | NO |
| 64 | FAR2 | FAR2 | FAR2 | 13205 | -0.063 | 0.048 | NO |
| 65 | SOD2 | SOD2 | SOD2 | 13900 | -0.078 | 0.021 | NO |
| 66 | MVK | MVK | MVK | 14015 | -0.081 | 0.026 | NO |
| 67 | XDH | XDH | XDH | 14584 | -0.096 | 0.008 | NO |
| 68 | NOS2 | NOS2 | NOS2 | 14919 | -0.11 | 0.0043 | NO |
| 69 | ABCD1 | ABCD1 | ABCD1 | 15034 | -0.11 | 0.013 | NO |
| 70 | NUDT19 | NUDT19 | NUDT19 | 15145 | -0.11 | 0.023 | NO |
| 71 | PIPOX | PIPOX | PIPOX | 16049 | -0.15 | -0.0062 | NO |
| 72 | ACSL6 | ACSL6 | ACSL6 | 16179 | -0.16 | 0.0082 | NO |
| 73 | ACSL4 | ACSL4 | ACSL4 | 16294 | -0.16 | 0.024 | NO |
| 74 | ABCD2 | ABCD2 | ABCD2 | 16619 | -0.18 | 0.031 | NO |
| 75 | ACSL1 | ACSL1 | ACSL1 | 16970 | -0.2 | 0.04 | NO |
| 76 | BAAT | BAAT | BAAT | 17271 | -0.23 | 0.055 | NO |
Figure S65. Get High-res Image This plot shows mRNAseq_cNMF expression data heatmap (on the left) a RunningEnrichmentScore(RES) plot (on the top right) and a Signal2Noise(S2N) plot (on the bottom right) of genes in the pathway: KEGG ALANINE ASPARTATE AND GLUTAMATE METABOLISM.
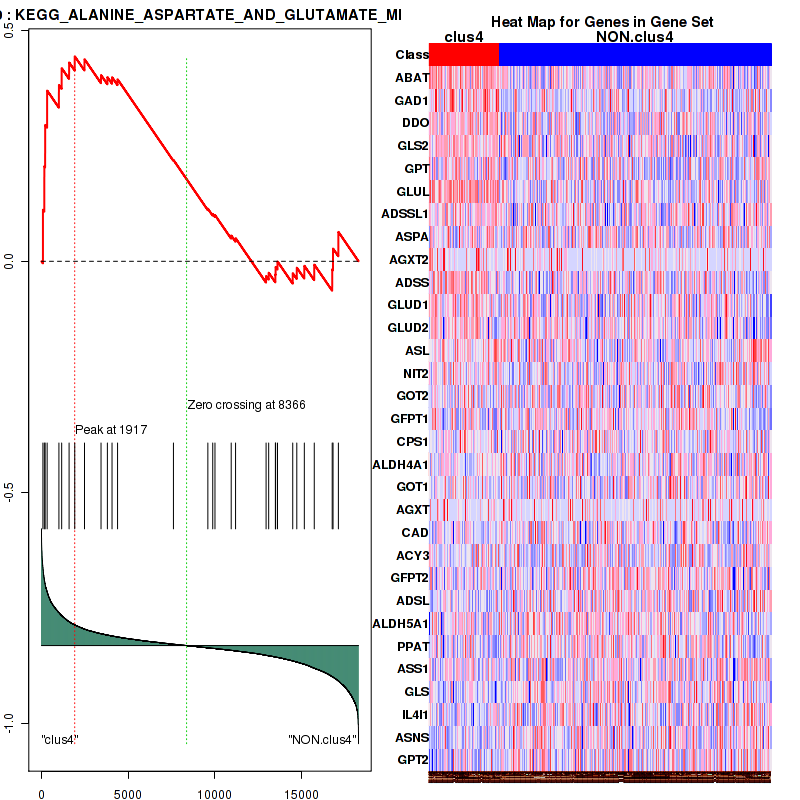
Figure S66. Get High-res Image For the top 5 core enriched genes in the pathway: KEGG ALANINE ASPARTATE AND GLUTAMATE METABOLISM, this volcano plot shows how much they are up/down-regulated and significant. The significance was calculated by empirical bayesian fit
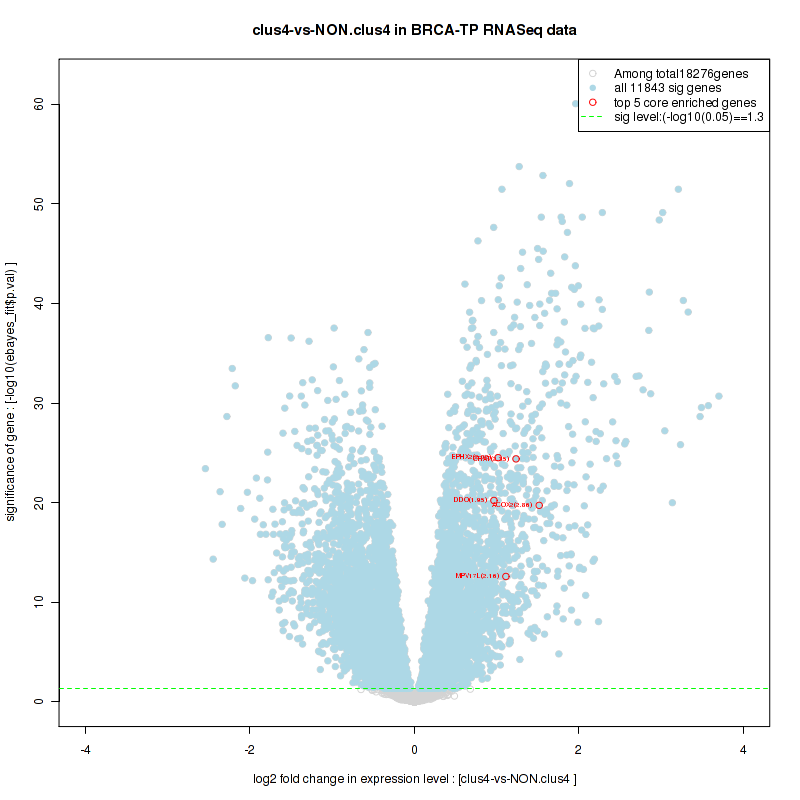
Table S34. Get Full Table This table shows a Running Enrichment Score (RES) of each gene in this pathway, that is, the enrichment score at this point in the ranked list of genes. All genes are ranked by Signal-to-Noise (S2N), a measure of similarity as default and are used to obtain ES matrix of all genes. In this way, GSEA tool uses expression pattern of not only overlapped genes but also not-overlapped genes to produce ES matrix.
| Rank | GENE | SYMBOL | DESC | LIST.LOC | S2N | RES | CORE_ENRICHMENT |
|---|---|---|---|---|---|---|---|
| 1 | ABAT | ABAT | ABAT | 85 | 0.47 | 0.11 | YES |
| 2 | GAD1 | GAD1 | GAD1 | 165 | 0.4 | 0.21 | YES |
| 3 | DDO | DDO | DDO | 213 | 0.37 | 0.3 | YES |
| 4 | GLS2 | GLS2 | GLS2 | 327 | 0.32 | 0.37 | YES |
| 5 | GPT | GPT | GPT | 1006 | 0.2 | 0.38 | YES |
| 6 | GLUL | GLUL | GLUL | 1164 | 0.18 | 0.42 | YES |
| 7 | ADSSL1 | ADSSL1 | ADSSL1 | 1593 | 0.14 | 0.43 | YES |
| 8 | ASPA | ASPA | ASPA | 1917 | 0.12 | 0.44 | YES |
| 9 | AGXT2 | AGXT2 | AGXT2 | 2481 | 0.1 | 0.44 | NO |
| 10 | ADSS | ADSS | ADSS | 3432 | 0.072 | 0.4 | NO |
| 11 | GLUD1 | GLUD1 | GLUD1 | 3801 | 0.064 | 0.4 | NO |
| 12 | GLUD2 | GLUD2 | GLUD2 | 4069 | 0.058 | 0.4 | NO |
| 13 | ASL | ASL | ASL | 4385 | 0.052 | 0.39 | NO |
| 14 | NIT2 | NIT2 | NIT2 | 7608 | 0.0082 | 0.22 | NO |
| 15 | GOT2 | GOT2 | GOT2 | 9590 | -0.014 | 0.11 | NO |
| 16 | GFPT1 | GFPT1 | GFPT1 | 9872 | -0.017 | 0.1 | NO |
| 17 | CPS1 | CPS1 | CPS1 | 10000 | -0.018 | 0.1 | NO |
| 18 | ALDH4A1 | ALDH4A1 | ALDH4A1 | 10936 | -0.029 | 0.056 | NO |
| 19 | GOT1 | GOT1 | GOT1 | 11189 | -0.032 | 0.05 | NO |
| 20 | AGXT | AGXT | AGXT | 12947 | -0.059 | -0.032 | NO |
| 21 | CAD | CAD | CAD | 13097 | -0.061 | -0.025 | NO |
| 22 | ACY3 | ACY3 | ACY3 | 13483 | -0.069 | -0.029 | NO |
| 23 | GFPT2 | GFPT2 | GFPT2 | 13497 | -0.069 | -0.012 | NO |
| 24 | ADSL | ADSL | ADSL | 13605 | -0.071 | -0.0004 | NO |
| 25 | ALDH5A1 | ALDH5A1 | ALDH5A1 | 14484 | -0.093 | -0.026 | NO |
| 26 | PPAT | PPAT | PPAT | 14717 | -0.099 | -0.014 | NO |
| 27 | ASS1 | ASS1 | ASS1 | 15152 | -0.11 | -0.0096 | NO |
| 28 | GLS | GLS | GLS | 15724 | -0.14 | -0.007 | NO |
| 29 | IL4I1 | IL4I1 | IL4I1 | 16760 | -0.19 | -0.017 | NO |
| 30 | ASNS | ASNS | ASNS | 16806 | -0.19 | 0.028 | NO |
| 31 | GPT2 | GPT2 | GPT2 | 17115 | -0.21 | 0.064 | NO |
Figure S67. Get High-res Image This plot shows mRNAseq_cNMF expression data heatmap (on the left) a RunningEnrichmentScore(RES) plot (on the top right) and a Signal2Noise(S2N) plot (on the bottom right) of genes in the pathway: KEGG VALINE LEUCINE AND ISOLEUCINE DEGRADATION.
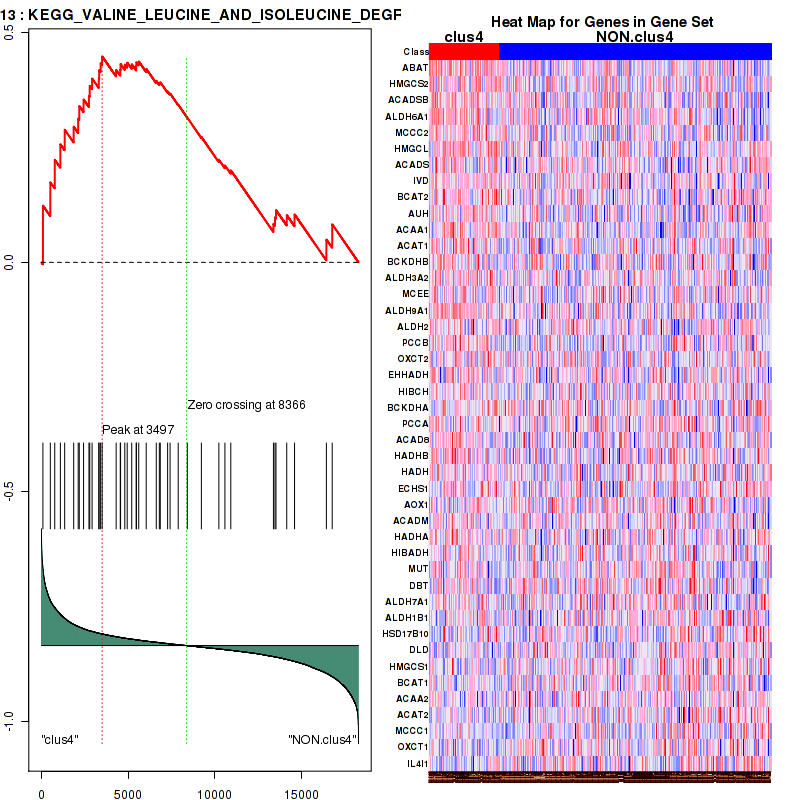
Figure S68. Get High-res Image For the top 5 core enriched genes in the pathway: KEGG VALINE LEUCINE AND ISOLEUCINE DEGRADATION, this volcano plot shows how much they are up/down-regulated and significant. The significance was calculated by empirical bayesian fit
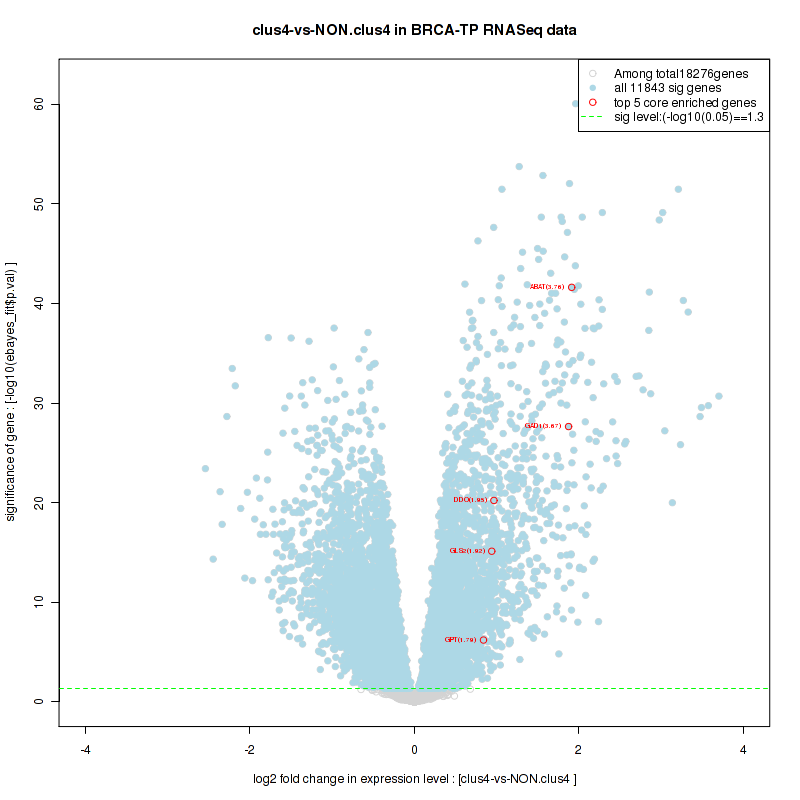
Table S35. Get Full Table This table shows a Running Enrichment Score (RES) of each gene in this pathway, that is, the enrichment score at this point in the ranked list of genes. All genes are ranked by Signal-to-Noise (S2N), a measure of similarity as default and are used to obtain ES matrix of all genes. In this way, GSEA tool uses expression pattern of not only overlapped genes but also not-overlapped genes to produce ES matrix.
| Rank | GENE | SYMBOL | DESC | LIST.LOC | S2N | RES | CORE_ENRICHMENT |
|---|---|---|---|---|---|---|---|
| 1 | TFF1 | TFF1 | TFF1 | 120 | 0.43 | 0.089 | YES |
| 2 | ESR1 | ESR1 | ESR1 | 135 | 0.42 | 0.18 | YES |
| 3 | AR | AR | AR | 344 | 0.32 | 0.24 | YES |
| 4 | FOXA1 | FOXA1 | FOXA1 | 362 | 0.31 | 0.31 | YES |
| 5 | NKX3-1 | NKX3-1 | NKX3-1 | 409 | 0.3 | 0.37 | YES |
| 6 | SERPINA1 | SERPINA1 | SERPINA1 | 647 | 0.25 | 0.41 | YES |
| 7 | NFIA | NFIA | NFIA | 861 | 0.22 | 0.45 | YES |
| 8 | XBP1 | XBP1 | XBP1 | 1233 | 0.17 | 0.47 | YES |
| 9 | NR2F2 | NR2F2 | NR2F2 | 2357 | 0.1 | 0.43 | NO |
| 10 | NRIP1 | NRIP1 | NRIP1 | 2513 | 0.098 | 0.44 | NO |
| 11 | FOS | FOS | FOS | 2622 | 0.094 | 0.46 | NO |
| 12 | FOXA3 | FOXA3 | FOXA3 | 3232 | 0.076 | 0.44 | NO |
| 13 | NFIC | NFIC | NFIC | 3304 | 0.075 | 0.45 | NO |
| 14 | CDKN1B | CDKN1B | CDKN1B | 3830 | 0.063 | 0.44 | NO |
| 15 | C4BPB | C4BPB | C4BPB | 3943 | 0.06 | 0.44 | NO |
| 16 | CREBBP | CREBBP | CREBBP | 4640 | 0.047 | 0.42 | NO |
| 17 | POU2F1 | POU2F1 | POU2F1 | 4797 | 0.045 | 0.42 | NO |
| 18 | JUN | JUN | JUN | 5067 | 0.041 | 0.41 | NO |
| 19 | SP1 | SP1 | SP1 | 5716 | 0.031 | 0.38 | NO |
| 20 | PISD | PISD | PISD | 6275 | 0.024 | 0.36 | NO |
| 21 | NDUFV3 | NDUFV3 | NDUFV3 | 7865 | 0.0052 | 0.27 | NO |
| 22 | BRCA1 | BRCA1 | BRCA1 | 8060 | 0.0032 | 0.26 | NO |
| 23 | SFTPD | SFTPD | SFTPD | 8711 | -0.0038 | 0.23 | NO |
| 24 | EP300 | EP300 | EP300 | 9686 | -0.015 | 0.18 | NO |
| 25 | ATP5J | ATP5J | ATP5J | 9747 | -0.015 | 0.18 | NO |
| 26 | AP1B1 | AP1B1 | AP1B1 | 10240 | -0.021 | 0.16 | NO |
| 27 | SOD1 | SOD1 | SOD1 | 10400 | -0.022 | 0.15 | NO |
| 28 | COL18A1 | COL18A1 | COL18A1 | 10481 | -0.023 | 0.15 | NO |
| 29 | PRDM15 | PRDM15 | PRDM15 | 11011 | -0.03 | 0.13 | NO |
| 30 | KLK3 | KLK3 | KLK3 | 11902 | -0.042 | 0.09 | NO |
| 31 | SHH | SHH | SHH | 13935 | -0.078 | -0.004 | NO |
| 32 | DSCAM | DSCAM | DSCAM | 13943 | -0.079 | 0.013 | NO |
| 33 | APOB | APOB | APOB | 14158 | -0.084 | 0.02 | NO |
| 34 | NCOA3 | NCOA3 | NCOA3 | 14415 | -0.091 | 0.026 | NO |
| 35 | SFTPA2 | SFTPA2 | SFTPA2 | 14788 | -0.1 | 0.028 | NO |
| 36 | VTN | VTN | VTN | 14793 | -0.1 | 0.05 | NO |
| 37 | CEBPB | CEBPB | CEBPB | 15469 | -0.12 | 0.041 | NO |
| 38 | NFIB | NFIB | NFIB | 17388 | -0.24 | -0.012 | NO |
| 39 | CYP2C18 | CYP2C18 | CYP2C18 | 17674 | -0.27 | 0.033 | NO |
Figure S69. Get High-res Image This plot shows mRNAseq_cNMF expression data heatmap (on the left) a RunningEnrichmentScore(RES) plot (on the top right) and a Signal2Noise(S2N) plot (on the bottom right) of genes in the pathway: KEGG PROPANOATE METABOLISM.
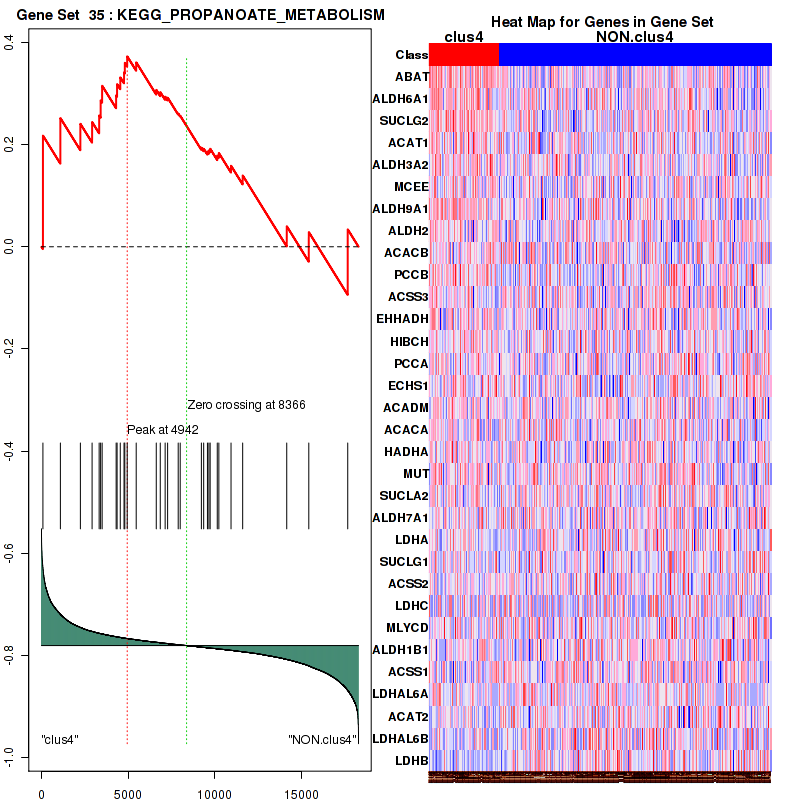
Figure S70. Get High-res Image For the top 5 core enriched genes in the pathway: KEGG PROPANOATE METABOLISM, this volcano plot shows how much they are up/down-regulated and significant. The significance was calculated by empirical bayesian fit

Table S36. Get Full Table This table shows a Running Enrichment Score (RES) of each gene in this pathway, that is, the enrichment score at this point in the ranked list of genes. All genes are ranked by Signal-to-Noise (S2N), a measure of similarity as default and are used to obtain ES matrix of all genes. In this way, GSEA tool uses expression pattern of not only overlapped genes but also not-overlapped genes to produce ES matrix.
| Rank | GENE | SYMBOL | DESC | LIST.LOC | S2N | RES | CORE_ENRICHMENT |
|---|---|---|---|---|---|---|---|
| 1 | CFB | CFB | CFB | 178 | 0.39 | 0.12 | YES |
| 2 | BCL2 | BCL2 | BCL2 | 706 | 0.24 | 0.16 | YES |
| 3 | SERPINA4 | SERPINA4 | SERPINA4 | 795 | 0.22 | 0.23 | YES |
| 4 | DLG4 | DLG4 | DLG4 | 1109 | 0.19 | 0.28 | YES |
| 5 | MAP3K1 | MAP3K1 | MAP3K1 | 1434 | 0.16 | 0.31 | YES |
| 6 | MAP2K4 | MAP2K4 | MAP2K4 | 1461 | 0.15 | 0.36 | YES |
| 7 | PLD2 | PLD2 | PLD2 | 3510 | 0.07 | 0.27 | NO |
| 8 | NFKB1 | NFKB1 | NFKB1 | 4032 | 0.059 | 0.26 | NO |
| 9 | ARHGEF11 | ARHGEF11 | ARHGEF11 | 5051 | 0.041 | 0.22 | NO |
| 10 | NFKBIA | NFKBIA | NFKBIA | 6212 | 0.025 | 0.16 | NO |
| 11 | NFKBIL1 | NFKBIL1 | NFKBIL1 | 6975 | 0.016 | 0.12 | NO |
| 12 | PHKA2 | PHKA2 | PHKA2 | 7030 | 0.015 | 0.13 | NO |
| 13 | ROCK1 | ROCK1 | ROCK1 | 7982 | 0.004 | 0.076 | NO |
| 14 | NFKB2 | NFKB2 | NFKB2 | 8274 | 0.001 | 0.061 | NO |
| 15 | AKT1 | AKT1 | AKT1 | 8403 | -0.00055 | 0.054 | NO |
| 16 | CDC42 | CDC42 | CDC42 | 8405 | -0.00056 | 0.054 | NO |
| 17 | AKT2 | AKT2 | AKT2 | 9011 | -0.0071 | 0.023 | NO |
| 18 | IKBKG | IKBKG | IKBKG | 9397 | -0.011 | 0.0056 | NO |
| 19 | NFKBIE | NFKBIE | NFKBIE | 10213 | -0.02 | -0.032 | NO |
| 20 | PIK3CB | PIK3CB | PIK3CB | 10234 | -0.021 | -0.027 | NO |
| 21 | TBXA2R | TBXA2R | TBXA2R | 11026 | -0.03 | -0.06 | NO |
| 22 | NFKBIB | NFKBIB | NFKBIB | 11319 | -0.034 | -0.065 | NO |
| 23 | PLD3 | PLD3 | PLD3 | 11655 | -0.038 | -0.071 | NO |
| 24 | AKT3 | AKT3 | AKT3 | 11975 | -0.042 | -0.075 | NO |
| 25 | MAPK8 | MAPK8 | MAPK8 | 12211 | -0.046 | -0.073 | NO |
| 26 | SRF | SRF | SRF | 12690 | -0.054 | -0.082 | NO |
| 27 | RDX | RDX | RDX | 12789 | -0.056 | -0.069 | NO |
| 28 | PTK2 | PTK2 | PTK2 | 12857 | -0.057 | -0.054 | NO |
| 29 | GNA13 | GNA13 | GNA13 | 13247 | -0.064 | -0.055 | NO |
| 30 | MAP3K5 | MAP3K5 | MAP3K5 | 14033 | -0.081 | -0.071 | NO |
| 31 | PRKD1 | PRKD1 | PRKD1 | 14628 | -0.097 | -0.072 | NO |
| 32 | ROCK2 | ROCK2 | ROCK2 | 14680 | -0.098 | -0.043 | NO |
| 33 | PDK1 | PDK1 | PDK1 | 15443 | -0.12 | -0.045 | NO |
| 34 | PLD1 | PLD1 | PLD1 | 16427 | -0.17 | -0.044 | NO |
| 35 | PI3 | PI3 | PI3 | 18251 | -0.45 | 0.0014 | NO |
Figure S71. Get High-res Image This plot shows mRNAseq_cNMF expression data heatmap (on the left) a RunningEnrichmentScore(RES) plot (on the top right) and a Signal2Noise(S2N) plot (on the bottom right) of genes in the pathway: KEGG BUTANOATE METABOLISM.
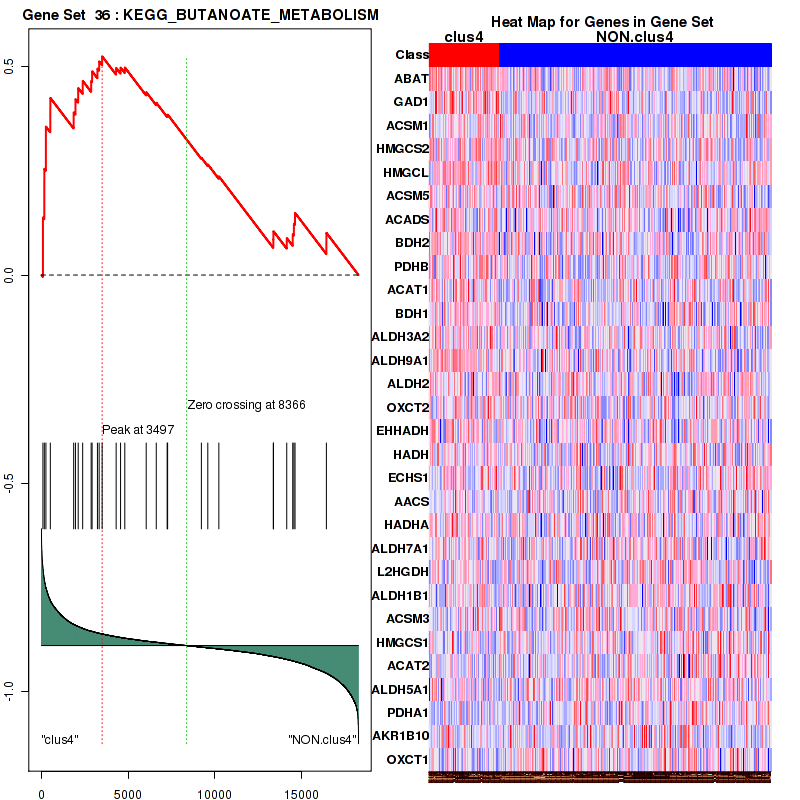
Figure S72. Get High-res Image For the top 5 core enriched genes in the pathway: KEGG BUTANOATE METABOLISM, this volcano plot shows how much they are up/down-regulated and significant. The significance was calculated by empirical bayesian fit
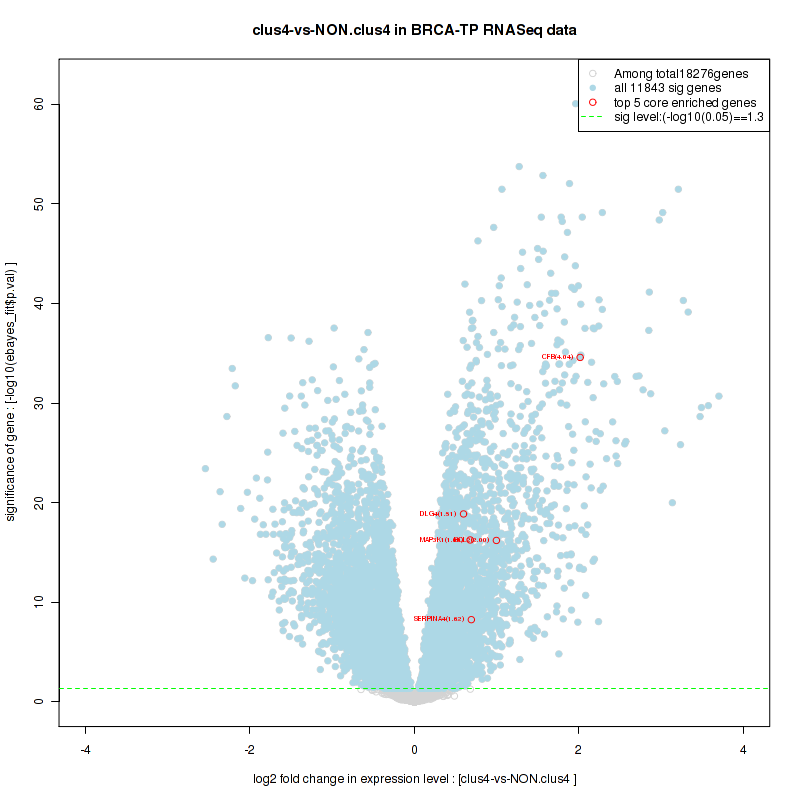
Table S37. Get Full Table This table shows a Running Enrichment Score (RES) of each gene in this pathway, that is, the enrichment score at this point in the ranked list of genes. All genes are ranked by Signal-to-Noise (S2N), a measure of similarity as default and are used to obtain ES matrix of all genes. In this way, GSEA tool uses expression pattern of not only overlapped genes but also not-overlapped genes to produce ES matrix.
| Rank | GENE | SYMBOL | DESC | LIST.LOC | S2N | RES | CORE_ENRICHMENT |
|---|---|---|---|---|---|---|---|
| 1 | SEMA6D | SEMA6D | SEMA6D | 1082 | 0.19 | 0.047 | YES |
| 2 | PIGH | PIGH | PIGH | 1788 | 0.13 | 0.082 | YES |
| 3 | PIGQ | PIGQ | PIGQ | 1791 | 0.13 | 0.16 | YES |
| 4 | PIGV | PIGV | PIGV | 1984 | 0.12 | 0.21 | YES |
| 5 | PIGB | PIGB | PIGB | 2103 | 0.12 | 0.27 | YES |
| 6 | DPM3 | DPM3 | DPM3 | 3268 | 0.076 | 0.25 | YES |
| 7 | PIGM | PIGM | PIGM | 3652 | 0.067 | 0.27 | YES |
| 8 | PIGN | PIGN | PIGN | 3720 | 0.065 | 0.3 | YES |
| 9 | PIGX | PIGX | PIGX | 4222 | 0.055 | 0.3 | YES |
| 10 | PIGC | PIGC | PIGC | 4530 | 0.05 | 0.32 | YES |
| 11 | PIGG | PIGG | PIGG | 4729 | 0.046 | 0.33 | YES |
| 12 | PIGL | PIGL | PIGL | 4867 | 0.044 | 0.35 | YES |
| 13 | PIGT | PIGT | PIGT | 5084 | 0.04 | 0.36 | YES |
| 14 | PIGK | PIGK | PIGK | 5502 | 0.034 | 0.36 | NO |
| 15 | PIGO | PIGO | PIGO | 6486 | 0.022 | 0.31 | NO |
| 16 | DPM2 | DPM2 | DPM2 | 6942 | 0.016 | 0.3 | NO |
| 17 | PIGF | PIGF | PIGF | 8619 | -0.0029 | 0.21 | NO |
| 18 | PIGS | PIGS | PIGS | 9060 | -0.0076 | 0.19 | NO |
| 19 | PIGP | PIGP | PIGP | 9128 | -0.0083 | 0.19 | NO |
| 20 | GPAA1 | GPAA1 | GPAA1 | 11850 | -0.041 | 0.062 | NO |
| 21 | PIGU | PIGU | PIGU | 12123 | -0.045 | 0.072 | NO |
| 22 | PLAUR | PLAUR | PLAUR | 12746 | -0.055 | 0.069 | NO |
| 23 | PIGA | PIGA | PIGA | 13404 | -0.067 | 0.071 | NO |
| 24 | DPM1 | DPM1 | DPM1 | 14316 | -0.088 | 0.07 | NO |
| 25 | PIGW | PIGW | PIGW | 15153 | -0.11 | 0.088 | NO |
| 26 | PGAP1 | PGAP1 | PGAP1 | 16003 | -0.15 | 0.12 | NO |
Figure S73. Get High-res Image This plot shows mRNAseq_cNMF expression data heatmap (on the left) a RunningEnrichmentScore(RES) plot (on the top right) and a Signal2Noise(S2N) plot (on the bottom right) of genes in the pathway: KEGG PEROXISOME.
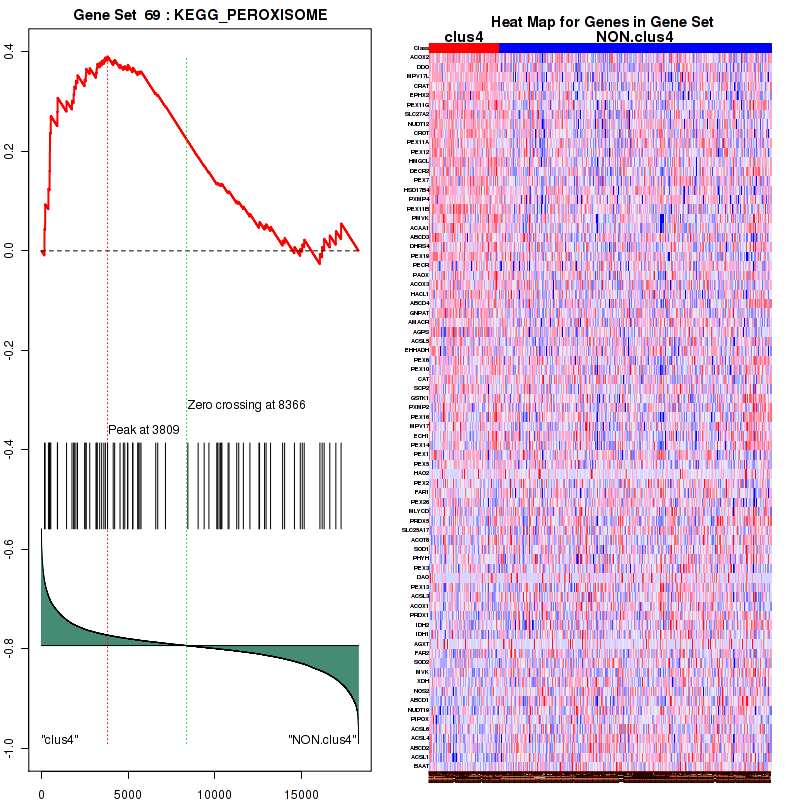
Figure S74. Get High-res Image For the top 5 core enriched genes in the pathway: KEGG PEROXISOME, this volcano plot shows how much they are up/down-regulated and significant. The significance was calculated by empirical bayesian fit
Table S38. Get Full Table This table shows a Running Enrichment Score (RES) of each gene in this pathway, that is, the enrichment score at this point in the ranked list of genes. All genes are ranked by Signal-to-Noise (S2N), a measure of similarity as default and are used to obtain ES matrix of all genes. In this way, GSEA tool uses expression pattern of not only overlapped genes but also not-overlapped genes to produce ES matrix.
| Rank | GENE | SYMBOL | DESC | LIST.LOC | S2N | RES | CORE_ENRICHMENT |
|---|---|---|---|---|---|---|---|
| 1 | TNFRSF10C | TNFRSF10C | TNFRSF10C | 101 | 0.46 | 0.21 | YES |
| 2 | MAP3K1 | MAP3K1 | MAP3K1 | 1434 | 0.16 | 0.22 | YES |
| 3 | MAP2K4 | MAP2K4 | MAP2K4 | 1461 | 0.15 | 0.29 | YES |
| 4 | IKBKB | IKBKB | IKBKB | 1945 | 0.12 | 0.32 | YES |
| 5 | TNFSF10 | TNFSF10 | TNFSF10 | 2062 | 0.12 | 0.37 | YES |
| 6 | PIK3R3 | PIK3R3 | PIK3R3 | 3597 | 0.068 | 0.32 | YES |
| 7 | SMPD1 | SMPD1 | SMPD1 | 3599 | 0.068 | 0.35 | YES |
| 8 | TNFRSF10B | TNFRSF10B | TNFRSF10B | 3770 | 0.064 | 0.38 | YES |
| 9 | PIK3R1 | PIK3R1 | PIK3R1 | 4033 | 0.059 | 0.39 | YES |
| 10 | CASP8 | CASP8 | CASP8 | 4750 | 0.046 | 0.37 | NO |
| 11 | DAP3 | DAP3 | DAP3 | 5325 | 0.037 | 0.36 | NO |
| 12 | MAPK3 | MAPK3 | MAPK3 | 6310 | 0.024 | 0.32 | NO |
| 13 | PIK3R2 | PIK3R2 | PIK3R2 | 7214 | 0.013 | 0.27 | NO |
| 14 | TRAF2 | TRAF2 | TRAF2 | 7450 | 0.01 | 0.26 | NO |
| 15 | RIPK1 | RIPK1 | RIPK1 | 7523 | 0.0092 | 0.26 | NO |
| 16 | CHUK | CHUK | CHUK | 9164 | -0.0088 | 0.18 | NO |
| 17 | TNFRSF10A | TNFRSF10A | TNFRSF10A | 9344 | -0.011 | 0.18 | NO |
| 18 | IKBKG | IKBKG | IKBKG | 9397 | -0.011 | 0.18 | NO |
| 19 | PIK3CB | PIK3CB | PIK3CB | 10234 | -0.021 | 0.14 | NO |
| 20 | TRADD | TRADD | TRADD | 10674 | -0.026 | 0.13 | NO |
| 21 | FADD | FADD | FADD | 11766 | -0.04 | 0.089 | NO |
| 22 | MAPK1 | MAPK1 | MAPK1 | 12089 | -0.044 | 0.092 | NO |
| 23 | MAPK8 | MAPK8 | MAPK8 | 12211 | -0.046 | 0.11 | NO |
| 24 | CFLAR | CFLAR | CFLAR | 13056 | -0.061 | 0.091 | NO |
| 25 | PIK3CA | PIK3CA | PIK3CA | 14148 | -0.084 | 0.071 | NO |
| 26 | TNFRSF10D | TNFRSF10D | TNFRSF10D | 14375 | -0.09 | 0.1 | NO |
| 27 | PIK3CD | PIK3CD | PIK3CD | 14726 | -0.1 | 0.13 | NO |
| 28 | CASP10 | CASP10 | CASP10 | 15610 | -0.13 | 0.15 | NO |
Figure S75. Get High-res Image This plot shows mRNAseq_cNMF expression data heatmap (on the left) a RunningEnrichmentScore(RES) plot (on the top right) and a Signal2Noise(S2N) plot (on the bottom right) of genes in the pathway: ST GA13 PATHWAY.
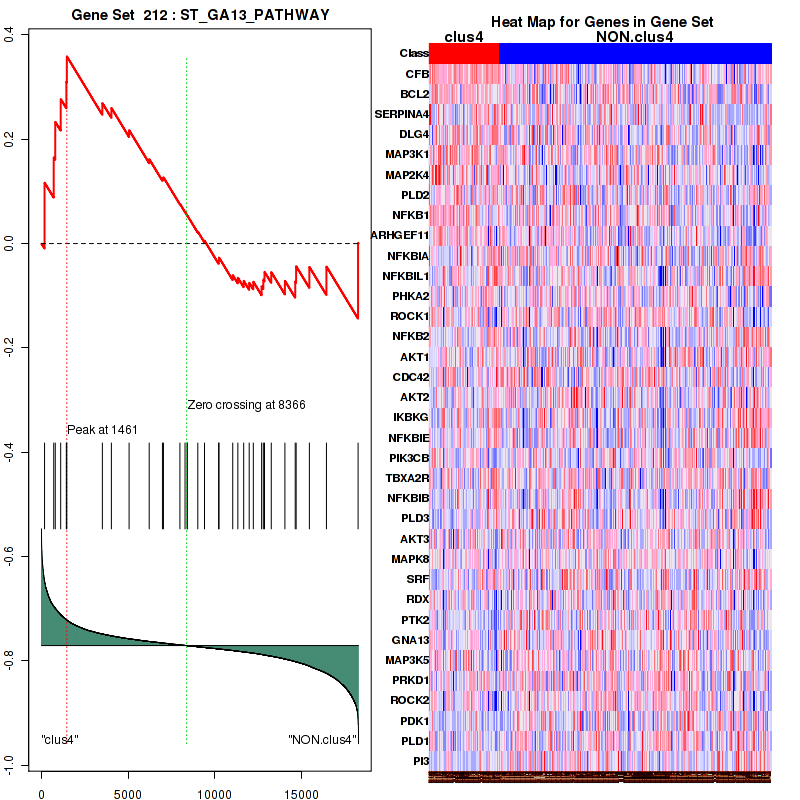
Figure S76. Get High-res Image For the top 5 core enriched genes in the pathway: ST GA13 PATHWAY, this volcano plot shows how much they are up/down-regulated and significant. The significance was calculated by empirical bayesian fit
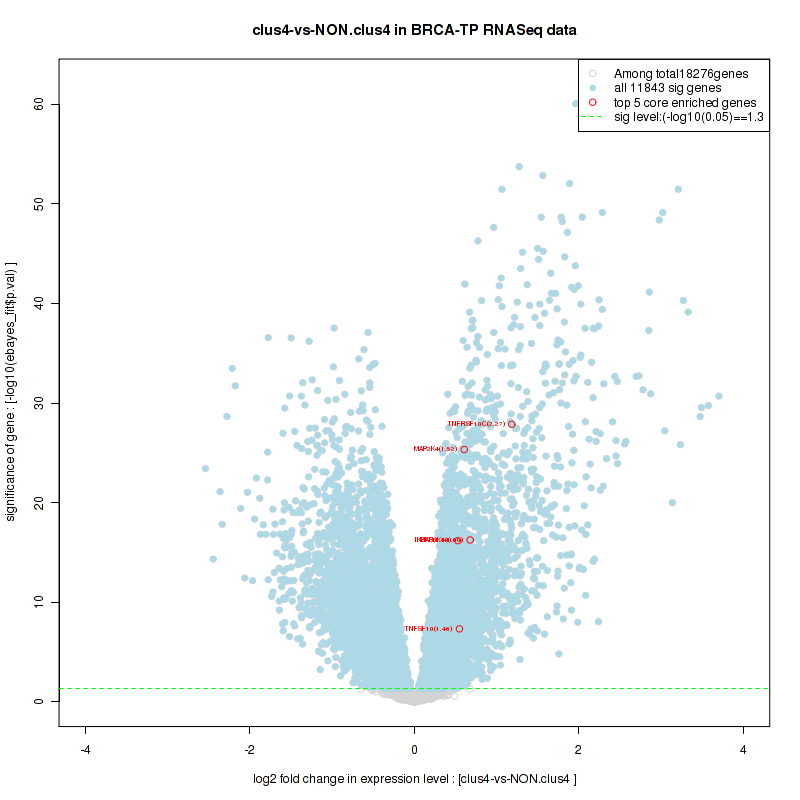
Table S39. Get Full Table This table shows a Running Enrichment Score (RES) of each gene in this pathway, that is, the enrichment score at this point in the ranked list of genes. All genes are ranked by Signal-to-Noise (S2N), a measure of similarity as default and are used to obtain ES matrix of all genes. In this way, GSEA tool uses expression pattern of not only overlapped genes but also not-overlapped genes to produce ES matrix.
| Rank | GENE | SYMBOL | DESC | LIST.LOC | S2N | RES | CORE_ENRICHMENT |
|---|---|---|---|---|---|---|---|
| 1 | ABAT | ABAT | ABAT | 85 | 0.47 | 0.22 | YES |
| 2 | ALDH6A1 | ALDH6A1 | ALDH6A1 | 1090 | 0.19 | 0.25 | YES |
| 3 | SUCLG2 | SUCLG2 | SUCLG2 | 2242 | 0.11 | 0.24 | YES |
| 4 | ACAT1 | ACAT1 | ACAT1 | 2919 | 0.085 | 0.24 | YES |
| 5 | ALDH3A2 | ALDH3A2 | ALDH3A2 | 3326 | 0.074 | 0.26 | YES |
| 6 | MCEE | MCEE | MCEE | 3411 | 0.072 | 0.29 | YES |
| 7 | ALDH9A1 | ALDH9A1 | ALDH9A1 | 3497 | 0.07 | 0.32 | YES |
| 8 | ALDH2 | ALDH2 | ALDH2 | 4304 | 0.054 | 0.3 | YES |
| 9 | ACACB | ACACB | ACACB | 4359 | 0.052 | 0.32 | YES |
| 10 | PCCB | PCCB | PCCB | 4544 | 0.049 | 0.33 | YES |
| 11 | ACSS3 | ACSS3 | ACSS3 | 4760 | 0.045 | 0.34 | YES |
| 12 | EHHADH | EHHADH | EHHADH | 4805 | 0.045 | 0.36 | YES |
| 13 | HIBCH | HIBCH | HIBCH | 4942 | 0.042 | 0.37 | YES |
| 14 | PCCA | PCCA | PCCA | 5461 | 0.035 | 0.36 | NO |
| 15 | ECHS1 | ECHS1 | ECHS1 | 6618 | 0.02 | 0.31 | NO |
| 16 | ACADM | ACADM | ACADM | 6848 | 0.017 | 0.3 | NO |
| 17 | ACACA | ACACA | ACACA | 7130 | 0.014 | 0.29 | NO |
| 18 | HADHA | HADHA | HADHA | 7273 | 0.012 | 0.29 | NO |
| 19 | MUT | MUT | MUT | 7882 | 0.0049 | 0.26 | NO |
| 20 | SUCLA2 | SUCLA2 | SUCLA2 | 7996 | 0.0039 | 0.26 | NO |
| 21 | ALDH7A1 | ALDH7A1 | ALDH7A1 | 9217 | -0.0095 | 0.19 | NO |
| 22 | LDHA | LDHA | LDHA | 9351 | -0.011 | 0.19 | NO |
| 23 | SUCLG1 | SUCLG1 | SUCLG1 | 9567 | -0.013 | 0.19 | NO |
| 24 | ACSS2 | ACSS2 | ACSS2 | 9652 | -0.014 | 0.19 | NO |
| 25 | LDHC | LDHC | LDHC | 9724 | -0.015 | 0.19 | NO |
| 26 | MLYCD | MLYCD | MLYCD | 10135 | -0.019 | 0.18 | NO |
| 27 | ALDH1B1 | ALDH1B1 | ALDH1B1 | 10224 | -0.02 | 0.18 | NO |
| 28 | ACSS1 | ACSS1 | ACSS1 | 10927 | -0.029 | 0.16 | NO |
| 29 | LDHAL6A | LDHAL6A | LDHAL6A | 11599 | -0.037 | 0.14 | NO |
| 30 | ACAT2 | ACAT2 | ACAT2 | 14139 | -0.084 | 0.04 | NO |
| 31 | LDHAL6B | LDHAL6B | LDHAL6B | 15410 | -0.12 | 0.029 | NO |
| 32 | LDHB | LDHB | LDHB | 17654 | -0.27 | 0.034 | NO |
Figure S77. Get High-res Image This plot shows mRNAseq_cNMF expression data heatmap (on the left) a RunningEnrichmentScore(RES) plot (on the top right) and a Signal2Noise(S2N) plot (on the bottom right) of genes in the pathway: PID AR PATHWAY.
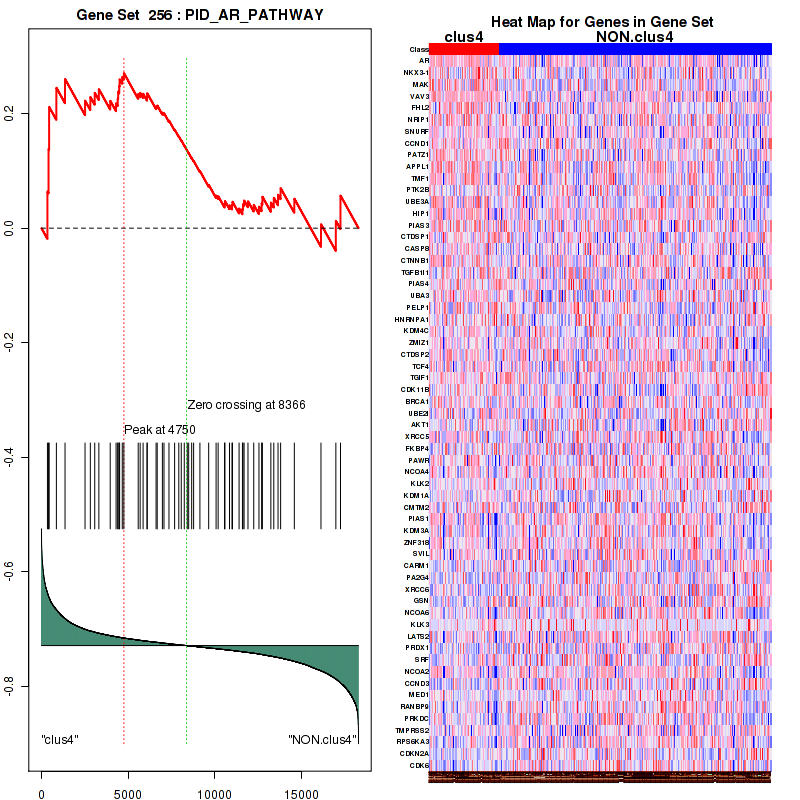
Figure S78. Get High-res Image For the top 5 core enriched genes in the pathway: PID AR PATHWAY, this volcano plot shows how much they are up/down-regulated and significant. The significance was calculated by empirical bayesian fit
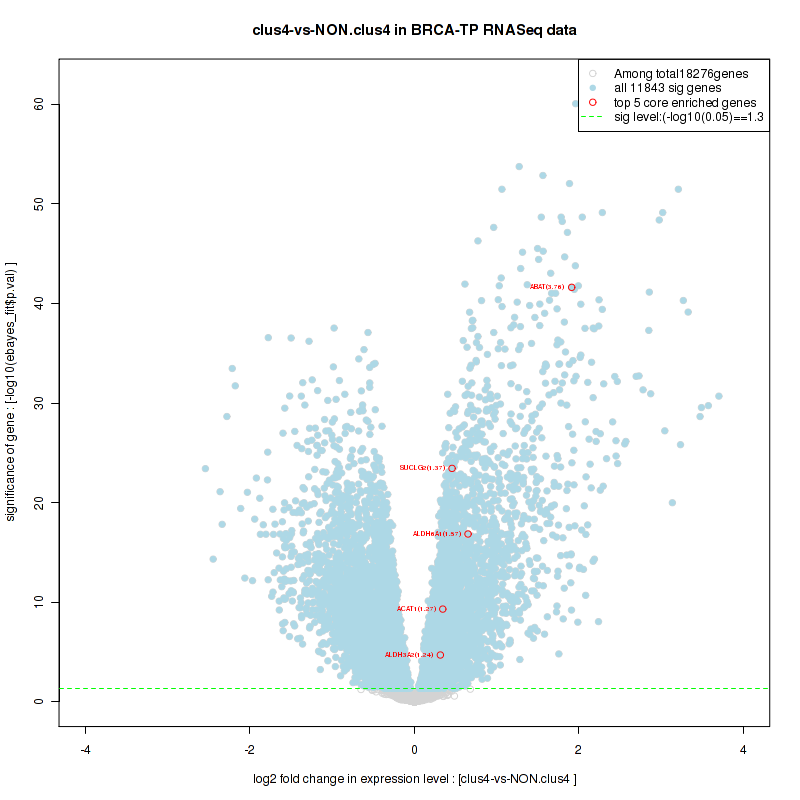
Table S40. Get Full Table This table shows a Running Enrichment Score (RES) of each gene in this pathway, that is, the enrichment score at this point in the ranked list of genes. All genes are ranked by Signal-to-Noise (S2N), a measure of similarity as default and are used to obtain ES matrix of all genes. In this way, GSEA tool uses expression pattern of not only overlapped genes but also not-overlapped genes to produce ES matrix.
| Rank | GENE | SYMBOL | DESC | LIST.LOC | S2N | RES | CORE_ENRICHMENT |
|---|---|---|---|---|---|---|---|
| 1 | PGR | PGR | PGR | 17 | 0.59 | 0.1 | YES |
| 2 | TFF1 | TFF1 | TFF1 | 120 | 0.43 | 0.17 | YES |
| 3 | ESR1 | ESR1 | ESR1 | 135 | 0.42 | 0.24 | YES |
| 4 | GREB1 | GREB1 | GREB1 | 464 | 0.28 | 0.27 | YES |
| 5 | XBP1 | XBP1 | XBP1 | 1233 | 0.17 | 0.26 | YES |
| 6 | ABCA3 | ABCA3 | ABCA3 | 1385 | 0.16 | 0.28 | YES |
| 7 | APBB1 | APBB1 | APBB1 | 1501 | 0.15 | 0.3 | YES |
| 8 | MPG | MPG | MPG | 2392 | 0.1 | 0.26 | NO |
| 9 | AXIN2 | AXIN2 | AXIN2 | 2404 | 0.1 | 0.28 | NO |
| 10 | NRIP1 | NRIP1 | NRIP1 | 2513 | 0.098 | 0.29 | NO |
| 11 | CALCOCO1 | CALCOCO1 | CALCOCO1 | 2741 | 0.09 | 0.3 | NO |
| 12 | CCND1 | CCND1 | CCND1 | 3069 | 0.081 | 0.29 | NO |
| 13 | LCOR | LCOR | LCOR | 3362 | 0.073 | 0.29 | NO |
| 14 | CTSD | CTSD | CTSD | 3586 | 0.068 | 0.29 | NO |
| 15 | STAT5A | STAT5A | STAT5A | 3963 | 0.06 | 0.28 | NO |
| 16 | NCOR1 | NCOR1 | NCOR1 | 4882 | 0.043 | 0.23 | NO |
| 17 | JUN | JUN | JUN | 5067 | 0.041 | 0.23 | NO |
| 18 | DDX17 | DDX17 | DDX17 | 5242 | 0.038 | 0.23 | NO |
| 19 | SMAD4 | SMAD4 | SMAD4 | 5402 | 0.036 | 0.22 | NO |
| 20 | SRA1 | SRA1 | SRA1 | 5420 | 0.036 | 0.23 | NO |
| 21 | MTA1 | MTA1 | MTA1 | 5424 | 0.036 | 0.24 | NO |
| 22 | UBA3 | UBA3 | UBA3 | 6086 | 0.026 | 0.2 | NO |
| 23 | C3 | C3 | C3 | 6500 | 0.022 | 0.18 | NO |
| 24 | NCOA1 | NCOA1 | NCOA1 | 6645 | 0.02 | 0.18 | NO |
| 25 | NEDD8 | NEDD8 | NEDD8 | 6933 | 0.016 | 0.17 | NO |
| 26 | ANP32A | ANP32A | ANP32A | 7568 | 0.0086 | 0.13 | NO |
| 27 | NDUFV3 | NDUFV3 | NDUFV3 | 7865 | 0.0052 | 0.12 | NO |
| 28 | BRCA1 | BRCA1 | BRCA1 | 8060 | 0.0032 | 0.11 | NO |
| 29 | SAFB | SAFB | SAFB | 8742 | -0.0041 | 0.072 | NO |
| 30 | DDX54 | DDX54 | DDX54 | 8785 | -0.0047 | 0.071 | NO |
| 31 | HDAC4 | HDAC4 | HDAC4 | 9110 | -0.0081 | 0.054 | NO |
| 32 | CHUK | CHUK | CHUK | 9164 | -0.0088 | 0.053 | NO |
| 33 | NCOR2 | NCOR2 | NCOR2 | 9438 | -0.012 | 0.04 | NO |
| 34 | EP300 | EP300 | EP300 | 9686 | -0.015 | 0.029 | NO |
| 35 | ATP5J | ATP5J | ATP5J | 9747 | -0.015 | 0.028 | NO |
| 36 | PHB2 | PHB2 | PHB2 | 10037 | -0.018 | 0.015 | NO |
| 37 | AP1B1 | AP1B1 | AP1B1 | 10240 | -0.021 | 0.0078 | NO |
| 38 | SOD1 | SOD1 | SOD1 | 10400 | -0.022 | 0.0029 | NO |
| 39 | HDAC1 | HDAC1 | HDAC1 | 10472 | -0.023 | 0.003 | NO |
| 40 | COL18A1 | COL18A1 | COL18A1 | 10481 | -0.023 | 0.0065 | NO |
| 41 | PRDM15 | PRDM15 | PRDM15 | 11011 | -0.03 | -0.017 | NO |
| 42 | CD82 | CD82 | CD82 | 11045 | -0.03 | -0.014 | NO |
| 43 | SET | SET | SET | 11085 | -0.031 | -0.011 | NO |
| 44 | TRIM59 | TRIM59 | TRIM59 | 11215 | -0.032 | -0.013 | NO |
| 45 | EBAG9 | EBAG9 | EBAG9 | 12114 | -0.044 | -0.054 | NO |
| 46 | HSF2 | HSF2 | HSF2 | 12269 | -0.047 | -0.055 | NO |
| 47 | UBE2M | UBE2M | UBE2M | 12358 | -0.048 | -0.051 | NO |
| 48 | NCOA2 | NCOA2 | NCOA2 | 12736 | -0.055 | -0.063 | NO |
| 49 | NR0B1 | NR0B1 | NR0B1 | 13052 | -0.061 | -0.07 | NO |
| 50 | MED1 | MED1 | MED1 | 13392 | -0.067 | -0.077 | NO |
| 51 | PRL | PRL | PRL | 13531 | -0.07 | -0.072 | NO |
| 52 | KLRC3 | KLRC3 | KLRC3 | 13908 | -0.078 | -0.08 | NO |
| 53 | DSCAM | DSCAM | DSCAM | 13943 | -0.079 | -0.068 | NO |
| 54 | PCNA | PCNA | PCNA | 14042 | -0.081 | -0.06 | NO |
| 55 | NCOA3 | NCOA3 | NCOA3 | 14415 | -0.091 | -0.065 | NO |
| 56 | CEBPB | CEBPB | CEBPB | 15469 | -0.12 | -0.1 | NO |
| 57 | PDIA2 | PDIA2 | PDIA2 | 15848 | -0.14 | -0.098 | NO |
| 58 | MYC | MYC | MYC | 15856 | -0.14 | -0.074 | NO |
| 59 | LMO4 | LMO4 | LMO4 | 16348 | -0.16 | -0.073 | NO |
| 60 | NCOA7 | NCOA7 | NCOA7 | 16979 | -0.2 | -0.073 | NO |
| 61 | NR0B2 | NR0B2 | NR0B2 | 17181 | -0.22 | -0.046 | NO |
| 62 | ESR2 | ESR2 | ESR2 | 17263 | -0.23 | -0.012 | NO |
| 63 | POU4F1 | POU4F1 | POU4F1 | 18203 | -0.39 | 0.004 | NO |
Figure S79. Get High-res Image This plot shows mRNAseq_cNMF expression data heatmap (on the left) a RunningEnrichmentScore(RES) plot (on the top right) and a Signal2Noise(S2N) plot (on the bottom right) of genes in the pathway: PID TRAIL PATHWAY.
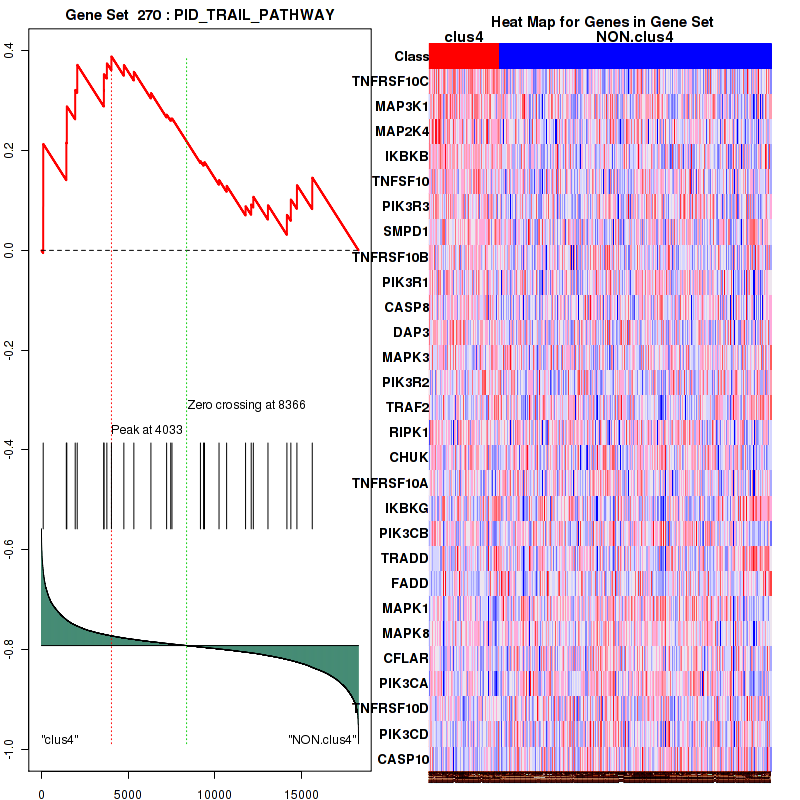
Figure S80. Get High-res Image For the top 5 core enriched genes in the pathway: PID TRAIL PATHWAY, this volcano plot shows how much they are up/down-regulated and significant. The significance was calculated by empirical bayesian fit

For the top enriched genes, if you want to check whether they are
-
up-regulated, please check the list of up-regulated genes
-
down-regulated, please check the list of down-regulated genes
For the top enriched genes, if you want to check whether they are
-
highly expressed genes, please check the list of high (top 30%) expressed genes
-
low expressed genes, please check the list of low (bottom 30%) expressed genes
An expression pattern of top(30%)/middle(30%)/low(30%) in this subtype against other subtypes is available in a heatmap
For the top enriched genes, if you want to check whether they are
-
significantly differently expressed genes by eBayes lm fit, please check the list of significant genes
Table 7. Get Full Table This table shows top 10 pathways which are significantly enriched in cluster clus5. It displays only significant gene sets satisfying nom.p.val.threshold (-1), fwer.p.val.threshold (-1) , fdr.q.val.threshold (0.25) and the default table is sorted by Normalized Enrichment Score (NES). Further details on NES statistics, please visit The Broad GSEA website.
| GeneSet(GS) | Size(#genes) | genes.ES.table | ES | NES | NOM.p.val | FDR.q.val | FWER.p.val | Tag.. | Gene.. | Signal | FDR..median. | glob.p.val |
|---|---|---|---|---|---|---|---|---|---|---|---|---|
| KEGG LYSINE DEGRADATION | 44 | genes.ES.table | 0.39 | 1.7 | 0.024 | 1 | 0.82 | 0.2 | 0.19 | 0.17 | 0.53 | 0.32 |
| KEGG GLYCOSPHINGOLIPID BIOSYNTHESIS LACTO AND NEOLACTO SERIES | 26 | genes.ES.table | 0.71 | 1.7 | 0.0062 | 0.87 | 0.88 | 0.5 | 0.17 | 0.42 | 0.4 | 0.24 |
| KEGG RNA POLYMERASE | 29 | genes.ES.table | 0.48 | 1.7 | 0.058 | 0.98 | 0.87 | 0.48 | 0.3 | 0.34 | 0.44 | 0.26 |
| KEGG CELL CYCLE | 118 | genes.ES.table | 0.56 | 1.8 | 0.01 | 1 | 0.53 | 0.39 | 0.16 | 0.33 | 0.45 | 0.34 |
| PID AURORA B PATHWAY | 39 | genes.ES.table | 0.66 | 1.6 | 0.049 | 0.88 | 0.92 | 0.41 | 0.12 | 0.36 | 0.44 | 0.25 |
| PID E2F PATHWAY | 69 | genes.ES.table | 0.52 | 1.7 | 0.063 | 0.91 | 0.88 | 0.35 | 0.18 | 0.28 | 0.42 | 0.25 |
| PID MYC ACTIVPATHWAY | 78 | genes.ES.table | 0.48 | 1.9 | 0.017 | 1 | 0.42 | 0.35 | 0.21 | 0.27 | 0 | 0.38 |
| PID LIS1PATHWAY | 28 | genes.ES.table | 0.54 | 1.7 | 0.032 | 1 | 0.85 | 0.25 | 0.17 | 0.21 | 0.57 | 0.34 |
| PID AURORA A PATHWAY | 31 | genes.ES.table | 0.57 | 1.7 | 0.044 | 1 | 0.81 | 0.26 | 0.12 | 0.23 | 0.62 | 0.37 |
| PID RB 1PATHWAY | 64 | genes.ES.table | 0.44 | 1.7 | 0.008 | 1 | 0.86 | 0.19 | 0.076 | 0.17 | 0.46 | 0.27 |
Table S41. Get Full Table This table shows a Running Enrichment Score (RES) of each gene in this pathway, that is, the enrichment score at this point in the ranked list of genes. All genes are ranked by Signal-to-Noise (S2N), a measure of similarity as default and are used to obtain ES matrix of all genes. In this way, GSEA tool uses expression pattern of not only overlapped genes but also not-overlapped genes to produce ES matrix.
| Rank | GENE | SYMBOL | DESC | LIST.LOC | S2N | RES | CORE_ENRICHMENT |
|---|---|---|---|---|---|---|---|
| 1 | CDCA7 | CDCA7 | CDCA7 | 43 | 0.88 | 0.07 | YES |
| 2 | FOSL1 | FOSL1 | FOSL1 | 213 | 0.67 | 0.12 | YES |
| 3 | TAF4B | TAF4B | TAF4B | 354 | 0.59 | 0.16 | YES |
| 4 | CDC25A | CDC25A | CDC25A | 397 | 0.56 | 0.2 | YES |
| 5 | BIRC5 | BIRC5 | BIRC5 | 520 | 0.51 | 0.24 | YES |
| 6 | TERT | TERT | TERT | 735 | 0.44 | 0.26 | YES |
| 7 | ODC1 | ODC1 | ODC1 | 1126 | 0.36 | 0.27 | YES |
| 8 | PIM1 | PIM1 | PIM1 | 1162 | 0.36 | 0.3 | YES |
| 9 | SNAI1 | SNAI1 | SNAI1 | 1246 | 0.34 | 0.32 | YES |
| 10 | E2F3 | E2F3 | E2F3 | 1395 | 0.32 | 0.34 | YES |
| 11 | HMGA1 | HMGA1 | HMGA1 | 1508 | 0.31 | 0.36 | YES |
| 12 | MMP9 | MMP9 | MMP9 | 1729 | 0.28 | 0.37 | YES |
| 13 | MYC | MYC | MYC | 1819 | 0.27 | 0.39 | YES |
| 14 | KIR3DL1 | KIR3DL1 | KIR3DL1 | 2495 | 0.21 | 0.37 | YES |
| 15 | ENO1 | ENO1 | ENO1 | 2515 | 0.21 | 0.38 | YES |
| 16 | RCC1 | RCC1 | RCC1 | 2537 | 0.21 | 0.4 | YES |
| 17 | TK1 | TK1 | TK1 | 2589 | 0.21 | 0.41 | YES |
| 18 | BCAT1 | BCAT1 | BCAT1 | 2614 | 0.21 | 0.43 | YES |
| 19 | CCNB1 | CCNB1 | CCNB1 | 2670 | 0.2 | 0.44 | YES |
| 20 | SLC2A1 | SLC2A1 | SLC2A1 | 2769 | 0.19 | 0.45 | YES |
| 21 | POLR3D | POLR3D | POLR3D | 2925 | 0.18 | 0.46 | YES |
| 22 | PEG10 | PEG10 | PEG10 | 3070 | 0.18 | 0.47 | YES |
| 23 | CAD | CAD | CAD | 3264 | 0.17 | 0.47 | YES |
| 24 | GAPDH | GAPDH | GAPDH | 3500 | 0.16 | 0.47 | YES |
| 25 | SUPT3H | SUPT3H | SUPT3H | 3661 | 0.15 | 0.47 | YES |
| 26 | MINA | MINA | MINA | 3753 | 0.14 | 0.48 | YES |
| 27 | ACTL6A | ACTL6A | ACTL6A | 3878 | 0.14 | 0.48 | YES |
| 28 | TFRC | TFRC | TFRC | 4168 | 0.13 | 0.48 | NO |
| 29 | RUVBL1 | RUVBL1 | RUVBL1 | 4467 | 0.12 | 0.47 | NO |
| 30 | BAX | BAX | BAX | 4669 | 0.11 | 0.47 | NO |
| 31 | CDK4 | CDK4 | CDK4 | 4899 | 0.1 | 0.47 | NO |
| 32 | PTMA | PTMA | PTMA | 4931 | 0.1 | 0.47 | NO |
| 33 | HSPD1 | HSPD1 | HSPD1 | 5252 | 0.091 | 0.46 | NO |
| 34 | DDX18 | DDX18 | DDX18 | 5325 | 0.089 | 0.46 | NO |
| 35 | NCL | NCL | NCL | 5849 | 0.075 | 0.44 | NO |
| 36 | EIF4G1 | EIF4G1 | EIF4G1 | 6213 | 0.066 | 0.43 | NO |
| 37 | PDCD10 | PDCD10 | PDCD10 | 6285 | 0.065 | 0.43 | NO |
| 38 | NME1 | NME1 | NME1 | 6327 | 0.064 | 0.43 | NO |
| 39 | SUPT7L | SUPT7L | SUPT7L | 6402 | 0.062 | 0.43 | NO |
| 40 | MTA1 | MTA1 | MTA1 | 6412 | 0.062 | 0.44 | NO |
| 41 | TRRAP | TRRAP | TRRAP | 6470 | 0.06 | 0.44 | NO |
| 42 | EIF4A1 | EIF4A1 | EIF4A1 | 6589 | 0.057 | 0.44 | NO |
| 43 | LDHA | LDHA | LDHA | 6595 | 0.057 | 0.44 | NO |
| 44 | NME2 | NME2 | NME2 | 6827 | 0.052 | 0.43 | NO |
| 45 | RPL11 | RPL11 | RPL11 | 6843 | 0.051 | 0.44 | NO |
| 46 | KAT2A | KAT2A | KAT2A | 7060 | 0.046 | 0.43 | NO |
| 47 | MTDH | MTDH | MTDH | 7189 | 0.044 | 0.43 | NO |
| 48 | HUWE1 | HUWE1 | HUWE1 | 7459 | 0.038 | 0.42 | NO |
| 49 | RUVBL2 | RUVBL2 | RUVBL2 | 7498 | 0.037 | 0.42 | NO |
| 50 | NPM1 | NPM1 | NPM1 | 7721 | 0.032 | 0.41 | NO |
| 51 | TAF12 | TAF12 | TAF12 | 7747 | 0.031 | 0.41 | NO |
| 52 | NDUFAF2 | NDUFAF2 | NDUFAF2 | 7993 | 0.026 | 0.4 | NO |
| 53 | ID2 | ID2 | ID2 | 8582 | 0.014 | 0.36 | NO |
| 54 | HSP90AA1 | HSP90AA1 | HSP90AA1 | 8608 | 0.013 | 0.36 | NO |
| 55 | EIF2S1 | EIF2S1 | EIF2S1 | 8784 | 0.0088 | 0.36 | NO |
| 56 | NBN | NBN | NBN | 8878 | 0.007 | 0.35 | NO |
| 57 | SMAD4 | SMAD4 | SMAD4 | 9030 | 0.0039 | 0.34 | NO |
| 58 | SHMT1 | SHMT1 | SHMT1 | 9135 | 0.0018 | 0.34 | NO |
| 59 | TAF10 | TAF10 | TAF10 | 9788 | -0.011 | 0.3 | NO |
| 60 | PMAIP1 | PMAIP1 | PMAIP1 | 10177 | -0.02 | 0.28 | NO |
| 61 | TP53 | TP53 | TP53 | 10310 | -0.022 | 0.28 | NO |
| 62 | KAT5 | KAT5 | KAT5 | 10765 | -0.033 | 0.26 | NO |
| 63 | CCND2 | CCND2 | CCND2 | 10905 | -0.037 | 0.25 | NO |
| 64 | IREB2 | IREB2 | IREB2 | 10988 | -0.039 | 0.25 | NO |
| 65 | EP300 | EP300 | EP300 | 11071 | -0.041 | 0.25 | NO |
| 66 | PFKM | PFKM | PFKM | 11076 | -0.041 | 0.25 | NO |
| 67 | UBTF | UBTF | UBTF | 11579 | -0.053 | 0.23 | NO |
| 68 | EIF4E | EIF4E | EIF4E | 11900 | -0.062 | 0.22 | NO |
| 69 | HSPA4 | HSPA4 | HSPA4 | 11948 | -0.063 | 0.22 | NO |
| 70 | MAX | MAX | MAX | 12238 | -0.07 | 0.21 | NO |
| 71 | CREBBP | CREBBP | CREBBP | 12580 | -0.079 | 0.2 | NO |
| 72 | TAF9 | TAF9 | TAF9 | 13528 | -0.11 | 0.15 | NO |
| 73 | PRDX3 | PRDX3 | PRDX3 | 14127 | -0.13 | 0.13 | NO |
| 74 | GPAM | GPAM | GPAM | 14507 | -0.15 | 0.12 | NO |
| 75 | SMAD3 | SMAD3 | SMAD3 | 14848 | -0.16 | 0.12 | NO |
| 76 | BMI1 | BMI1 | BMI1 | 15111 | -0.18 | 0.12 | NO |
| 77 | MYCT1 | MYCT1 | MYCT1 | 16540 | -0.29 | 0.062 | NO |
| 78 | SERPINI1 | SERPINI1 | SERPINI1 | 17358 | -0.41 | 0.05 | NO |
Figure S81. Get High-res Image This plot shows mRNAseq_cNMF expression data heatmap (on the left) a RunningEnrichmentScore(RES) plot (on the top right) and a Signal2Noise(S2N) plot (on the bottom right) of genes in the pathway: KEGG LYSINE DEGRADATION.
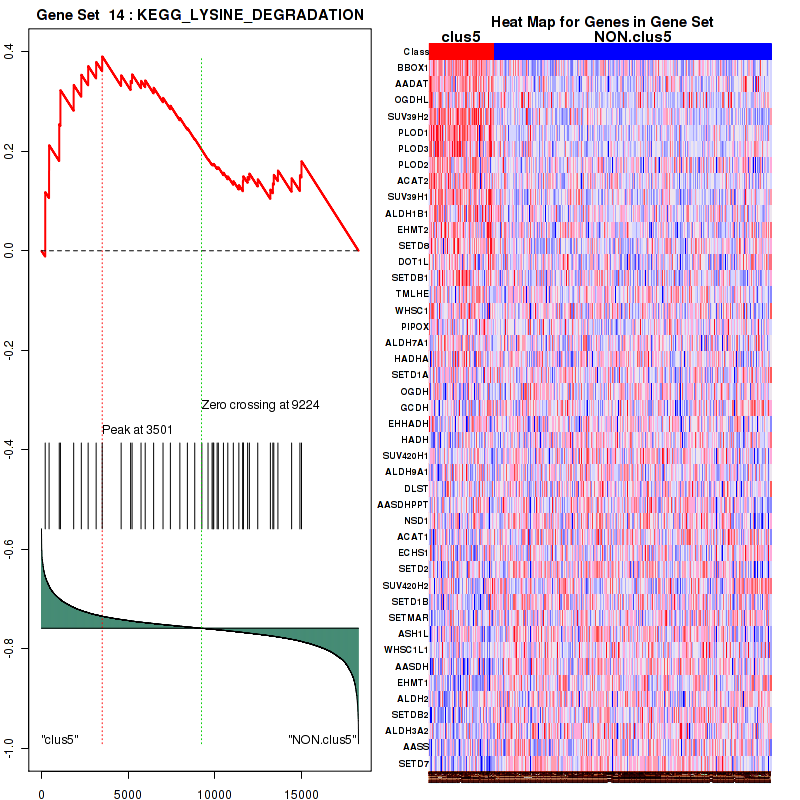
Figure S82. Get High-res Image For the top 5 core enriched genes in the pathway: KEGG LYSINE DEGRADATION, this volcano plot shows how much they are up/down-regulated and significant. The significance was calculated by empirical bayesian fit

Table S42. Get Full Table This table shows a Running Enrichment Score (RES) of each gene in this pathway, that is, the enrichment score at this point in the ranked list of genes. All genes are ranked by Signal-to-Noise (S2N), a measure of similarity as default and are used to obtain ES matrix of all genes. In this way, GSEA tool uses expression pattern of not only overlapped genes but also not-overlapped genes to produce ES matrix.
| Rank | GENE | SYMBOL | DESC | LIST.LOC | S2N | RES | CORE_ENRICHMENT |
|---|---|---|---|---|---|---|---|
| 1 | CCNE1 | CCNE1 | CCNE1 | 37 | 0.9 | 0.039 | YES |
| 2 | SMC1B | SMC1B | SMC1B | 235 | 0.66 | 0.057 | YES |
| 3 | CDKN2A | CDKN2A | CDKN2A | 380 | 0.57 | 0.075 | YES |
| 4 | CDC25A | CDC25A | CDC25A | 397 | 0.56 | 0.1 | YES |
| 5 | CDC20 | CDC20 | CDC20 | 448 | 0.54 | 0.12 | YES |
| 6 | TTK | TTK | TTK | 462 | 0.53 | 0.14 | YES |
| 7 | CDC45 | CDC45 | CDC45 | 472 | 0.53 | 0.17 | YES |
| 8 | E2F2 | E2F2 | E2F2 | 568 | 0.5 | 0.18 | YES |
| 9 | CCNA1 | CCNA1 | CCNA1 | 593 | 0.48 | 0.2 | YES |
| 10 | CDK6 | CDK6 | CDK6 | 677 | 0.46 | 0.22 | YES |
| 11 | PLK1 | PLK1 | PLK1 | 738 | 0.44 | 0.24 | YES |
| 12 | SKP2 | SKP2 | SKP2 | 842 | 0.42 | 0.25 | YES |
| 13 | CCNB2 | CCNB2 | CCNB2 | 846 | 0.42 | 0.27 | YES |
| 14 | BUB1 | BUB1 | BUB1 | 874 | 0.41 | 0.29 | YES |
| 15 | CCNA2 | CCNA2 | CCNA2 | 955 | 0.4 | 0.3 | YES |
| 16 | PTTG1 | PTTG1 | PTTG1 | 970 | 0.39 | 0.32 | YES |
| 17 | CHEK1 | CHEK1 | CHEK1 | 987 | 0.39 | 0.33 | YES |
| 18 | CDC7 | CDC7 | CDC7 | 1159 | 0.36 | 0.34 | YES |
| 19 | E2F1 | E2F1 | E2F1 | 1349 | 0.33 | 0.34 | YES |
| 20 | E2F3 | E2F3 | E2F3 | 1395 | 0.32 | 0.36 | YES |
| 21 | BUB1B | BUB1B | BUB1B | 1468 | 0.32 | 0.37 | YES |
| 22 | CDC25C | CDC25C | CDC25C | 1473 | 0.31 | 0.38 | YES |
| 23 | CHEK2 | CHEK2 | CHEK2 | 1572 | 0.3 | 0.39 | YES |
| 24 | MAD2L1 | MAD2L1 | MAD2L1 | 1705 | 0.28 | 0.4 | YES |
| 25 | PKMYT1 | PKMYT1 | PKMYT1 | 1809 | 0.27 | 0.4 | YES |
| 26 | ESPL1 | ESPL1 | ESPL1 | 1817 | 0.27 | 0.41 | YES |
| 27 | MYC | MYC | MYC | 1819 | 0.27 | 0.43 | YES |
| 28 | CDC25B | CDC25B | CDC25B | 1844 | 0.27 | 0.44 | YES |
| 29 | PTTG2 | PTTG2 | PTTG2 | 1906 | 0.26 | 0.44 | YES |
| 30 | E2F5 | E2F5 | E2F5 | 1976 | 0.26 | 0.45 | YES |
| 31 | MCM2 | MCM2 | MCM2 | 2047 | 0.25 | 0.46 | YES |
| 32 | DBF4 | DBF4 | DBF4 | 2055 | 0.25 | 0.47 | YES |
| 33 | CDK1 | CDK1 | CDK1 | 2078 | 0.25 | 0.48 | YES |
| 34 | MCM5 | MCM5 | MCM5 | 2094 | 0.24 | 0.49 | YES |
| 35 | CDKN2C | CDKN2C | CDKN2C | 2097 | 0.24 | 0.5 | YES |
| 36 | RBL1 | RBL1 | RBL1 | 2153 | 0.24 | 0.51 | YES |
| 37 | MCM7 | MCM7 | MCM7 | 2167 | 0.24 | 0.52 | YES |
| 38 | CDC6 | CDC6 | CDC6 | 2221 | 0.23 | 0.53 | YES |
| 39 | SFN | SFN | SFN | 2279 | 0.23 | 0.53 | YES |
| 40 | MCM4 | MCM4 | MCM4 | 2488 | 0.21 | 0.53 | YES |
| 41 | MCM6 | MCM6 | MCM6 | 2651 | 0.2 | 0.53 | YES |
| 42 | CCNB1 | CCNB1 | CCNB1 | 2670 | 0.2 | 0.54 | YES |
| 43 | MAD2L2 | MAD2L2 | MAD2L2 | 2774 | 0.19 | 0.54 | YES |
| 44 | CDKN2D | CDKN2D | CDKN2D | 2822 | 0.19 | 0.55 | YES |
| 45 | TFDP1 | TFDP1 | TFDP1 | 2858 | 0.19 | 0.56 | YES |
| 46 | HDAC2 | HDAC2 | HDAC2 | 2896 | 0.19 | 0.56 | YES |
| 47 | CCNE2 | CCNE2 | CCNE2 | 3054 | 0.18 | 0.56 | NO |
| 48 | MCM3 | MCM3 | MCM3 | 3320 | 0.16 | 0.56 | NO |
| 49 | TFDP2 | TFDP2 | TFDP2 | 3336 | 0.16 | 0.56 | NO |
| 50 | E2F4 | E2F4 | E2F4 | 3770 | 0.14 | 0.54 | NO |
| 51 | TGFB2 | TGFB2 | TGFB2 | 3809 | 0.14 | 0.55 | NO |
| 52 | PRKDC | PRKDC | PRKDC | 4400 | 0.12 | 0.52 | NO |
| 53 | PCNA | PCNA | PCNA | 4535 | 0.11 | 0.52 | NO |
| 54 | CDC14B | CDC14B | CDC14B | 4542 | 0.11 | 0.52 | NO |
| 55 | YWHAQ | YWHAQ | YWHAQ | 4884 | 0.1 | 0.51 | NO |
| 56 | CDK4 | CDK4 | CDK4 | 4899 | 0.1 | 0.51 | NO |
| 57 | MAD1L1 | MAD1L1 | MAD1L1 | 5251 | 0.091 | 0.5 | NO |
| 58 | RAD21 | RAD21 | RAD21 | 5345 | 0.088 | 0.5 | NO |
| 59 | CCND3 | CCND3 | CCND3 | 5426 | 0.086 | 0.5 | NO |
| 60 | CUL1 | CUL1 | CUL1 | 5502 | 0.084 | 0.5 | NO |
| 61 | ANAPC1 | ANAPC1 | ANAPC1 | 5561 | 0.082 | 0.5 | NO |
| 62 | RBX1 | RBX1 | RBX1 | 5782 | 0.077 | 0.49 | NO |
| 63 | CDK2 | CDK2 | CDK2 | 5808 | 0.076 | 0.49 | NO |
| 64 | CDKN1C | CDKN1C | CDKN1C | 5890 | 0.074 | 0.49 | NO |
| 65 | YWHAZ | YWHAZ | YWHAZ | 5946 | 0.073 | 0.49 | NO |
| 66 | YWHAH | YWHAH | YWHAH | 6315 | 0.064 | 0.47 | NO |
| 67 | CDKN2B | CDKN2B | CDKN2B | 6386 | 0.062 | 0.47 | NO |
| 68 | ANAPC11 | ANAPC11 | ANAPC11 | 6743 | 0.054 | 0.45 | NO |
| 69 | CDC26 | CDC26 | CDC26 | 6759 | 0.053 | 0.46 | NO |
| 70 | GADD45A | GADD45A | GADD45A | 6948 | 0.049 | 0.45 | NO |
| 71 | HDAC1 | HDAC1 | HDAC1 | 7007 | 0.047 | 0.45 | NO |
| 72 | YWHAE | YWHAE | YWHAE | 7086 | 0.046 | 0.44 | NO |
| 73 | YWHAG | YWHAG | YWHAG | 7333 | 0.041 | 0.43 | NO |
| 74 | ATR | ATR | ATR | 7502 | 0.037 | 0.42 | NO |
| 75 | CDC16 | CDC16 | CDC16 | 7520 | 0.036 | 0.42 | NO |
| 76 | SMC1A | SMC1A | SMC1A | 7606 | 0.034 | 0.42 | NO |
| 77 | SMC3 | SMC3 | SMC3 | 7649 | 0.033 | 0.42 | NO |
| 78 | WEE2 | WEE2 | WEE2 | 7710 | 0.032 | 0.42 | NO |
| 79 | ZBTB17 | ZBTB17 | ZBTB17 | 8110 | 0.024 | 0.4 | NO |
| 80 | SMAD2 | SMAD2 | SMAD2 | 8140 | 0.023 | 0.4 | NO |
| 81 | ANAPC5 | ANAPC5 | ANAPC5 | 8371 | 0.018 | 0.39 | NO |
| 82 | STAG1 | STAG1 | STAG1 | 8470 | 0.016 | 0.38 | NO |
| 83 | ANAPC10 | ANAPC10 | ANAPC10 | 8604 | 0.014 | 0.37 | NO |
| 84 | ANAPC7 | ANAPC7 | ANAPC7 | 8997 | 0.0044 | 0.35 | NO |
| 85 | SMAD4 | SMAD4 | SMAD4 | 9030 | 0.0039 | 0.35 | NO |
| 86 | GSK3B | GSK3B | GSK3B | 9737 | -0.01 | 0.31 | NO |
| 87 | ANAPC4 | ANAPC4 | ANAPC4 | 9755 | -0.011 | 0.31 | NO |
| 88 | CDC27 | CDC27 | CDC27 | 9975 | -0.016 | 0.3 | NO |
| 89 | CCNB3 | CCNB3 | CCNB3 | 10027 | -0.017 | 0.3 | NO |
| 90 | STAG2 | STAG2 | STAG2 | 10101 | -0.018 | 0.3 | NO |
| 91 | FZR1 | FZR1 | FZR1 | 10233 | -0.021 | 0.29 | NO |
| 92 | ATM | ATM | ATM | 10302 | -0.022 | 0.29 | NO |
| 93 | TP53 | TP53 | TP53 | 10310 | -0.022 | 0.29 | NO |
| 94 | WEE1 | WEE1 | WEE1 | 10857 | -0.036 | 0.26 | NO |
| 95 | CCND2 | CCND2 | CCND2 | 10905 | -0.037 | 0.26 | NO |
| 96 | CDC23 | CDC23 | CDC23 | 11069 | -0.041 | 0.25 | NO |
| 97 | EP300 | EP300 | EP300 | 11071 | -0.041 | 0.25 | NO |
| 98 | YWHAB | YWHAB | YWHAB | 11123 | -0.042 | 0.25 | NO |
| 99 | ABL1 | ABL1 | ABL1 | 11791 | -0.059 | 0.22 | NO |
| 100 | CDKN1B | CDKN1B | CDKN1B | 12250 | -0.071 | 0.2 | NO |
| 101 | TGFB1 | TGFB1 | TGFB1 | 12268 | -0.071 | 0.2 | NO |
| 102 | GADD45B | GADD45B | GADD45B | 12507 | -0.078 | 0.19 | NO |
| 103 | CREBBP | CREBBP | CREBBP | 12580 | -0.079 | 0.19 | NO |
| 104 | BUB3 | BUB3 | BUB3 | 12619 | -0.081 | 0.19 | NO |
| 105 | ANAPC13 | ANAPC13 | ANAPC13 | 13115 | -0.095 | 0.17 | NO |
| 106 | CDKN1A | CDKN1A | CDKN1A | 13116 | -0.095 | 0.17 | NO |
| 107 | CDK7 | CDK7 | CDK7 | 13409 | -0.1 | 0.16 | NO |
| 108 | RBL2 | RBL2 | RBL2 | 13519 | -0.11 | 0.16 | NO |
| 109 | ANAPC2 | ANAPC2 | ANAPC2 | 13571 | -0.11 | 0.16 | NO |
| 110 | MDM2 | MDM2 | MDM2 | 14050 | -0.13 | 0.14 | NO |
| 111 | SMAD3 | SMAD3 | SMAD3 | 14848 | -0.16 | 0.1 | NO |
| 112 | CDC14A | CDC14A | CDC14A | 14854 | -0.16 | 0.11 | NO |
| 113 | SKP1 | SKP1 | SKP1 | 14867 | -0.16 | 0.12 | NO |
| 114 | CCNH | CCNH | CCNH | 15454 | -0.2 | 0.094 | NO |
| 115 | RB1 | RB1 | RB1 | 15759 | -0.22 | 0.087 | NO |
| 116 | CCND1 | CCND1 | CCND1 | 16907 | -0.34 | 0.039 | NO |
| 117 | GADD45G | GADD45G | GADD45G | 17251 | -0.39 | 0.037 | NO |
| 118 | TGFB3 | TGFB3 | TGFB3 | 17426 | -0.42 | 0.047 | NO |
Figure S83. Get High-res Image This plot shows mRNAseq_cNMF expression data heatmap (on the left) a RunningEnrichmentScore(RES) plot (on the top right) and a Signal2Noise(S2N) plot (on the bottom right) of genes in the pathway: KEGG GLYCOSPHINGOLIPID BIOSYNTHESIS LACTO AND NEOLACTO SERIES.

Figure S84. Get High-res Image For the top 5 core enriched genes in the pathway: KEGG GLYCOSPHINGOLIPID BIOSYNTHESIS LACTO AND NEOLACTO SERIES, this volcano plot shows how much they are up/down-regulated and significant. The significance was calculated by empirical bayesian fit

Table S43. Get Full Table This table shows a Running Enrichment Score (RES) of each gene in this pathway, that is, the enrichment score at this point in the ranked list of genes. All genes are ranked by Signal-to-Noise (S2N), a measure of similarity as default and are used to obtain ES matrix of all genes. In this way, GSEA tool uses expression pattern of not only overlapped genes but also not-overlapped genes to produce ES matrix.
| Rank | GENE | SYMBOL | DESC | LIST.LOC | S2N | RES | CORE_ENRICHMENT |
|---|---|---|---|---|---|---|---|
| 1 | MAGOH | MAGOH | MAGOH | 1984 | 0.26 | -0.015 | YES |
| 2 | THOC4 | THOC4 | THOC4 | 2289 | 0.23 | 0.053 | YES |
| 3 | UPF3B | UPF3B | UPF3B | 2627 | 0.2 | 0.11 | YES |
| 4 | SNRPG | SNRPG | SNRPG | 3167 | 0.17 | 0.14 | YES |
| 5 | U2AF1 | U2AF1 | U2AF1 | 4050 | 0.13 | 0.14 | YES |
| 6 | CLP1 | CLP1 | CLP1 | 4269 | 0.12 | 0.18 | YES |
| 7 | CPSF3 | CPSF3 | CPSF3 | 4485 | 0.12 | 0.21 | YES |
| 8 | DHX38 | DHX38 | DHX38 | 4513 | 0.12 | 0.25 | YES |
| 9 | CPSF1 | CPSF1 | CPSF1 | 4848 | 0.1 | 0.27 | YES |
| 10 | SNRPF | SNRPF | SNRPF | 5059 | 0.098 | 0.29 | YES |
| 11 | LSM10 | LSM10 | LSM10 | 5172 | 0.094 | 0.32 | YES |
| 12 | ZNF473 | ZNF473 | ZNF473 | 5471 | 0.084 | 0.34 | YES |
| 13 | SNRPB | SNRPB | SNRPB | 5684 | 0.079 | 0.35 | YES |
| 14 | RBM8A | RBM8A | RBM8A | 5714 | 0.079 | 0.38 | YES |
| 15 | SLBP | SLBP | SLBP | 5881 | 0.074 | 0.4 | YES |
| 16 | CSTF3 | CSTF3 | CSTF3 | 5936 | 0.073 | 0.42 | YES |
| 17 | SNRPD3 | SNRPD3 | SNRPD3 | 6117 | 0.069 | 0.44 | YES |
| 18 | NUDT21 | NUDT21 | NUDT21 | 6172 | 0.067 | 0.46 | YES |
| 19 | PABPN1 | PABPN1 | PABPN1 | 6583 | 0.058 | 0.46 | YES |
| 20 | RNPS1 | RNPS1 | RNPS1 | 6691 | 0.055 | 0.47 | YES |
| 21 | SNRPE | SNRPE | SNRPE | 6849 | 0.051 | 0.48 | YES |
| 22 | SRRM1 | SRRM1 | SRRM1 | 6923 | 0.049 | 0.5 | YES |
| 23 | NCBP2 | NCBP2 | NCBP2 | 7213 | 0.043 | 0.5 | YES |
| 24 | NCBP1 | NCBP1 | NCBP1 | 7583 | 0.035 | 0.49 | YES |
| 25 | CPSF7 | CPSF7 | CPSF7 | 7626 | 0.034 | 0.5 | YES |
| 26 | CSTF2 | CSTF2 | CSTF2 | 8203 | 0.022 | 0.48 | NO |
| 27 | U2AF2 | U2AF2 | U2AF2 | 8892 | 0.0068 | 0.44 | NO |
| 28 | CDC40 | CDC40 | CDC40 | 9410 | -0.0037 | 0.42 | NO |
| 29 | NFX1 | NFX1 | NFX1 | 9471 | -0.0049 | 0.41 | NO |
| 30 | PAPOLA | PAPOLA | PAPOLA | 10118 | -0.019 | 0.38 | NO |
| 31 | CSTF1 | CSTF1 | CSTF1 | 10138 | -0.019 | 0.39 | NO |
| 32 | LSM11 | LSM11 | LSM11 | 10424 | -0.025 | 0.38 | NO |
| 33 | CPSF2 | CPSF2 | CPSF2 | 10841 | -0.035 | 0.38 | NO |
| 34 | PCF11 | PCF11 | PCF11 | 12894 | -0.088 | 0.3 | NO |
Figure S85. Get High-res Image This plot shows mRNAseq_cNMF expression data heatmap (on the left) a RunningEnrichmentScore(RES) plot (on the top right) and a Signal2Noise(S2N) plot (on the bottom right) of genes in the pathway: KEGG RNA POLYMERASE.
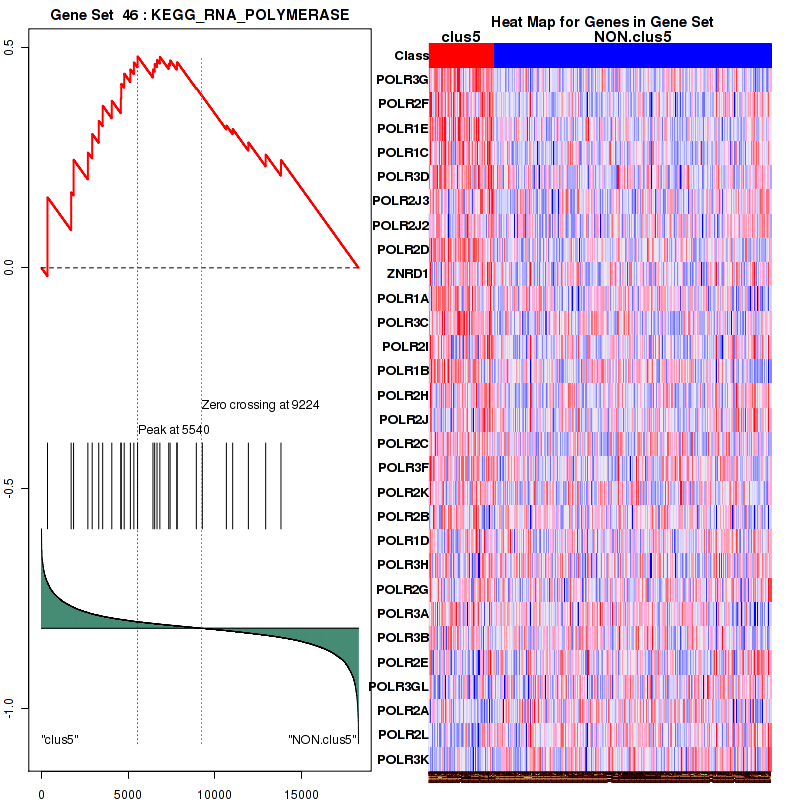
Figure S86. Get High-res Image For the top 5 core enriched genes in the pathway: KEGG RNA POLYMERASE, this volcano plot shows how much they are up/down-regulated and significant. The significance was calculated by empirical bayesian fit
Table S44. Get Full Table This table shows a Running Enrichment Score (RES) of each gene in this pathway, that is, the enrichment score at this point in the ranked list of genes. All genes are ranked by Signal-to-Noise (S2N), a measure of similarity as default and are used to obtain ES matrix of all genes. In this way, GSEA tool uses expression pattern of not only overlapped genes but also not-overlapped genes to produce ES matrix.
| Rank | GENE | SYMBOL | DESC | LIST.LOC | S2N | RES | CORE_ENRICHMENT |
|---|---|---|---|---|---|---|---|
| 1 | PRKCA | PRKCA | PRKCA | 1074 | 0.37 | -0.039 | YES |
| 2 | RPL36A | RPL36A | RPL36A | 1325 | 0.33 | -0.034 | YES |
| 3 | PSMA8 | PSMA8 | PSMA8 | 1956 | 0.26 | -0.055 | YES |
| 4 | MAGOH | MAGOH | MAGOH | 1984 | 0.26 | -0.042 | YES |
| 5 | DCPS | DCPS | DCPS | 2107 | 0.24 | -0.035 | YES |
| 6 | NUP93 | NUP93 | NUP93 | 2349 | 0.22 | -0.036 | YES |
| 7 | RPL21 | RPL21 | RPL21 | 2547 | 0.21 | -0.036 | YES |
| 8 | LSM2 | LSM2 | LSM2 | 2565 | 0.21 | -0.025 | YES |
| 9 | LSM6 | LSM6 | LSM6 | 2576 | 0.21 | -0.014 | YES |
| 10 | PSMB9 | PSMB9 | PSMB9 | 2620 | 0.21 | -0.0047 | YES |
| 11 | UPF3B | UPF3B | UPF3B | 2627 | 0.2 | 0.0064 | YES |
| 12 | PSME4 | PSME4 | PSME4 | 2949 | 0.18 | -0.0013 | YES |
| 13 | SNRPD1 | SNRPD1 | SNRPD1 | 3024 | 0.18 | 0.0046 | YES |
| 14 | WDR77 | WDR77 | WDR77 | 3122 | 0.17 | 0.0088 | YES |
| 15 | EXOSC4 | EXOSC4 | EXOSC4 | 3149 | 0.17 | 0.017 | YES |
| 16 | SEH1L | SEH1L | SEH1L | 3159 | 0.17 | 0.026 | YES |
| 17 | SNRPG | SNRPG | SNRPG | 3167 | 0.17 | 0.035 | YES |
| 18 | PSMB2 | PSMB2 | PSMB2 | 3242 | 0.17 | 0.04 | YES |
| 19 | RPS7 | RPS7 | RPS7 | 3430 | 0.16 | 0.039 | YES |
| 20 | SMG5 | SMG5 | SMG5 | 3575 | 0.15 | 0.039 | YES |
| 21 | RPS19 | RPS19 | RPS19 | 3626 | 0.15 | 0.045 | YES |
| 22 | PSMB4 | PSMB4 | PSMB4 | 3647 | 0.15 | 0.052 | YES |
| 23 | EXOSC5 | EXOSC5 | EXOSC5 | 3718 | 0.14 | 0.056 | YES |
| 24 | EXOSC8 | EXOSC8 | EXOSC8 | 3725 | 0.14 | 0.064 | YES |
| 25 | PATL1 | PATL1 | PATL1 | 3730 | 0.14 | 0.072 | YES |
| 26 | PSMD7 | PSMD7 | PSMD7 | 3791 | 0.14 | 0.076 | YES |
| 27 | RPL18A | RPL18A | RPL18A | 3836 | 0.14 | 0.081 | YES |
| 28 | NUP205 | NUP205 | NUP205 | 3912 | 0.14 | 0.085 | YES |
| 29 | GEMIN4 | GEMIN4 | GEMIN4 | 3919 | 0.14 | 0.092 | YES |
| 30 | TGS1 | TGS1 | TGS1 | 3976 | 0.14 | 0.097 | YES |
| 31 | EXOSC6 | EXOSC6 | EXOSC6 | 4072 | 0.13 | 0.099 | YES |
| 32 | NUPL2 | NUPL2 | NUPL2 | 4195 | 0.13 | 0.099 | YES |
| 33 | RPL39 | RPL39 | RPL39 | 4202 | 0.13 | 0.1 | YES |
| 34 | GSPT2 | GSPT2 | GSPT2 | 4210 | 0.13 | 0.11 | YES |
| 35 | PABPC1 | PABPC1 | PABPC1 | 4246 | 0.12 | 0.12 | YES |
| 36 | RPS27A | RPS27A | RPS27A | 4273 | 0.12 | 0.12 | YES |
| 37 | UPF2 | UPF2 | UPF2 | 4311 | 0.12 | 0.13 | YES |
| 38 | NUP88 | NUP88 | NUP88 | 4426 | 0.12 | 0.13 | YES |
| 39 | PSMA7 | PSMA7 | PSMA7 | 4451 | 0.12 | 0.13 | YES |
| 40 | RPS10 | RPS10 | RPS10 | 4462 | 0.12 | 0.14 | YES |
| 41 | RPS20 | RPS20 | RPS20 | 4518 | 0.12 | 0.14 | YES |
| 42 | RPS16 | RPS16 | RPS16 | 4563 | 0.11 | 0.15 | YES |
| 43 | RPS12 | RPS12 | RPS12 | 4605 | 0.11 | 0.15 | YES |
| 44 | RQCD1 | RQCD1 | RQCD1 | 4641 | 0.11 | 0.15 | YES |
| 45 | NUP85 | NUP85 | NUP85 | 4679 | 0.11 | 0.16 | YES |
| 46 | RPS27 | RPS27 | RPS27 | 4778 | 0.11 | 0.16 | YES |
| 47 | KHSRP | KHSRP | KHSRP | 4785 | 0.11 | 0.16 | YES |
| 48 | RPL13 | RPL13 | RPL13 | 4918 | 0.1 | 0.16 | YES |
| 49 | LSM4 | LSM4 | LSM4 | 4982 | 0.1 | 0.16 | YES |
| 50 | RPSAP9 | RPSAP9 | RPSAP9 | 4987 | 0.1 | 0.17 | YES |
| 51 | RPS21 | RPS21 | RPS21 | 5018 | 0.099 | 0.17 | YES |
| 52 | SNRPF | SNRPF | SNRPF | 5059 | 0.098 | 0.18 | YES |
| 53 | NUP155 | NUP155 | NUP155 | 5071 | 0.097 | 0.18 | YES |
| 54 | RPL30 | RPL30 | RPL30 | 5187 | 0.093 | 0.18 | YES |
| 55 | RPL35A | RPL35A | RPL35A | 5229 | 0.092 | 0.18 | YES |
| 56 | PSMB8 | PSMB8 | PSMB8 | 5272 | 0.091 | 0.19 | YES |
| 57 | PSMD2 | PSMD2 | PSMD2 | 5278 | 0.091 | 0.19 | YES |
| 58 | NUP153 | NUP153 | NUP153 | 5344 | 0.088 | 0.19 | YES |
| 59 | RPL5 | RPL5 | RPL5 | 5361 | 0.088 | 0.2 | YES |
| 60 | RPL7 | RPL7 | RPL7 | 5368 | 0.088 | 0.2 | YES |
| 61 | RPLP2 | RPLP2 | RPLP2 | 5370 | 0.088 | 0.2 | YES |
| 62 | EXOSC3 | EXOSC3 | EXOSC3 | 5405 | 0.086 | 0.21 | YES |
| 63 | PSMD14 | PSMD14 | PSMD14 | 5453 | 0.085 | 0.21 | YES |
| 64 | RPS17 | RPS17 | RPS17 | 5499 | 0.084 | 0.21 | YES |
| 65 | NUP62 | NUP62 | NUP62 | 5503 | 0.084 | 0.22 | YES |
| 66 | PSMC3 | PSMC3 | PSMC3 | 5532 | 0.083 | 0.22 | YES |
| 67 | RPL8 | RPL8 | RPL8 | 5543 | 0.083 | 0.22 | YES |
| 68 | GEMIN6 | GEMIN6 | GEMIN6 | 5567 | 0.082 | 0.23 | YES |
| 69 | PSMB10 | PSMB10 | PSMB10 | 5604 | 0.081 | 0.23 | YES |
| 70 | UBA52 | UBA52 | UBA52 | 5614 | 0.081 | 0.23 | YES |
| 71 | PSMC2 | PSMC2 | PSMC2 | 5622 | 0.081 | 0.24 | YES |
| 72 | RPS18 | RPS18 | RPS18 | 5638 | 0.08 | 0.24 | YES |
| 73 | RPL38 | RPL38 | RPL38 | 5651 | 0.08 | 0.25 | YES |
| 74 | RPL37 | RPL37 | RPL37 | 5653 | 0.08 | 0.25 | YES |
| 75 | PSMD4 | PSMD4 | PSMD4 | 5677 | 0.08 | 0.25 | YES |
| 76 | SNRPB | SNRPB | SNRPB | 5684 | 0.079 | 0.26 | YES |
| 77 | RBM8A | RBM8A | RBM8A | 5714 | 0.079 | 0.26 | YES |
| 78 | PSMA4 | PSMA4 | PSMA4 | 5737 | 0.078 | 0.26 | YES |
| 79 | ELAVL1 | ELAVL1 | ELAVL1 | 5785 | 0.077 | 0.26 | YES |
| 80 | RPSA | RPSA | RPSA | 5809 | 0.076 | 0.27 | YES |
| 81 | PSMC4 | PSMC4 | PSMC4 | 5810 | 0.076 | 0.27 | YES |
| 82 | SNRPD2 | SNRPD2 | SNRPD2 | 5820 | 0.076 | 0.28 | YES |
| 83 | RPS6 | RPS6 | RPS6 | 5851 | 0.075 | 0.28 | YES |
| 84 | FAM153A | FAM153A | FAM153A | 5862 | 0.075 | 0.28 | YES |
| 85 | RPS25 | RPS25 | RPS25 | 5868 | 0.075 | 0.29 | YES |
| 86 | RPL27A | RPL27A | RPL27A | 5927 | 0.073 | 0.29 | YES |
| 87 | RPS8 | RPS8 | RPS8 | 5931 | 0.073 | 0.29 | YES |
| 88 | YWHAZ | YWHAZ | YWHAZ | 5946 | 0.073 | 0.29 | YES |
| 89 | RPL36 | RPL36 | RPL36 | 5970 | 0.072 | 0.3 | YES |
| 90 | RPS3 | RPS3 | RPS3 | 5994 | 0.072 | 0.3 | YES |
| 91 | HNRNPD | HNRNPD | HNRNPD | 6014 | 0.071 | 0.3 | YES |
| 92 | SNRPD3 | SNRPD3 | SNRPD3 | 6117 | 0.069 | 0.3 | YES |
| 93 | NUP37 | NUP37 | NUP37 | 6156 | 0.068 | 0.3 | YES |
| 94 | PSMD12 | PSMD12 | PSMD12 | 6165 | 0.068 | 0.3 | YES |
| 95 | NUP50 | NUP50 | NUP50 | 6194 | 0.067 | 0.31 | YES |
| 96 | PSMB6 | PSMB6 | PSMB6 | 6209 | 0.067 | 0.31 | YES |
| 97 | EIF4G1 | EIF4G1 | EIF4G1 | 6213 | 0.066 | 0.31 | YES |
| 98 | PSMA5 | PSMA5 | PSMA5 | 6227 | 0.066 | 0.32 | YES |
| 99 | NUP54 | NUP54 | NUP54 | 6230 | 0.066 | 0.32 | YES |
| 100 | XPO1 | XPO1 | XPO1 | 6293 | 0.065 | 0.32 | YES |
| 101 | EXOSC2 | EXOSC2 | EXOSC2 | 6310 | 0.064 | 0.32 | YES |
| 102 | PSMB7 | PSMB7 | PSMB7 | 6434 | 0.061 | 0.32 | YES |
| 103 | PSMB1 | PSMB1 | PSMB1 | 6453 | 0.061 | 0.32 | YES |
| 104 | PSMC1 | PSMC1 | PSMC1 | 6456 | 0.061 | 0.32 | YES |
| 105 | NUP107 | NUP107 | NUP107 | 6477 | 0.06 | 0.33 | YES |
| 106 | RPL35 | RPL35 | RPL35 | 6492 | 0.059 | 0.33 | YES |
| 107 | RPL24 | RPL24 | RPL24 | 6504 | 0.059 | 0.33 | YES |
| 108 | POM121 | POM121 | POM121 | 6510 | 0.059 | 0.34 | YES |
| 109 | PSMD8 | PSMD8 | PSMD8 | 6549 | 0.058 | 0.34 | YES |
| 110 | EIF4A1 | EIF4A1 | EIF4A1 | 6589 | 0.057 | 0.34 | YES |
| 111 | EDC4 | EDC4 | EDC4 | 6629 | 0.056 | 0.34 | YES |
| 112 | FAU | FAU | FAU | 6649 | 0.056 | 0.34 | YES |
| 113 | SNUPN | SNUPN | SNUPN | 6655 | 0.056 | 0.34 | YES |
| 114 | RNPS1 | RNPS1 | RNPS1 | 6691 | 0.055 | 0.34 | YES |
| 115 | PSMB5 | PSMB5 | PSMB5 | 6699 | 0.055 | 0.35 | YES |
| 116 | PSMD13 | PSMD13 | PSMD13 | 6728 | 0.054 | 0.35 | YES |
| 117 | LSM5 | LSM5 | LSM5 | 6814 | 0.052 | 0.35 | YES |
| 118 | RPL4 | RPL4 | RPL4 | 6820 | 0.052 | 0.35 | YES |
| 119 | RPL11 | RPL11 | RPL11 | 6843 | 0.051 | 0.35 | YES |
| 120 | SNRPE | SNRPE | SNRPE | 6849 | 0.051 | 0.35 | YES |
| 121 | RPL27 | RPL27 | RPL27 | 6875 | 0.051 | 0.36 | YES |
| 122 | RPS24 | RPS24 | RPS24 | 6896 | 0.05 | 0.36 | YES |
| 123 | RPL32 | RPL32 | RPL32 | 6988 | 0.048 | 0.36 | YES |
| 124 | CLNS1A | CLNS1A | CLNS1A | 6990 | 0.048 | 0.36 | YES |
| 125 | RPL37A | RPL37A | RPL37A | 7003 | 0.048 | 0.36 | YES |
| 126 | PSMA2 | PSMA2 | PSMA2 | 7054 | 0.046 | 0.36 | YES |
| 127 | EXOSC9 | EXOSC9 | EXOSC9 | 7067 | 0.046 | 0.36 | YES |
| 128 | RPL28 | RPL28 | RPL28 | 7076 | 0.046 | 0.36 | YES |
| 129 | CNOT7 | CNOT7 | CNOT7 | 7111 | 0.045 | 0.36 | YES |
| 130 | PSMD11 | PSMD11 | PSMD11 | 7122 | 0.045 | 0.37 | YES |
| 131 | EXOSC7 | EXOSC7 | EXOSC7 | 7176 | 0.044 | 0.36 | YES |
| 132 | NCBP2 | NCBP2 | NCBP2 | 7213 | 0.043 | 0.37 | YES |
| 133 | RPS2 | RPS2 | RPS2 | 7227 | 0.043 | 0.37 | YES |
| 134 | EIF4A3 | EIF4A3 | EIF4A3 | 7274 | 0.042 | 0.37 | YES |
| 135 | NUP35 | NUP35 | NUP35 | 7314 | 0.041 | 0.37 | YES |
| 136 | CNOT3 | CNOT3 | CNOT3 | 7315 | 0.041 | 0.37 | YES |
| 137 | RPL31 | RPL31 | RPL31 | 7327 | 0.041 | 0.37 | YES |
| 138 | RPL17 | RPL17 | RPL17 | 7342 | 0.04 | 0.37 | YES |
| 139 | MAPK14 | MAPK14 | MAPK14 | 7400 | 0.039 | 0.37 | YES |
| 140 | XRN1 | XRN1 | XRN1 | 7521 | 0.036 | 0.37 | YES |
| 141 | RPS11 | RPS11 | RPS11 | 7557 | 0.036 | 0.37 | YES |
| 142 | NCBP1 | NCBP1 | NCBP1 | 7583 | 0.035 | 0.37 | YES |
| 143 | RPL26 | RPL26 | RPL26 | 7591 | 0.035 | 0.37 | YES |
| 144 | HSPA1B | HSPA1B | HSPA1B | 7611 | 0.034 | 0.37 | YES |
| 145 | PSMB3 | PSMB3 | PSMB3 | 7612 | 0.034 | 0.37 | YES |
| 146 | PSMA1 | PSMA1 | PSMA1 | 7614 | 0.034 | 0.37 | YES |
| 147 | RPLP0 | RPLP0 | RPLP0 | 7619 | 0.034 | 0.38 | YES |
| 148 | RPS9 | RPS9 | RPS9 | 7627 | 0.034 | 0.38 | YES |
| 149 | RPL18 | RPL18 | RPL18 | 7655 | 0.033 | 0.38 | YES |
| 150 | DDX20 | DDX20 | DDX20 | 7659 | 0.033 | 0.38 | YES |
| 151 | RPS29 | RPS29 | RPS29 | 7693 | 0.032 | 0.38 | NO |
| 152 | PSMA3 | PSMA3 | PSMA3 | 7754 | 0.031 | 0.38 | NO |
| 153 | CNOT10 | CNOT10 | CNOT10 | 7767 | 0.031 | 0.38 | NO |
| 154 | GEMIN7 | GEMIN7 | GEMIN7 | 7816 | 0.03 | 0.38 | NO |
| 155 | RPL12 | RPL12 | RPL12 | 7930 | 0.027 | 0.37 | NO |
| 156 | PSMD1 | PSMD1 | PSMD1 | 7948 | 0.027 | 0.37 | NO |
| 157 | RPS13 | RPS13 | RPS13 | 7982 | 0.026 | 0.37 | NO |
| 158 | RPS15A | RPS15A | RPS15A | 7989 | 0.026 | 0.37 | NO |
| 159 | TPR | TPR | TPR | 8031 | 0.026 | 0.37 | NO |
| 160 | EXOSC1 | EXOSC1 | EXOSC1 | 8082 | 0.024 | 0.37 | NO |
| 161 | RPS28 | RPS28 | RPS28 | 8084 | 0.024 | 0.37 | NO |
| 162 | PAIP1 | PAIP1 | PAIP1 | 8109 | 0.024 | 0.37 | NO |
| 163 | RPL6 | RPL6 | RPL6 | 8175 | 0.022 | 0.37 | NO |
| 164 | PSMD10 | PSMD10 | PSMD10 | 8181 | 0.022 | 0.37 | NO |
| 165 | RPL22 | RPL22 | RPL22 | 8237 | 0.021 | 0.37 | NO |
| 166 | NUP188 | NUP188 | NUP188 | 8244 | 0.021 | 0.37 | NO |
| 167 | DIS3 | DIS3 | DIS3 | 8260 | 0.021 | 0.37 | NO |
| 168 | RPL10A | RPL10A | RPL10A | 8316 | 0.019 | 0.37 | NO |
| 169 | RPS5 | RPS5 | RPS5 | 8435 | 0.017 | 0.36 | NO |
| 170 | RPLP1 | RPLP1 | RPLP1 | 8483 | 0.016 | 0.36 | NO |
| 171 | NUP210 | NUP210 | NUP210 | 8517 | 0.015 | 0.36 | NO |
| 172 | RPL14 | RPL14 | RPL14 | 8522 | 0.015 | 0.36 | NO |
| 173 | UPF3A | UPF3A | UPF3A | 8541 | 0.015 | 0.36 | NO |
| 174 | RAE1 | RAE1 | RAE1 | 8643 | 0.013 | 0.36 | NO |
| 175 | RPL9 | RPL9 | RPL9 | 8655 | 0.012 | 0.36 | NO |
| 176 | HSPA8 | HSPA8 | HSPA8 | 8663 | 0.012 | 0.36 | NO |
| 177 | LSM3 | LSM3 | LSM3 | 8664 | 0.012 | 0.36 | NO |
| 178 | SMG7 | SMG7 | SMG7 | 8677 | 0.012 | 0.36 | NO |
| 179 | C2orf29 | C2orf29 | C2orf29 | 8715 | 0.011 | 0.36 | NO |
| 180 | RPL34 | RPL34 | RPL34 | 8793 | 0.0086 | 0.35 | NO |
| 181 | RPL10 | RPL10 | RPL10 | 8928 | 0.006 | 0.34 | NO |
| 182 | ZFP36L1 | ZFP36L1 | ZFP36L1 | 9004 | 0.0043 | 0.34 | NO |
| 183 | PSME2 | PSME2 | PSME2 | 9069 | 0.0032 | 0.34 | NO |
| 184 | NUPL1 | NUPL1 | NUPL1 | 9189 | 0.00094 | 0.33 | NO |
| 185 | RPL13A | RPL13A | RPL13A | 9221 | 0.000071 | 0.33 | NO |
| 186 | EDC3 | EDC3 | EDC3 | 9269 | -0.00078 | 0.33 | NO |
| 187 | DDX6 | DDX6 | DDX6 | 9306 | -0.0016 | 0.32 | NO |
| 188 | RANBP2 | RANBP2 | RANBP2 | 9318 | -0.0019 | 0.32 | NO |
| 189 | LSM1 | LSM1 | LSM1 | 9353 | -0.0026 | 0.32 | NO |
| 190 | RPL23 | RPL23 | RPL23 | 9382 | -0.0032 | 0.32 | NO |
| 191 | CNOT4 | CNOT4 | CNOT4 | 9401 | -0.0036 | 0.32 | NO |
| 192 | RPL3 | RPL3 | RPL3 | 9430 | -0.0041 | 0.32 | NO |
| 193 | RPL29 | RPL29 | RPL29 | 9473 | -0.0049 | 0.32 | NO |
| 194 | RPL19 | RPL19 | RPL19 | 9513 | -0.0057 | 0.32 | NO |
| 195 | EIF4A2 | EIF4A2 | EIF4A2 | 9546 | -0.0062 | 0.31 | NO |
| 196 | RPS4X | RPS4X | RPS4X | 9578 | -0.0069 | 0.31 | NO |
| 197 | PSMD9 | PSMD9 | PSMD9 | 9583 | -0.007 | 0.31 | NO |
| 198 | RPS3A | RPS3A | RPS3A | 9626 | -0.008 | 0.31 | NO |
| 199 | NUP43 | NUP43 | NUP43 | 9709 | -0.0097 | 0.31 | NO |
| 200 | RPL26L1 | RPL26L1 | RPL26L1 | 9749 | -0.01 | 0.3 | NO |
| 201 | RPL7A | RPL7A | RPL7A | 9774 | -0.011 | 0.3 | NO |
| 202 | TNKS1BP1 | TNKS1BP1 | TNKS1BP1 | 9792 | -0.011 | 0.3 | NO |
| 203 | ETF1 | ETF1 | ETF1 | 9800 | -0.012 | 0.3 | NO |
| 204 | ANP32A | ANP32A | ANP32A | 9840 | -0.013 | 0.3 | NO |
| 205 | RPS26 | RPS26 | RPS26 | 9883 | -0.014 | 0.3 | NO |
| 206 | PPP2R2A | PPP2R2A | PPP2R2A | 9910 | -0.014 | 0.3 | NO |
| 207 | NUP133 | NUP133 | NUP133 | 9947 | -0.015 | 0.3 | NO |
| 208 | PSMD6 | PSMD6 | PSMD6 | 9965 | -0.015 | 0.3 | NO |
| 209 | RPL15 | RPL15 | RPL15 | 10006 | -0.016 | 0.3 | NO |
| 210 | PRMT5 | PRMT5 | PRMT5 | 10009 | -0.016 | 0.3 | NO |
| 211 | RPL23A | RPL23A | RPL23A | 10028 | -0.017 | 0.3 | NO |
| 212 | PPP2R1A | PPP2R1A | PPP2R1A | 10082 | -0.018 | 0.3 | NO |
| 213 | NUP214 | NUP214 | NUP214 | 10113 | -0.018 | 0.3 | NO |
| 214 | PSMF1 | PSMF1 | PSMF1 | 10217 | -0.021 | 0.29 | NO |
| 215 | RPS15 | RPS15 | RPS15 | 10220 | -0.021 | 0.29 | NO |
| 216 | PSMA6 | PSMA6 | PSMA6 | 10428 | -0.026 | 0.28 | NO |
| 217 | MAPK11 | MAPK11 | MAPK11 | 10463 | -0.026 | 0.28 | NO |
| 218 | RPS14 | RPS14 | RPS14 | 10475 | -0.027 | 0.28 | NO |
| 219 | RPS23 | RPS23 | RPS23 | 10555 | -0.028 | 0.28 | NO |
| 220 | MAPKAPK2 | MAPKAPK2 | MAPKAPK2 | 10754 | -0.033 | 0.27 | NO |
| 221 | GEMIN5 | GEMIN5 | GEMIN5 | 10978 | -0.038 | 0.26 | NO |
| 222 | PSMC5 | PSMC5 | PSMC5 | 11075 | -0.041 | 0.26 | NO |
| 223 | YWHAB | YWHAB | YWHAB | 11123 | -0.042 | 0.26 | NO |
| 224 | PSMD3 | PSMD3 | PSMD3 | 11163 | -0.043 | 0.26 | NO |
| 225 | SMN2 | SMN2 | SMN2 | 11178 | -0.043 | 0.26 | NO |
| 226 | SMG1 | SMG1 | SMG1 | 11286 | -0.046 | 0.26 | NO |
| 227 | DCP1A | DCP1A | DCP1A | 11388 | -0.048 | 0.25 | NO |
| 228 | PARN | PARN | PARN | 11426 | -0.049 | 0.25 | NO |
| 229 | DCP1B | DCP1B | DCP1B | 11642 | -0.055 | 0.24 | NO |
| 230 | CNOT2 | CNOT2 | CNOT2 | 11808 | -0.06 | 0.24 | NO |
| 231 | SMG6 | SMG6 | SMG6 | 11815 | -0.06 | 0.24 | NO |
| 232 | EIF4E | EIF4E | EIF4E | 11900 | -0.062 | 0.24 | NO |
| 233 | ZFP36 | ZFP36 | ZFP36 | 11931 | -0.063 | 0.24 | NO |
| 234 | PSMC6 | PSMC6 | PSMC6 | 11949 | -0.063 | 0.24 | NO |
| 235 | TNPO1 | TNPO1 | TNPO1 | 11976 | -0.064 | 0.25 | NO |
| 236 | CASC3 | CASC3 | CASC3 | 11996 | -0.065 | 0.25 | NO |
| 237 | RPL41 | RPL41 | RPL41 | 12043 | -0.066 | 0.25 | NO |
| 238 | AKT1 | AKT1 | AKT1 | 12078 | -0.066 | 0.25 | NO |
| 239 | CNOT6 | CNOT6 | CNOT6 | 12087 | -0.067 | 0.26 | NO |
| 240 | PSMD5 | PSMD5 | PSMD5 | 12552 | -0.079 | 0.24 | NO |
| 241 | CNOT8 | CNOT8 | CNOT8 | 12906 | -0.088 | 0.22 | NO |
| 242 | AAAS | AAAS | AAAS | 12962 | -0.09 | 0.22 | NO |
| 243 | DCP2 | DCP2 | DCP2 | 13135 | -0.096 | 0.22 | NO |
| 244 | EIF4B | EIF4B | EIF4B | 13168 | -0.097 | 0.22 | NO |
| 245 | PPP2CA | PPP2CA | PPP2CA | 13462 | -0.11 | 0.21 | NO |
| 246 | PHAX | PHAX | PHAX | 13598 | -0.11 | 0.21 | NO |
| 247 | PSME1 | PSME1 | PSME1 | 14033 | -0.13 | 0.19 | NO |
| 248 | PRKCD | PRKCD | PRKCD | 14833 | -0.16 | 0.16 | NO |
| 249 | SMN1 | SMN1 | SMN1 | 15237 | -0.19 | 0.14 | NO |
| 250 | TNFSF13 | TNFSF13 | TNFSF13 | 15510 | -0.2 | 0.14 | NO |
| 251 | HSPB1 | HSPB1 | HSPB1 | 15730 | -0.22 | 0.14 | NO |
Figure S87. Get High-res Image This plot shows mRNAseq_cNMF expression data heatmap (on the left) a RunningEnrichmentScore(RES) plot (on the top right) and a Signal2Noise(S2N) plot (on the bottom right) of genes in the pathway: KEGG CELL CYCLE.
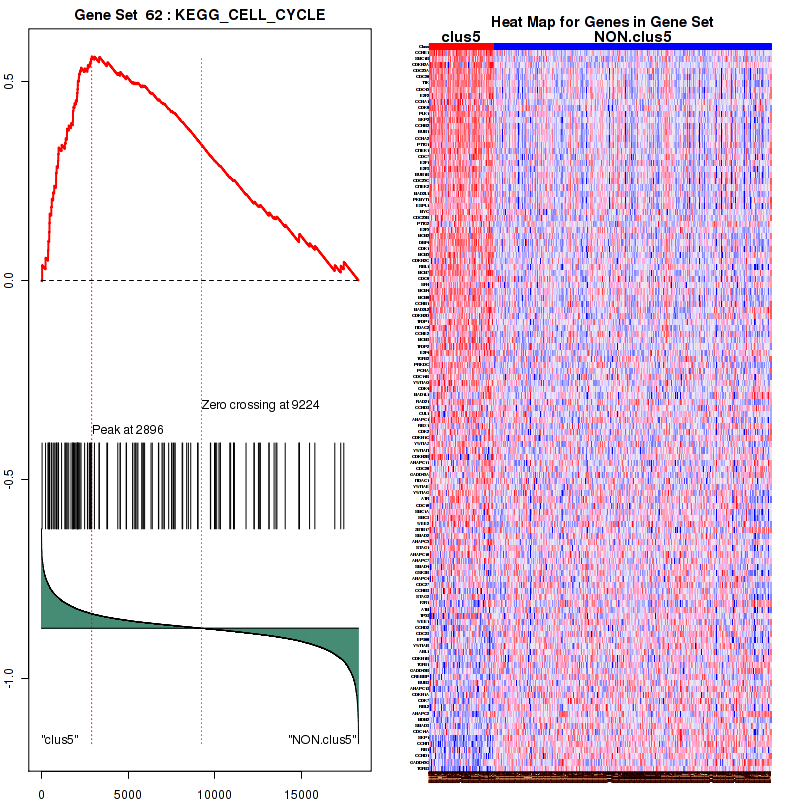
Figure S88. Get High-res Image For the top 5 core enriched genes in the pathway: KEGG CELL CYCLE, this volcano plot shows how much they are up/down-regulated and significant. The significance was calculated by empirical bayesian fit
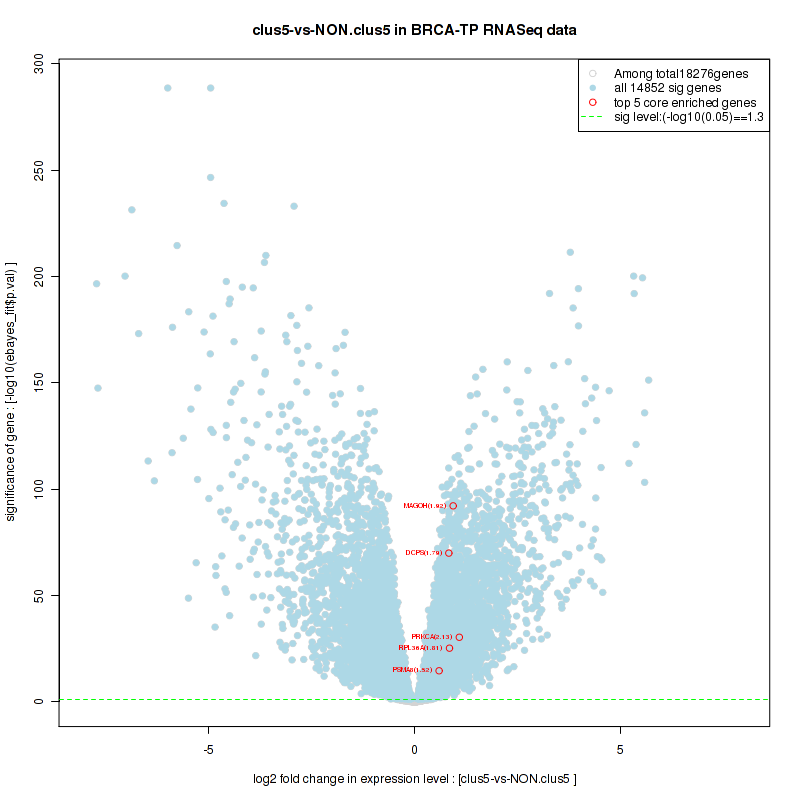
Table S45. Get Full Table This table shows a Running Enrichment Score (RES) of each gene in this pathway, that is, the enrichment score at this point in the ranked list of genes. All genes are ranked by Signal-to-Noise (S2N), a measure of similarity as default and are used to obtain ES matrix of all genes. In this way, GSEA tool uses expression pattern of not only overlapped genes but also not-overlapped genes to produce ES matrix.
| Rank | GENE | SYMBOL | DESC | LIST.LOC | S2N | RES | CORE_ENRICHMENT |
|---|---|---|---|---|---|---|---|
| 1 | MAGOH | MAGOH | MAGOH | 1984 | 0.26 | -0.032 | YES |
| 2 | THOC4 | THOC4 | THOC4 | 2289 | 0.23 | 0.02 | YES |
| 3 | NUP93 | NUP93 | NUP93 | 2349 | 0.22 | 0.084 | YES |
| 4 | UPF3B | UPF3B | UPF3B | 2627 | 0.2 | 0.13 | YES |
| 5 | SEH1L | SEH1L | SEH1L | 3159 | 0.17 | 0.15 | YES |
| 6 | NUP205 | NUP205 | NUP205 | 3912 | 0.14 | 0.15 | YES |
| 7 | U2AF1 | U2AF1 | U2AF1 | 4050 | 0.13 | 0.18 | YES |
| 8 | NUPL2 | NUPL2 | NUPL2 | 4195 | 0.13 | 0.22 | YES |
| 9 | NUP88 | NUP88 | NUP88 | 4426 | 0.12 | 0.24 | YES |
| 10 | CPSF3 | CPSF3 | CPSF3 | 4485 | 0.12 | 0.27 | YES |
| 11 | DHX38 | DHX38 | DHX38 | 4513 | 0.12 | 0.3 | YES |
| 12 | NUP85 | NUP85 | NUP85 | 4679 | 0.11 | 0.33 | YES |
| 13 | CPSF1 | CPSF1 | CPSF1 | 4848 | 0.1 | 0.35 | YES |
| 14 | NUP155 | NUP155 | NUP155 | 5071 | 0.097 | 0.36 | YES |
| 15 | NUP153 | NUP153 | NUP153 | 5344 | 0.088 | 0.38 | YES |
| 16 | NUP62 | NUP62 | NUP62 | 5503 | 0.084 | 0.39 | YES |
| 17 | RBM8A | RBM8A | RBM8A | 5714 | 0.079 | 0.4 | YES |
| 18 | SLBP | SLBP | SLBP | 5881 | 0.074 | 0.42 | YES |
| 19 | NUP37 | NUP37 | NUP37 | 6156 | 0.068 | 0.42 | YES |
| 20 | NUP50 | NUP50 | NUP50 | 6194 | 0.067 | 0.44 | YES |
| 21 | NUP54 | NUP54 | NUP54 | 6230 | 0.066 | 0.46 | YES |
| 22 | NUP107 | NUP107 | NUP107 | 6477 | 0.06 | 0.46 | YES |
| 23 | POM121 | POM121 | POM121 | 6510 | 0.059 | 0.48 | YES |
| 24 | RNPS1 | RNPS1 | RNPS1 | 6691 | 0.055 | 0.49 | YES |
| 25 | SRRM1 | SRRM1 | SRRM1 | 6923 | 0.049 | 0.49 | YES |
| 26 | NCBP2 | NCBP2 | NCBP2 | 7213 | 0.043 | 0.49 | YES |
| 27 | NUP35 | NUP35 | NUP35 | 7314 | 0.041 | 0.49 | YES |
| 28 | NCBP1 | NCBP1 | NCBP1 | 7583 | 0.035 | 0.49 | NO |
| 29 | TPR | TPR | TPR | 8031 | 0.026 | 0.47 | NO |
| 30 | NUP188 | NUP188 | NUP188 | 8244 | 0.021 | 0.47 | NO |
| 31 | NUP210 | NUP210 | NUP210 | 8517 | 0.015 | 0.46 | NO |
| 32 | RAE1 | RAE1 | RAE1 | 8643 | 0.013 | 0.45 | NO |
| 33 | U2AF2 | U2AF2 | U2AF2 | 8892 | 0.0068 | 0.44 | NO |
| 34 | NUPL1 | NUPL1 | NUPL1 | 9189 | 0.00094 | 0.43 | NO |
| 35 | NXF1 | NXF1 | NXF1 | 9233 | -0.00012 | 0.42 | NO |
| 36 | RANBP2 | RANBP2 | RANBP2 | 9318 | -0.0019 | 0.42 | NO |
| 37 | CDC40 | CDC40 | CDC40 | 9410 | -0.0037 | 0.42 | NO |
| 38 | NFX1 | NFX1 | NFX1 | 9471 | -0.0049 | 0.41 | NO |
| 39 | NUP43 | NUP43 | NUP43 | 9709 | -0.0097 | 0.4 | NO |
| 40 | NUP133 | NUP133 | NUP133 | 9947 | -0.015 | 0.4 | NO |
| 41 | NUP214 | NUP214 | NUP214 | 10113 | -0.018 | 0.39 | NO |
| 42 | CPSF2 | CPSF2 | CPSF2 | 10841 | -0.035 | 0.36 | NO |
| 43 | EIF4E | EIF4E | EIF4E | 11900 | -0.062 | 0.32 | NO |
| 44 | AAAS | AAAS | AAAS | 12962 | -0.09 | 0.29 | NO |
Figure S89. Get High-res Image This plot shows mRNAseq_cNMF expression data heatmap (on the left) a RunningEnrichmentScore(RES) plot (on the top right) and a Signal2Noise(S2N) plot (on the bottom right) of genes in the pathway: PID AURORA B PATHWAY.
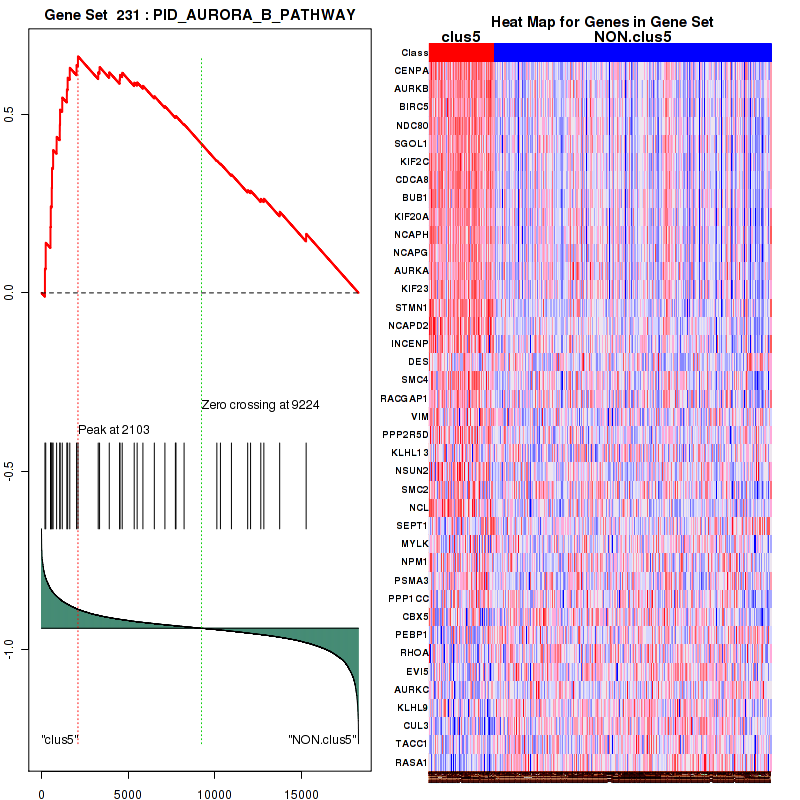
Figure S90. Get High-res Image For the top 5 core enriched genes in the pathway: PID AURORA B PATHWAY, this volcano plot shows how much they are up/down-regulated and significant. The significance was calculated by empirical bayesian fit
Table S46. Get Full Table This table shows a Running Enrichment Score (RES) of each gene in this pathway, that is, the enrichment score at this point in the ranked list of genes. All genes are ranked by Signal-to-Noise (S2N), a measure of similarity as default and are used to obtain ES matrix of all genes. In this way, GSEA tool uses expression pattern of not only overlapped genes but also not-overlapped genes to produce ES matrix.
| Rank | GENE | SYMBOL | DESC | LIST.LOC | S2N | RES | CORE_ENRICHMENT |
|---|---|---|---|---|---|---|---|
| 1 | CENPA | CENPA | CENPA | 202 | 0.68 | 0.13 | YES |
| 2 | AURKB | AURKB | AURKB | 246 | 0.64 | 0.26 | YES |
| 3 | BIRC5 | BIRC5 | BIRC5 | 520 | 0.51 | 0.34 | YES |
| 4 | DLGAP5 | DLGAP5 | DLGAP5 | 873 | 0.41 | 0.41 | YES |
| 5 | TPX2 | TPX2 | TPX2 | 1175 | 0.35 | 0.46 | YES |
| 6 | AURKA | AURKA | AURKA | 1464 | 0.32 | 0.51 | YES |
| 7 | CDC25B | CDC25B | CDC25B | 1844 | 0.27 | 0.55 | YES |
| 8 | TACC3 | TACC3 | TACC3 | 2232 | 0.23 | 0.57 | YES |
| 9 | PPP2R5D | PPP2R5D | PPP2R5D | 4526 | 0.11 | 0.47 | NO |
| 10 | RAN | RAN | RAN | 4936 | 0.1 | 0.47 | NO |
| 11 | NDEL1 | NDEL1 | NDEL1 | 5412 | 0.086 | 0.46 | NO |
| 12 | CKAP5 | CKAP5 | CKAP5 | 5590 | 0.081 | 0.47 | NO |
| 13 | GIT1 | GIT1 | GIT1 | 5914 | 0.074 | 0.46 | NO |
| 14 | AURKAIP1 | AURKAIP1 | AURKAIP1 | 6540 | 0.058 | 0.44 | NO |
| 15 | ARHGEF7 | ARHGEF7 | ARHGEF7 | 6818 | 0.052 | 0.44 | NO |
| 16 | GADD45A | GADD45A | GADD45A | 6948 | 0.049 | 0.44 | NO |
| 17 | PAK1 | PAK1 | PAK1 | 8449 | 0.017 | 0.36 | NO |
| 18 | PRKACA | PRKACA | PRKACA | 8992 | 0.0045 | 0.33 | NO |
| 19 | OAZ1 | OAZ1 | OAZ1 | 9377 | -0.0031 | 0.31 | NO |
| 20 | NFKBIA | NFKBIA | NFKBIA | 9446 | -0.0045 | 0.31 | NO |
| 21 | GSK3B | GSK3B | GSK3B | 9737 | -0.01 | 0.3 | NO |
| 22 | JUB | JUB | JUB | 10166 | -0.02 | 0.28 | NO |
| 23 | FZR1 | FZR1 | FZR1 | 10233 | -0.021 | 0.28 | NO |
| 24 | TP53 | TP53 | TP53 | 10310 | -0.022 | 0.28 | NO |
| 25 | AKT1 | AKT1 | AKT1 | 12078 | -0.066 | 0.2 | NO |
| 26 | BRCA1 | BRCA1 | BRCA1 | 12728 | -0.084 | 0.18 | NO |
| 27 | TDRD7 | TDRD7 | TDRD7 | 12795 | -0.085 | 0.19 | NO |
| 28 | CPEB1 | CPEB1 | CPEB1 | 13647 | -0.11 | 0.17 | NO |
| 29 | TACC1 | TACC1 | TACC1 | 13732 | -0.12 | 0.18 | NO |
| 30 | MDM2 | MDM2 | MDM2 | 14050 | -0.13 | 0.19 | NO |
| 31 | RASA1 | RASA1 | RASA1 | 15256 | -0.19 | 0.17 | NO |
Figure S91. Get High-res Image This plot shows mRNAseq_cNMF expression data heatmap (on the left) a RunningEnrichmentScore(RES) plot (on the top right) and a Signal2Noise(S2N) plot (on the bottom right) of genes in the pathway: PID E2F PATHWAY.
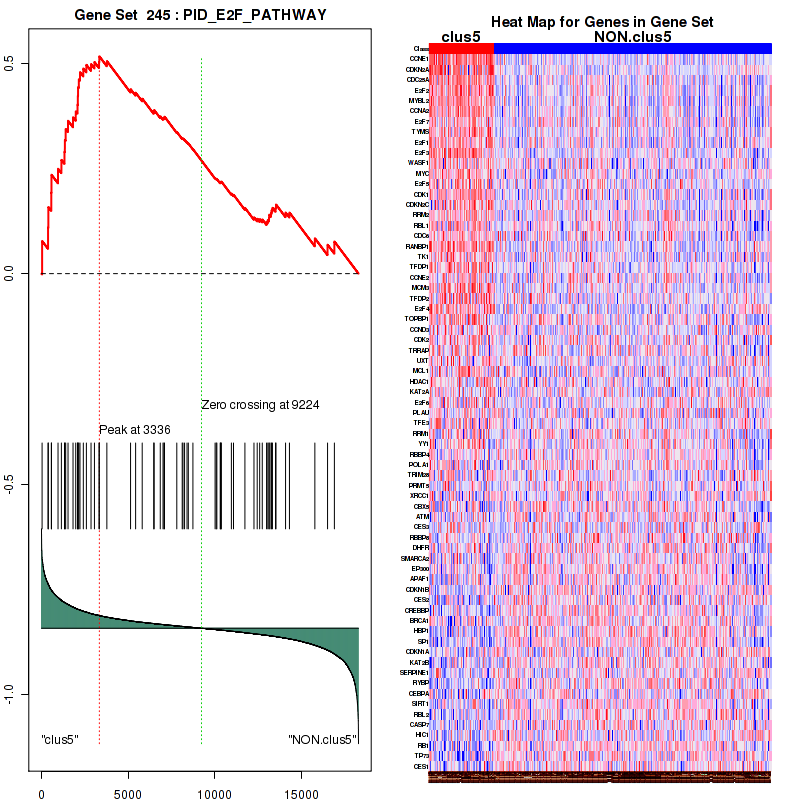
Figure S92. Get High-res Image For the top 5 core enriched genes in the pathway: PID E2F PATHWAY, this volcano plot shows how much they are up/down-regulated and significant. The significance was calculated by empirical bayesian fit
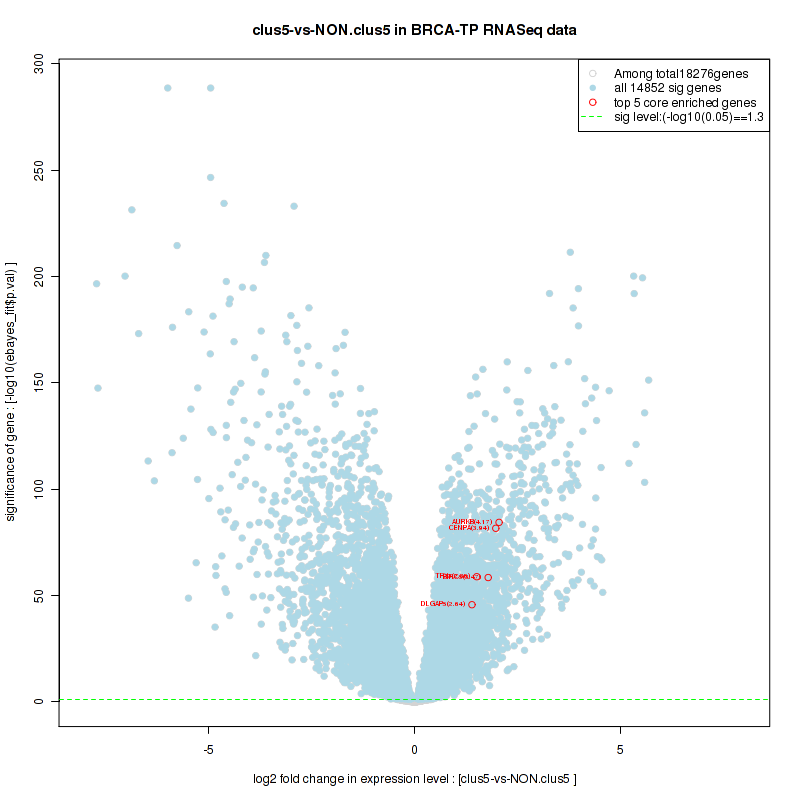
Table S47. Get Full Table This table shows a Running Enrichment Score (RES) of each gene in this pathway, that is, the enrichment score at this point in the ranked list of genes. All genes are ranked by Signal-to-Noise (S2N), a measure of similarity as default and are used to obtain ES matrix of all genes. In this way, GSEA tool uses expression pattern of not only overlapped genes but also not-overlapped genes to produce ES matrix.
| Rank | GENE | SYMBOL | DESC | LIST.LOC | S2N | RES | CORE_ENRICHMENT |
|---|---|---|---|---|---|---|---|
| 1 | BBOX1 | BBOX1 | BBOX1 | 217 | 0.67 | 0.12 | YES |
| 2 | AADAT | AADAT | AADAT | 440 | 0.55 | 0.21 | YES |
| 3 | OGDHL | OGDHL | OGDHL | 1025 | 0.38 | 0.26 | YES |
| 4 | SUV39H2 | SUV39H2 | SUV39H2 | 1094 | 0.37 | 0.32 | YES |
| 5 | PLOD1 | PLOD1 | PLOD1 | 1857 | 0.27 | 0.33 | YES |
| 6 | PLOD3 | PLOD3 | PLOD3 | 2296 | 0.23 | 0.35 | YES |
| 7 | PLOD2 | PLOD2 | PLOD2 | 2692 | 0.2 | 0.37 | YES |
| 8 | ACAT2 | ACAT2 | ACAT2 | 3153 | 0.17 | 0.38 | YES |
| 9 | SUV39H1 | SUV39H1 | SUV39H1 | 3501 | 0.16 | 0.39 | YES |
| 10 | ALDH1B1 | ALDH1B1 | ALDH1B1 | 4593 | 0.11 | 0.35 | NO |
| 11 | EHMT2 | EHMT2 | EHMT2 | 5140 | 0.095 | 0.34 | NO |
| 12 | SETD8 | SETD8 | SETD8 | 5224 | 0.092 | 0.36 | NO |
| 13 | DOT1L | DOT1L | DOT1L | 5741 | 0.078 | 0.34 | NO |
| 14 | SETDB1 | SETDB1 | SETDB1 | 5981 | 0.072 | 0.34 | NO |
| 15 | TMLHE | TMLHE | TMLHE | 6466 | 0.06 | 0.33 | NO |
| 16 | WHSC1 | WHSC1 | WHSC1 | 7006 | 0.047 | 0.31 | NO |
| 17 | PIPOX | PIPOX | PIPOX | 7431 | 0.038 | 0.29 | NO |
| 18 | ALDH7A1 | ALDH7A1 | ALDH7A1 | 7976 | 0.026 | 0.27 | NO |
| 19 | HADHA | HADHA | HADHA | 8412 | 0.018 | 0.25 | NO |
| 20 | SETD1A | SETD1A | SETD1A | 8835 | 0.0077 | 0.22 | NO |
| 21 | OGDH | OGDH | OGDH | 9244 | -0.00032 | 0.2 | NO |
| 22 | GCDH | GCDH | GCDH | 9600 | -0.0075 | 0.18 | NO |
| 23 | EHHADH | EHHADH | EHHADH | 9836 | -0.013 | 0.17 | NO |
| 24 | HADH | HADH | HADH | 9893 | -0.014 | 0.17 | NO |
| 25 | SUV420H1 | SUV420H1 | SUV420H1 | 9929 | -0.015 | 0.18 | NO |
| 26 | ALDH9A1 | ALDH9A1 | ALDH9A1 | 10127 | -0.019 | 0.17 | NO |
| 27 | DLST | DLST | DLST | 10194 | -0.02 | 0.17 | NO |
| 28 | AASDHPPT | AASDHPPT | AASDHPPT | 10490 | -0.027 | 0.16 | NO |
| 29 | NSD1 | NSD1 | NSD1 | 10741 | -0.033 | 0.15 | NO |
| 30 | ACAT1 | ACAT1 | ACAT1 | 11061 | -0.04 | 0.14 | NO |
| 31 | ECHS1 | ECHS1 | ECHS1 | 11378 | -0.048 | 0.13 | NO |
| 32 | SETD2 | SETD2 | SETD2 | 11611 | -0.054 | 0.13 | NO |
| 33 | SUV420H2 | SUV420H2 | SUV420H2 | 11612 | -0.054 | 0.14 | NO |
| 34 | SETD1B | SETD1B | SETD1B | 11635 | -0.055 | 0.15 | NO |
| 35 | SETMAR | SETMAR | SETMAR | 11884 | -0.061 | 0.15 | NO |
| 36 | ASH1L | ASH1L | ASH1L | 11985 | -0.064 | 0.16 | NO |
| 37 | WHSC1L1 | WHSC1L1 | WHSC1L1 | 12468 | -0.077 | 0.14 | NO |
| 38 | AASDH | AASDH | AASDH | 13195 | -0.098 | 0.12 | NO |
| 39 | EHMT1 | EHMT1 | EHMT1 | 13339 | -0.1 | 0.14 | NO |
| 40 | ALDH2 | ALDH2 | ALDH2 | 13392 | -0.1 | 0.15 | NO |
| 41 | SETDB2 | SETDB2 | SETDB2 | 13630 | -0.11 | 0.16 | NO |
| 42 | ALDH3A2 | ALDH3A2 | ALDH3A2 | 14419 | -0.14 | 0.15 | NO |
| 43 | AASS | AASS | AASS | 14899 | -0.16 | 0.15 | NO |
| 44 | SETD7 | SETD7 | SETD7 | 14989 | -0.17 | 0.18 | NO |
Figure S93. Get High-res Image This plot shows mRNAseq_cNMF expression data heatmap (on the left) a RunningEnrichmentScore(RES) plot (on the top right) and a Signal2Noise(S2N) plot (on the bottom right) of genes in the pathway: PID MYC ACTIVPATHWAY.
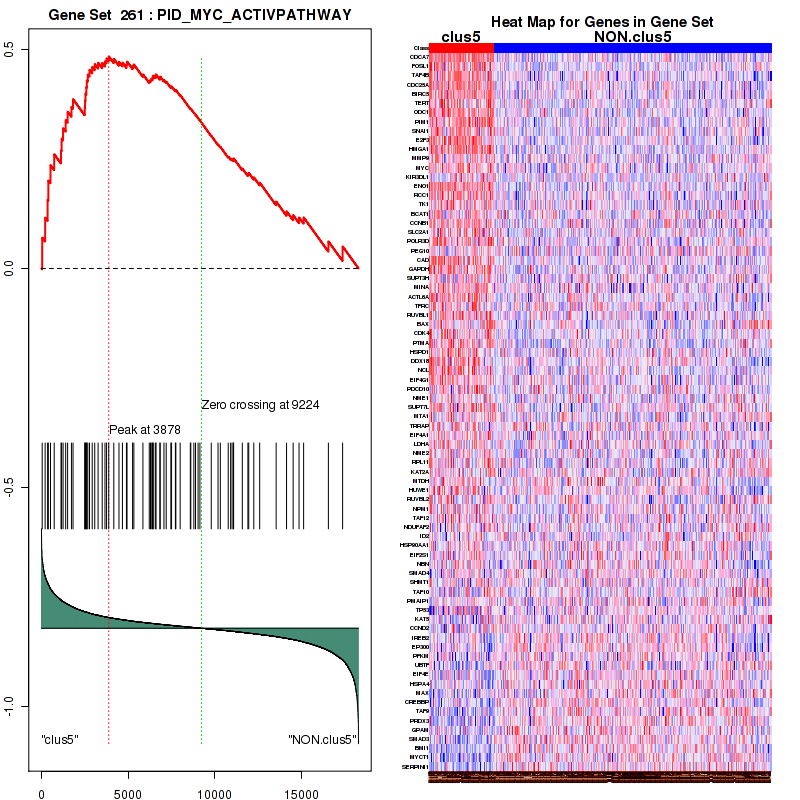
Figure S94. Get High-res Image For the top 5 core enriched genes in the pathway: PID MYC ACTIVPATHWAY, this volcano plot shows how much they are up/down-regulated and significant. The significance was calculated by empirical bayesian fit
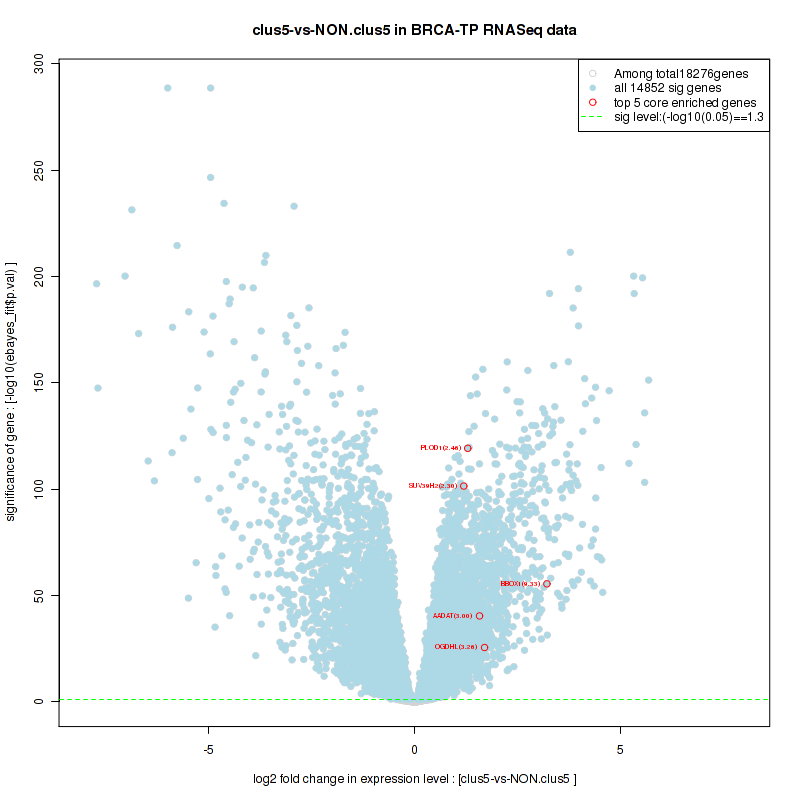
Table S48. Get Full Table This table shows a Running Enrichment Score (RES) of each gene in this pathway, that is, the enrichment score at this point in the ranked list of genes. All genes are ranked by Signal-to-Noise (S2N), a measure of similarity as default and are used to obtain ES matrix of all genes. In this way, GSEA tool uses expression pattern of not only overlapped genes but also not-overlapped genes to produce ES matrix.
| Rank | GENE | SYMBOL | DESC | LIST.LOC | S2N | RES | CORE_ENRICHMENT |
|---|---|---|---|---|---|---|---|
| 1 | LRP8 | LRP8 | LRP8 | 253 | 0.64 | 0.2 | YES |
| 2 | PLA2G7 | PLA2G7 | PLA2G7 | 974 | 0.39 | 0.29 | YES |
| 3 | VLDLR | VLDLR | VLDLR | 1368 | 0.33 | 0.38 | YES |
| 4 | DCX | DCX | DCX | 2456 | 0.22 | 0.39 | YES |
| 5 | KATNA1 | KATNA1 | KATNA1 | 2657 | 0.2 | 0.44 | YES |
| 6 | CDK5R1 | CDK5R1 | CDK5R1 | 3021 | 0.18 | 0.48 | YES |
| 7 | CDK5R2 | CDK5R2 | CDK5R2 | 3073 | 0.18 | 0.54 | YES |
| 8 | PPP2R5D | PPP2R5D | PPP2R5D | 4526 | 0.11 | 0.5 | NO |
| 9 | NDEL1 | NDEL1 | NDEL1 | 5412 | 0.086 | 0.48 | NO |
| 10 | MAP1B | MAP1B | MAP1B | 6605 | 0.057 | 0.43 | NO |
| 11 | YWHAE | YWHAE | YWHAE | 7086 | 0.046 | 0.42 | NO |
| 12 | NUDC | NUDC | NUDC | 7774 | 0.031 | 0.39 | NO |
| 13 | CSNK2A1 | CSNK2A1 | CSNK2A1 | 8148 | 0.023 | 0.38 | NO |
| 14 | DYNLT1 | DYNLT1 | DYNLT1 | 8446 | 0.017 | 0.37 | NO |
| 15 | DYNC1H1 | DYNC1H1 | DYNC1H1 | 8783 | 0.0088 | 0.35 | NO |
| 16 | PAFAH1B1 | PAFAH1B1 | PAFAH1B1 | 9090 | 0.0028 | 0.34 | NO |
| 17 | RELN | RELN | RELN | 9180 | 0.0011 | 0.33 | NO |
| 18 | RAC1 | RAC1 | RAC1 | 9523 | -0.0059 | 0.31 | NO |
| 19 | CDK5 | CDK5 | CDK5 | 9587 | -0.0071 | 0.31 | NO |
| 20 | IQGAP1 | IQGAP1 | IQGAP1 | 9977 | -0.016 | 0.3 | NO |
| 21 | PAFAH1B2 | PAFAH1B2 | PAFAH1B2 | 10301 | -0.022 | 0.29 | NO |
| 22 | RHOA | RHOA | RHOA | 10950 | -0.038 | 0.26 | NO |
| 23 | CLIP1 | CLIP1 | CLIP1 | 11135 | -0.042 | 0.27 | NO |
| 24 | LRPAP1 | LRPAP1 | LRPAP1 | 11275 | -0.046 | 0.28 | NO |
| 25 | CDC42 | CDC42 | CDC42 | 11321 | -0.046 | 0.29 | NO |
| 26 | ABL1 | ABL1 | ABL1 | 11791 | -0.059 | 0.28 | NO |
| 27 | PAFAH1B3 | PAFAH1B3 | PAFAH1B3 | 11913 | -0.062 | 0.3 | NO |
| 28 | DAB1 | DAB1 | DAB1 | 14831 | -0.16 | 0.19 | NO |
Figure S95. Get High-res Image This plot shows mRNAseq_cNMF expression data heatmap (on the left) a RunningEnrichmentScore(RES) plot (on the top right) and a Signal2Noise(S2N) plot (on the bottom right) of genes in the pathway: PID LIS1PATHWAY.
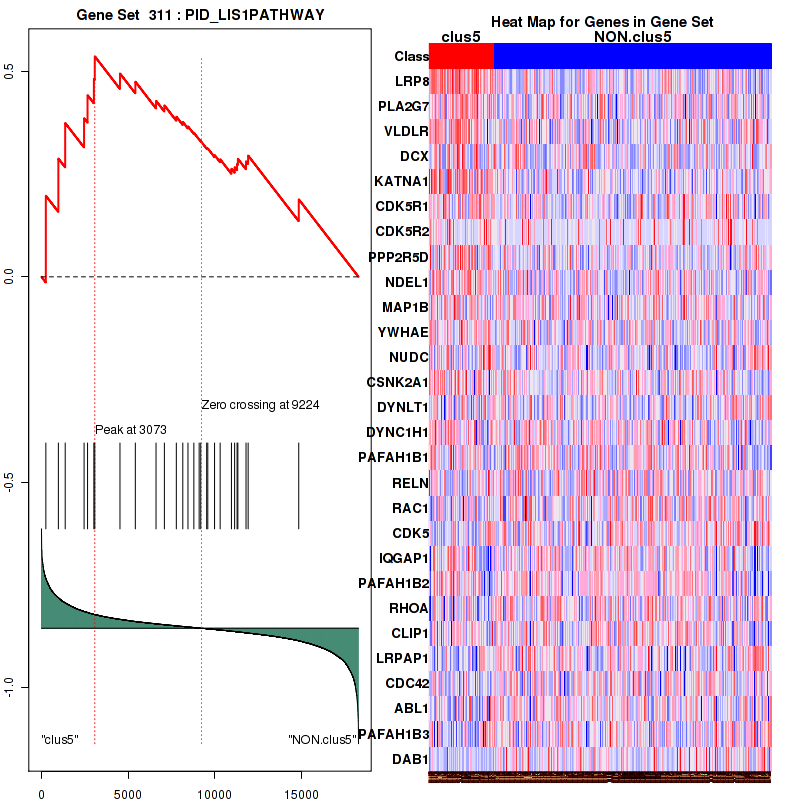
Figure S96. Get High-res Image For the top 5 core enriched genes in the pathway: PID LIS1PATHWAY, this volcano plot shows how much they are up/down-regulated and significant. The significance was calculated by empirical bayesian fit

Table S49. Get Full Table This table shows a Running Enrichment Score (RES) of each gene in this pathway, that is, the enrichment score at this point in the ranked list of genes. All genes are ranked by Signal-to-Noise (S2N), a measure of similarity as default and are used to obtain ES matrix of all genes. In this way, GSEA tool uses expression pattern of not only overlapped genes but also not-overlapped genes to produce ES matrix.
| Rank | GENE | SYMBOL | DESC | LIST.LOC | S2N | RES | CORE_ENRICHMENT |
|---|---|---|---|---|---|---|---|
| 1 | HMGA1 | HMGA1 | HMGA1 | 1508 | 0.31 | 0.038 | YES |
| 2 | NUP93 | NUP93 | NUP93 | 2349 | 0.22 | 0.08 | YES |
| 3 | PSIP1 | PSIP1 | PSIP1 | 2688 | 0.2 | 0.14 | YES |
| 4 | SEH1L | SEH1L | SEH1L | 3159 | 0.17 | 0.18 | YES |
| 5 | NUP205 | NUP205 | NUP205 | 3912 | 0.14 | 0.19 | YES |
| 6 | NUPL2 | NUPL2 | NUPL2 | 4195 | 0.13 | 0.23 | YES |
| 7 | NUP88 | NUP88 | NUP88 | 4426 | 0.12 | 0.26 | YES |
| 8 | NUP85 | NUP85 | NUP85 | 4679 | 0.11 | 0.29 | YES |
| 9 | NUP155 | NUP155 | NUP155 | 5071 | 0.097 | 0.31 | YES |
| 10 | NUP153 | NUP153 | NUP153 | 5344 | 0.088 | 0.33 | YES |
| 11 | SLC25A5 | SLC25A5 | SLC25A5 | 5487 | 0.084 | 0.35 | YES |
| 12 | NUP62 | NUP62 | NUP62 | 5503 | 0.084 | 0.38 | YES |
| 13 | BANF1 | BANF1 | BANF1 | 5973 | 0.072 | 0.39 | YES |
| 14 | NUP37 | NUP37 | NUP37 | 6156 | 0.068 | 0.4 | YES |
| 15 | NUP50 | NUP50 | NUP50 | 6194 | 0.067 | 0.43 | YES |
| 16 | NUP54 | NUP54 | NUP54 | 6230 | 0.066 | 0.45 | YES |
| 17 | NUP107 | NUP107 | NUP107 | 6477 | 0.06 | 0.46 | YES |
| 18 | POM121 | POM121 | POM121 | 6510 | 0.059 | 0.48 | YES |
| 19 | NUP35 | NUP35 | NUP35 | 7314 | 0.041 | 0.45 | NO |
| 20 | SLC25A6 | SLC25A6 | SLC25A6 | 7692 | 0.032 | 0.45 | NO |
| 21 | TPR | TPR | TPR | 8031 | 0.026 | 0.44 | NO |
| 22 | NUP188 | NUP188 | NUP188 | 8244 | 0.021 | 0.43 | NO |
| 23 | NUP210 | NUP210 | NUP210 | 8517 | 0.015 | 0.42 | NO |
| 24 | RAE1 | RAE1 | RAE1 | 8643 | 0.013 | 0.42 | NO |
| 25 | NUPL1 | NUPL1 | NUPL1 | 9189 | 0.00094 | 0.39 | NO |
| 26 | RANBP2 | RANBP2 | RANBP2 | 9318 | -0.0019 | 0.39 | NO |
| 27 | NUP43 | NUP43 | NUP43 | 9709 | -0.0097 | 0.37 | NO |
| 28 | NUP133 | NUP133 | NUP133 | 9947 | -0.015 | 0.36 | NO |
| 29 | NUP214 | NUP214 | NUP214 | 10113 | -0.018 | 0.36 | NO |
| 30 | KPNA1 | KPNA1 | KPNA1 | 10227 | -0.021 | 0.36 | NO |
| 31 | AAAS | AAAS | AAAS | 12962 | -0.09 | 0.25 | NO |
| 32 | SLC25A4 | SLC25A4 | SLC25A4 | 13588 | -0.11 | 0.26 | NO |
Figure S97. Get High-res Image This plot shows mRNAseq_cNMF expression data heatmap (on the left) a RunningEnrichmentScore(RES) plot (on the top right) and a Signal2Noise(S2N) plot (on the bottom right) of genes in the pathway: PID AURORA A PATHWAY.

Figure S98. Get High-res Image For the top 5 core enriched genes in the pathway: PID AURORA A PATHWAY, this volcano plot shows how much they are up/down-regulated and significant. The significance was calculated by empirical bayesian fit
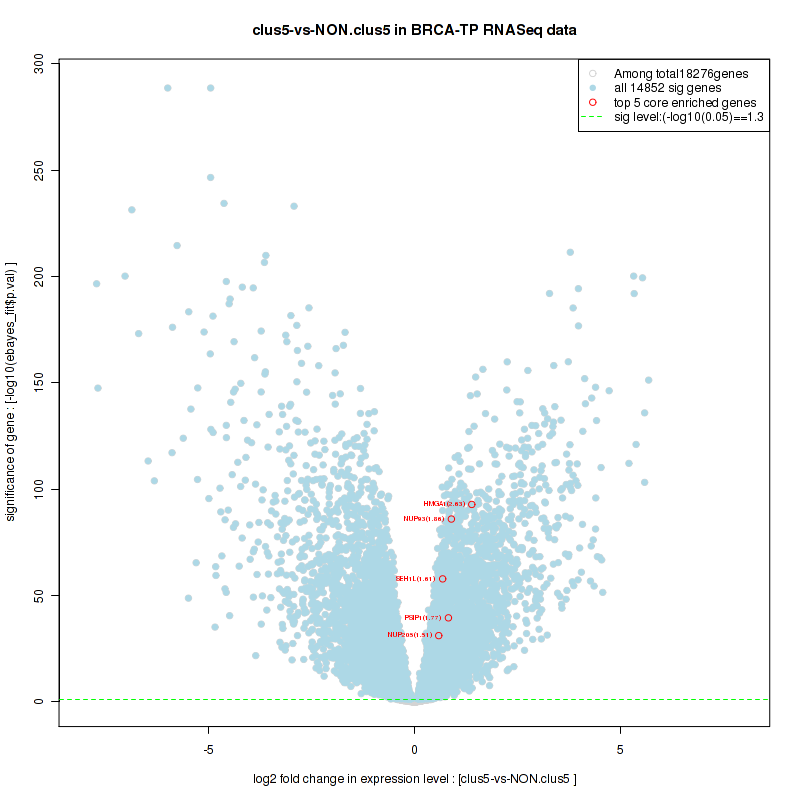
Table S50. Get Full Table This table shows a Running Enrichment Score (RES) of each gene in this pathway, that is, the enrichment score at this point in the ranked list of genes. All genes are ranked by Signal-to-Noise (S2N), a measure of similarity as default and are used to obtain ES matrix of all genes. In this way, GSEA tool uses expression pattern of not only overlapped genes but also not-overlapped genes to produce ES matrix.
| Rank | GENE | SYMBOL | DESC | LIST.LOC | S2N | RES | CORE_ENRICHMENT |
|---|---|---|---|---|---|---|---|
| 1 | CCNE1 | CCNE1 | CCNE1 | 37 | 0.9 | 0.043 | YES |
| 2 | MCM10 | MCM10 | MCM10 | 359 | 0.58 | 0.054 | YES |
| 3 | CDKN2A | CDKN2A | CDKN2A | 380 | 0.57 | 0.081 | YES |
| 4 | CDC25A | CDC25A | CDC25A | 397 | 0.56 | 0.11 | YES |
| 5 | CDC45 | CDC45 | CDC45 | 472 | 0.53 | 0.13 | YES |
| 6 | E2F2 | E2F2 | E2F2 | 568 | 0.5 | 0.15 | YES |
| 7 | MYBL2 | MYBL2 | MYBL2 | 577 | 0.49 | 0.17 | YES |
| 8 | CCNA1 | CCNA1 | CCNA1 | 593 | 0.48 | 0.2 | YES |
| 9 | CDK6 | CDK6 | CDK6 | 677 | 0.46 | 0.22 | YES |
| 10 | CDT1 | CDT1 | CDT1 | 683 | 0.46 | 0.24 | YES |
| 11 | SKP2 | SKP2 | SKP2 | 842 | 0.42 | 0.25 | YES |
| 12 | RPA4 | RPA4 | RPA4 | 931 | 0.4 | 0.26 | YES |
| 13 | CCNA2 | CCNA2 | CCNA2 | 955 | 0.4 | 0.28 | YES |
| 14 | CDC7 | CDC7 | CDC7 | 1159 | 0.36 | 0.29 | YES |
| 15 | TYMS | TYMS | TYMS | 1327 | 0.33 | 0.3 | YES |
| 16 | E2F1 | E2F1 | E2F1 | 1349 | 0.33 | 0.31 | YES |
| 17 | E2F3 | E2F3 | E2F3 | 1395 | 0.32 | 0.32 | YES |
| 18 | CKS1B | CKS1B | CKS1B | 1745 | 0.28 | 0.32 | YES |
| 19 | PKMYT1 | PKMYT1 | PKMYT1 | 1809 | 0.27 | 0.33 | YES |
| 20 | MYC | MYC | MYC | 1819 | 0.27 | 0.34 | YES |
| 21 | LIN9 | LIN9 | LIN9 | 1900 | 0.26 | 0.35 | YES |
| 22 | FBXO5 | FBXO5 | FBXO5 | 1964 | 0.26 | 0.36 | YES |
| 23 | E2F5 | E2F5 | E2F5 | 1976 | 0.26 | 0.37 | YES |
| 24 | PRIM2 | PRIM2 | PRIM2 | 1995 | 0.25 | 0.38 | YES |
| 25 | MCM2 | MCM2 | MCM2 | 2047 | 0.25 | 0.39 | YES |
| 26 | DBF4 | DBF4 | DBF4 | 2055 | 0.25 | 0.4 | YES |
| 27 | CDK1 | CDK1 | CDK1 | 2078 | 0.25 | 0.42 | YES |
| 28 | MCM5 | MCM5 | MCM5 | 2094 | 0.24 | 0.43 | YES |
| 29 | CDKN2C | CDKN2C | CDKN2C | 2097 | 0.24 | 0.44 | YES |
| 30 | RRM2 | RRM2 | RRM2 | 2110 | 0.24 | 0.45 | YES |
| 31 | RBL1 | RBL1 | RBL1 | 2153 | 0.24 | 0.46 | YES |
| 32 | MCM7 | MCM7 | MCM7 | 2167 | 0.24 | 0.47 | YES |
| 33 | CDC6 | CDC6 | CDC6 | 2221 | 0.23 | 0.48 | YES |
| 34 | MCM4 | MCM4 | MCM4 | 2488 | 0.21 | 0.48 | YES |
| 35 | PSMB9 | PSMB9 | PSMB9 | 2620 | 0.21 | 0.48 | YES |
| 36 | MCM6 | MCM6 | MCM6 | 2651 | 0.2 | 0.49 | YES |
| 37 | CCNB1 | CCNB1 | CCNB1 | 2670 | 0.2 | 0.5 | YES |
| 38 | CDKN2D | CDKN2D | CDKN2D | 2822 | 0.19 | 0.5 | YES |
| 39 | TFDP1 | TFDP1 | TFDP1 | 2858 | 0.19 | 0.5 | YES |
| 40 | CCNE2 | CCNE2 | CCNE2 | 3054 | 0.18 | 0.5 | YES |
| 41 | PSMB2 | PSMB2 | PSMB2 | 3242 | 0.17 | 0.5 | YES |
| 42 | MCM3 | MCM3 | MCM3 | 3320 | 0.16 | 0.5 | YES |
| 43 | PPP2R3B | PPP2R3B | PPP2R3B | 3606 | 0.15 | 0.5 | YES |
| 44 | LIN37 | LIN37 | LIN37 | 3609 | 0.15 | 0.5 | YES |
| 45 | PSMB4 | PSMB4 | PSMB4 | 3647 | 0.15 | 0.51 | YES |
| 46 | POLE2 | POLE2 | POLE2 | 3681 | 0.15 | 0.51 | YES |
| 47 | E2F4 | E2F4 | E2F4 | 3770 | 0.14 | 0.52 | YES |
| 48 | PSMD7 | PSMD7 | PSMD7 | 3791 | 0.14 | 0.52 | YES |
| 49 | POLA2 | POLA2 | POLA2 | 4163 | 0.13 | 0.51 | NO |
| 50 | MCM8 | MCM8 | MCM8 | 4238 | 0.12 | 0.51 | NO |
| 51 | RPS27A | RPS27A | RPS27A | 4273 | 0.12 | 0.52 | NO |
| 52 | PSMA7 | PSMA7 | PSMA7 | 4451 | 0.12 | 0.51 | NO |
| 53 | PCNA | PCNA | PCNA | 4535 | 0.11 | 0.51 | NO |
| 54 | CDK4 | CDK4 | CDK4 | 4899 | 0.1 | 0.5 | NO |
| 55 | PSMB8 | PSMB8 | PSMB8 | 5272 | 0.091 | 0.48 | NO |
| 56 | PSMD2 | PSMD2 | PSMD2 | 5278 | 0.091 | 0.48 | NO |
| 57 | RPA1 | RPA1 | RPA1 | 5409 | 0.086 | 0.48 | NO |
| 58 | CCND3 | CCND3 | CCND3 | 5426 | 0.086 | 0.49 | NO |
| 59 | PSMD14 | PSMD14 | PSMD14 | 5453 | 0.085 | 0.49 | NO |
| 60 | CUL1 | CUL1 | CUL1 | 5502 | 0.084 | 0.49 | NO |
| 61 | PSMC3 | PSMC3 | PSMC3 | 5532 | 0.083 | 0.49 | NO |
| 62 | PSMB10 | PSMB10 | PSMB10 | 5604 | 0.081 | 0.49 | NO |
| 63 | UBA52 | UBA52 | UBA52 | 5614 | 0.081 | 0.5 | NO |
| 64 | PSMC2 | PSMC2 | PSMC2 | 5622 | 0.081 | 0.5 | NO |
| 65 | PSMD4 | PSMD4 | PSMD4 | 5677 | 0.08 | 0.5 | NO |
| 66 | PSMA4 | PSMA4 | PSMA4 | 5737 | 0.078 | 0.5 | NO |
| 67 | CDK2 | CDK2 | CDK2 | 5808 | 0.076 | 0.5 | NO |
| 68 | PSMC4 | PSMC4 | PSMC4 | 5810 | 0.076 | 0.5 | NO |
| 69 | PSMD12 | PSMD12 | PSMD12 | 6165 | 0.068 | 0.49 | NO |
| 70 | PSMB6 | PSMB6 | PSMB6 | 6209 | 0.067 | 0.49 | NO |
| 71 | PSMA5 | PSMA5 | PSMA5 | 6227 | 0.066 | 0.49 | NO |
| 72 | CDKN2B | CDKN2B | CDKN2B | 6386 | 0.062 | 0.49 | NO |
| 73 | PSMB7 | PSMB7 | PSMB7 | 6434 | 0.061 | 0.49 | NO |
| 74 | PSMB1 | PSMB1 | PSMB1 | 6453 | 0.061 | 0.49 | NO |
| 75 | PSMC1 | PSMC1 | PSMC1 | 6456 | 0.061 | 0.49 | NO |
| 76 | PSMD8 | PSMD8 | PSMD8 | 6549 | 0.058 | 0.49 | NO |
| 77 | RPA2 | RPA2 | RPA2 | 6636 | 0.056 | 0.49 | NO |
| 78 | PPP2R1B | PPP2R1B | PPP2R1B | 6662 | 0.055 | 0.49 | NO |
| 79 | PSMB5 | PSMB5 | PSMB5 | 6699 | 0.055 | 0.49 | NO |
| 80 | PSMD13 | PSMD13 | PSMD13 | 6728 | 0.054 | 0.49 | NO |
| 81 | HDAC1 | HDAC1 | HDAC1 | 7007 | 0.047 | 0.48 | NO |
| 82 | PSMA2 | PSMA2 | PSMA2 | 7054 | 0.046 | 0.48 | NO |
| 83 | PSMD11 | PSMD11 | PSMD11 | 7122 | 0.045 | 0.48 | NO |
| 84 | POLE | POLE | POLE | 7292 | 0.042 | 0.47 | NO |
| 85 | PSMB3 | PSMB3 | PSMB3 | 7612 | 0.034 | 0.45 | NO |
| 86 | PSMA1 | PSMA1 | PSMA1 | 7614 | 0.034 | 0.46 | NO |
| 87 | PSMA3 | PSMA3 | PSMA3 | 7754 | 0.031 | 0.45 | NO |
| 88 | PSMD1 | PSMD1 | PSMD1 | 7948 | 0.027 | 0.44 | NO |
| 89 | PSMD10 | PSMD10 | PSMD10 | 8181 | 0.022 | 0.43 | NO |
| 90 | RBBP4 | RBBP4 | RBBP4 | 8392 | 0.018 | 0.42 | NO |
| 91 | POLA1 | POLA1 | POLA1 | 8466 | 0.016 | 0.41 | NO |
| 92 | DYRK1A | DYRK1A | DYRK1A | 8698 | 0.011 | 0.4 | NO |
| 93 | PSME2 | PSME2 | PSME2 | 9069 | 0.0032 | 0.38 | NO |
| 94 | PRIM1 | PRIM1 | PRIM1 | 9465 | -0.0048 | 0.36 | NO |
| 95 | PSMD9 | PSMD9 | PSMD9 | 9583 | -0.007 | 0.35 | NO |
| 96 | LIN54 | LIN54 | LIN54 | 9734 | -0.01 | 0.35 | NO |
| 97 | PPP2R2A | PPP2R2A | PPP2R2A | 9910 | -0.014 | 0.34 | NO |
| 98 | PSMD6 | PSMD6 | PSMD6 | 9965 | -0.015 | 0.34 | NO |
| 99 | PPP2R1A | PPP2R1A | PPP2R1A | 10082 | -0.018 | 0.33 | NO |
| 100 | PSMF1 | PSMF1 | PSMF1 | 10217 | -0.021 | 0.32 | NO |
| 101 | DHFR | DHFR | DHFR | 10369 | -0.024 | 0.32 | NO |
| 102 | PSMA6 | PSMA6 | PSMA6 | 10428 | -0.026 | 0.31 | NO |
| 103 | PPP2CB | PPP2CB | PPP2CB | 10590 | -0.029 | 0.31 | NO |
| 104 | WEE1 | WEE1 | WEE1 | 10857 | -0.036 | 0.29 | NO |
| 105 | CCND2 | CCND2 | CCND2 | 10905 | -0.037 | 0.29 | NO |
| 106 | RPA3 | RPA3 | RPA3 | 10961 | -0.038 | 0.29 | NO |
| 107 | PSMC5 | PSMC5 | PSMC5 | 11075 | -0.041 | 0.29 | NO |
| 108 | PSMD3 | PSMD3 | PSMD3 | 11163 | -0.043 | 0.28 | NO |
| 109 | PSMC6 | PSMC6 | PSMC6 | 11949 | -0.063 | 0.24 | NO |
| 110 | MAX | MAX | MAX | 12238 | -0.07 | 0.23 | NO |
| 111 | CDKN1B | CDKN1B | CDKN1B | 12250 | -0.071 | 0.24 | NO |
| 112 | PSMD5 | PSMD5 | PSMD5 | 12552 | -0.079 | 0.22 | NO |
| 113 | CDKN1A | CDKN1A | CDKN1A | 13116 | -0.095 | 0.2 | NO |
| 114 | CDK7 | CDK7 | CDK7 | 13409 | -0.1 | 0.18 | NO |
| 115 | PPP2CA | PPP2CA | PPP2CA | 13462 | -0.11 | 0.19 | NO |
| 116 | RBL2 | RBL2 | RBL2 | 13519 | -0.11 | 0.19 | NO |
| 117 | PSME1 | PSME1 | PSME1 | 14033 | -0.13 | 0.17 | NO |
| 118 | TK2 | TK2 | TK2 | 14256 | -0.14 | 0.16 | NO |
| 119 | MNAT1 | MNAT1 | MNAT1 | 14296 | -0.14 | 0.17 | NO |
| 120 | LIN52 | LIN52 | LIN52 | 14377 | -0.14 | 0.17 | NO |
| 121 | SKP1 | SKP1 | SKP1 | 14867 | -0.16 | 0.15 | NO |
| 122 | CCNH | CCNH | CCNH | 15454 | -0.2 | 0.13 | NO |
| 123 | RB1 | RB1 | RB1 | 15759 | -0.22 | 0.12 | NO |
| 124 | CCND1 | CCND1 | CCND1 | 16907 | -0.34 | 0.075 | NO |
Figure S99. Get High-res Image This plot shows mRNAseq_cNMF expression data heatmap (on the left) a RunningEnrichmentScore(RES) plot (on the top right) and a Signal2Noise(S2N) plot (on the bottom right) of genes in the pathway: PID RB 1PATHWAY.
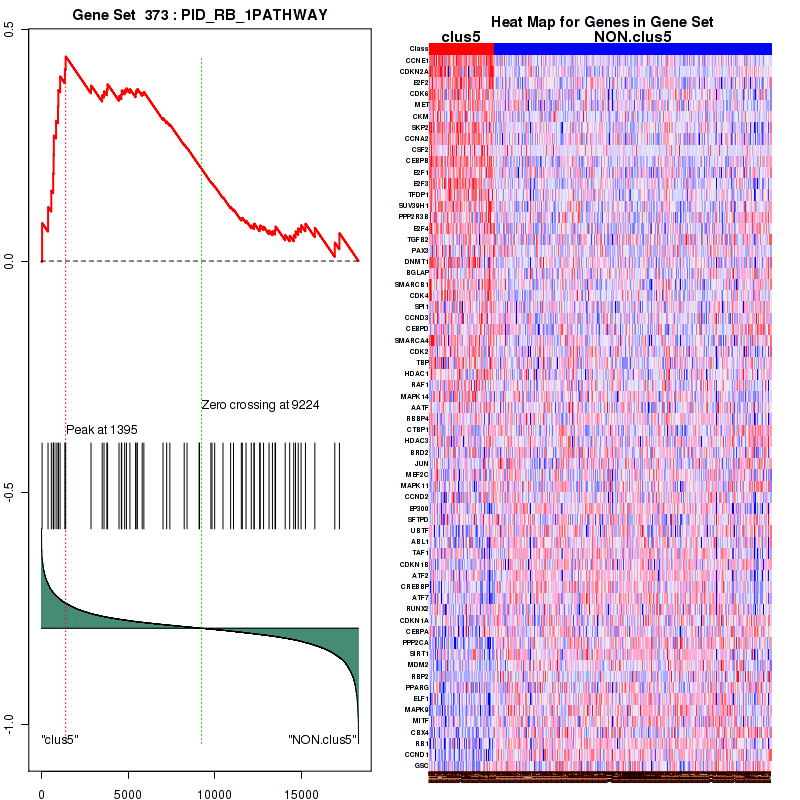
Figure S100. Get High-res Image For the top 5 core enriched genes in the pathway: PID RB 1PATHWAY, this volcano plot shows how much they are up/down-regulated and significant. The significance was calculated by empirical bayesian fit

For the top enriched genes, if you want to check whether they are
-
up-regulated, please check the list of up-regulated genes
-
down-regulated, please check the list of down-regulated genes
For the top enriched genes, if you want to check whether they are
-
highly expressed genes, please check the list of high (top 30%) expressed genes
-
low expressed genes, please check the list of low (bottom 30%) expressed genes
An expression pattern of top(30%)/middle(30%)/low(30%) in this subtype against other subtypes is available in a heatmap
For the top enriched genes, if you want to check whether they are
-
significantly differently expressed genes by eBayes lm fit, please check the list of significant genes
Table 8. Get Full Table This table shows top 10 pathways which are significantly enriched in cluster clus6. It displays only significant gene sets satisfying nom.p.val.threshold (-1), fwer.p.val.threshold (-1) , fdr.q.val.threshold (0.25) and the default table is sorted by Normalized Enrichment Score (NES). Further details on NES statistics, please visit The Broad GSEA website.
| GeneSet(GS) | Size(#genes) | genes.ES.table | ES | NES | NOM.p.val | FDR.q.val | FWER.p.val | Tag.. | Gene.. | Signal | FDR..median. | glob.p.val |
|---|---|---|---|---|---|---|---|---|---|---|---|---|
| KEGG GLYCOLYSIS GLUCONEOGENESIS | 59 | genes.ES.table | 0.5 | 1.7 | 0.0043 | 0.16 | 0.85 | 0.12 | 0.082 | 0.11 | 0.07 | 0.018 |
| KEGG CITRATE CYCLE TCA CYCLE | 29 | genes.ES.table | 0.49 | 1.8 | 0.046 | 0.16 | 0.62 | 0.034 | 0.00077 | 0.034 | 0.051 | 0.034 |
| KEGG FATTY ACID METABOLISM | 39 | genes.ES.table | 0.66 | 2 | 0 | 0.19 | 0.18 | 0.33 | 0.17 | 0.28 | 0 | 0.042 |
| KEGG ALANINE ASPARTATE AND GLUTAMATE METABOLISM | 31 | genes.ES.table | 0.44 | 1.3 | 0.09 | 0.23 | 1 | 0.36 | 0.24 | 0.27 | 0.18 | 0 |
| KEGG GLYCINE SERINE AND THREONINE METABOLISM | 31 | genes.ES.table | 0.59 | 1.6 | 0.012 | 0.15 | 0.93 | 0.36 | 0.1 | 0.32 | 0.078 | 0.005 |
| KEGG ARGININE AND PROLINE METABOLISM | 52 | genes.ES.table | 0.39 | 1.3 | 0.12 | 0.25 | 1 | 0.25 | 0.2 | 0.2 | 0.2 | 0 |
| KEGG TYROSINE METABOLISM | 40 | genes.ES.table | 0.7 | 1.9 | 0 | 0.18 | 0.49 | 0.25 | 0.044 | 0.24 | 0 | 0.04 |
| KEGG GLYCEROLIPID METABOLISM | 45 | genes.ES.table | 0.55 | 1.8 | 0.0021 | 0.16 | 0.7 | 0.42 | 0.24 | 0.32 | 0.056 | 0.031 |
| KEGG GLYCEROPHOSPHOLIPID METABOLISM | 71 | genes.ES.table | 0.49 | 1.8 | 0 | 0.16 | 0.61 | 0.38 | 0.27 | 0.28 | 0.052 | 0.031 |
| KEGG ETHER LIPID METABOLISM | 28 | genes.ES.table | 0.58 | 1.6 | 0.0042 | 0.15 | 0.89 | 0.54 | 0.3 | 0.38 | 0.073 | 0.011 |
Table S51. Get Full Table This table shows a Running Enrichment Score (RES) of each gene in this pathway, that is, the enrichment score at this point in the ranked list of genes. All genes are ranked by Signal-to-Noise (S2N), a measure of similarity as default and are used to obtain ES matrix of all genes. In this way, GSEA tool uses expression pattern of not only overlapped genes but also not-overlapped genes to produce ES matrix.
| Rank | GENE | SYMBOL | DESC | LIST.LOC | S2N | RES | CORE_ENRICHMENT |
|---|---|---|---|---|---|---|---|
| 1 | LEP | LEP | LEP | 12 | 1.2 | 0.085 | YES |
| 2 | PCK1 | PCK1 | PCK1 | 14 | 1.1 | 0.17 | YES |
| 3 | PLIN1 | PLIN1 | PLIN1 | 27 | 1 | 0.24 | YES |
| 4 | ADIPOQ | ADIPOQ | ADIPOQ | 40 | 0.94 | 0.31 | YES |
| 5 | FABP4 | FABP4 | FABP4 | 50 | 0.89 | 0.38 | YES |
| 6 | SLC2A4 | SLC2A4 | SLC2A4 | 62 | 0.87 | 0.44 | YES |
| 7 | CD36 | CD36 | CD36 | 101 | 0.75 | 0.5 | YES |
| 8 | LPL | LPL | LPL | 107 | 0.74 | 0.55 | YES |
| 9 | PPARG | PPARG | PPARG | 193 | 0.62 | 0.59 | YES |
| 10 | ANGPTL4 | ANGPTL4 | ANGPTL4 | 287 | 0.54 | 0.63 | YES |
| 11 | EBF1 | EBF1 | EBF1 | 353 | 0.5 | 0.66 | YES |
| 12 | WNT1 | WNT1 | WNT1 | 485 | 0.43 | 0.68 | YES |
| 13 | EGR2 | EGR2 | EGR2 | 766 | 0.36 | 0.7 | YES |
| 14 | WNT10B | WNT10B | WNT10B | 923 | 0.34 | 0.71 | YES |
| 15 | KLF4 | KLF4 | KLF4 | 1090 | 0.31 | 0.73 | YES |
| 16 | CEBPD | CEBPD | CEBPD | 1860 | 0.23 | 0.7 | NO |
| 17 | NR2F2 | NR2F2 | NR2F2 | 2411 | 0.19 | 0.68 | NO |
| 18 | PPARGC1A | PPARGC1A | PPARGC1A | 2822 | 0.17 | 0.68 | NO |
| 19 | TGFB1 | TGFB1 | TGFB1 | 3281 | 0.15 | 0.66 | NO |
| 20 | RXRA | RXRA | RXRA | 3791 | 0.13 | 0.64 | NO |
| 21 | SMARCD3 | SMARCD3 | SMARCD3 | 4854 | 0.092 | 0.59 | NO |
| 22 | MED16 | MED16 | MED16 | 5785 | 0.069 | 0.55 | NO |
| 23 | MED22 | MED22 | MED22 | 6490 | 0.053 | 0.51 | NO |
| 24 | MED15 | MED15 | MED15 | 6849 | 0.047 | 0.49 | NO |
| 25 | PPARA | PPARA | PPARA | 6932 | 0.045 | 0.49 | NO |
| 26 | PRIC285 | PRIC285 | PRIC285 | 7140 | 0.042 | 0.48 | NO |
| 27 | MED26 | MED26 | MED26 | 7653 | 0.033 | 0.46 | NO |
| 28 | NCOR2 | NCOR2 | NCOR2 | 8094 | 0.027 | 0.44 | NO |
| 29 | MED7 | MED7 | MED7 | 8349 | 0.023 | 0.42 | NO |
| 30 | CREBBP | CREBBP | CREBBP | 8571 | 0.02 | 0.41 | NO |
| 31 | MED11 | MED11 | MED11 | 8600 | 0.02 | 0.41 | NO |
| 32 | MED10 | MED10 | MED10 | 9093 | 0.013 | 0.39 | NO |
| 33 | CCND3 | CCND3 | CCND3 | 9162 | 0.012 | 0.38 | NO |
| 34 | MED25 | MED25 | MED25 | 9488 | 0.0084 | 0.37 | NO |
| 35 | HDAC3 | HDAC3 | HDAC3 | 9504 | 0.0082 | 0.37 | NO |
| 36 | NCOA1 | NCOA1 | NCOA1 | 9715 | 0.0056 | 0.36 | NO |
| 37 | MED4 | MED4 | MED4 | 9754 | 0.0051 | 0.36 | NO |
| 38 | TNF | TNF | TNF | 9769 | 0.0049 | 0.36 | NO |
| 39 | CEBPB | CEBPB | CEBPB | 10169 | -0.00022 | 0.33 | NO |
| 40 | MED9 | MED9 | MED9 | 10226 | -0.00084 | 0.33 | NO |
| 41 | MED13L | MED13L | MED13L | 10376 | -0.0026 | 0.32 | NO |
| 42 | MED23 | MED23 | MED23 | 10642 | -0.0055 | 0.31 | NO |
| 43 | MED12 | MED12 | MED12 | 10745 | -0.0068 | 0.3 | NO |
| 44 | MED29 | MED29 | MED29 | 11117 | -0.011 | 0.28 | NO |
| 45 | MED6 | MED6 | MED6 | 11391 | -0.014 | 0.27 | NO |
| 46 | MED8 | MED8 | MED8 | 11545 | -0.016 | 0.26 | NO |
| 47 | RELA | RELA | RELA | 11817 | -0.018 | 0.25 | NO |
| 48 | NCOR1 | NCOR1 | NCOR1 | 12502 | -0.026 | 0.21 | NO |
| 49 | MED19 | MED19 | MED19 | 12567 | -0.027 | 0.21 | NO |
| 50 | TBL1X | TBL1X | TBL1X | 12661 | -0.028 | 0.21 | NO |
| 51 | MED18 | MED18 | MED18 | 12665 | -0.028 | 0.21 | NO |
| 52 | NCOA3 | NCOA3 | NCOA3 | 12710 | -0.029 | 0.21 | NO |
| 53 | KLF5 | KLF5 | KLF5 | 13016 | -0.033 | 0.2 | NO |
| 54 | EP300 | EP300 | EP300 | 13136 | -0.034 | 0.19 | NO |
| 55 | MED27 | MED27 | MED27 | 13167 | -0.034 | 0.19 | NO |
| 56 | MED31 | MED31 | MED31 | 13264 | -0.036 | 0.19 | NO |
| 57 | TBL1XR1 | TBL1XR1 | TBL1XR1 | 13478 | -0.039 | 0.18 | NO |
| 58 | CDK19 | CDK19 | CDK19 | 13643 | -0.041 | 0.18 | NO |
| 59 | MED17 | MED17 | MED17 | 13718 | -0.042 | 0.17 | NO |
| 60 | MED21 | MED21 | MED21 | 13761 | -0.042 | 0.18 | NO |
| 61 | MED24 | MED24 | MED24 | 14286 | -0.051 | 0.15 | NO |
| 62 | CDK4 | CDK4 | CDK4 | 14491 | -0.054 | 0.14 | NO |
| 63 | CCNC | CCNC | CCNC | 14775 | -0.058 | 0.13 | NO |
| 64 | SREBF1 | SREBF1 | SREBF1 | 15069 | -0.064 | 0.12 | NO |
| 65 | NCOA6 | NCOA6 | NCOA6 | 15588 | -0.075 | 0.097 | NO |
| 66 | MED20 | MED20 | MED20 | 15731 | -0.078 | 0.095 | NO |
| 67 | MED14 | MED14 | MED14 | 15883 | -0.082 | 0.093 | NO |
| 68 | TGS1 | TGS1 | TGS1 | 16313 | -0.095 | 0.076 | NO |
| 69 | MED30 | MED30 | MED30 | 16321 | -0.095 | 0.083 | NO |
| 70 | NCOA2 | NCOA2 | NCOA2 | 16398 | -0.097 | 0.086 | NO |
| 71 | CDK8 | CDK8 | CDK8 | 16731 | -0.11 | 0.076 | NO |
| 72 | MED1 | MED1 | MED1 | 16770 | -0.12 | 0.083 | NO |
Figure S101. Get High-res Image This plot shows mRNAseq_cNMF expression data heatmap (on the left) a RunningEnrichmentScore(RES) plot (on the top right) and a Signal2Noise(S2N) plot (on the bottom right) of genes in the pathway: KEGG GLYCOLYSIS GLUCONEOGENESIS.

Figure S102. Get High-res Image For the top 5 core enriched genes in the pathway: KEGG GLYCOLYSIS GLUCONEOGENESIS, this volcano plot shows how much they are up/down-regulated and significant. The significance was calculated by empirical bayesian fit
Table S52. Get Full Table This table shows a Running Enrichment Score (RES) of each gene in this pathway, that is, the enrichment score at this point in the ranked list of genes. All genes are ranked by Signal-to-Noise (S2N), a measure of similarity as default and are used to obtain ES matrix of all genes. In this way, GSEA tool uses expression pattern of not only overlapped genes but also not-overlapped genes to produce ES matrix.
| Rank | GENE | SYMBOL | DESC | LIST.LOC | S2N | RES | CORE_ENRICHMENT |
|---|---|---|---|---|---|---|---|
| 1 | PCK1 | PCK1 | PCK1 | 14 | 1.1 | 0.069 | YES |
| 2 | LIPE | LIPE | LIPE | 57 | 0.88 | 0.12 | YES |
| 3 | SLC2A4 | SLC2A4 | SLC2A4 | 62 | 0.87 | 0.18 | YES |
| 4 | PYGM | PYGM | PYGM | 63 | 0.85 | 0.23 | YES |
| 5 | PDE3B | PDE3B | PDE3B | 165 | 0.64 | 0.26 | YES |
| 6 | PHKG1 | PHKG1 | PHKG1 | 186 | 0.62 | 0.3 | YES |
| 7 | GYS2 | GYS2 | GYS2 | 195 | 0.62 | 0.34 | YES |
| 8 | ACACB | ACACB | ACACB | 318 | 0.52 | 0.36 | YES |
| 9 | SOCS2 | SOCS2 | SOCS2 | 517 | 0.42 | 0.38 | YES |
| 10 | SORBS1 | SORBS1 | SORBS1 | 551 | 0.42 | 0.4 | YES |
| 11 | MAPK10 | MAPK10 | MAPK10 | 761 | 0.36 | 0.41 | YES |
| 12 | G6PC2 | G6PC2 | G6PC2 | 1025 | 0.32 | 0.42 | YES |
| 13 | SHC2 | SHC2 | SHC2 | 1102 | 0.31 | 0.43 | YES |
| 14 | PIK3R5 | PIK3R5 | PIK3R5 | 1417 | 0.27 | 0.43 | YES |
| 15 | SOCS3 | SOCS3 | SOCS3 | 1697 | 0.25 | 0.43 | YES |
| 16 | SOCS1 | SOCS1 | SOCS1 | 1795 | 0.24 | 0.44 | YES |
| 17 | INPP5D | INPP5D | INPP5D | 1880 | 0.23 | 0.45 | YES |
| 18 | IRS2 | IRS2 | IRS2 | 1967 | 0.22 | 0.46 | YES |
| 19 | PIK3CD | PIK3CD | PIK3CD | 2032 | 0.22 | 0.47 | YES |
| 20 | PRKAR2B | PRKAR2B | PRKAR2B | 2211 | 0.2 | 0.47 | YES |
| 21 | GCK | GCK | GCK | 2229 | 0.2 | 0.48 | YES |
| 22 | FOXO1 | FOXO1 | FOXO1 | 2452 | 0.19 | 0.48 | YES |
| 23 | PIK3CG | PIK3CG | PIK3CG | 2637 | 0.18 | 0.48 | YES |
| 24 | FBP1 | FBP1 | FBP1 | 2723 | 0.17 | 0.49 | YES |
| 25 | FBP2 | FBP2 | FBP2 | 2732 | 0.17 | 0.5 | YES |
| 26 | PPARGC1A | PPARGC1A | PPARGC1A | 2822 | 0.17 | 0.51 | YES |
| 27 | IRS1 | IRS1 | IRS1 | 3985 | 0.12 | 0.45 | NO |
| 28 | PDE3A | PDE3A | PDE3A | 4051 | 0.12 | 0.45 | NO |
| 29 | TRIP10 | TRIP10 | TRIP10 | 4083 | 0.12 | 0.46 | NO |
| 30 | HK3 | HK3 | HK3 | 4136 | 0.11 | 0.46 | NO |
| 31 | PRKAA2 | PRKAA2 | PRKAA2 | 4191 | 0.11 | 0.47 | NO |
| 32 | CALML6 | CALML6 | CALML6 | 4194 | 0.11 | 0.47 | NO |
| 33 | AKT3 | AKT3 | AKT3 | 4331 | 0.11 | 0.47 | NO |
| 34 | PPP1R3C | PPP1R3C | PPP1R3C | 4359 | 0.11 | 0.48 | NO |
| 35 | PRKAR1B | PRKAR1B | PRKAR1B | 4395 | 0.1 | 0.48 | NO |
| 36 | PYGL | PYGL | PYGL | 4502 | 0.1 | 0.48 | NO |
| 37 | CALML3 | CALML3 | CALML3 | 4640 | 0.098 | 0.48 | NO |
| 38 | MKNK2 | MKNK2 | MKNK2 | 4847 | 0.092 | 0.48 | NO |
| 39 | PIK3R1 | PIK3R1 | PIK3R1 | 4989 | 0.088 | 0.47 | NO |
| 40 | RHOQ | RHOQ | RHOQ | 5485 | 0.075 | 0.45 | NO |
| 41 | PPP1R3B | PPP1R3B | PPP1R3B | 5666 | 0.071 | 0.45 | NO |
| 42 | RAPGEF1 | RAPGEF1 | RAPGEF1 | 5680 | 0.071 | 0.45 | NO |
| 43 | IKBKB | IKBKB | IKBKB | 5872 | 0.066 | 0.44 | NO |
| 44 | MKNK1 | MKNK1 | MKNK1 | 6060 | 0.063 | 0.44 | NO |
| 45 | CBLC | CBLC | CBLC | 6205 | 0.059 | 0.43 | NO |
| 46 | PKLR | PKLR | PKLR | 6250 | 0.058 | 0.43 | NO |
| 47 | PRKAA1 | PRKAA1 | PRKAA1 | 6448 | 0.054 | 0.43 | NO |
| 48 | BAD | BAD | BAD | 6535 | 0.052 | 0.42 | NO |
| 49 | TSC1 | TSC1 | TSC1 | 6636 | 0.051 | 0.42 | NO |
| 50 | PRKACB | PRKACB | PRKACB | 6648 | 0.05 | 0.42 | NO |
| 51 | INPP5K | INPP5K | INPP5K | 6680 | 0.05 | 0.43 | NO |
| 52 | AKT2 | AKT2 | AKT2 | 7031 | 0.043 | 0.41 | NO |
| 53 | ARAF | ARAF | ARAF | 7387 | 0.037 | 0.39 | NO |
| 54 | TSC2 | TSC2 | TSC2 | 7401 | 0.037 | 0.39 | NO |
| 55 | PRKAG2 | PRKAG2 | PRKAG2 | 7508 | 0.035 | 0.39 | NO |
| 56 | MAPK3 | MAPK3 | MAPK3 | 7546 | 0.035 | 0.39 | NO |
| 57 | PRKAB1 | PRKAB1 | PRKAB1 | 7602 | 0.034 | 0.39 | NO |
| 58 | FLOT1 | FLOT1 | FLOT1 | 7608 | 0.034 | 0.39 | NO |
| 59 | MAP2K2 | MAP2K2 | MAP2K2 | 7776 | 0.031 | 0.38 | NO |
| 60 | RPS6 | RPS6 | RPS6 | 7886 | 0.029 | 0.38 | NO |
| 61 | SHC3 | SHC3 | SHC3 | 7939 | 0.029 | 0.38 | NO |
| 62 | PHKA2 | PHKA2 | PHKA2 | 8142 | 0.026 | 0.37 | NO |
| 63 | INSR | INSR | INSR | 8473 | 0.022 | 0.35 | NO |
| 64 | AKT1 | AKT1 | AKT1 | 8539 | 0.021 | 0.35 | NO |
| 65 | CALM3 | CALM3 | CALM3 | 8542 | 0.021 | 0.35 | NO |
| 66 | PHKG2 | PHKG2 | PHKG2 | 8558 | 0.02 | 0.35 | NO |
| 67 | SHC1 | SHC1 | SHC1 | 8717 | 0.018 | 0.34 | NO |
| 68 | CBLB | CBLB | CBLB | 9356 | 0.01 | 0.31 | NO |
| 69 | PDPK1 | PDPK1 | PDPK1 | 9426 | 0.0092 | 0.31 | NO |
| 70 | CBL | CBL | CBL | 9623 | 0.0068 | 0.3 | NO |
| 71 | EXOC7 | EXOC7 | EXOC7 | 9654 | 0.0065 | 0.3 | NO |
| 72 | RPS6KB2 | RPS6KB2 | RPS6KB2 | 9870 | 0.0034 | 0.28 | NO |
| 73 | PIK3R2 | PIK3R2 | PIK3R2 | 9981 | 0.0021 | 0.28 | NO |
| 74 | HK1 | HK1 | HK1 | 10297 | -0.0017 | 0.26 | NO |
| 75 | SOS2 | SOS2 | SOS2 | 10362 | -0.0025 | 0.26 | NO |
| 76 | CALM1 | CALM1 | CALM1 | 10674 | -0.0059 | 0.24 | NO |
| 77 | PIK3R3 | PIK3R3 | PIK3R3 | 10725 | -0.0066 | 0.24 | NO |
| 78 | HK2 | HK2 | HK2 | 10727 | -0.0066 | 0.24 | NO |
| 79 | MAP2K1 | MAP2K1 | MAP2K1 | 10791 | -0.0072 | 0.24 | NO |
| 80 | PRKACA | PRKACA | PRKACA | 10883 | -0.0081 | 0.23 | NO |
| 81 | FLOT2 | FLOT2 | FLOT2 | 10941 | -0.0087 | 0.23 | NO |
| 82 | PCK2 | PCK2 | PCK2 | 11001 | -0.0094 | 0.22 | NO |
| 83 | EIF4E2 | EIF4E2 | EIF4E2 | 11085 | -0.01 | 0.22 | NO |
| 84 | KRAS | KRAS | KRAS | 11114 | -0.011 | 0.22 | NO |
| 85 | GYS1 | GYS1 | GYS1 | 11268 | -0.012 | 0.21 | NO |
| 86 | CALML5 | CALML5 | CALML5 | 11417 | -0.014 | 0.2 | NO |
| 87 | PRKAR1A | PRKAR1A | PRKAR1A | 11430 | -0.014 | 0.2 | NO |
| 88 | PRKAB2 | PRKAB2 | PRKAB2 | 11522 | -0.015 | 0.2 | NO |
| 89 | HRAS | HRAS | HRAS | 11537 | -0.015 | 0.2 | NO |
| 90 | RPTOR | RPTOR | RPTOR | 11666 | -0.017 | 0.2 | NO |
| 91 | GRB2 | GRB2 | GRB2 | 11676 | -0.017 | 0.2 | NO |
| 92 | PPP1CA | PPP1CA | PPP1CA | 11883 | -0.019 | 0.19 | NO |
| 93 | EIF4E1B | EIF4E1B | EIF4E1B | 12035 | -0.021 | 0.18 | NO |
| 94 | SOCS4 | SOCS4 | SOCS4 | 12134 | -0.022 | 0.18 | NO |
| 95 | PRKAG1 | PRKAG1 | PRKAG1 | 12152 | -0.022 | 0.18 | NO |
| 96 | SOS1 | SOS1 | SOS1 | 12156 | -0.022 | 0.18 | NO |
| 97 | RAF1 | RAF1 | RAF1 | 12185 | -0.023 | 0.18 | NO |
| 98 | CRKL | CRKL | CRKL | 12528 | -0.026 | 0.16 | NO |
| 99 | PRKX | PRKX | PRKX | 12563 | -0.027 | 0.16 | NO |
| 100 | IRS4 | IRS4 | IRS4 | 12760 | -0.03 | 0.15 | NO |
| 101 | FASN | FASN | FASN | 12947 | -0.032 | 0.14 | NO |
| 102 | CRK | CRK | CRK | 13026 | -0.033 | 0.14 | NO |
| 103 | PPP1CC | PPP1CC | PPP1CC | 13041 | -0.033 | 0.14 | NO |
| 104 | NRAS | NRAS | NRAS | 13068 | -0.033 | 0.14 | NO |
| 105 | PHKB | PHKB | PHKB | 13168 | -0.034 | 0.14 | NO |
| 106 | PYGB | PYGB | PYGB | 13196 | -0.035 | 0.14 | NO |
| 107 | MAPK1 | MAPK1 | MAPK1 | 13399 | -0.038 | 0.13 | NO |
| 108 | MAPK9 | MAPK9 | MAPK9 | 13436 | -0.038 | 0.13 | NO |
| 109 | ELK1 | ELK1 | ELK1 | 13556 | -0.04 | 0.13 | NO |
| 110 | PTPRF | PTPRF | PTPRF | 13585 | -0.04 | 0.13 | NO |
| 111 | SH2B2 | SH2B2 | SH2B2 | 13649 | -0.041 | 0.13 | NO |
| 112 | CALM2 | CALM2 | CALM2 | 13769 | -0.043 | 0.12 | NO |
| 113 | PTPN1 | PTPN1 | PTPN1 | 13781 | -0.043 | 0.12 | NO |
| 114 | RPS6KB1 | RPS6KB1 | RPS6KB1 | 13782 | -0.043 | 0.13 | NO |
| 115 | PRKCZ | PRKCZ | PRKCZ | 14029 | -0.047 | 0.12 | NO |
| 116 | EIF4E | EIF4E | EIF4E | 14084 | -0.047 | 0.12 | NO |
| 117 | PIK3CA | PIK3CA | PIK3CA | 14366 | -0.052 | 0.1 | NO |
| 118 | RHEB | RHEB | RHEB | 14651 | -0.056 | 0.092 | NO |
| 119 | PIK3CB | PIK3CB | PIK3CB | 15058 | -0.063 | 0.073 | NO |
| 120 | MTOR | MTOR | MTOR | 15061 | -0.063 | 0.077 | NO |
| 121 | SREBF1 | SREBF1 | SREBF1 | 15069 | -0.064 | 0.08 | NO |
| 122 | PPP1CB | PPP1CB | PPP1CB | 15265 | -0.068 | 0.074 | NO |
| 123 | PPP1R3D | PPP1R3D | PPP1R3D | 15558 | -0.074 | 0.062 | NO |
| 124 | PRKAR2A | PRKAR2A | PRKAR2A | 15878 | -0.082 | 0.05 | NO |
| 125 | EIF4EBP1 | EIF4EBP1 | EIF4EBP1 | 15902 | -0.083 | 0.054 | NO |
| 126 | GSK3B | GSK3B | GSK3B | 15904 | -0.083 | 0.059 | NO |
| 127 | PRKCI | PRKCI | PRKCI | 16325 | -0.095 | 0.042 | NO |
| 128 | ACACA | ACACA | ACACA | 16363 | -0.096 | 0.045 | NO |
| 129 | MAPK8 | MAPK8 | MAPK8 | 16664 | -0.11 | 0.036 | NO |
| 130 | BRAF | BRAF | BRAF | 16924 | -0.12 | 0.029 | NO |
| 131 | PHKA1 | PHKA1 | PHKA1 | 17192 | -0.14 | 0.023 | NO |
| 132 | PRKAG3 | PRKAG3 | PRKAG3 | 18091 | -0.28 | -0.0095 | NO |
| 133 | SHC4 | SHC4 | SHC4 | 18188 | -0.32 | 0.0048 | NO |
Figure S103. Get High-res Image This plot shows mRNAseq_cNMF expression data heatmap (on the left) a RunningEnrichmentScore(RES) plot (on the top right) and a Signal2Noise(S2N) plot (on the bottom right) of genes in the pathway: KEGG CITRATE CYCLE TCA CYCLE.
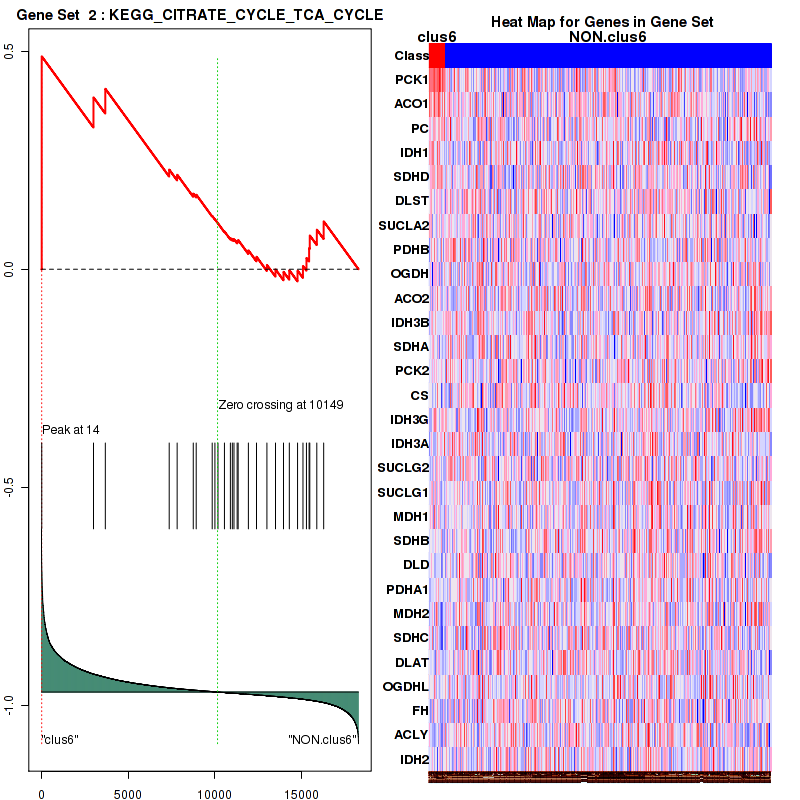
Figure S104. Get High-res Image For the top 5 core enriched genes in the pathway: KEGG CITRATE CYCLE TCA CYCLE, this volcano plot shows how much they are up/down-regulated and significant. The significance was calculated by empirical bayesian fit
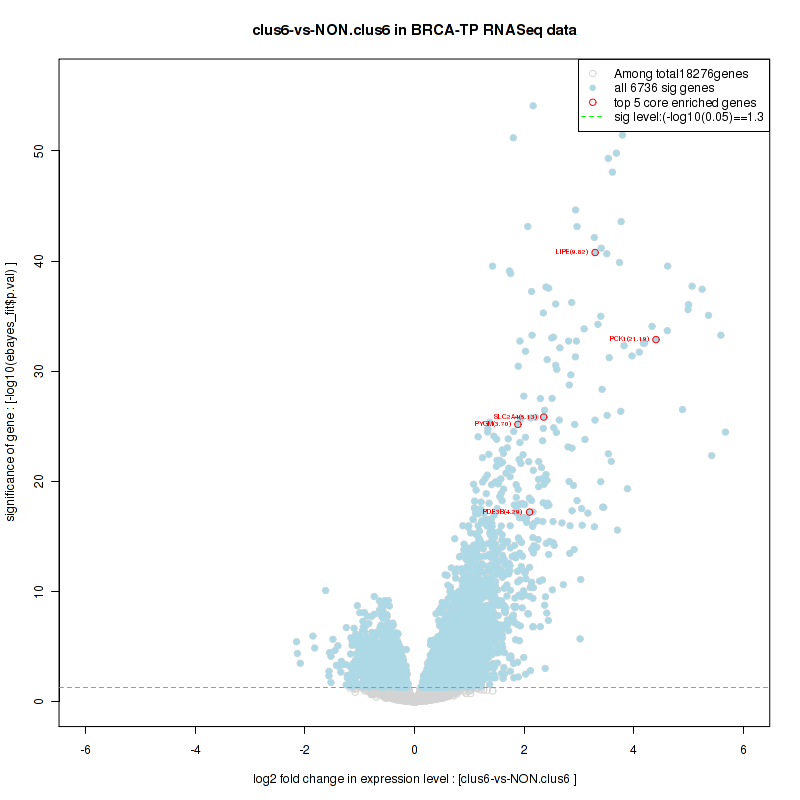
Table S53. Get Full Table This table shows a Running Enrichment Score (RES) of each gene in this pathway, that is, the enrichment score at this point in the ranked list of genes. All genes are ranked by Signal-to-Noise (S2N), a measure of similarity as default and are used to obtain ES matrix of all genes. In this way, GSEA tool uses expression pattern of not only overlapped genes but also not-overlapped genes to produce ES matrix.
| Rank | GENE | SYMBOL | DESC | LIST.LOC | S2N | RES | CORE_ENRICHMENT |
|---|---|---|---|---|---|---|---|
| 1 | PCK1 | PCK1 | PCK1 | 14 | 1.1 | 0.14 | YES |
| 2 | PYGM | PYGM | PYGM | 63 | 0.85 | 0.24 | YES |
| 3 | PFKFB1 | PFKFB1 | PFKFB1 | 86 | 0.78 | 0.34 | YES |
| 4 | PHKG1 | PHKG1 | PHKG1 | 186 | 0.62 | 0.41 | YES |
| 5 | GYS2 | GYS2 | GYS2 | 195 | 0.62 | 0.49 | YES |
| 6 | GYG2 | GYG2 | GYG2 | 259 | 0.56 | 0.55 | YES |
| 7 | PFKFB3 | PFKFB3 | PFKFB3 | 2660 | 0.18 | 0.44 | NO |
| 8 | FBP1 | FBP1 | FBP1 | 2723 | 0.17 | 0.46 | NO |
| 9 | FBP2 | FBP2 | FBP2 | 2732 | 0.17 | 0.48 | NO |
| 10 | PC | PC | PC | 3680 | 0.13 | 0.45 | NO |
| 11 | ENO3 | ENO3 | ENO3 | 4411 | 0.1 | 0.42 | NO |
| 12 | PGAM2 | PGAM2 | PGAM2 | 4447 | 0.1 | 0.43 | NO |
| 13 | PYGL | PYGL | PYGL | 4502 | 0.1 | 0.44 | NO |
| 14 | ALDOB | ALDOB | ALDOB | 4521 | 0.1 | 0.45 | NO |
| 15 | ALDOC | ALDOC | ALDOC | 5127 | 0.084 | 0.43 | NO |
| 16 | PPP2R1B | PPP2R1B | PPP2R1B | 5928 | 0.065 | 0.4 | NO |
| 17 | GBE1 | GBE1 | GBE1 | 6228 | 0.059 | 0.39 | NO |
| 18 | PKLR | PKLR | PKLR | 6250 | 0.058 | 0.39 | NO |
| 19 | PRKACB | PRKACB | PRKACB | 6648 | 0.05 | 0.38 | NO |
| 20 | GAPDHS | GAPDHS | GAPDHS | 6867 | 0.046 | 0.37 | NO |
| 21 | PHKA2 | PHKA2 | PHKA2 | 8142 | 0.026 | 0.3 | NO |
| 22 | CALM3 | CALM3 | CALM3 | 8542 | 0.021 | 0.28 | NO |
| 23 | PHKG2 | PHKG2 | PHKG2 | 8558 | 0.02 | 0.29 | NO |
| 24 | SLC25A12 | SLC25A12 | SLC25A12 | 8708 | 0.018 | 0.28 | NO |
| 25 | PPP2CB | PPP2CB | PPP2CB | 8995 | 0.014 | 0.27 | NO |
| 26 | PGM1 | PGM1 | PGM1 | 9550 | 0.0077 | 0.24 | NO |
| 27 | SLC25A1 | SLC25A1 | SLC25A1 | 9615 | 0.0069 | 0.23 | NO |
| 28 | PFKM | PFKM | PFKM | 9624 | 0.0068 | 0.23 | NO |
| 29 | UGP2 | UGP2 | UGP2 | 9676 | 0.0061 | 0.23 | NO |
| 30 | PFKL | PFKL | PFKL | 9836 | 0.0039 | 0.22 | NO |
| 31 | PPP2R1A | PPP2R1A | PPP2R1A | 10629 | -0.0053 | 0.18 | NO |
| 32 | CALM1 | CALM1 | CALM1 | 10674 | -0.0059 | 0.18 | NO |
| 33 | PRKACA | PRKACA | PRKACA | 10883 | -0.0081 | 0.17 | NO |
| 34 | PCK2 | PCK2 | PCK2 | 11001 | -0.0094 | 0.16 | NO |
| 35 | GYS1 | GYS1 | GYS1 | 11268 | -0.012 | 0.15 | NO |
| 36 | AGL | AGL | AGL | 11546 | -0.016 | 0.14 | NO |
| 37 | PPP2CA | PPP2CA | PPP2CA | 12131 | -0.022 | 0.11 | NO |
| 38 | SLC25A11 | SLC25A11 | SLC25A11 | 12366 | -0.025 | 0.098 | NO |
| 39 | MDH1 | MDH1 | MDH1 | 12994 | -0.032 | 0.068 | NO |
| 40 | PHKB | PHKB | PHKB | 13168 | -0.034 | 0.063 | NO |
| 41 | PYGB | PYGB | PYGB | 13196 | -0.035 | 0.066 | NO |
| 42 | CALM2 | CALM2 | CALM2 | 13769 | -0.043 | 0.04 | NO |
| 43 | ALDOA | ALDOA | ALDOA | 13928 | -0.045 | 0.036 | NO |
| 44 | PKM2 | PKM2 | PKM2 | 14047 | -0.047 | 0.036 | NO |
| 45 | GYG1 | GYG1 | GYG1 | 14151 | -0.048 | 0.036 | NO |
| 46 | PGM2 | PGM2 | PGM2 | 14251 | -0.05 | 0.037 | NO |
| 47 | GOT1 | GOT1 | GOT1 | 14280 | -0.05 | 0.042 | NO |
| 48 | PGAM1 | PGAM1 | PGAM1 | 14480 | -0.054 | 0.038 | NO |
| 49 | GPI | GPI | GPI | 14486 | -0.054 | 0.044 | NO |
| 50 | MDH2 | MDH2 | MDH2 | 14762 | -0.058 | 0.036 | NO |
| 51 | PPP2R5D | PPP2R5D | PPP2R5D | 15110 | -0.064 | 0.025 | NO |
| 52 | ENO2 | ENO2 | ENO2 | 15198 | -0.066 | 0.028 | NO |
| 53 | SLC25A10 | SLC25A10 | SLC25A10 | 15303 | -0.068 | 0.031 | NO |
| 54 | PGK1 | PGK1 | PGK1 | 15631 | -0.076 | 0.023 | NO |
| 55 | TPI1 | TPI1 | TPI1 | 15737 | -0.079 | 0.027 | NO |
| 56 | GAPDH | GAPDH | GAPDH | 16063 | -0.087 | 0.02 | NO |
| 57 | GOT2 | GOT2 | GOT2 | 16067 | -0.087 | 0.031 | NO |
| 58 | ENO1 | ENO1 | ENO1 | 16173 | -0.09 | 0.036 | NO |
| 59 | PFKP | PFKP | PFKP | 16464 | -0.1 | 0.033 | NO |
| 60 | PFKFB4 | PFKFB4 | PFKFB4 | 16909 | -0.12 | 0.023 | NO |
| 61 | SLC25A13 | SLC25A13 | SLC25A13 | 17083 | -0.13 | 0.03 | NO |
| 62 | PHKA1 | PHKA1 | PHKA1 | 17192 | -0.14 | 0.042 | NO |
| 63 | PFKFB2 | PFKFB2 | PFKFB2 | 17193 | -0.14 | 0.06 | NO |
Figure S105. Get High-res Image This plot shows mRNAseq_cNMF expression data heatmap (on the left) a RunningEnrichmentScore(RES) plot (on the top right) and a Signal2Noise(S2N) plot (on the bottom right) of genes in the pathway: KEGG FATTY ACID METABOLISM.

Figure S106. Get High-res Image For the top 5 core enriched genes in the pathway: KEGG FATTY ACID METABOLISM, this volcano plot shows how much they are up/down-regulated and significant. The significance was calculated by empirical bayesian fit

Table S54. Get Full Table This table shows a Running Enrichment Score (RES) of each gene in this pathway, that is, the enrichment score at this point in the ranked list of genes. All genes are ranked by Signal-to-Noise (S2N), a measure of similarity as default and are used to obtain ES matrix of all genes. In this way, GSEA tool uses expression pattern of not only overlapped genes but also not-overlapped genes to produce ES matrix.
| Rank | GENE | SYMBOL | DESC | LIST.LOC | S2N | RES | CORE_ENRICHMENT |
|---|---|---|---|---|---|---|---|
| 1 | ADH1A | ADH1A | ADH1A | 13 | 1.1 | 0.16 | YES |
| 2 | ADH1B | ADH1B | ADH1B | 49 | 0.89 | 0.29 | YES |
| 3 | ADH1C | ADH1C | ADH1C | 66 | 0.85 | 0.41 | YES |
| 4 | ACADL | ACADL | ACADL | 80 | 0.79 | 0.52 | YES |
| 5 | ADH4 | ADH4 | ADH4 | 732 | 0.37 | 0.54 | YES |
| 6 | CYP4A22 | CYP4A22 | CYP4A22 | 1481 | 0.26 | 0.54 | YES |
| 7 | ACADS | ACADS | ACADS | 1483 | 0.26 | 0.58 | YES |
| 8 | ALDH2 | ALDH2 | ALDH2 | 1499 | 0.26 | 0.61 | YES |
| 9 | ACSL1 | ACSL1 | ACSL1 | 2394 | 0.19 | 0.59 | YES |
| 10 | CYP4A11 | CYP4A11 | CYP4A11 | 2427 | 0.19 | 0.62 | YES |
| 11 | CPT1C | CPT1C | CPT1C | 2656 | 0.18 | 0.63 | YES |
| 12 | CPT1B | CPT1B | CPT1B | 2667 | 0.18 | 0.66 | YES |
| 13 | ACSL5 | ACSL5 | ACSL5 | 3029 | 0.16 | 0.66 | YES |
| 14 | CPT1A | CPT1A | CPT1A | 4066 | 0.12 | 0.62 | NO |
| 15 | ACSL4 | ACSL4 | ACSL4 | 4399 | 0.1 | 0.62 | NO |
| 16 | ACADVL | ACADVL | ACADVL | 5332 | 0.079 | 0.58 | NO |
| 17 | ACADSB | ACADSB | ACADSB | 5503 | 0.075 | 0.58 | NO |
| 18 | ADH6 | ADH6 | ADH6 | 5616 | 0.072 | 0.58 | NO |
| 19 | ACAA2 | ACAA2 | ACAA2 | 6179 | 0.06 | 0.56 | NO |
| 20 | ACAA1 | ACAA1 | ACAA1 | 6181 | 0.06 | 0.57 | NO |
| 21 | EHHADH | EHHADH | EHHADH | 6454 | 0.054 | 0.56 | NO |
| 22 | HADH | HADH | HADH | 7427 | 0.036 | 0.51 | NO |
| 23 | ALDH3A2 | ALDH3A2 | ALDH3A2 | 7442 | 0.036 | 0.52 | NO |
| 24 | GCDH | GCDH | GCDH | 7464 | 0.036 | 0.52 | NO |
| 25 | ACADM | ACADM | ACADM | 7741 | 0.032 | 0.51 | NO |
| 26 | ECHS1 | ECHS1 | ECHS1 | 8110 | 0.026 | 0.5 | NO |
| 27 | ADH5 | ADH5 | ADH5 | 8493 | 0.021 | 0.48 | NO |
| 28 | HADHB | HADHB | HADHB | 9533 | 0.0079 | 0.42 | NO |
| 29 | HADHA | HADHA | HADHA | 9593 | 0.0072 | 0.42 | NO |
| 30 | ACOX1 | ACOX1 | ACOX1 | 9955 | 0.0023 | 0.4 | NO |
| 31 | ACOX3 | ACOX3 | ACOX3 | 10676 | -0.0059 | 0.36 | NO |
| 32 | ALDH9A1 | ALDH9A1 | ALDH9A1 | 11301 | -0.013 | 0.33 | NO |
| 33 | ACSL6 | ACSL6 | ACSL6 | 12059 | -0.021 | 0.29 | NO |
| 34 | ACSL3 | ACSL3 | ACSL3 | 12345 | -0.024 | 0.28 | NO |
| 35 | CPT2 | CPT2 | CPT2 | 12585 | -0.027 | 0.27 | NO |
| 36 | ACAT1 | ACAT1 | ACAT1 | 12671 | -0.028 | 0.27 | NO |
| 37 | ALDH1B1 | ALDH1B1 | ALDH1B1 | 14444 | -0.053 | 0.18 | NO |
| 38 | ALDH7A1 | ALDH7A1 | ALDH7A1 | 15812 | -0.08 | 0.12 | NO |
| 39 | ACAT2 | ACAT2 | ACAT2 | 17142 | -0.14 | 0.062 | NO |
Figure S107. Get High-res Image This plot shows mRNAseq_cNMF expression data heatmap (on the left) a RunningEnrichmentScore(RES) plot (on the top right) and a Signal2Noise(S2N) plot (on the bottom right) of genes in the pathway: KEGG ALANINE ASPARTATE AND GLUTAMATE METABOLISM.
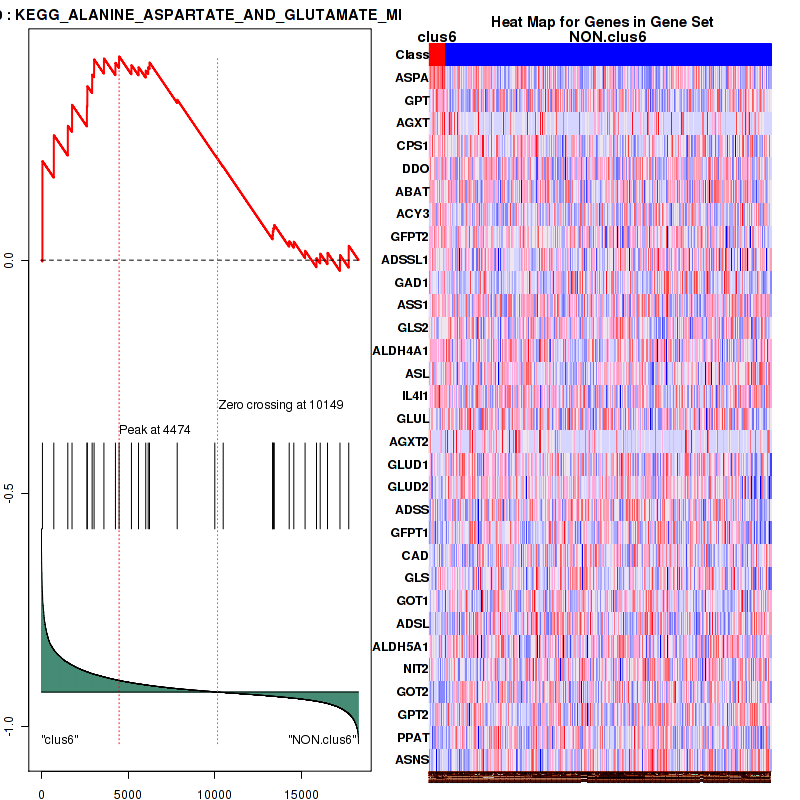
Figure S108. Get High-res Image For the top 5 core enriched genes in the pathway: KEGG ALANINE ASPARTATE AND GLUTAMATE METABOLISM, this volcano plot shows how much they are up/down-regulated and significant. The significance was calculated by empirical bayesian fit
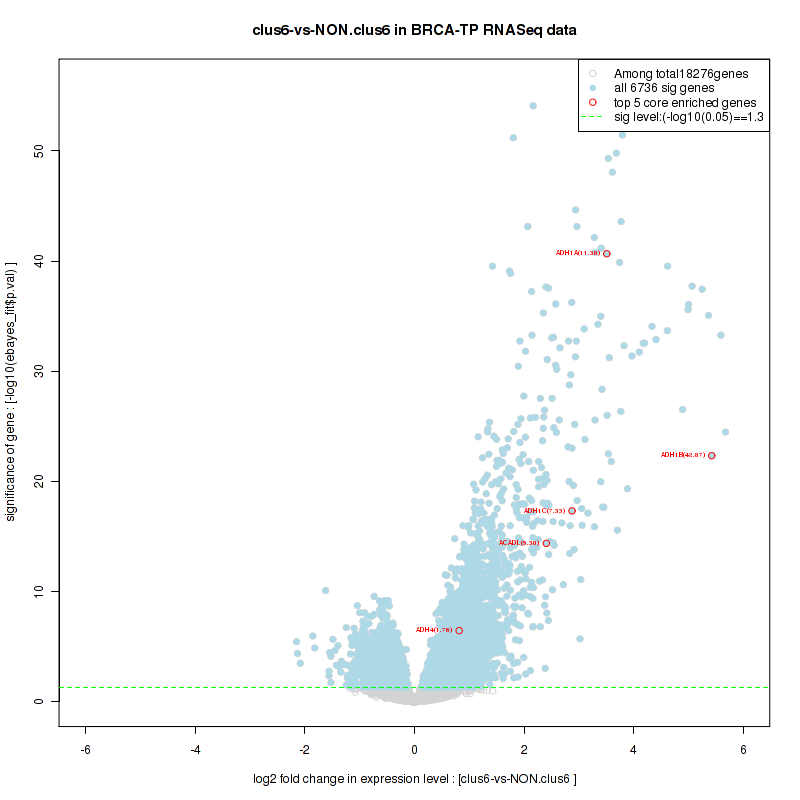
Table S55. Get Full Table This table shows a Running Enrichment Score (RES) of each gene in this pathway, that is, the enrichment score at this point in the ranked list of genes. All genes are ranked by Signal-to-Noise (S2N), a measure of similarity as default and are used to obtain ES matrix of all genes. In this way, GSEA tool uses expression pattern of not only overlapped genes but also not-overlapped genes to produce ES matrix.
| Rank | GENE | SYMBOL | DESC | LIST.LOC | S2N | RES | CORE_ENRICHMENT |
|---|---|---|---|---|---|---|---|
| 1 | LEP | LEP | LEP | 12 | 1.2 | 0.096 | YES |
| 2 | PCK1 | PCK1 | PCK1 | 14 | 1.1 | 0.19 | YES |
| 3 | ADIPOQ | ADIPOQ | ADIPOQ | 40 | 0.94 | 0.27 | YES |
| 4 | SLC2A4 | SLC2A4 | SLC2A4 | 62 | 0.87 | 0.34 | YES |
| 5 | CD36 | CD36 | CD36 | 101 | 0.75 | 0.4 | YES |
| 6 | RXRG | RXRG | RXRG | 285 | 0.54 | 0.44 | YES |
| 7 | ACACB | ACACB | ACACB | 318 | 0.52 | 0.48 | YES |
| 8 | LEPR | LEPR | LEPR | 522 | 0.42 | 0.51 | YES |
| 9 | MAPK10 | MAPK10 | MAPK10 | 761 | 0.36 | 0.52 | YES |
| 10 | G6PC2 | G6PC2 | G6PC2 | 1025 | 0.32 | 0.54 | YES |
| 11 | POMC | POMC | POMC | 1443 | 0.27 | 0.54 | YES |
| 12 | PRKCQ | PRKCQ | PRKCQ | 1478 | 0.26 | 0.56 | YES |
| 13 | TNFRSF1B | TNFRSF1B | TNFRSF1B | 1532 | 0.26 | 0.58 | YES |
| 14 | SOCS3 | SOCS3 | SOCS3 | 1697 | 0.25 | 0.59 | YES |
| 15 | IRS2 | IRS2 | IRS2 | 1967 | 0.22 | 0.59 | YES |
| 16 | ACSL1 | ACSL1 | ACSL1 | 2394 | 0.19 | 0.58 | YES |
| 17 | CPT1C | CPT1C | CPT1C | 2656 | 0.18 | 0.59 | YES |
| 18 | CPT1B | CPT1B | CPT1B | 2667 | 0.18 | 0.6 | YES |
| 19 | PPARGC1A | PPARGC1A | PPARGC1A | 2822 | 0.17 | 0.61 | YES |
| 20 | ACSL5 | ACSL5 | ACSL5 | 3029 | 0.16 | 0.61 | YES |
| 21 | RXRA | RXRA | RXRA | 3791 | 0.13 | 0.58 | NO |
| 22 | IRS1 | IRS1 | IRS1 | 3985 | 0.12 | 0.58 | NO |
| 23 | CPT1A | CPT1A | CPT1A | 4066 | 0.12 | 0.58 | NO |
| 24 | PRKAA2 | PRKAA2 | PRKAA2 | 4191 | 0.11 | 0.58 | NO |
| 25 | AKT3 | AKT3 | AKT3 | 4331 | 0.11 | 0.59 | NO |
| 26 | ACSL4 | ACSL4 | ACSL4 | 4399 | 0.1 | 0.59 | NO |
| 27 | TRADD | TRADD | TRADD | 4556 | 0.1 | 0.59 | NO |
| 28 | JAK2 | JAK2 | JAK2 | 5018 | 0.087 | 0.57 | NO |
| 29 | STK11 | STK11 | STK11 | 5044 | 0.086 | 0.58 | NO |
| 30 | IKBKG | IKBKG | IKBKG | 5344 | 0.079 | 0.57 | NO |
| 31 | AGRP | AGRP | AGRP | 5538 | 0.074 | 0.57 | NO |
| 32 | CAMKK1 | CAMKK1 | CAMKK1 | 5827 | 0.068 | 0.56 | NO |
| 33 | IKBKB | IKBKB | IKBKB | 5872 | 0.066 | 0.56 | NO |
| 34 | NFKBIA | NFKBIA | NFKBIA | 6281 | 0.058 | 0.54 | NO |
| 35 | PRKAA1 | PRKAA1 | PRKAA1 | 6448 | 0.054 | 0.54 | NO |
| 36 | TNFRSF1A | TNFRSF1A | TNFRSF1A | 6631 | 0.051 | 0.53 | NO |
| 37 | TRAF2 | TRAF2 | TRAF2 | 6783 | 0.048 | 0.53 | NO |
| 38 | PPARA | PPARA | PPARA | 6932 | 0.045 | 0.52 | NO |
| 39 | NFKB1 | NFKB1 | NFKB1 | 6947 | 0.045 | 0.52 | NO |
| 40 | AKT2 | AKT2 | AKT2 | 7031 | 0.043 | 0.52 | NO |
| 41 | NFKBIB | NFKBIB | NFKBIB | 7106 | 0.042 | 0.52 | NO |
| 42 | PRKAG2 | PRKAG2 | PRKAG2 | 7508 | 0.035 | 0.5 | NO |
| 43 | PRKAB1 | PRKAB1 | PRKAB1 | 7602 | 0.034 | 0.5 | NO |
| 44 | AKT1 | AKT1 | AKT1 | 8539 | 0.021 | 0.45 | NO |
| 45 | RXRB | RXRB | RXRB | 8873 | 0.016 | 0.44 | NO |
| 46 | CAMKK2 | CAMKK2 | CAMKK2 | 9391 | 0.0096 | 0.41 | NO |
| 47 | TNF | TNF | TNF | 9769 | 0.0049 | 0.39 | NO |
| 48 | NFKBIE | NFKBIE | NFKBIE | 9829 | 0.004 | 0.39 | NO |
| 49 | PCK2 | PCK2 | PCK2 | 11001 | -0.0094 | 0.32 | NO |
| 50 | STAT3 | STAT3 | STAT3 | 11374 | -0.014 | 0.3 | NO |
| 51 | PRKAB2 | PRKAB2 | PRKAB2 | 11522 | -0.015 | 0.3 | NO |
| 52 | RELA | RELA | RELA | 11817 | -0.018 | 0.28 | NO |
| 53 | ACSL6 | ACSL6 | ACSL6 | 12059 | -0.021 | 0.27 | NO |
| 54 | PRKAG1 | PRKAG1 | PRKAG1 | 12152 | -0.022 | 0.27 | NO |
| 55 | ACSL3 | ACSL3 | ACSL3 | 12345 | -0.024 | 0.26 | NO |
| 56 | ADIPOR1 | ADIPOR1 | ADIPOR1 | 12657 | -0.028 | 0.24 | NO |
| 57 | IRS4 | IRS4 | IRS4 | 12760 | -0.03 | 0.24 | NO |
| 58 | MAPK9 | MAPK9 | MAPK9 | 13436 | -0.038 | 0.21 | NO |
| 59 | CHUK | CHUK | CHUK | 13509 | -0.039 | 0.21 | NO |
| 60 | ADIPOR2 | ADIPOR2 | ADIPOR2 | 13629 | -0.041 | 0.2 | NO |
| 61 | PTPN11 | PTPN11 | PTPN11 | 14096 | -0.048 | 0.18 | NO |
| 62 | MTOR | MTOR | MTOR | 15061 | -0.063 | 0.13 | NO |
| 63 | MAPK8 | MAPK8 | MAPK8 | 16664 | -0.11 | 0.055 | NO |
| 64 | SLC2A1 | SLC2A1 | SLC2A1 | 16832 | -0.12 | 0.056 | NO |
| 65 | PRKAG3 | PRKAG3 | PRKAG3 | 18091 | -0.28 | 0.01 | NO |
Figure S109. Get High-res Image This plot shows mRNAseq_cNMF expression data heatmap (on the left) a RunningEnrichmentScore(RES) plot (on the top right) and a Signal2Noise(S2N) plot (on the bottom right) of genes in the pathway: KEGG GLYCINE SERINE AND THREONINE METABOLISM.
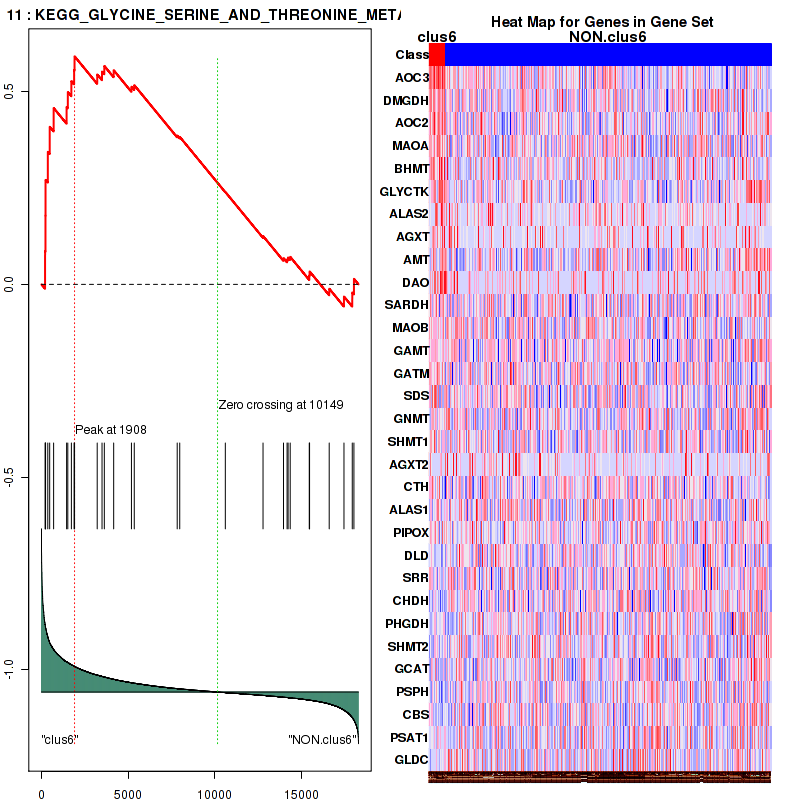
Figure S110. Get High-res Image For the top 5 core enriched genes in the pathway: KEGG GLYCINE SERINE AND THREONINE METABOLISM, this volcano plot shows how much they are up/down-regulated and significant. The significance was calculated by empirical bayesian fit
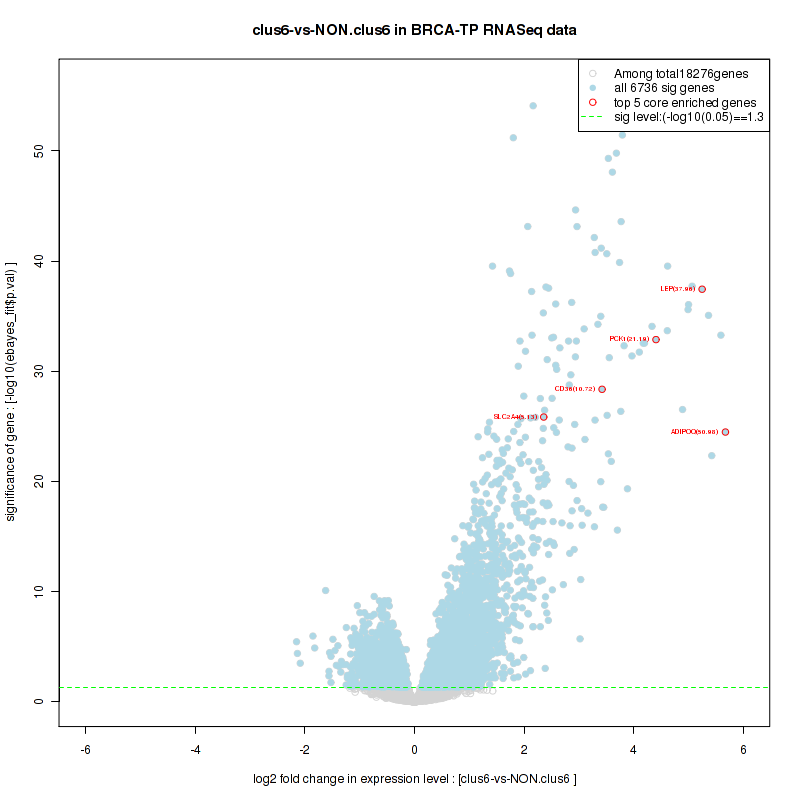
Table S56. Get Full Table This table shows a Running Enrichment Score (RES) of each gene in this pathway, that is, the enrichment score at this point in the ranked list of genes. All genes are ranked by Signal-to-Noise (S2N), a measure of similarity as default and are used to obtain ES matrix of all genes. In this way, GSEA tool uses expression pattern of not only overlapped genes but also not-overlapped genes to produce ES matrix.
| Rank | GENE | SYMBOL | DESC | LIST.LOC | S2N | RES | CORE_ENRICHMENT |
|---|---|---|---|---|---|---|---|
| 1 | SAA1 | SAA1 | SAA1 | 122 | 0.72 | 0.11 | YES |
| 2 | S100B | S100B | S100B | 288 | 0.54 | 0.18 | YES |
| 3 | MAPK10 | MAPK10 | MAPK10 | 761 | 0.36 | 0.21 | YES |
| 4 | FOS | FOS | FOS | 888 | 0.34 | 0.26 | YES |
| 5 | AGER | AGER | AGER | 1309 | 0.28 | 0.28 | YES |
| 6 | MAPK11 | MAPK11 | MAPK11 | 1587 | 0.26 | 0.3 | YES |
| 7 | DUSP4 | DUSP4 | DUSP4 | 1884 | 0.23 | 0.32 | YES |
| 8 | LY96 | LY96 | LY96 | 2212 | 0.2 | 0.34 | YES |
| 9 | TLR4 | TLR4 | TLR4 | 2237 | 0.2 | 0.37 | YES |
| 10 | JUN | JUN | JUN | 2531 | 0.18 | 0.38 | YES |
| 11 | MEF2C | MEF2C | MEF2C | 2543 | 0.18 | 0.41 | YES |
| 12 | IRAK2 | IRAK2 | IRAK2 | 2959 | 0.16 | 0.41 | YES |
| 13 | DUSP6 | DUSP6 | DUSP6 | 3232 | 0.15 | 0.42 | YES |
| 14 | RPS6KA2 | RPS6KA2 | RPS6KA2 | 3302 | 0.15 | 0.44 | YES |
| 15 | TLR3 | TLR3 | TLR3 | 3307 | 0.15 | 0.46 | YES |
| 16 | NOD1 | NOD1 | NOD1 | 3511 | 0.14 | 0.47 | YES |
| 17 | TICAM2 | TICAM2 | TICAM2 | 3647 | 0.13 | 0.49 | YES |
| 18 | CD14 | CD14 | CD14 | 4517 | 0.1 | 0.46 | NO |
| 19 | RPS6KA3 | RPS6KA3 | RPS6KA3 | 4935 | 0.09 | 0.45 | NO |
| 20 | IKBKG | IKBKG | IKBKG | 5344 | 0.079 | 0.44 | NO |
| 21 | IKBKB | IKBKB | IKBKB | 5872 | 0.066 | 0.42 | NO |
| 22 | PPP2R1B | PPP2R1B | PPP2R1B | 5928 | 0.065 | 0.42 | NO |
| 23 | NFKB2 | NFKB2 | NFKB2 | 5959 | 0.065 | 0.43 | NO |
| 24 | MAP2K7 | MAP2K7 | MAP2K7 | 6072 | 0.062 | 0.44 | NO |
| 25 | MAPK7 | MAPK7 | MAPK7 | 6119 | 0.061 | 0.44 | NO |
| 26 | NFKBIA | NFKBIA | NFKBIA | 6281 | 0.058 | 0.44 | NO |
| 27 | NFKBIB | NFKBIB | NFKBIB | 7106 | 0.042 | 0.4 | NO |
| 28 | S100A12 | S100A12 | S100A12 | 7227 | 0.04 | 0.4 | NO |
| 29 | MAPK3 | MAPK3 | MAPK3 | 7546 | 0.035 | 0.39 | NO |
| 30 | DUSP7 | DUSP7 | DUSP7 | 7753 | 0.032 | 0.39 | NO |
| 31 | MAP2K2 | MAP2K2 | MAP2K2 | 7776 | 0.031 | 0.39 | NO |
| 32 | RPS6KA5 | RPS6KA5 | RPS6KA5 | 8320 | 0.024 | 0.36 | NO |
| 33 | RIPK1 | RIPK1 | RIPK1 | 8513 | 0.021 | 0.36 | NO |
| 34 | MEF2A | MEF2A | MEF2A | 8528 | 0.021 | 0.36 | NO |
| 35 | TICAM1 | TICAM1 | TICAM1 | 8691 | 0.018 | 0.35 | NO |
| 36 | MAP2K6 | MAP2K6 | MAP2K6 | 8728 | 0.018 | 0.35 | NO |
| 37 | DUSP3 | DUSP3 | DUSP3 | 8762 | 0.018 | 0.36 | NO |
| 38 | TAB1 | TAB1 | TAB1 | 8864 | 0.016 | 0.35 | NO |
| 39 | UBA52 | UBA52 | UBA52 | 8895 | 0.016 | 0.35 | NO |
| 40 | PPP2CB | PPP2CB | PPP2CB | 8995 | 0.014 | 0.35 | NO |
| 41 | ATF1 | ATF1 | ATF1 | 9332 | 0.01 | 0.33 | NO |
| 42 | MAP2K3 | MAP2K3 | MAP2K3 | 9837 | 0.0039 | 0.3 | NO |
| 43 | MAPKAPK3 | MAPKAPK3 | MAPKAPK3 | 10148 | 0.000022 | 0.29 | NO |
| 44 | RPS27A | RPS27A | RPS27A | 10171 | -0.00023 | 0.29 | NO |
| 45 | CREB1 | CREB1 | CREB1 | 10607 | -0.005 | 0.26 | NO |
| 46 | PPP2R1A | PPP2R1A | PPP2R1A | 10629 | -0.0053 | 0.26 | NO |
| 47 | MAP2K1 | MAP2K1 | MAP2K1 | 10791 | -0.0072 | 0.26 | NO |
| 48 | RPS6KA1 | RPS6KA1 | RPS6KA1 | 10810 | -0.0073 | 0.26 | NO |
| 49 | MAPKAPK2 | MAPKAPK2 | MAPKAPK2 | 11065 | -0.01 | 0.24 | NO |
| 50 | MAPK14 | MAPK14 | MAPK14 | 11533 | -0.015 | 0.22 | NO |
| 51 | HMGB1 | HMGB1 | HMGB1 | 11691 | -0.017 | 0.22 | NO |
| 52 | TRAF6 | TRAF6 | TRAF6 | 11721 | -0.017 | 0.22 | NO |
| 53 | TAB3 | TAB3 | TAB3 | 11756 | -0.018 | 0.22 | NO |
| 54 | NOD2 | NOD2 | NOD2 | 11761 | -0.018 | 0.22 | NO |
| 55 | RELA | RELA | RELA | 11817 | -0.018 | 0.22 | NO |
| 56 | MAP2K4 | MAP2K4 | MAP2K4 | 12043 | -0.021 | 0.21 | NO |
| 57 | PPP2CA | PPP2CA | PPP2CA | 12131 | -0.022 | 0.21 | NO |
| 58 | MAP3K7 | MAP3K7 | MAP3K7 | 12987 | -0.032 | 0.17 | NO |
| 59 | MAPK1 | MAPK1 | MAPK1 | 13399 | -0.038 | 0.15 | NO |
| 60 | MAPK9 | MAPK9 | MAPK9 | 13436 | -0.038 | 0.15 | NO |
| 61 | CHUK | CHUK | CHUK | 13509 | -0.039 | 0.16 | NO |
| 62 | ELK1 | ELK1 | ELK1 | 13556 | -0.04 | 0.16 | NO |
| 63 | APP | APP | APP | 13577 | -0.04 | 0.16 | NO |
| 64 | ATF2 | ATF2 | ATF2 | 13924 | -0.045 | 0.15 | NO |
| 65 | TAB2 | TAB2 | TAB2 | 13966 | -0.046 | 0.16 | NO |
| 66 | IRAK1 | IRAK1 | IRAK1 | 13980 | -0.046 | 0.16 | NO |
| 67 | PPP2R5D | PPP2R5D | PPP2R5D | 15110 | -0.064 | 0.11 | NO |
| 68 | RIPK2 | RIPK2 | RIPK2 | 16491 | -0.1 | 0.053 | NO |
| 69 | MAPK8 | MAPK8 | MAPK8 | 16664 | -0.11 | 0.06 | NO |
| 70 | CDK1 | CDK1 | CDK1 | 17603 | -0.18 | 0.037 | NO |
Figure S111. Get High-res Image This plot shows mRNAseq_cNMF expression data heatmap (on the left) a RunningEnrichmentScore(RES) plot (on the top right) and a Signal2Noise(S2N) plot (on the bottom right) of genes in the pathway: KEGG ARGININE AND PROLINE METABOLISM.

Figure S112. Get High-res Image For the top 5 core enriched genes in the pathway: KEGG ARGININE AND PROLINE METABOLISM, this volcano plot shows how much they are up/down-regulated and significant. The significance was calculated by empirical bayesian fit

Table S57. Get Full Table This table shows a Running Enrichment Score (RES) of each gene in this pathway, that is, the enrichment score at this point in the ranked list of genes. All genes are ranked by Signal-to-Noise (S2N), a measure of similarity as default and are used to obtain ES matrix of all genes. In this way, GSEA tool uses expression pattern of not only overlapped genes but also not-overlapped genes to produce ES matrix.
| Rank | GENE | SYMBOL | DESC | LIST.LOC | S2N | RES | CORE_ENRICHMENT |
|---|---|---|---|---|---|---|---|
| 1 | SAA1 | SAA1 | SAA1 | 122 | 0.72 | 0.098 | YES |
| 2 | S100B | S100B | S100B | 288 | 0.54 | 0.17 | YES |
| 3 | MAPK10 | MAPK10 | MAPK10 | 761 | 0.36 | 0.19 | YES |
| 4 | FOS | FOS | FOS | 888 | 0.34 | 0.24 | YES |
| 5 | AGER | AGER | AGER | 1309 | 0.28 | 0.25 | YES |
| 6 | PELI2 | PELI2 | PELI2 | 1524 | 0.26 | 0.28 | YES |
| 7 | MAPK11 | MAPK11 | MAPK11 | 1587 | 0.26 | 0.31 | YES |
| 8 | TLR8 | TLR8 | TLR8 | 1656 | 0.25 | 0.35 | YES |
| 9 | DUSP4 | DUSP4 | DUSP4 | 1884 | 0.23 | 0.37 | YES |
| 10 | TLR9 | TLR9 | TLR9 | 2140 | 0.21 | 0.38 | YES |
| 11 | JUN | JUN | JUN | 2531 | 0.18 | 0.39 | YES |
| 12 | MEF2C | MEF2C | MEF2C | 2543 | 0.18 | 0.42 | YES |
| 13 | TLR7 | TLR7 | TLR7 | 2925 | 0.16 | 0.42 | YES |
| 14 | IRAK2 | IRAK2 | IRAK2 | 2959 | 0.16 | 0.44 | YES |
| 15 | DUSP6 | DUSP6 | DUSP6 | 3232 | 0.15 | 0.45 | YES |
| 16 | RPS6KA2 | RPS6KA2 | RPS6KA2 | 3302 | 0.15 | 0.46 | YES |
| 17 | NOD1 | NOD1 | NOD1 | 3511 | 0.14 | 0.47 | YES |
| 18 | RPS6KA3 | RPS6KA3 | RPS6KA3 | 4935 | 0.09 | 0.41 | NO |
| 19 | MAP3K1 | MAP3K1 | MAP3K1 | 5155 | 0.083 | 0.41 | NO |
| 20 | IKBKG | IKBKG | IKBKG | 5344 | 0.079 | 0.41 | NO |
| 21 | IKBKB | IKBKB | IKBKB | 5872 | 0.066 | 0.39 | NO |
| 22 | PPP2R1B | PPP2R1B | PPP2R1B | 5928 | 0.065 | 0.4 | NO |
| 23 | NFKB2 | NFKB2 | NFKB2 | 5959 | 0.065 | 0.4 | NO |
| 24 | MAP2K7 | MAP2K7 | MAP2K7 | 6072 | 0.062 | 0.41 | NO |
| 25 | MAPK7 | MAPK7 | MAPK7 | 6119 | 0.061 | 0.41 | NO |
| 26 | NFKBIA | NFKBIA | NFKBIA | 6281 | 0.058 | 0.41 | NO |
| 27 | PELI3 | PELI3 | PELI3 | 6598 | 0.051 | 0.4 | NO |
| 28 | ECSIT | ECSIT | ECSIT | 7071 | 0.043 | 0.38 | NO |
| 29 | NFKBIB | NFKBIB | NFKBIB | 7106 | 0.042 | 0.39 | NO |
| 30 | S100A12 | S100A12 | S100A12 | 7227 | 0.04 | 0.39 | NO |
| 31 | MAPK3 | MAPK3 | MAPK3 | 7546 | 0.035 | 0.38 | NO |
| 32 | DUSP7 | DUSP7 | DUSP7 | 7753 | 0.032 | 0.37 | NO |
| 33 | MAP2K2 | MAP2K2 | MAP2K2 | 7776 | 0.031 | 0.37 | NO |
| 34 | RPS6KA5 | RPS6KA5 | RPS6KA5 | 8320 | 0.024 | 0.34 | NO |
| 35 | MEF2A | MEF2A | MEF2A | 8528 | 0.021 | 0.34 | NO |
| 36 | MAP2K6 | MAP2K6 | MAP2K6 | 8728 | 0.018 | 0.33 | NO |
| 37 | DUSP3 | DUSP3 | DUSP3 | 8762 | 0.018 | 0.33 | NO |
| 38 | IRAK4 | IRAK4 | IRAK4 | 8778 | 0.017 | 0.33 | NO |
| 39 | TAB1 | TAB1 | TAB1 | 8864 | 0.016 | 0.33 | NO |
| 40 | PELI1 | PELI1 | PELI1 | 8889 | 0.016 | 0.33 | NO |
| 41 | UBA52 | UBA52 | UBA52 | 8895 | 0.016 | 0.33 | NO |
| 42 | PPP2CB | PPP2CB | PPP2CB | 8995 | 0.014 | 0.33 | NO |
| 43 | ATF1 | ATF1 | ATF1 | 9332 | 0.01 | 0.31 | NO |
| 44 | MAP2K3 | MAP2K3 | MAP2K3 | 9837 | 0.0039 | 0.28 | NO |
| 45 | MAPKAPK3 | MAPKAPK3 | MAPKAPK3 | 10148 | 0.000022 | 0.27 | NO |
| 46 | RPS27A | RPS27A | RPS27A | 10171 | -0.00023 | 0.27 | NO |
| 47 | MYD88 | MYD88 | MYD88 | 10374 | -0.0026 | 0.26 | NO |
| 48 | CREB1 | CREB1 | CREB1 | 10607 | -0.005 | 0.24 | NO |
| 49 | PPP2R1A | PPP2R1A | PPP2R1A | 10629 | -0.0053 | 0.24 | NO |
| 50 | MAP2K1 | MAP2K1 | MAP2K1 | 10791 | -0.0072 | 0.24 | NO |
| 51 | RPS6KA1 | RPS6KA1 | RPS6KA1 | 10810 | -0.0073 | 0.24 | NO |
| 52 | MAPKAPK2 | MAPKAPK2 | MAPKAPK2 | 11065 | -0.01 | 0.22 | NO |
| 53 | MAPK14 | MAPK14 | MAPK14 | 11533 | -0.015 | 0.2 | NO |
| 54 | HMGB1 | HMGB1 | HMGB1 | 11691 | -0.017 | 0.19 | NO |
| 55 | TRAF6 | TRAF6 | TRAF6 | 11721 | -0.017 | 0.19 | NO |
| 56 | TAB3 | TAB3 | TAB3 | 11756 | -0.018 | 0.2 | NO |
| 57 | NOD2 | NOD2 | NOD2 | 11761 | -0.018 | 0.2 | NO |
| 58 | RELA | RELA | RELA | 11817 | -0.018 | 0.2 | NO |
| 59 | MAP2K4 | MAP2K4 | MAP2K4 | 12043 | -0.021 | 0.19 | NO |
| 60 | PPP2CA | PPP2CA | PPP2CA | 12131 | -0.022 | 0.19 | NO |
| 61 | MAP3K7 | MAP3K7 | MAP3K7 | 12987 | -0.032 | 0.14 | NO |
| 62 | MAPK1 | MAPK1 | MAPK1 | 13399 | -0.038 | 0.13 | NO |
| 63 | MAPK9 | MAPK9 | MAPK9 | 13436 | -0.038 | 0.13 | NO |
| 64 | CHUK | CHUK | CHUK | 13509 | -0.039 | 0.13 | NO |
| 65 | ELK1 | ELK1 | ELK1 | 13556 | -0.04 | 0.14 | NO |
| 66 | APP | APP | APP | 13577 | -0.04 | 0.14 | NO |
| 67 | UBE2N | UBE2N | UBE2N | 13831 | -0.043 | 0.13 | NO |
| 68 | ATF2 | ATF2 | ATF2 | 13924 | -0.045 | 0.13 | NO |
| 69 | TAB2 | TAB2 | TAB2 | 13966 | -0.046 | 0.14 | NO |
| 70 | IRAK1 | IRAK1 | IRAK1 | 13980 | -0.046 | 0.14 | NO |
| 71 | PPP2R5D | PPP2R5D | PPP2R5D | 15110 | -0.064 | 0.092 | NO |
| 72 | RIPK2 | RIPK2 | RIPK2 | 16491 | -0.1 | 0.031 | NO |
| 73 | MAPK8 | MAPK8 | MAPK8 | 16664 | -0.11 | 0.037 | NO |
| 74 | TMEM189-UBE2V1 | TMEM189-UBE2V1 | TMEM189-UBE2V1 | 17564 | -0.18 | 0.013 | NO |
| 75 | CDK1 | CDK1 | CDK1 | 17603 | -0.18 | 0.037 | NO |
Figure S113. Get High-res Image This plot shows mRNAseq_cNMF expression data heatmap (on the left) a RunningEnrichmentScore(RES) plot (on the top right) and a Signal2Noise(S2N) plot (on the bottom right) of genes in the pathway: KEGG TYROSINE METABOLISM.
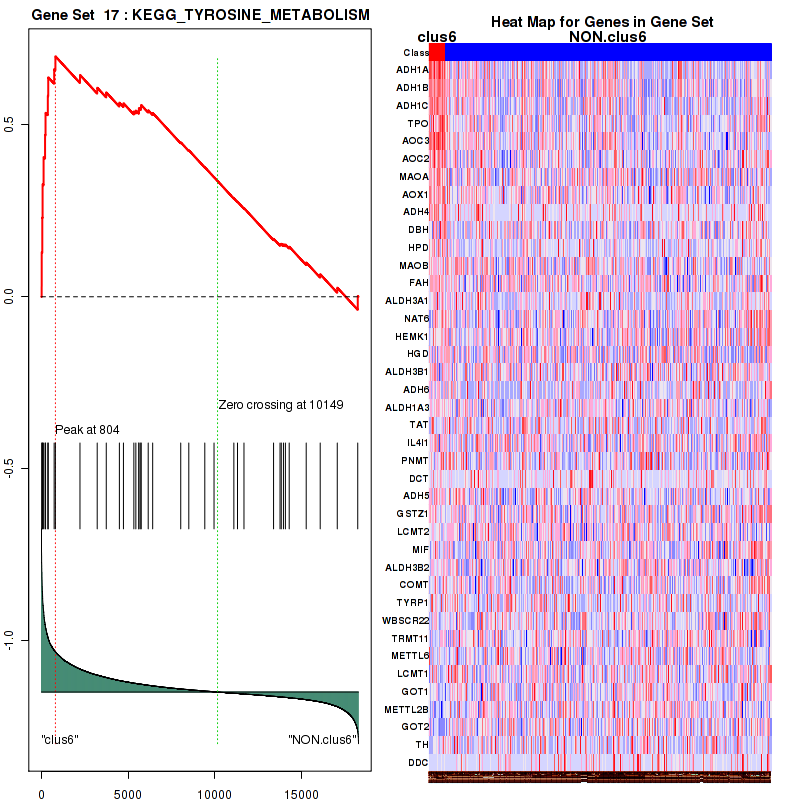
Figure S114. Get High-res Image For the top 5 core enriched genes in the pathway: KEGG TYROSINE METABOLISM, this volcano plot shows how much they are up/down-regulated and significant. The significance was calculated by empirical bayesian fit

Table S58. Get Full Table This table shows a Running Enrichment Score (RES) of each gene in this pathway, that is, the enrichment score at this point in the ranked list of genes. All genes are ranked by Signal-to-Noise (S2N), a measure of similarity as default and are used to obtain ES matrix of all genes. In this way, GSEA tool uses expression pattern of not only overlapped genes but also not-overlapped genes to produce ES matrix.
| Rank | GENE | SYMBOL | DESC | LIST.LOC | S2N | RES | CORE_ENRICHMENT |
|---|---|---|---|---|---|---|---|
| 1 | GPD1 | GPD1 | GPD1 | 23 | 1 | 0.058 | YES |
| 2 | G0S2 | G0S2 | G0S2 | 51 | 0.89 | 0.11 | YES |
| 3 | ACADL | ACADL | ACADL | 80 | 0.79 | 0.15 | YES |
| 4 | CD36 | CD36 | CD36 | 101 | 0.75 | 0.19 | YES |
| 5 | PPARG | PPARG | PPARG | 193 | 0.62 | 0.22 | YES |
| 6 | ANGPTL4 | ANGPTL4 | ANGPTL4 | 287 | 0.54 | 0.25 | YES |
| 7 | ACACB | ACACB | ACACB | 318 | 0.52 | 0.28 | YES |
| 8 | DGAT2 | DGAT2 | DGAT2 | 385 | 0.48 | 0.3 | YES |
| 9 | GPAM | GPAM | GPAM | 442 | 0.45 | 0.32 | YES |
| 10 | HMGCS2 | HMGCS2 | HMGCS2 | 638 | 0.39 | 0.33 | YES |
| 11 | CYP7A1 | CYP7A1 | CYP7A1 | 696 | 0.38 | 0.35 | YES |
| 12 | ELOVL3 | ELOVL3 | ELOVL3 | 789 | 0.36 | 0.37 | YES |
| 13 | AGPAT9 | AGPAT9 | AGPAT9 | 1064 | 0.32 | 0.37 | YES |
| 14 | GPAT2 | GPAT2 | GPAT2 | 1080 | 0.31 | 0.39 | YES |
| 15 | ACADS | ACADS | ACADS | 1483 | 0.26 | 0.38 | YES |
| 16 | ABCB4 | ABCB4 | ABCB4 | 1659 | 0.25 | 0.38 | YES |
| 17 | AGPAT2 | AGPAT2 | AGPAT2 | 1705 | 0.24 | 0.4 | YES |
| 18 | ELOVL2 | ELOVL2 | ELOVL2 | 2199 | 0.21 | 0.38 | YES |
| 19 | ACSL1 | ACSL1 | ACSL1 | 2394 | 0.19 | 0.38 | YES |
| 20 | CYP4A11 | CYP4A11 | CYP4A11 | 2427 | 0.19 | 0.39 | YES |
| 21 | CTGF | CTGF | CTGF | 2582 | 0.18 | 0.39 | YES |
| 22 | CPT1B | CPT1B | CPT1B | 2667 | 0.18 | 0.4 | YES |
| 23 | PPARGC1A | PPARGC1A | PPARGC1A | 2822 | 0.17 | 0.4 | YES |
| 24 | ACSL5 | ACSL5 | ACSL5 | 3029 | 0.16 | 0.4 | YES |
| 25 | APOA1 | APOA1 | APOA1 | 3082 | 0.16 | 0.4 | YES |
| 26 | PLIN2 | PLIN2 | PLIN2 | 3093 | 0.16 | 0.41 | YES |
| 27 | SLC27A1 | SLC27A1 | SLC27A1 | 3100 | 0.16 | 0.42 | YES |
| 28 | PPARGC1B | PPARGC1B | PPARGC1B | 3252 | 0.15 | 0.42 | YES |
| 29 | CYP1A1 | CYP1A1 | CYP1A1 | 3479 | 0.14 | 0.42 | YES |
| 30 | ABCA1 | ABCA1 | ABCA1 | 3726 | 0.13 | 0.41 | YES |
| 31 | PCCA | PCCA | PCCA | 3741 | 0.13 | 0.42 | YES |
| 32 | RXRA | RXRA | RXRA | 3791 | 0.13 | 0.42 | YES |
| 33 | RORA | RORA | RORA | 3893 | 0.12 | 0.42 | YES |
| 34 | CPT1A | CPT1A | CPT1A | 4066 | 0.12 | 0.42 | YES |
| 35 | GLIPR1 | GLIPR1 | GLIPR1 | 4077 | 0.12 | 0.42 | YES |
| 36 | PRKAA2 | PRKAA2 | PRKAA2 | 4191 | 0.11 | 0.42 | YES |
| 37 | SLC25A20 | SLC25A20 | SLC25A20 | 4386 | 0.11 | 0.42 | YES |
| 38 | ACSL4 | ACSL4 | ACSL4 | 4399 | 0.1 | 0.42 | YES |
| 39 | AGPAT4 | AGPAT4 | AGPAT4 | 4828 | 0.092 | 0.41 | NO |
| 40 | NPAS2 | NPAS2 | NPAS2 | 4835 | 0.092 | 0.41 | NO |
| 41 | SMARCD3 | SMARCD3 | SMARCD3 | 4854 | 0.092 | 0.42 | NO |
| 42 | LPCAT4 | LPCAT4 | LPCAT4 | 4881 | 0.091 | 0.42 | NO |
| 43 | PEX11A | PEX11A | PEX11A | 5135 | 0.084 | 0.41 | NO |
| 44 | ACADVL | ACADVL | ACADVL | 5332 | 0.079 | 0.4 | NO |
| 45 | SIN3B | SIN3B | SIN3B | 5422 | 0.077 | 0.4 | NO |
| 46 | AGT | AGT | AGT | 5637 | 0.072 | 0.4 | NO |
| 47 | MED16 | MED16 | MED16 | 5785 | 0.069 | 0.39 | NO |
| 48 | MED22 | MED22 | MED22 | 6490 | 0.053 | 0.36 | NO |
| 49 | ESRRA | ESRRA | ESRRA | 6689 | 0.05 | 0.35 | NO |
| 50 | MED15 | MED15 | MED15 | 6849 | 0.047 | 0.34 | NO |
| 51 | PPARA | PPARA | PPARA | 6932 | 0.045 | 0.34 | NO |
| 52 | LPIN3 | LPIN3 | LPIN3 | 7092 | 0.042 | 0.33 | NO |
| 53 | PRIC285 | PRIC285 | PRIC285 | 7140 | 0.042 | 0.33 | NO |
| 54 | GPD1L | GPD1L | GPD1L | 7202 | 0.04 | 0.33 | NO |
| 55 | HADH | HADH | HADH | 7427 | 0.036 | 0.32 | NO |
| 56 | HMGCL | HMGCL | HMGCL | 7455 | 0.036 | 0.32 | NO |
| 57 | DGAT1 | DGAT1 | DGAT1 | 7463 | 0.036 | 0.32 | NO |
| 58 | PRKAG2 | PRKAG2 | PRKAG2 | 7508 | 0.035 | 0.32 | NO |
| 59 | ME1 | ME1 | ME1 | 7612 | 0.034 | 0.32 | NO |
| 60 | MED26 | MED26 | MED26 | 7653 | 0.033 | 0.32 | NO |
| 61 | NR1D1 | NR1D1 | NR1D1 | 7726 | 0.032 | 0.32 | NO |
| 62 | ACADM | ACADM | ACADM | 7741 | 0.032 | 0.32 | NO |
| 63 | TEAD2 | TEAD2 | TEAD2 | 8078 | 0.027 | 0.3 | NO |
| 64 | NCOR2 | NCOR2 | NCOR2 | 8094 | 0.027 | 0.3 | NO |
| 65 | ECHS1 | ECHS1 | ECHS1 | 8110 | 0.026 | 0.3 | NO |
| 66 | LPIN2 | LPIN2 | LPIN2 | 8254 | 0.024 | 0.3 | NO |
| 67 | MED7 | MED7 | MED7 | 8349 | 0.023 | 0.29 | NO |
| 68 | YAP1 | YAP1 | YAP1 | 8397 | 0.023 | 0.29 | NO |
| 69 | ELOVL5 | ELOVL5 | ELOVL5 | 8464 | 0.022 | 0.29 | NO |
| 70 | CREBBP | CREBBP | CREBBP | 8571 | 0.02 | 0.28 | NO |
| 71 | MED11 | MED11 | MED11 | 8600 | 0.02 | 0.28 | NO |
| 72 | ARNTL | ARNTL | ARNTL | 8743 | 0.018 | 0.28 | NO |
| 73 | TEAD1 | TEAD1 | TEAD1 | 8846 | 0.016 | 0.27 | NO |
| 74 | NRF1 | NRF1 | NRF1 | 9010 | 0.014 | 0.26 | NO |
| 75 | MED10 | MED10 | MED10 | 9093 | 0.013 | 0.26 | NO |
| 76 | MCEE | MCEE | MCEE | 9136 | 0.013 | 0.26 | NO |
| 77 | LPCAT1 | LPCAT1 | LPCAT1 | 9229 | 0.012 | 0.25 | NO |
| 78 | MED25 | MED25 | MED25 | 9488 | 0.0084 | 0.24 | NO |
| 79 | HDAC3 | HDAC3 | HDAC3 | 9504 | 0.0082 | 0.24 | NO |
| 80 | HADHB | HADHB | HADHB | 9533 | 0.0079 | 0.24 | NO |
| 81 | HADHA | HADHA | HADHA | 9593 | 0.0072 | 0.24 | NO |
| 82 | SLC25A1 | SLC25A1 | SLC25A1 | 9615 | 0.0069 | 0.24 | NO |
| 83 | TNFRSF21 | TNFRSF21 | TNFRSF21 | 9673 | 0.0062 | 0.23 | NO |
| 84 | NCOA1 | NCOA1 | NCOA1 | 9715 | 0.0056 | 0.23 | NO |
| 85 | MED4 | MED4 | MED4 | 9754 | 0.0051 | 0.23 | NO |
| 86 | ACOX1 | ACOX1 | ACOX1 | 9955 | 0.0023 | 0.22 | NO |
| 87 | AGPAT3 | AGPAT3 | AGPAT3 | 10094 | 0.00066 | 0.21 | NO |
| 88 | WWTR1 | WWTR1 | WWTR1 | 10207 | -0.0006 | 0.2 | NO |
| 89 | MED9 | MED9 | MED9 | 10226 | -0.00084 | 0.2 | NO |
| 90 | SIN3A | SIN3A | SIN3A | 10361 | -0.0025 | 0.2 | NO |
| 91 | MED13L | MED13L | MED13L | 10376 | -0.0026 | 0.2 | NO |
| 92 | ALAS1 | ALAS1 | ALAS1 | 10597 | -0.0049 | 0.18 | NO |
| 93 | MED23 | MED23 | MED23 | 10642 | -0.0055 | 0.18 | NO |
| 94 | MED12 | MED12 | MED12 | 10745 | -0.0068 | 0.18 | NO |
| 95 | TEAD3 | TEAD3 | TEAD3 | 10816 | -0.0074 | 0.17 | NO |
| 96 | GK | GK | GK | 11055 | -0.01 | 0.16 | NO |
| 97 | DECR1 | DECR1 | DECR1 | 11080 | -0.01 | 0.16 | NO |
| 98 | MED29 | MED29 | MED29 | 11117 | -0.011 | 0.16 | NO |
| 99 | ELOVL7 | ELOVL7 | ELOVL7 | 11146 | -0.011 | 0.16 | NO |
| 100 | NFYB | NFYB | NFYB | 11230 | -0.012 | 0.15 | NO |
| 101 | MED6 | MED6 | MED6 | 11391 | -0.014 | 0.14 | NO |
| 102 | PRKAB2 | PRKAB2 | PRKAB2 | 11522 | -0.015 | 0.14 | NO |
| 103 | MED8 | MED8 | MED8 | 11545 | -0.016 | 0.14 | NO |
| 104 | ACSL6 | ACSL6 | ACSL6 | 12059 | -0.021 | 0.11 | NO |
| 105 | ACSL3 | ACSL3 | ACSL3 | 12345 | -0.024 | 0.097 | NO |
| 106 | NCOR1 | NCOR1 | NCOR1 | 12502 | -0.026 | 0.09 | NO |
| 107 | TECR | TECR | TECR | 12551 | -0.027 | 0.088 | NO |
| 108 | MED19 | MED19 | MED19 | 12567 | -0.027 | 0.089 | NO |
| 109 | AGPAT6 | AGPAT6 | AGPAT6 | 12580 | -0.027 | 0.09 | NO |
| 110 | CPT2 | CPT2 | CPT2 | 12585 | -0.027 | 0.091 | NO |
| 111 | TBL1X | TBL1X | TBL1X | 12661 | -0.028 | 0.089 | NO |
| 112 | MED18 | MED18 | MED18 | 12665 | -0.028 | 0.09 | NO |
| 113 | ACAT1 | ACAT1 | ACAT1 | 12671 | -0.028 | 0.092 | NO |
| 114 | NCOA3 | NCOA3 | NCOA3 | 12710 | -0.029 | 0.091 | NO |
| 115 | FHL2 | FHL2 | FHL2 | 12764 | -0.03 | 0.09 | NO |
| 116 | FASN | FASN | FASN | 12947 | -0.032 | 0.082 | NO |
| 117 | EP300 | EP300 | EP300 | 13136 | -0.034 | 0.073 | NO |
| 118 | MED27 | MED27 | MED27 | 13167 | -0.034 | 0.073 | NO |
| 119 | MED31 | MED31 | MED31 | 13264 | -0.036 | 0.07 | NO |
| 120 | AGPAT1 | AGPAT1 | AGPAT1 | 13420 | -0.038 | 0.064 | NO |
| 121 | TBL1XR1 | TBL1XR1 | TBL1XR1 | 13478 | -0.039 | 0.063 | NO |
| 122 | LPIN1 | LPIN1 | LPIN1 | 13609 | -0.041 | 0.058 | NO |
| 123 | CDK19 | CDK19 | CDK19 | 13643 | -0.041 | 0.058 | NO |
| 124 | ELOVL1 | ELOVL1 | ELOVL1 | 13651 | -0.041 | 0.06 | NO |
| 125 | MED17 | MED17 | MED17 | 13718 | -0.042 | 0.059 | NO |
| 126 | FDFT1 | FDFT1 | FDFT1 | 13750 | -0.042 | 0.06 | NO |
| 127 | MED21 | MED21 | MED21 | 13761 | -0.042 | 0.062 | NO |
| 128 | SREBF2 | SREBF2 | SREBF2 | 13772 | -0.043 | 0.064 | NO |
| 129 | MUT | MUT | MUT | 13882 | -0.044 | 0.06 | NO |
| 130 | PCCB | PCCB | PCCB | 13937 | -0.045 | 0.06 | NO |
| 131 | OXCT1 | OXCT1 | OXCT1 | 14113 | -0.048 | 0.053 | NO |
| 132 | BDH1 | BDH1 | BDH1 | 14234 | -0.05 | 0.049 | NO |
| 133 | MED24 | MED24 | MED24 | 14286 | -0.051 | 0.049 | NO |
| 134 | HSD17B12 | HSD17B12 | HSD17B12 | 14560 | -0.055 | 0.037 | NO |
| 135 | HMGCS1 | HMGCS1 | HMGCS1 | 14617 | -0.056 | 0.037 | NO |
| 136 | APOA5 | APOA5 | APOA5 | 14702 | -0.057 | 0.036 | NO |
| 137 | CCNC | CCNC | CCNC | 14775 | -0.058 | 0.035 | NO |
| 138 | AGPAT5 | AGPAT5 | AGPAT5 | 14818 | -0.058 | 0.036 | NO |
| 139 | SREBF1 | SREBF1 | SREBF1 | 15069 | -0.064 | 0.026 | NO |
| 140 | HMGCR | HMGCR | HMGCR | 15080 | -0.064 | 0.029 | NO |
| 141 | TEAD4 | TEAD4 | TEAD4 | 15218 | -0.067 | 0.025 | NO |
| 142 | TXNRD1 | TXNRD1 | TXNRD1 | 15237 | -0.067 | 0.028 | NO |
| 143 | NCOA6 | NCOA6 | NCOA6 | 15588 | -0.075 | 0.013 | NO |
| 144 | MED20 | MED20 | MED20 | 15731 | -0.078 | 0.0096 | NO |
| 145 | ACLY | ACLY | ACLY | 15872 | -0.082 | 0.0065 | NO |
| 146 | MED14 | MED14 | MED14 | 15883 | -0.082 | 0.011 | NO |
| 147 | ELOVL4 | ELOVL4 | ELOVL4 | 15978 | -0.085 | 0.01 | NO |
| 148 | GRHL1 | GRHL1 | GRHL1 | 16303 | -0.095 | -0.0022 | NO |
| 149 | GPD2 | GPD2 | GPD2 | 16311 | -0.095 | 0.0028 | NO |
| 150 | TGS1 | TGS1 | TGS1 | 16313 | -0.095 | 0.0082 | NO |
| 151 | MED30 | MED30 | MED30 | 16321 | -0.095 | 0.013 | NO |
| 152 | ACACA | ACACA | ACACA | 16363 | -0.096 | 0.016 | NO |
| 153 | NCOA2 | NCOA2 | NCOA2 | 16398 | -0.097 | 0.02 | NO |
| 154 | TIAM2 | TIAM2 | TIAM2 | 16427 | -0.098 | 0.024 | NO |
| 155 | LCLAT1 | LCLAT1 | LCLAT1 | 16494 | -0.1 | 0.026 | NO |
| 156 | NFYA | NFYA | NFYA | 16500 | -0.1 | 0.032 | NO |
| 157 | TRIB3 | TRIB3 | TRIB3 | 16546 | -0.1 | 0.035 | NO |
| 158 | CDK8 | CDK8 | CDK8 | 16731 | -0.11 | 0.032 | NO |
| 159 | MED1 | MED1 | MED1 | 16770 | -0.12 | 0.036 | NO |
| 160 | CLOCK | CLOCK | CLOCK | 17178 | -0.14 | 0.022 | NO |
| 161 | ELOVL6 | ELOVL6 | ELOVL6 | 17461 | -0.16 | 0.015 | NO |
| 162 | FADS1 | FADS1 | FADS1 | 17758 | -0.2 | 0.01 | NO |
| 163 | ANKRD1 | ANKRD1 | ANKRD1 | 18202 | -0.32 | 0.0041 | NO |
Figure S115. Get High-res Image This plot shows mRNAseq_cNMF expression data heatmap (on the left) a RunningEnrichmentScore(RES) plot (on the top right) and a Signal2Noise(S2N) plot (on the bottom right) of genes in the pathway: KEGG GLYCEROLIPID METABOLISM.

Figure S116. Get High-res Image For the top 5 core enriched genes in the pathway: KEGG GLYCEROLIPID METABOLISM, this volcano plot shows how much they are up/down-regulated and significant. The significance was calculated by empirical bayesian fit

Table S59. Get Full Table This table shows a Running Enrichment Score (RES) of each gene in this pathway, that is, the enrichment score at this point in the ranked list of genes. All genes are ranked by Signal-to-Noise (S2N), a measure of similarity as default and are used to obtain ES matrix of all genes. In this way, GSEA tool uses expression pattern of not only overlapped genes but also not-overlapped genes to produce ES matrix.
| Rank | GENE | SYMBOL | DESC | LIST.LOC | S2N | RES | CORE_ENRICHMENT |
|---|---|---|---|---|---|---|---|
| 1 | FIGF | FIGF | FIGF | 42 | 0.93 | 0.034 | YES |
| 2 | CD36 | CD36 | CD36 | 101 | 0.75 | 0.061 | YES |
| 3 | CFD | CFD | CFD | 125 | 0.71 | 0.088 | YES |
| 4 | LEFTY2 | LEFTY2 | LEFTY2 | 173 | 0.64 | 0.11 | YES |
| 5 | SELP | SELP | SELP | 214 | 0.6 | 0.13 | YES |
| 6 | RASGRP2 | RASGRP2 | RASGRP2 | 244 | 0.57 | 0.15 | YES |
| 7 | MMRN1 | MMRN1 | MMRN1 | 256 | 0.56 | 0.17 | YES |
| 8 | TF | TF | TF | 269 | 0.55 | 0.2 | YES |
| 9 | P2RY12 | P2RY12 | P2RY12 | 401 | 0.47 | 0.21 | YES |
| 10 | RAPGEF3 | RAPGEF3 | RAPGEF3 | 500 | 0.43 | 0.22 | YES |
| 11 | F2RL2 | F2RL2 | F2RL2 | 649 | 0.39 | 0.22 | YES |
| 12 | LAT | LAT | LAT | 721 | 0.37 | 0.24 | YES |
| 13 | PIK3R6 | PIK3R6 | PIK3R6 | 744 | 0.37 | 0.25 | YES |
| 14 | PRKCB | PRKCB | PRKCB | 776 | 0.36 | 0.26 | YES |
| 15 | ADRA2A | ADRA2A | ADRA2A | 838 | 0.35 | 0.27 | YES |
| 16 | GNG11 | GNG11 | GNG11 | 856 | 0.35 | 0.28 | YES |
| 17 | HGF | HGF | HGF | 867 | 0.34 | 0.3 | YES |
| 18 | LCK | LCK | LCK | 917 | 0.34 | 0.31 | YES |
| 19 | GNA14 | GNA14 | GNA14 | 1060 | 0.32 | 0.31 | YES |
| 20 | VWF | VWF | VWF | 1125 | 0.31 | 0.32 | YES |
| 21 | APBB1IP | APBB1IP | APBB1IP | 1137 | 0.3 | 0.33 | YES |
| 22 | GP5 | GP5 | GP5 | 1138 | 0.3 | 0.34 | YES |
| 23 | GNG2 | GNG2 | GNG2 | 1177 | 0.3 | 0.35 | YES |
| 24 | F2RL3 | F2RL3 | F2RL3 | 1210 | 0.3 | 0.36 | YES |
| 25 | GNAI1 | GNAI1 | GNAI1 | 1283 | 0.29 | 0.37 | YES |
| 26 | TRPC3 | TRPC3 | TRPC3 | 1315 | 0.28 | 0.38 | YES |
| 27 | MGLL | MGLL | MGLL | 1333 | 0.28 | 0.39 | YES |
| 28 | GP1BA | GP1BA | GP1BA | 1349 | 0.28 | 0.4 | YES |
| 29 | PIK3R5 | PIK3R5 | PIK3R5 | 1417 | 0.27 | 0.41 | YES |
| 30 | PECAM1 | PECAM1 | PECAM1 | 1436 | 0.27 | 0.42 | YES |
| 31 | PRKCQ | PRKCQ | PRKCQ | 1478 | 0.26 | 0.42 | YES |
| 32 | PROS1 | PROS1 | PROS1 | 1508 | 0.26 | 0.43 | YES |
| 33 | SERPINE1 | SERPINE1 | SERPINE1 | 1601 | 0.25 | 0.44 | YES |
| 34 | VAV1 | VAV1 | VAV1 | 1644 | 0.25 | 0.45 | YES |
| 35 | SERPINF2 | SERPINF2 | SERPINF2 | 1711 | 0.24 | 0.45 | YES |
| 36 | TBXA2R | TBXA2R | TBXA2R | 1789 | 0.24 | 0.46 | YES |
| 37 | ADRA2B | ADRA2B | ADRA2B | 1833 | 0.23 | 0.46 | YES |
| 38 | F13A1 | F13A1 | F13A1 | 1916 | 0.23 | 0.47 | YES |
| 39 | GNGT2 | GNGT2 | GNGT2 | 1949 | 0.22 | 0.48 | YES |
| 40 | PLA2G4A | PLA2G4A | PLA2G4A | 1985 | 0.22 | 0.48 | YES |
| 41 | GNB3 | GNB3 | GNB3 | 1988 | 0.22 | 0.49 | YES |
| 42 | TRPC6 | TRPC6 | TRPC6 | 2166 | 0.21 | 0.49 | YES |
| 43 | F2R | F2R | F2R | 2259 | 0.2 | 0.49 | YES |
| 44 | F2 | F2 | F2 | 2298 | 0.2 | 0.5 | YES |
| 45 | VEGFC | VEGFC | VEGFC | 2332 | 0.2 | 0.5 | YES |
| 46 | FYN | FYN | FYN | 2388 | 0.19 | 0.51 | YES |
| 47 | TGFB3 | TGFB3 | TGFB3 | 2420 | 0.19 | 0.51 | YES |
| 48 | DGKB | DGKB | DGKB | 2464 | 0.19 | 0.52 | YES |
| 49 | PIK3CG | PIK3CG | PIK3CG | 2637 | 0.18 | 0.52 | YES |
| 50 | SRGN | SRGN | SRGN | 2658 | 0.18 | 0.52 | YES |
| 51 | PLEK | PLEK | PLEK | 2764 | 0.17 | 0.52 | YES |
| 52 | RAPGEF4 | RAPGEF4 | RAPGEF4 | 2891 | 0.16 | 0.52 | YES |
| 53 | F8 | F8 | F8 | 2963 | 0.16 | 0.53 | YES |
| 54 | LCP2 | LCP2 | LCP2 | 2982 | 0.16 | 0.53 | YES |
| 55 | APOA1 | APOA1 | APOA1 | 3082 | 0.16 | 0.53 | YES |
| 56 | RAC2 | RAC2 | RAC2 | 3108 | 0.16 | 0.54 | YES |
| 57 | PRKCA | PRKCA | PRKCA | 3223 | 0.15 | 0.54 | YES |
| 58 | RHOB | RHOB | RHOB | 3245 | 0.15 | 0.54 | YES |
| 59 | TGFB1 | TGFB1 | TGFB1 | 3281 | 0.15 | 0.55 | YES |
| 60 | DGKA | DGKA | DGKA | 3311 | 0.15 | 0.55 | YES |
| 61 | SERPING1 | SERPING1 | SERPING1 | 3320 | 0.15 | 0.55 | YES |
| 62 | PLCG2 | PLCG2 | PLCG2 | 3365 | 0.14 | 0.56 | YES |
| 63 | HABP4 | HABP4 | HABP4 | 3433 | 0.14 | 0.56 | YES |
| 64 | GNG7 | GNG7 | GNG7 | 3455 | 0.14 | 0.56 | YES |
| 65 | DGKD | DGKD | DGKD | 3670 | 0.13 | 0.56 | YES |
| 66 | ALB | ALB | ALB | 3777 | 0.13 | 0.56 | YES |
| 67 | PRKCH | PRKCH | PRKCH | 3842 | 0.12 | 0.56 | YES |
| 68 | VEGFB | VEGFB | VEGFB | 3847 | 0.12 | 0.56 | YES |
| 69 | DGKI | DGKI | DGKI | 4087 | 0.12 | 0.55 | YES |
| 70 | ARRB1 | ARRB1 | ARRB1 | 4220 | 0.11 | 0.55 | YES |
| 71 | A2M | A2M | A2M | 4227 | 0.11 | 0.56 | YES |
| 72 | COL1A1 | COL1A1 | COL1A1 | 4255 | 0.11 | 0.56 | YES |
| 73 | VAV3 | VAV3 | VAV3 | 4314 | 0.11 | 0.56 | YES |
| 74 | DGKQ | DGKQ | DGKQ | 4316 | 0.11 | 0.56 | YES |
| 75 | AKT3 | AKT3 | AKT3 | 4331 | 0.11 | 0.57 | YES |
| 76 | CLU | CLU | CLU | 4422 | 0.1 | 0.57 | NO |
| 77 | THPO | THPO | THPO | 4614 | 0.098 | 0.56 | NO |
| 78 | COL1A2 | COL1A2 | COL1A2 | 4736 | 0.095 | 0.56 | NO |
| 79 | ITGB3 | ITGB3 | ITGB3 | 4809 | 0.093 | 0.56 | NO |
| 80 | PRKCE | PRKCE | PRKCE | 4825 | 0.092 | 0.56 | NO |
| 81 | P2RY1 | P2RY1 | P2RY1 | 4860 | 0.092 | 0.56 | NO |
| 82 | SPARC | SPARC | SPARC | 4921 | 0.09 | 0.56 | NO |
| 83 | PIK3R1 | PIK3R1 | PIK3R1 | 4989 | 0.088 | 0.56 | NO |
| 84 | GNAI2 | GNAI2 | GNAI2 | 5744 | 0.07 | 0.52 | NO |
| 85 | TIMP1 | TIMP1 | TIMP1 | 5831 | 0.068 | 0.52 | NO |
| 86 | STX4 | STX4 | STX4 | 5838 | 0.067 | 0.52 | NO |
| 87 | ARRB2 | ARRB2 | ARRB2 | 5861 | 0.067 | 0.52 | NO |
| 88 | GNB5 | GNB5 | GNB5 | 6009 | 0.064 | 0.52 | NO |
| 89 | GNG12 | GNG12 | GNG12 | 6169 | 0.06 | 0.51 | NO |
| 90 | DGKG | DGKG | DGKG | 6218 | 0.059 | 0.51 | NO |
| 91 | RHOG | RHOG | RHOG | 6358 | 0.056 | 0.5 | NO |
| 92 | FCER1G | FCER1G | FCER1G | 6488 | 0.053 | 0.5 | NO |
| 93 | GNA11 | GNA11 | GNA11 | 6524 | 0.053 | 0.5 | NO |
| 94 | SYK | SYK | SYK | 6577 | 0.052 | 0.5 | NO |
| 95 | CD63 | CD63 | CD63 | 6650 | 0.05 | 0.5 | NO |
| 96 | CSK | CSK | CSK | 6721 | 0.049 | 0.5 | NO |
| 97 | TLN1 | TLN1 | TLN1 | 6724 | 0.049 | 0.5 | NO |
| 98 | F5 | F5 | F5 | 6731 | 0.049 | 0.5 | NO |
| 99 | PDGFB | PDGFB | PDGFB | 6807 | 0.048 | 0.5 | NO |
| 100 | ITPR2 | ITPR2 | ITPR2 | 6817 | 0.047 | 0.5 | NO |
| 101 | RAP1A | RAP1A | RAP1A | 6899 | 0.046 | 0.5 | NO |
| 102 | AKT2 | AKT2 | AKT2 | 7031 | 0.043 | 0.49 | NO |
| 103 | LYN | LYN | LYN | 7046 | 0.043 | 0.49 | NO |
| 104 | TGFB2 | TGFB2 | TGFB2 | 7084 | 0.042 | 0.49 | NO |
| 105 | DAGLB | DAGLB | DAGLB | 7122 | 0.042 | 0.49 | NO |
| 106 | EGF | EGF | EGF | 7123 | 0.042 | 0.49 | NO |
| 107 | DAGLA | DAGLA | DAGLA | 7125 | 0.042 | 0.49 | NO |
| 108 | FGA | FGA | FGA | 7151 | 0.042 | 0.49 | NO |
| 109 | GNG10 | GNG10 | GNG10 | 7254 | 0.039 | 0.49 | NO |
| 110 | MAPK3 | MAPK3 | MAPK3 | 7546 | 0.035 | 0.47 | NO |
| 111 | THBS1 | THBS1 | THBS1 | 7725 | 0.032 | 0.47 | NO |
| 112 | GNA15 | GNA15 | GNA15 | 7928 | 0.029 | 0.46 | NO |
| 113 | BCAR1 | BCAR1 | BCAR1 | 7934 | 0.029 | 0.46 | NO |
| 114 | PSAP | PSAP | PSAP | 8145 | 0.026 | 0.45 | NO |
| 115 | RAP1B | RAP1B | RAP1B | 8258 | 0.024 | 0.44 | NO |
| 116 | AKT1 | AKT1 | AKT1 | 8539 | 0.021 | 0.43 | NO |
| 117 | CALM3 | CALM3 | CALM3 | 8542 | 0.021 | 0.43 | NO |
| 118 | GNA12 | GNA12 | GNA12 | 8650 | 0.019 | 0.42 | NO |
| 119 | SHC1 | SHC1 | SHC1 | 8717 | 0.018 | 0.42 | NO |
| 120 | MPL | MPL | MPL | 8798 | 0.017 | 0.42 | NO |
| 121 | RHOA | RHOA | RHOA | 8904 | 0.016 | 0.41 | NO |
| 122 | PRKCD | PRKCD | PRKCD | 9308 | 0.011 | 0.39 | NO |
| 123 | PDPK1 | PDPK1 | PDPK1 | 9426 | 0.0092 | 0.38 | NO |
| 124 | GNAQ | GNAQ | GNAQ | 9542 | 0.0078 | 0.38 | NO |
| 125 | PDGFA | PDGFA | PDGFA | 9807 | 0.0043 | 0.36 | NO |
| 126 | WDR1 | WDR1 | WDR1 | 9868 | 0.0034 | 0.36 | NO |
| 127 | ACTN2 | ACTN2 | ACTN2 | 9945 | 0.0023 | 0.35 | NO |
| 128 | ABCC4 | ABCC4 | ABCC4 | 9959 | 0.0022 | 0.35 | NO |
| 129 | PIK3R2 | PIK3R2 | PIK3R2 | 9981 | 0.0021 | 0.35 | NO |
| 130 | GNB2 | GNB2 | GNB2 | 10153 | -0.000068 | 0.34 | NO |
| 131 | SCG3 | SCG3 | SCG3 | 10223 | -0.0008 | 0.34 | NO |
| 132 | VCL | VCL | VCL | 10271 | -0.0014 | 0.34 | NO |
| 133 | CALM1 | CALM1 | CALM1 | 10674 | -0.0059 | 0.32 | NO |
| 134 | PIK3R3 | PIK3R3 | PIK3R3 | 10725 | -0.0066 | 0.31 | NO |
| 135 | ACTN1 | ACTN1 | ACTN1 | 11011 | -0.0096 | 0.3 | NO |
| 136 | CDC42 | CDC42 | CDC42 | 11049 | -0.01 | 0.3 | NO |
| 137 | ACTN4 | ACTN4 | ACTN4 | 11072 | -0.01 | 0.29 | NO |
| 138 | CAP1 | CAP1 | CAP1 | 11106 | -0.011 | 0.29 | NO |
| 139 | DGKE | DGKE | DGKE | 11288 | -0.013 | 0.28 | NO |
| 140 | GNG5 | GNG5 | GNG5 | 11320 | -0.013 | 0.28 | NO |
| 141 | PFN1 | PFN1 | PFN1 | 11456 | -0.014 | 0.28 | NO |
| 142 | MAPK14 | MAPK14 | MAPK14 | 11533 | -0.015 | 0.27 | NO |
| 143 | GNG13 | GNG13 | GNG13 | 11672 | -0.017 | 0.26 | NO |
| 144 | GRB2 | GRB2 | GRB2 | 11676 | -0.017 | 0.26 | NO |
| 145 | RAC1 | RAC1 | RAC1 | 11763 | -0.018 | 0.26 | NO |
| 146 | GNA13 | GNA13 | GNA13 | 11961 | -0.02 | 0.25 | NO |
| 147 | SOS1 | SOS1 | SOS1 | 12156 | -0.022 | 0.24 | NO |
| 148 | STXBP3 | STXBP3 | STXBP3 | 12167 | -0.022 | 0.24 | NO |
| 149 | RAF1 | RAF1 | RAF1 | 12185 | -0.023 | 0.24 | NO |
| 150 | GNGT1 | GNGT1 | GNGT1 | 12664 | -0.028 | 0.22 | NO |
| 151 | CFL1 | CFL1 | CFL1 | 12735 | -0.029 | 0.21 | NO |
| 152 | CD9 | CD9 | CD9 | 12767 | -0.03 | 0.21 | NO |
| 153 | BRPF3 | BRPF3 | BRPF3 | 12982 | -0.032 | 0.2 | NO |
| 154 | CRK | CRK | CRK | 13026 | -0.033 | 0.2 | NO |
| 155 | GNB1 | GNB1 | GNB1 | 13110 | -0.034 | 0.2 | NO |
| 156 | ITGA2B | ITGA2B | ITGA2B | 13262 | -0.036 | 0.19 | NO |
| 157 | GNAI3 | GNAI3 | GNAI3 | 13281 | -0.036 | 0.19 | NO |
| 158 | MAPK1 | MAPK1 | MAPK1 | 13399 | -0.038 | 0.19 | NO |
| 159 | FN1 | FN1 | FN1 | 13507 | -0.039 | 0.18 | NO |
| 160 | APP | APP | APP | 13577 | -0.04 | 0.18 | NO |
| 161 | HSPA5 | HSPA5 | HSPA5 | 13723 | -0.042 | 0.17 | NO |
| 162 | CALM2 | CALM2 | CALM2 | 13769 | -0.043 | 0.17 | NO |
| 163 | PTPN1 | PTPN1 | PTPN1 | 13781 | -0.043 | 0.17 | NO |
| 164 | TUBA4A | TUBA4A | TUBA4A | 13804 | -0.043 | 0.17 | NO |
| 165 | ALDOA | ALDOA | ALDOA | 13928 | -0.045 | 0.17 | NO |
| 166 | PRKCZ | PRKCZ | PRKCZ | 14029 | -0.047 | 0.17 | NO |
| 167 | LAMP2 | LAMP2 | LAMP2 | 14200 | -0.049 | 0.16 | NO |
| 168 | RASGRP1 | RASGRP1 | RASGRP1 | 14293 | -0.051 | 0.16 | NO |
| 169 | PIK3CA | PIK3CA | PIK3CA | 14366 | -0.052 | 0.15 | NO |
| 170 | PRKCG | PRKCG | PRKCG | 14402 | -0.052 | 0.15 | NO |
| 171 | CALU | CALU | CALU | 14689 | -0.057 | 0.14 | NO |
| 172 | GNB4 | GNB4 | GNB4 | 15052 | -0.063 | 0.12 | NO |
| 173 | PIK3CB | PIK3CB | PIK3CB | 15058 | -0.063 | 0.12 | NO |
| 174 | SOD1 | SOD1 | SOD1 | 15281 | -0.068 | 0.12 | NO |
| 175 | ITPR3 | ITPR3 | ITPR3 | 15462 | -0.072 | 0.11 | NO |
| 176 | PPIA | PPIA | PPIA | 15508 | -0.073 | 0.11 | NO |
| 177 | SRC | SRC | SRC | 15973 | -0.085 | 0.086 | NO |
| 178 | PPBP | PPBP | PPBP | 16015 | -0.086 | 0.087 | NO |
| 179 | PTK2 | PTK2 | PTK2 | 16022 | -0.086 | 0.09 | NO |
| 180 | GNG3 | GNG3 | GNG3 | 16050 | -0.087 | 0.092 | NO |
| 181 | SERPINA1 | SERPINA1 | SERPINA1 | 16068 | -0.087 | 0.094 | NO |
| 182 | VEGFA | VEGFA | VEGFA | 16166 | -0.09 | 0.092 | NO |
| 183 | GNG4 | GNG4 | GNG4 | 16203 | -0.091 | 0.094 | NO |
| 184 | FGG | FGG | FGG | 16385 | -0.097 | 0.088 | NO |
| 185 | FGB | FGB | FGB | 16419 | -0.098 | 0.09 | NO |
| 186 | YWHAZ | YWHAZ | YWHAZ | 16590 | -0.11 | 0.084 | NO |
| 187 | DGKH | DGKH | DGKH | 17873 | -0.22 | 0.022 | NO |
Figure S117. Get High-res Image This plot shows mRNAseq_cNMF expression data heatmap (on the left) a RunningEnrichmentScore(RES) plot (on the top right) and a Signal2Noise(S2N) plot (on the bottom right) of genes in the pathway: KEGG GLYCEROPHOSPHOLIPID METABOLISM.

Figure S118. Get High-res Image For the top 5 core enriched genes in the pathway: KEGG GLYCEROPHOSPHOLIPID METABOLISM, this volcano plot shows how much they are up/down-regulated and significant. The significance was calculated by empirical bayesian fit
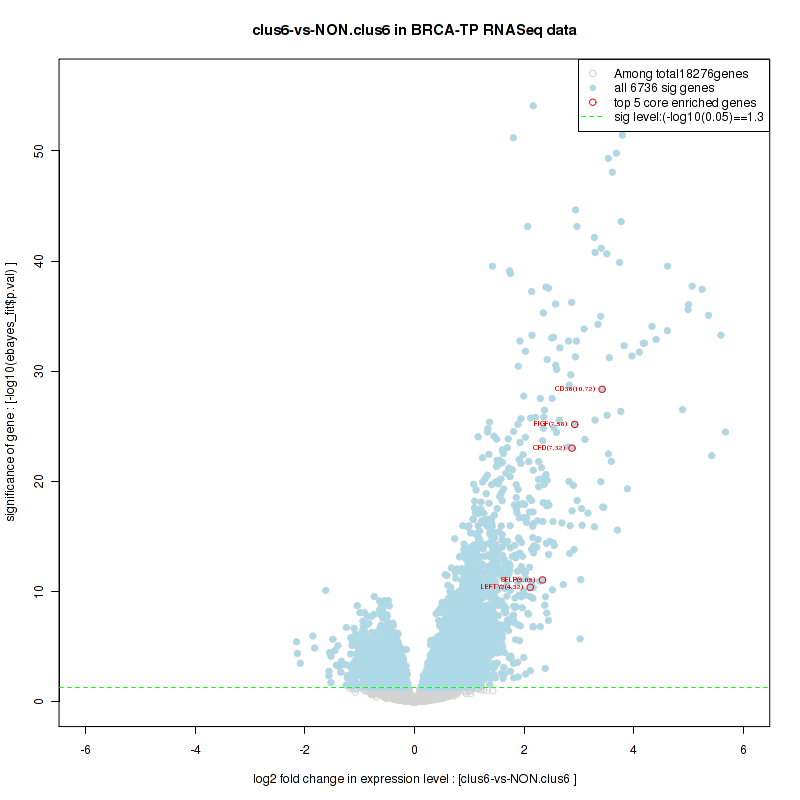
Table S60. Get Full Table This table shows a Running Enrichment Score (RES) of each gene in this pathway, that is, the enrichment score at this point in the ranked list of genes. All genes are ranked by Signal-to-Noise (S2N), a measure of similarity as default and are used to obtain ES matrix of all genes. In this way, GSEA tool uses expression pattern of not only overlapped genes but also not-overlapped genes to produce ES matrix.
| Rank | GENE | SYMBOL | DESC | LIST.LOC | S2N | RES | CORE_ENRICHMENT |
|---|---|---|---|---|---|---|---|
| 1 | ADCY5 | ADCY5 | ADCY5 | 243 | 0.57 | 0.036 | YES |
| 2 | ADCY4 | ADCY4 | ADCY4 | 321 | 0.51 | 0.077 | YES |
| 3 | PDE1B | PDE1B | PDE1B | 340 | 0.51 | 0.12 | YES |
| 4 | PDE1A | PDE1A | PDE1A | 344 | 0.5 | 0.16 | YES |
| 5 | ADCYAP1R1 | ADCYAP1R1 | ADCYAP1R1 | 676 | 0.38 | 0.18 | YES |
| 6 | NTRK1 | NTRK1 | NTRK1 | 829 | 0.35 | 0.2 | YES |
| 7 | NGF | NGF | NGF | 906 | 0.34 | 0.23 | YES |
| 8 | NR4A1 | NR4A1 | NR4A1 | 947 | 0.33 | 0.26 | YES |
| 9 | SHC2 | SHC2 | SHC2 | 1102 | 0.31 | 0.27 | YES |
| 10 | NTRK2 | NTRK2 | NTRK2 | 1237 | 0.29 | 0.29 | YES |
| 11 | ADCYAP1 | ADCYAP1 | ADCYAP1 | 1379 | 0.27 | 0.31 | YES |
| 12 | MAPK11 | MAPK11 | MAPK11 | 1587 | 0.26 | 0.32 | YES |
| 13 | DUSP4 | DUSP4 | DUSP4 | 1884 | 0.23 | 0.32 | YES |
| 14 | CAMK4 | CAMK4 | CAMK4 | 1961 | 0.22 | 0.34 | YES |
| 15 | IRS2 | IRS2 | IRS2 | 1967 | 0.22 | 0.36 | YES |
| 16 | PRKAR2B | PRKAR2B | PRKAR2B | 2211 | 0.2 | 0.36 | YES |
| 17 | FOXO1 | FOXO1 | FOXO1 | 2452 | 0.19 | 0.36 | YES |
| 18 | DNM1 | DNM1 | DNM1 | 2520 | 0.19 | 0.38 | YES |
| 19 | MEF2C | MEF2C | MEF2C | 2543 | 0.18 | 0.39 | YES |
| 20 | ADORA2A | ADORA2A | ADORA2A | 2744 | 0.17 | 0.4 | YES |
| 21 | PRKCA | PRKCA | PRKCA | 3223 | 0.15 | 0.38 | YES |
| 22 | DUSP6 | DUSP6 | DUSP6 | 3232 | 0.15 | 0.4 | YES |
| 23 | RPS6KA2 | RPS6KA2 | RPS6KA2 | 3302 | 0.15 | 0.4 | YES |
| 24 | ADCY1 | ADCY1 | ADCY1 | 3329 | 0.15 | 0.42 | YES |
| 25 | MAPK12 | MAPK12 | MAPK12 | 3731 | 0.13 | 0.41 | NO |
| 26 | IRS1 | IRS1 | IRS1 | 3985 | 0.12 | 0.4 | NO |
| 27 | AKT3 | AKT3 | AKT3 | 4331 | 0.11 | 0.39 | NO |
| 28 | PRKAR1B | PRKAR1B | PRKAR1B | 4395 | 0.1 | 0.4 | NO |
| 29 | ADCY2 | ADCY2 | ADCY2 | 4778 | 0.094 | 0.39 | NO |
| 30 | PRKCE | PRKCE | PRKCE | 4825 | 0.092 | 0.39 | NO |
| 31 | ADCY6 | ADCY6 | ADCY6 | 4877 | 0.091 | 0.4 | NO |
| 32 | RPS6KA3 | RPS6KA3 | RPS6KA3 | 4935 | 0.09 | 0.4 | NO |
| 33 | FOXO4 | FOXO4 | FOXO4 | 4954 | 0.089 | 0.41 | NO |
| 34 | PIK3R1 | PIK3R1 | PIK3R1 | 4989 | 0.088 | 0.41 | NO |
| 35 | ADCY9 | ADCY9 | ADCY9 | 5385 | 0.078 | 0.4 | NO |
| 36 | RAPGEF1 | RAPGEF1 | RAPGEF1 | 5680 | 0.071 | 0.39 | NO |
| 37 | ADCY7 | ADCY7 | ADCY7 | 5894 | 0.066 | 0.38 | NO |
| 38 | PPP2R1B | PPP2R1B | PPP2R1B | 5928 | 0.065 | 0.39 | NO |
| 39 | ADRBK1 | ADRBK1 | ADRBK1 | 6110 | 0.062 | 0.38 | NO |
| 40 | MAPK7 | MAPK7 | MAPK7 | 6119 | 0.061 | 0.39 | NO |
| 41 | MAP2K5 | MAP2K5 | MAP2K5 | 6193 | 0.06 | 0.39 | NO |
| 42 | RALGDS | RALGDS | RALGDS | 6305 | 0.057 | 0.39 | NO |
| 43 | BAD | BAD | BAD | 6535 | 0.052 | 0.38 | NO |
| 44 | CDKN1B | CDKN1B | CDKN1B | 6564 | 0.052 | 0.38 | NO |
| 45 | ADCY3 | ADCY3 | ADCY3 | 6610 | 0.051 | 0.38 | NO |
| 46 | PRKACB | PRKACB | PRKACB | 6648 | 0.05 | 0.39 | NO |
| 47 | PTEN | PTEN | PTEN | 6785 | 0.048 | 0.38 | NO |
| 48 | ITPR2 | ITPR2 | ITPR2 | 6817 | 0.047 | 0.39 | NO |
| 49 | RAP1A | RAP1A | RAP1A | 6899 | 0.046 | 0.38 | NO |
| 50 | AKT2 | AKT2 | AKT2 | 7031 | 0.043 | 0.38 | NO |
| 51 | RALB | RALB | RALB | 7061 | 0.043 | 0.38 | NO |
| 52 | CASP9 | CASP9 | CASP9 | 7300 | 0.039 | 0.37 | NO |
| 53 | CDKN1A | CDKN1A | CDKN1A | 7366 | 0.038 | 0.37 | NO |
| 54 | TSC2 | TSC2 | TSC2 | 7401 | 0.037 | 0.38 | NO |
| 55 | MAPK3 | MAPK3 | MAPK3 | 7546 | 0.035 | 0.37 | NO |
| 56 | DUSP7 | DUSP7 | DUSP7 | 7753 | 0.032 | 0.36 | NO |
| 57 | MAP2K2 | MAP2K2 | MAP2K2 | 7776 | 0.031 | 0.36 | NO |
| 58 | AP2A2 | AP2A2 | AP2A2 | 7789 | 0.031 | 0.36 | NO |
| 59 | PLCG1 | PLCG1 | PLCG1 | 7820 | 0.03 | 0.37 | NO |
| 60 | SHC3 | SHC3 | SHC3 | 7939 | 0.029 | 0.36 | NO |
| 61 | RPS6KA5 | RPS6KA5 | RPS6KA5 | 8320 | 0.024 | 0.34 | NO |
| 62 | MEF2A | MEF2A | MEF2A | 8528 | 0.021 | 0.33 | NO |
| 63 | AKT1 | AKT1 | AKT1 | 8539 | 0.021 | 0.34 | NO |
| 64 | CALM3 | CALM3 | CALM3 | 8542 | 0.021 | 0.34 | NO |
| 65 | THEM4 | THEM4 | THEM4 | 8642 | 0.019 | 0.33 | NO |
| 66 | SHC1 | SHC1 | SHC1 | 8717 | 0.018 | 0.33 | NO |
| 67 | DUSP3 | DUSP3 | DUSP3 | 8762 | 0.018 | 0.33 | NO |
| 68 | AP2A1 | AP2A1 | AP2A1 | 8819 | 0.017 | 0.33 | NO |
| 69 | FOXO3 | FOXO3 | FOXO3 | 8891 | 0.016 | 0.33 | NO |
| 70 | RHOA | RHOA | RHOA | 8904 | 0.016 | 0.33 | NO |
| 71 | PPP2CB | PPP2CB | PPP2CB | 8995 | 0.014 | 0.32 | NO |
| 72 | DNM2 | DNM2 | DNM2 | 9139 | 0.013 | 0.32 | NO |
| 73 | AKT1S1 | AKT1S1 | AKT1S1 | 9191 | 0.012 | 0.31 | NO |
| 74 | PRKCD | PRKCD | PRKCD | 9308 | 0.011 | 0.31 | NO |
| 75 | ATF1 | ATF1 | ATF1 | 9332 | 0.01 | 0.31 | NO |
| 76 | PDPK1 | PDPK1 | PDPK1 | 9426 | 0.0092 | 0.3 | NO |
| 77 | MLST8 | MLST8 | MLST8 | 9755 | 0.0051 | 0.29 | NO |
| 78 | RPS6KB2 | RPS6KB2 | RPS6KB2 | 9870 | 0.0034 | 0.28 | NO |
| 79 | PIK3R2 | PIK3R2 | PIK3R2 | 9981 | 0.0021 | 0.28 | NO |
| 80 | RICTOR | RICTOR | RICTOR | 10067 | 0.0011 | 0.27 | NO |
| 81 | MAPKAPK3 | MAPKAPK3 | MAPKAPK3 | 10148 | 0.000022 | 0.27 | NO |
| 82 | FRS2 | FRS2 | FRS2 | 10440 | -0.0032 | 0.25 | NO |
| 83 | CREB1 | CREB1 | CREB1 | 10607 | -0.005 | 0.24 | NO |
| 84 | PPP2R1A | PPP2R1A | PPP2R1A | 10629 | -0.0053 | 0.24 | NO |
| 85 | CALM1 | CALM1 | CALM1 | 10674 | -0.0059 | 0.24 | NO |
| 86 | MAP2K1 | MAP2K1 | MAP2K1 | 10791 | -0.0072 | 0.23 | NO |
| 87 | RPS6KA1 | RPS6KA1 | RPS6KA1 | 10810 | -0.0073 | 0.23 | NO |
| 88 | PRKACA | PRKACA | PRKACA | 10883 | -0.0081 | 0.23 | NO |
| 89 | MAPKAP1 | MAPKAP1 | MAPKAP1 | 10933 | -0.0086 | 0.23 | NO |
| 90 | MAPKAPK2 | MAPKAPK2 | MAPKAPK2 | 11065 | -0.01 | 0.22 | NO |
| 91 | KRAS | KRAS | KRAS | 11114 | -0.011 | 0.22 | NO |
| 92 | STAT3 | STAT3 | STAT3 | 11374 | -0.014 | 0.21 | NO |
| 93 | PRKAR1A | PRKAR1A | PRKAR1A | 11430 | -0.014 | 0.2 | NO |
| 94 | MAPK14 | MAPK14 | MAPK14 | 11533 | -0.015 | 0.2 | NO |
| 95 | HRAS | HRAS | HRAS | 11537 | -0.015 | 0.2 | NO |
| 96 | AP2S1 | AP2S1 | AP2S1 | 11596 | -0.016 | 0.2 | NO |
| 97 | GRB2 | GRB2 | GRB2 | 11676 | -0.017 | 0.2 | NO |
| 98 | CLTA | CLTA | CLTA | 11679 | -0.017 | 0.2 | NO |
| 99 | AP2M1 | AP2M1 | AP2M1 | 11804 | -0.018 | 0.19 | NO |
| 100 | KIDINS220 | KIDINS220 | KIDINS220 | 11806 | -0.018 | 0.19 | NO |
| 101 | PPP2CA | PPP2CA | PPP2CA | 12131 | -0.022 | 0.18 | NO |
| 102 | SOS1 | SOS1 | SOS1 | 12156 | -0.022 | 0.18 | NO |
| 103 | RIT1 | RIT1 | RIT1 | 12157 | -0.022 | 0.18 | NO |
| 104 | RAF1 | RAF1 | RAF1 | 12185 | -0.023 | 0.18 | NO |
| 105 | YWHAB | YWHAB | YWHAB | 12414 | -0.025 | 0.17 | NO |
| 106 | MDM2 | MDM2 | MDM2 | 12697 | -0.028 | 0.16 | NO |
| 107 | CRK | CRK | CRK | 13026 | -0.033 | 0.14 | NO |
| 108 | NRAS | NRAS | NRAS | 13068 | -0.033 | 0.14 | NO |
| 109 | MAPK13 | MAPK13 | MAPK13 | 13089 | -0.034 | 0.14 | NO |
| 110 | GSK3A | GSK3A | GSK3A | 13140 | -0.034 | 0.14 | NO |
| 111 | DNAL4 | DNAL4 | DNAL4 | 13159 | -0.034 | 0.15 | NO |
| 112 | MAPK1 | MAPK1 | MAPK1 | 13399 | -0.038 | 0.14 | NO |
| 113 | CHUK | CHUK | CHUK | 13509 | -0.039 | 0.14 | NO |
| 114 | RALA | RALA | RALA | 13531 | -0.039 | 0.14 | NO |
| 115 | ELK1 | ELK1 | ELK1 | 13556 | -0.04 | 0.14 | NO |
| 116 | CALM2 | CALM2 | CALM2 | 13769 | -0.043 | 0.13 | NO |
| 117 | AP2B1 | AP2B1 | AP2B1 | 14166 | -0.049 | 0.11 | NO |
| 118 | PIK3CA | PIK3CA | PIK3CA | 14366 | -0.052 | 0.11 | NO |
| 119 | PRKCG | PRKCG | PRKCG | 14402 | -0.052 | 0.11 | NO |
| 120 | CLTC | CLTC | CLTC | 14642 | -0.056 | 0.1 | NO |
| 121 | PIK3CB | PIK3CB | PIK3CB | 15058 | -0.063 | 0.085 | NO |
| 122 | MTOR | MTOR | MTOR | 15061 | -0.063 | 0.09 | NO |
| 123 | PPP2R5D | PPP2R5D | PPP2R5D | 15110 | -0.064 | 0.093 | NO |
| 124 | ADCY8 | ADCY8 | ADCY8 | 15456 | -0.072 | 0.08 | NO |
| 125 | ITPR3 | ITPR3 | ITPR3 | 15462 | -0.072 | 0.086 | NO |
| 126 | PRKAR2A | PRKAR2A | PRKAR2A | 15878 | -0.082 | 0.071 | NO |
| 127 | SRC | SRC | SRC | 15973 | -0.085 | 0.073 | NO |
| 128 | PHLPP1 | PHLPP1 | PHLPP1 | 16446 | -0.099 | 0.056 | NO |
| 129 | TRIB3 | TRIB3 | TRIB3 | 16546 | -0.1 | 0.059 | NO |
| 130 | SH3GL2 | SH3GL2 | SH3GL2 | 16676 | -0.11 | 0.062 | NO |
| 131 | BRAF | BRAF | BRAF | 16924 | -0.12 | 0.059 | NO |
| 132 | CDK1 | CDK1 | CDK1 | 17603 | -0.18 | 0.037 | NO |
Figure S119. Get High-res Image This plot shows mRNAseq_cNMF expression data heatmap (on the left) a RunningEnrichmentScore(RES) plot (on the top right) and a Signal2Noise(S2N) plot (on the bottom right) of genes in the pathway: KEGG ETHER LIPID METABOLISM.
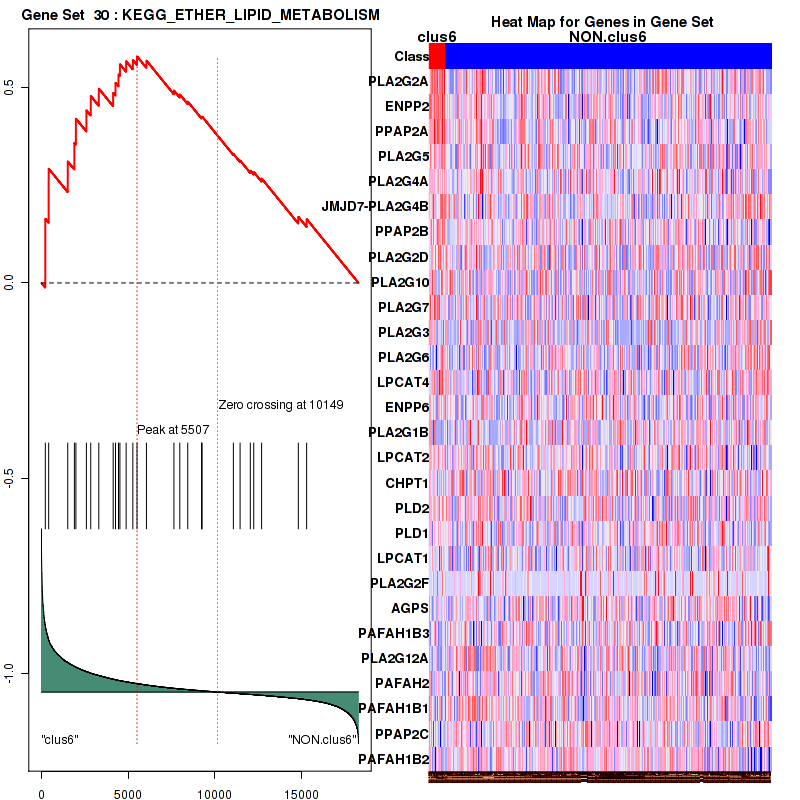
Figure S120. Get High-res Image For the top 5 core enriched genes in the pathway: KEGG ETHER LIPID METABOLISM, this volcano plot shows how much they are up/down-regulated and significant. The significance was calculated by empirical bayesian fit
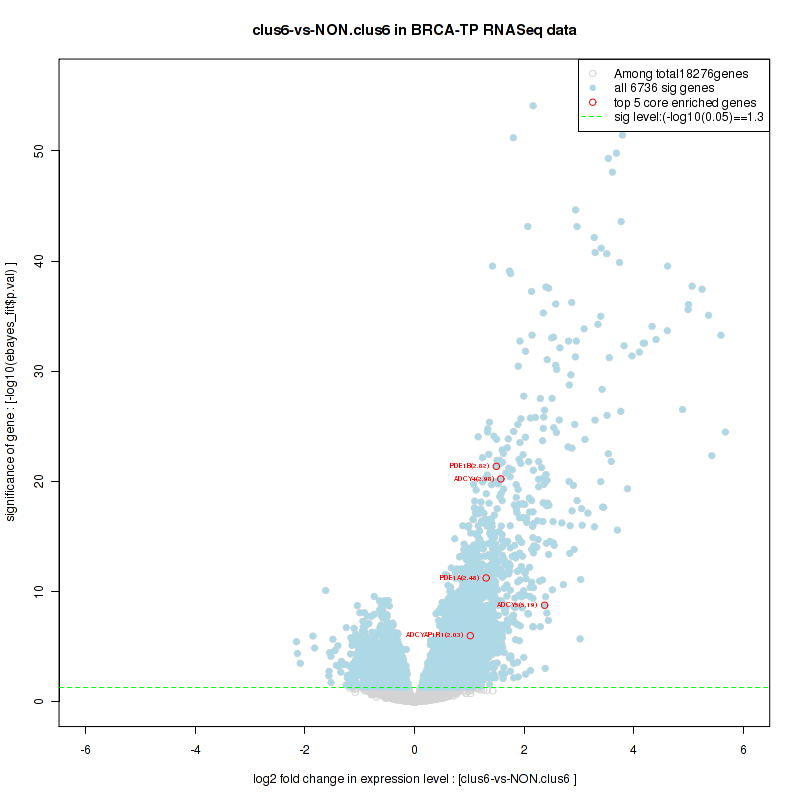
For the top enriched genes, if you want to check whether they are
-
up-regulated, please check the list of up-regulated genes
-
down-regulated, please check the list of down-regulated genes
For the top enriched genes, if you want to check whether they are
-
highly expressed genes, please check the list of high (top 30%) expressed genes
-
low expressed genes, please check the list of low (bottom 30%) expressed genes
An expression pattern of top(30%)/middle(30%)/low(30%) in this subtype against other subtypes is available in a heatmap
For the top enriched genes, if you want to check whether they are
-
significantly differently expressed genes by eBayes lm fit, please check the list of significant genes
Table 9. Get Full Table This table shows top 10 pathways which are significantly enriched in cluster clus7. It displays only significant gene sets satisfying nom.p.val.threshold (-1), fwer.p.val.threshold (-1) , fdr.q.val.threshold (0.25) and the default table is sorted by Normalized Enrichment Score (NES). Further details on NES statistics, please visit The Broad GSEA website.
| GeneSet(GS) | Size(#genes) | genes.ES.table | ES | NES | NOM.p.val | FDR.q.val | FWER.p.val | Tag.. | Gene.. | Signal | FDR..median. | glob.p.val |
|---|---|---|---|---|---|---|---|---|---|---|---|---|
| KEGG TRYPTOPHAN METABOLISM | 38 | genes.ES.table | 0.62 | 1.7 | 0 | 0.054 | 0.73 | 0.4 | 0.14 | 0.34 | 0.02 | 0 |
| KEGG AMINO SUGAR AND NUCLEOTIDE SUGAR METABOLISM | 43 | genes.ES.table | 0.41 | 1.5 | 0.069 | 0.14 | 0.97 | 0.093 | 0.064 | 0.087 | 0.085 | 0.001 |
| KEGG INOSITOL PHOSPHATE METABOLISM | 53 | genes.ES.table | 0.39 | 1.5 | 0.06 | 0.18 | 0.99 | 0.17 | 0.14 | 0.15 | 0.12 | 0.002 |
| KEGG ETHER LIPID METABOLISM | 28 | genes.ES.table | 0.51 | 1.4 | 0.047 | 0.2 | 0.99 | 0.11 | 0.054 | 0.1 | 0.14 | 0.003 |
| KEGG RIBOSOME | 84 | genes.ES.table | 0.6 | 1.6 | 0.085 | 0.11 | 0.94 | 0.86 | 0.35 | 0.56 | 0.058 | 0.001 |
| KEGG PROTEASOME | 43 | genes.ES.table | 0.65 | 1.9 | 0.0041 | 0.022 | 0.35 | 0.16 | 0.12 | 0.14 | 0 | 0 |
| KEGG CYTOKINE CYTOKINE RECEPTOR INTERACTION | 238 | genes.ES.table | 0.74 | 1.8 | 0 | 0.04 | 0.6 | 0.54 | 0.12 | 0.48 | 0.013 | 0 |
| KEGG CHEMOKINE SIGNALING PATHWAY | 183 | genes.ES.table | 0.72 | 2 | 0 | 0.011 | 0.15 | 0.44 | 0.13 | 0.39 | 0 | 0 |
| KEGG PHOSPHATIDYLINOSITOL SIGNALING SYSTEM | 75 | genes.ES.table | 0.44 | 1.6 | 0.016 | 0.12 | 0.95 | 0.17 | 0.11 | 0.15 | 0.068 | 0.001 |
| KEGG UBIQUITIN MEDIATED PROTEOLYSIS | 133 | genes.ES.table | 0.24 | 1.5 | 0.077 | 0.19 | 0.99 | 0.25 | 0.31 | 0.17 | 0.13 | 0.002 |
Table S61. Get Full Table This table shows a Running Enrichment Score (RES) of each gene in this pathway, that is, the enrichment score at this point in the ranked list of genes. All genes are ranked by Signal-to-Noise (S2N), a measure of similarity as default and are used to obtain ES matrix of all genes. In this way, GSEA tool uses expression pattern of not only overlapped genes but also not-overlapped genes to produce ES matrix.
| Rank | GENE | SYMBOL | DESC | LIST.LOC | S2N | RES | CORE_ENRICHMENT |
|---|---|---|---|---|---|---|---|
| 1 | CD247 | CD247 | CD247 | 95 | 0.86 | 0.074 | YES |
| 2 | CD28 | CD28 | CD28 | 129 | 0.82 | 0.15 | YES |
| 3 | CD8B | CD8B | CD8B | 130 | 0.82 | 0.22 | YES |
| 4 | LCK | LCK | LCK | 159 | 0.8 | 0.3 | YES |
| 5 | APOBEC3G | APOBEC3G | APOBEC3G | 452 | 0.56 | 0.33 | YES |
| 6 | DOCK2 | DOCK2 | DOCK2 | 477 | 0.53 | 0.38 | YES |
| 7 | PSMB9 | PSMB9 | PSMB9 | 652 | 0.45 | 0.41 | YES |
| 8 | PSMA8 | PSMA8 | PSMA8 | 713 | 0.42 | 0.45 | YES |
| 9 | CD4 | CD4 | CD4 | 850 | 0.37 | 0.48 | YES |
| 10 | HCK | HCK | HCK | 950 | 0.34 | 0.5 | YES |
| 11 | ELMO1 | ELMO1 | ELMO1 | 976 | 0.34 | 0.53 | YES |
| 12 | FYN | FYN | FYN | 1084 | 0.31 | 0.55 | YES |
| 13 | PSMB8 | PSMB8 | PSMB8 | 1276 | 0.27 | 0.57 | YES |
| 14 | AP1S2 | AP1S2 | AP1S2 | 1559 | 0.22 | 0.57 | YES |
| 15 | HLA-A | HLA-A | HLA-A | 1573 | 0.22 | 0.59 | YES |
| 16 | PSMB10 | PSMB10 | PSMB10 | 1580 | 0.22 | 0.61 | YES |
| 17 | B2M | B2M | B2M | 1616 | 0.21 | 0.63 | YES |
| 18 | PSME2 | PSME2 | PSME2 | 1644 | 0.21 | 0.65 | YES |
| 19 | PSME1 | PSME1 | PSME1 | 2162 | 0.15 | 0.64 | NO |
| 20 | NUP93 | NUP93 | NUP93 | 3658 | 0.078 | 0.56 | NO |
| 21 | PSMA5 | PSMA5 | PSMA5 | 3693 | 0.077 | 0.56 | NO |
| 22 | SLC25A6 | SLC25A6 | SLC25A6 | 3841 | 0.072 | 0.56 | NO |
| 23 | AP1M1 | AP1M1 | AP1M1 | 3929 | 0.07 | 0.56 | NO |
| 24 | NUP62 | NUP62 | NUP62 | 3942 | 0.069 | 0.57 | NO |
| 25 | NUP210 | NUP210 | NUP210 | 4140 | 0.064 | 0.57 | NO |
| 26 | HMGA1 | HMGA1 | HMGA1 | 4225 | 0.063 | 0.57 | NO |
| 27 | NUP54 | NUP54 | NUP54 | 4550 | 0.056 | 0.55 | NO |
| 28 | PSMA6 | PSMA6 | PSMA6 | 4648 | 0.054 | 0.55 | NO |
| 29 | TCEB1 | TCEB1 | TCEB1 | 4653 | 0.054 | 0.56 | NO |
| 30 | SLC25A5 | SLC25A5 | SLC25A5 | 4659 | 0.054 | 0.56 | NO |
| 31 | UBA52 | UBA52 | UBA52 | 5070 | 0.046 | 0.55 | NO |
| 32 | AP1B1 | AP1B1 | AP1B1 | 5078 | 0.046 | 0.55 | NO |
| 33 | PSIP1 | PSIP1 | PSIP1 | 5085 | 0.046 | 0.55 | NO |
| 34 | PSMA2 | PSMA2 | PSMA2 | 5176 | 0.044 | 0.55 | NO |
| 35 | NUPL2 | NUPL2 | NUPL2 | 5344 | 0.041 | 0.55 | NO |
| 36 | RPS27A | RPS27A | RPS27A | 5423 | 0.04 | 0.55 | NO |
| 37 | PSMF1 | PSMF1 | PSMF1 | 5516 | 0.038 | 0.55 | NO |
| 38 | AP2A1 | AP2A1 | AP2A1 | 5517 | 0.038 | 0.55 | NO |
| 39 | KPNB1 | KPNB1 | KPNB1 | 5631 | 0.037 | 0.55 | NO |
| 40 | PSMA4 | PSMA4 | PSMA4 | 5696 | 0.036 | 0.55 | NO |
| 41 | ATP6V1H | ATP6V1H | ATP6V1H | 6002 | 0.032 | 0.53 | NO |
| 42 | PSMA3 | PSMA3 | PSMA3 | 6017 | 0.031 | 0.53 | NO |
| 43 | NUP153 | NUP153 | NUP153 | 6113 | 0.03 | 0.53 | NO |
| 44 | PSMD13 | PSMD13 | PSMD13 | 6142 | 0.03 | 0.53 | NO |
| 45 | PSMB1 | PSMB1 | PSMB1 | 6196 | 0.029 | 0.53 | NO |
| 46 | RAN | RAN | RAN | 6348 | 0.027 | 0.53 | NO |
| 47 | PSMB2 | PSMB2 | PSMB2 | 6363 | 0.027 | 0.53 | NO |
| 48 | RCC1 | RCC1 | RCC1 | 6576 | 0.024 | 0.52 | NO |
| 49 | PSMD1 | PSMD1 | PSMD1 | 6600 | 0.024 | 0.52 | NO |
| 50 | NUP85 | NUP85 | NUP85 | 6601 | 0.024 | 0.52 | NO |
| 51 | AP2S1 | AP2S1 | AP2S1 | 6639 | 0.024 | 0.52 | NO |
| 52 | NUP43 | NUP43 | NUP43 | 6779 | 0.022 | 0.52 | NO |
| 53 | KPNA1 | KPNA1 | KPNA1 | 6834 | 0.021 | 0.52 | NO |
| 54 | PSMC4 | PSMC4 | PSMC4 | 6856 | 0.021 | 0.52 | NO |
| 55 | AAAS | AAAS | AAAS | 6925 | 0.02 | 0.51 | NO |
| 56 | PSMD11 | PSMD11 | PSMD11 | 6929 | 0.02 | 0.52 | NO |
| 57 | RANBP1 | RANBP1 | RANBP1 | 7080 | 0.018 | 0.51 | NO |
| 58 | PAK2 | PAK2 | PAK2 | 7128 | 0.018 | 0.51 | NO |
| 59 | NPM1 | NPM1 | NPM1 | 7172 | 0.018 | 0.51 | NO |
| 60 | PSMD14 | PSMD14 | PSMD14 | 7175 | 0.018 | 0.51 | NO |
| 61 | NUP35 | NUP35 | NUP35 | 7178 | 0.018 | 0.51 | NO |
| 62 | CDK9 | CDK9 | CDK9 | 7179 | 0.018 | 0.51 | NO |
| 63 | PSMD7 | PSMD7 | PSMD7 | 7190 | 0.017 | 0.51 | NO |
| 64 | PSMB6 | PSMB6 | PSMB6 | 7589 | 0.013 | 0.49 | NO |
| 65 | NUP188 | NUP188 | NUP188 | 7687 | 0.012 | 0.49 | NO |
| 66 | NUP88 | NUP88 | NUP88 | 7717 | 0.011 | 0.49 | NO |
| 67 | PSMD2 | PSMD2 | PSMD2 | 7871 | 0.0098 | 0.48 | NO |
| 68 | RANGAP1 | RANGAP1 | RANGAP1 | 7894 | 0.0096 | 0.48 | NO |
| 69 | NUP107 | NUP107 | NUP107 | 7908 | 0.0094 | 0.48 | NO |
| 70 | PSMC5 | PSMC5 | PSMC5 | 7970 | 0.0088 | 0.48 | NO |
| 71 | PSMD12 | PSMD12 | PSMD12 | 7986 | 0.0087 | 0.48 | NO |
| 72 | NUP37 | NUP37 | NUP37 | 8005 | 0.0085 | 0.48 | NO |
| 73 | PSMA1 | PSMA1 | PSMA1 | 8113 | 0.0073 | 0.47 | NO |
| 74 | PSMD6 | PSMD6 | PSMD6 | 8119 | 0.0072 | 0.47 | NO |
| 75 | NUP155 | NUP155 | NUP155 | 8137 | 0.007 | 0.47 | NO |
| 76 | PSMD10 | PSMD10 | PSMD10 | 8153 | 0.0069 | 0.47 | NO |
| 77 | RBX1 | RBX1 | RBX1 | 8163 | 0.0068 | 0.47 | NO |
| 78 | PSMB7 | PSMB7 | PSMB7 | 8251 | 0.0059 | 0.47 | NO |
| 79 | RAE1 | RAE1 | RAE1 | 8297 | 0.0055 | 0.47 | NO |
| 80 | NUP50 | NUP50 | NUP50 | 8415 | 0.0042 | 0.46 | NO |
| 81 | PSMA7 | PSMA7 | PSMA7 | 8557 | 0.0027 | 0.45 | NO |
| 82 | PSMD8 | PSMD8 | PSMD8 | 8638 | 0.0016 | 0.45 | NO |
| 83 | PPIA | PPIA | PPIA | 8651 | 0.0015 | 0.45 | NO |
| 84 | POM121 | POM121 | POM121 | 8658 | 0.0014 | 0.45 | NO |
| 85 | PSMC3 | PSMC3 | PSMC3 | 8679 | 0.0012 | 0.45 | NO |
| 86 | PSME4 | PSME4 | PSME4 | 8840 | -0.00024 | 0.44 | NO |
| 87 | PSMD9 | PSMD9 | PSMD9 | 8841 | -0.00024 | 0.44 | NO |
| 88 | PSMB5 | PSMB5 | PSMB5 | 8900 | -0.00083 | 0.43 | NO |
| 89 | BTRC | BTRC | BTRC | 8924 | -0.001 | 0.43 | NO |
| 90 | NUP214 | NUP214 | NUP214 | 9409 | -0.0059 | 0.41 | NO |
| 91 | XPO1 | XPO1 | XPO1 | 9416 | -0.006 | 0.41 | NO |
| 92 | AP2A2 | AP2A2 | AP2A2 | 9436 | -0.0062 | 0.41 | NO |
| 93 | PACS1 | PACS1 | PACS1 | 9622 | -0.0082 | 0.4 | NO |
| 94 | NUP205 | NUP205 | NUP205 | 9626 | -0.0082 | 0.4 | NO |
| 95 | TPR | TPR | TPR | 9700 | -0.009 | 0.4 | NO |
| 96 | RANBP2 | RANBP2 | RANBP2 | 9850 | -0.01 | 0.39 | NO |
| 97 | BANF1 | BANF1 | BANF1 | 9876 | -0.01 | 0.39 | NO |
| 98 | AP2M1 | AP2M1 | AP2M1 | 10000 | -0.012 | 0.38 | NO |
| 99 | NUP133 | NUP133 | NUP133 | 10062 | -0.013 | 0.38 | NO |
| 100 | PSMB3 | PSMB3 | PSMB3 | 10223 | -0.014 | 0.37 | NO |
| 101 | PSMC2 | PSMC2 | PSMC2 | 10488 | -0.017 | 0.36 | NO |
| 102 | PSMB4 | PSMB4 | PSMB4 | 10694 | -0.019 | 0.35 | NO |
| 103 | RAC1 | RAC1 | RAC1 | 11074 | -0.024 | 0.33 | NO |
| 104 | PSMD4 | PSMD4 | PSMD4 | 11111 | -0.024 | 0.33 | NO |
| 105 | SKP1 | SKP1 | SKP1 | 11147 | -0.024 | 0.33 | NO |
| 106 | CUL5 | CUL5 | CUL5 | 11162 | -0.024 | 0.33 | NO |
| 107 | ARF1 | ARF1 | ARF1 | 11184 | -0.025 | 0.33 | NO |
| 108 | PSMD5 | PSMD5 | PSMD5 | 11318 | -0.026 | 0.33 | NO |
| 109 | TCEB2 | TCEB2 | TCEB2 | 11325 | -0.026 | 0.33 | NO |
| 110 | AP1G1 | AP1G1 | AP1G1 | 11477 | -0.028 | 0.33 | NO |
| 111 | AP2B1 | AP2B1 | AP2B1 | 12045 | -0.035 | 0.3 | NO |
| 112 | PSMC1 | PSMC1 | PSMC1 | 12144 | -0.036 | 0.3 | NO |
| 113 | PSMD3 | PSMD3 | PSMD3 | 12250 | -0.038 | 0.29 | NO |
| 114 | PSMC6 | PSMC6 | PSMC6 | 12403 | -0.04 | 0.29 | NO |
| 115 | SLC25A4 | SLC25A4 | SLC25A4 | 12754 | -0.046 | 0.27 | NO |
| 116 | CCNT1 | CCNT1 | CCNT1 | 12953 | -0.049 | 0.27 | NO |
| 117 | SEH1L | SEH1L | SEH1L | 12977 | -0.049 | 0.27 | NO |
| 118 | AP1M2 | AP1M2 | AP1M2 | 13282 | -0.054 | 0.26 | NO |
| 119 | NUPL1 | NUPL1 | NUPL1 | 14404 | -0.077 | 0.2 | NO |
| 120 | AP1S1 | AP1S1 | AP1S1 | 15148 | -0.099 | 0.17 | NO |
Figure S121. Get High-res Image This plot shows mRNAseq_cNMF expression data heatmap (on the left) a RunningEnrichmentScore(RES) plot (on the top right) and a Signal2Noise(S2N) plot (on the bottom right) of genes in the pathway: KEGG TRYPTOPHAN METABOLISM.
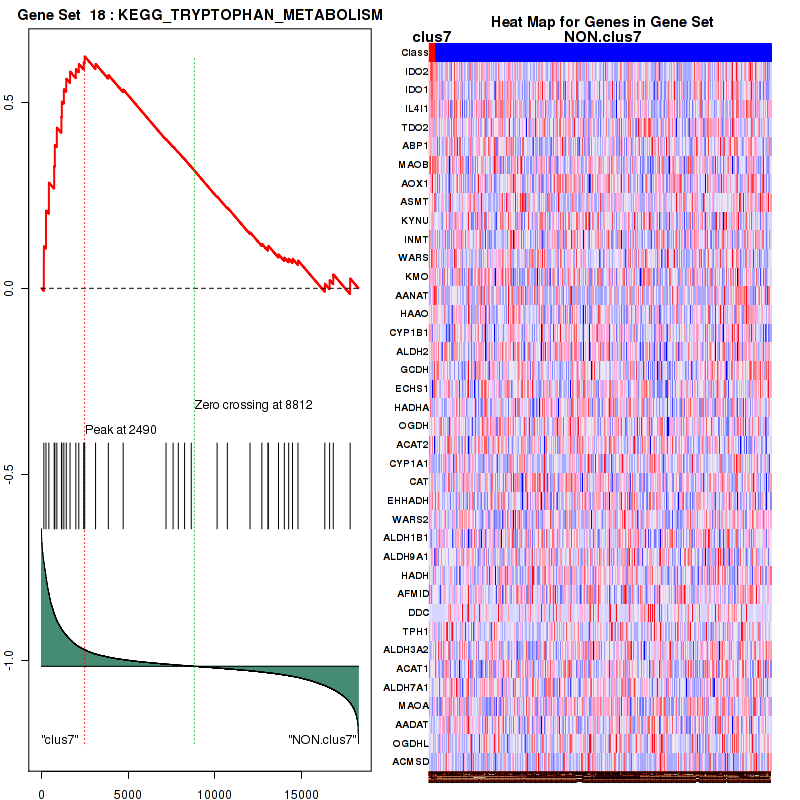
Figure S122. Get High-res Image For the top 5 core enriched genes in the pathway: KEGG TRYPTOPHAN METABOLISM, this volcano plot shows how much they are up/down-regulated and significant. The significance was calculated by empirical bayesian fit
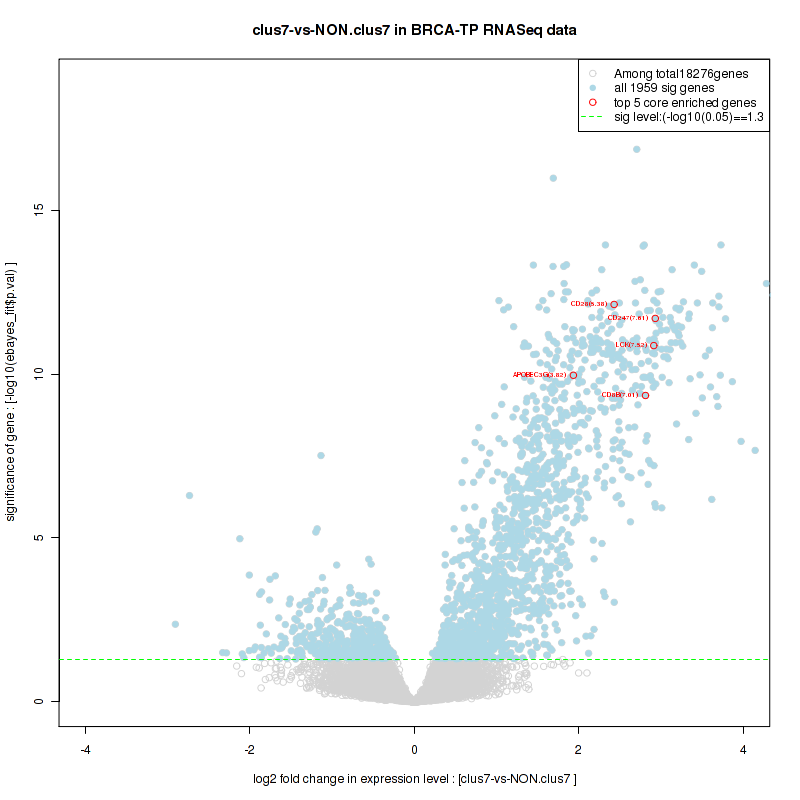
Table S62. Get Full Table This table shows a Running Enrichment Score (RES) of each gene in this pathway, that is, the enrichment score at this point in the ranked list of genes. All genes are ranked by Signal-to-Noise (S2N), a measure of similarity as default and are used to obtain ES matrix of all genes. In this way, GSEA tool uses expression pattern of not only overlapped genes but also not-overlapped genes to produce ES matrix.
| Rank | GENE | SYMBOL | DESC | LIST.LOC | S2N | RES | CORE_ENRICHMENT |
|---|---|---|---|---|---|---|---|
| 1 | CD19 | CD19 | CD19 | 8 | 1 | 0.069 | YES |
| 2 | BLK | BLK | BLK | 62 | 0.9 | 0.13 | YES |
| 3 | CD79A | CD79A | CD79A | 85 | 0.87 | 0.19 | YES |
| 4 | PRKCB | PRKCB | PRKCB | 114 | 0.84 | 0.24 | YES |
| 5 | CD79B | CD79B | CD79B | 148 | 0.81 | 0.3 | YES |
| 6 | CARD11 | CARD11 | CARD11 | 234 | 0.73 | 0.34 | YES |
| 7 | BTK | BTK | BTK | 475 | 0.53 | 0.37 | YES |
| 8 | VAV1 | VAV1 | VAV1 | 507 | 0.52 | 0.4 | YES |
| 9 | PIK3CD | PIK3CD | PIK3CD | 635 | 0.46 | 0.42 | YES |
| 10 | PSMB9 | PSMB9 | PSMB9 | 652 | 0.45 | 0.46 | YES |
| 11 | PSMA8 | PSMA8 | PSMA8 | 713 | 0.42 | 0.48 | YES |
| 12 | PIK3AP1 | PIK3AP1 | PIK3AP1 | 827 | 0.38 | 0.5 | YES |
| 13 | PLCG2 | PLCG2 | PLCG2 | 966 | 0.34 | 0.52 | YES |
| 14 | FYN | FYN | FYN | 1084 | 0.31 | 0.53 | YES |
| 15 | PSMB8 | PSMB8 | PSMB8 | 1276 | 0.27 | 0.54 | YES |
| 16 | SYK | SYK | SYK | 1283 | 0.27 | 0.56 | YES |
| 17 | RASGRP1 | RASGRP1 | RASGRP1 | 1321 | 0.26 | 0.57 | YES |
| 18 | BLNK | BLNK | BLNK | 1327 | 0.26 | 0.59 | YES |
| 19 | LYN | LYN | LYN | 1413 | 0.24 | 0.6 | YES |
| 20 | PSMB10 | PSMB10 | PSMB10 | 1580 | 0.22 | 0.61 | YES |
| 21 | RASGRP3 | RASGRP3 | RASGRP3 | 1615 | 0.22 | 0.62 | YES |
| 22 | PSME2 | PSME2 | PSME2 | 1644 | 0.21 | 0.64 | YES |
| 23 | FOXO1 | FOXO1 | FOXO1 | 1796 | 0.19 | 0.64 | YES |
| 24 | SH3KBP1 | SH3KBP1 | SH3KBP1 | 1958 | 0.17 | 0.64 | YES |
| 25 | NFKBIE | NFKBIE | NFKBIE | 2014 | 0.17 | 0.65 | YES |
| 26 | PSME1 | PSME1 | PSME1 | 2162 | 0.15 | 0.65 | YES |
| 27 | GRB2 | GRB2 | GRB2 | 2705 | 0.12 | 0.63 | NO |
| 28 | MALT1 | MALT1 | MALT1 | 2846 | 0.11 | 0.63 | NO |
| 29 | PLCG1 | PLCG1 | PLCG1 | 3008 | 0.1 | 0.63 | NO |
| 30 | FOXO4 | FOXO4 | FOXO4 | 3063 | 0.098 | 0.63 | NO |
| 31 | NFKBIA | NFKBIA | NFKBIA | 3283 | 0.09 | 0.63 | NO |
| 32 | CHUK | CHUK | CHUK | 3492 | 0.083 | 0.62 | NO |
| 33 | NFKBIB | NFKBIB | NFKBIB | 3513 | 0.083 | 0.63 | NO |
| 34 | RPS6KB2 | RPS6KB2 | RPS6KB2 | 3634 | 0.079 | 0.62 | NO |
| 35 | ORAI1 | ORAI1 | ORAI1 | 3678 | 0.078 | 0.63 | NO |
| 36 | PSMA5 | PSMA5 | PSMA5 | 3693 | 0.077 | 0.63 | NO |
| 37 | FOXO3 | FOXO3 | FOXO3 | 4265 | 0.062 | 0.6 | NO |
| 38 | NCK1 | NCK1 | NCK1 | 4391 | 0.059 | 0.6 | NO |
| 39 | CBLB | CBLB | CBLB | 4456 | 0.057 | 0.6 | NO |
| 40 | PSMA6 | PSMA6 | PSMA6 | 4648 | 0.054 | 0.6 | NO |
| 41 | NRAS | NRAS | NRAS | 4699 | 0.053 | 0.6 | NO |
| 42 | CBL | CBL | CBL | 4701 | 0.053 | 0.6 | NO |
| 43 | CALM3 | CALM3 | CALM3 | 4858 | 0.05 | 0.6 | NO |
| 44 | UBA52 | UBA52 | UBA52 | 5070 | 0.046 | 0.59 | NO |
| 45 | PSMA2 | PSMA2 | PSMA2 | 5176 | 0.044 | 0.58 | NO |
| 46 | IKBKG | IKBKG | IKBKG | 5202 | 0.043 | 0.58 | NO |
| 47 | RPS27A | RPS27A | RPS27A | 5423 | 0.04 | 0.58 | NO |
| 48 | PSMF1 | PSMF1 | PSMF1 | 5516 | 0.038 | 0.57 | NO |
| 49 | PSMA4 | PSMA4 | PSMA4 | 5696 | 0.036 | 0.57 | NO |
| 50 | PSMA3 | PSMA3 | PSMA3 | 6017 | 0.031 | 0.55 | NO |
| 51 | PSMD13 | PSMD13 | PSMD13 | 6142 | 0.03 | 0.55 | NO |
| 52 | PSMB1 | PSMB1 | PSMB1 | 6196 | 0.029 | 0.55 | NO |
| 53 | MTOR | MTOR | MTOR | 6262 | 0.028 | 0.54 | NO |
| 54 | PSMB2 | PSMB2 | PSMB2 | 6363 | 0.027 | 0.54 | NO |
| 55 | SOS1 | SOS1 | SOS1 | 6448 | 0.026 | 0.54 | NO |
| 56 | PSMD1 | PSMD1 | PSMD1 | 6600 | 0.024 | 0.53 | NO |
| 57 | CASP9 | CASP9 | CASP9 | 6616 | 0.024 | 0.53 | NO |
| 58 | AKT2 | AKT2 | AKT2 | 6736 | 0.022 | 0.53 | NO |
| 59 | TRIB3 | TRIB3 | TRIB3 | 6793 | 0.022 | 0.52 | NO |
| 60 | PSMC4 | PSMC4 | PSMC4 | 6856 | 0.021 | 0.52 | NO |
| 61 | PSMD11 | PSMD11 | PSMD11 | 6929 | 0.02 | 0.52 | NO |
| 62 | THEM4 | THEM4 | THEM4 | 7144 | 0.018 | 0.51 | NO |
| 63 | PSMD14 | PSMD14 | PSMD14 | 7175 | 0.018 | 0.51 | NO |
| 64 | PSMD7 | PSMD7 | PSMD7 | 7190 | 0.017 | 0.51 | NO |
| 65 | AKT3 | AKT3 | AKT3 | 7335 | 0.016 | 0.5 | NO |
| 66 | PSMB6 | PSMB6 | PSMB6 | 7589 | 0.013 | 0.49 | NO |
| 67 | AKT1S1 | AKT1S1 | AKT1S1 | 7629 | 0.012 | 0.49 | NO |
| 68 | RICTOR | RICTOR | RICTOR | 7667 | 0.012 | 0.49 | NO |
| 69 | PSMD2 | PSMD2 | PSMD2 | 7871 | 0.0098 | 0.48 | NO |
| 70 | CDKN1B | CDKN1B | CDKN1B | 7909 | 0.0094 | 0.48 | NO |
| 71 | PSMC5 | PSMC5 | PSMC5 | 7970 | 0.0088 | 0.47 | NO |
| 72 | PSMD12 | PSMD12 | PSMD12 | 7986 | 0.0087 | 0.47 | NO |
| 73 | CREB1 | CREB1 | CREB1 | 8094 | 0.0075 | 0.47 | NO |
| 74 | PSMA1 | PSMA1 | PSMA1 | 8113 | 0.0073 | 0.47 | NO |
| 75 | PSMD6 | PSMD6 | PSMD6 | 8119 | 0.0072 | 0.47 | NO |
| 76 | PSMD10 | PSMD10 | PSMD10 | 8153 | 0.0069 | 0.46 | NO |
| 77 | BCL10 | BCL10 | BCL10 | 8236 | 0.0061 | 0.46 | NO |
| 78 | PSMB7 | PSMB7 | PSMB7 | 8251 | 0.0059 | 0.46 | NO |
| 79 | CALM1 | CALM1 | CALM1 | 8400 | 0.0044 | 0.45 | NO |
| 80 | PSMA7 | PSMA7 | PSMA7 | 8557 | 0.0027 | 0.44 | NO |
| 81 | MAPKAP1 | MAPKAP1 | MAPKAP1 | 8600 | 0.0021 | 0.44 | NO |
| 82 | PSMD8 | PSMD8 | PSMD8 | 8638 | 0.0016 | 0.44 | NO |
| 83 | PSMC3 | PSMC3 | PSMC3 | 8679 | 0.0012 | 0.44 | NO |
| 84 | MAP3K7 | MAP3K7 | MAP3K7 | 8695 | 0.0011 | 0.44 | NO |
| 85 | PSME4 | PSME4 | PSME4 | 8840 | -0.00024 | 0.43 | NO |
| 86 | PSMD9 | PSMD9 | PSMD9 | 8841 | -0.00024 | 0.43 | NO |
| 87 | PSMB5 | PSMB5 | PSMB5 | 8900 | -0.00083 | 0.43 | NO |
| 88 | BTRC | BTRC | BTRC | 8924 | -0.001 | 0.42 | NO |
| 89 | RELA | RELA | RELA | 8928 | -0.001 | 0.42 | NO |
| 90 | CUL1 | CUL1 | CUL1 | 8957 | -0.0014 | 0.42 | NO |
| 91 | REL | REL | REL | 9239 | -0.0043 | 0.41 | NO |
| 92 | GSK3A | GSK3A | GSK3A | 9513 | -0.0068 | 0.39 | NO |
| 93 | PSMB3 | PSMB3 | PSMB3 | 10223 | -0.014 | 0.36 | NO |
| 94 | FBXW11 | FBXW11 | FBXW11 | 10432 | -0.017 | 0.35 | NO |
| 95 | NR4A1 | NR4A1 | NR4A1 | 10434 | -0.017 | 0.35 | NO |
| 96 | PSMC2 | PSMC2 | PSMC2 | 10488 | -0.017 | 0.34 | NO |
| 97 | TSC2 | TSC2 | TSC2 | 10497 | -0.017 | 0.35 | NO |
| 98 | PSMB4 | PSMB4 | PSMB4 | 10694 | -0.019 | 0.34 | NO |
| 99 | PSMD4 | PSMD4 | PSMD4 | 11111 | -0.024 | 0.32 | NO |
| 100 | SKP1 | SKP1 | SKP1 | 11147 | -0.024 | 0.32 | NO |
| 101 | ITPR3 | ITPR3 | ITPR3 | 11251 | -0.026 | 0.31 | NO |
| 102 | PSMD5 | PSMD5 | PSMD5 | 11318 | -0.026 | 0.31 | NO |
| 103 | PTEN | PTEN | PTEN | 11984 | -0.034 | 0.28 | NO |
| 104 | PDPK1 | PDPK1 | PDPK1 | 12034 | -0.035 | 0.27 | NO |
| 105 | PSMC1 | PSMC1 | PSMC1 | 12144 | -0.036 | 0.27 | NO |
| 106 | CALM2 | CALM2 | CALM2 | 12171 | -0.037 | 0.27 | NO |
| 107 | IKBKB | IKBKB | IKBKB | 12216 | -0.037 | 0.27 | NO |
| 108 | PSMD3 | PSMD3 | PSMD3 | 12250 | -0.038 | 0.27 | NO |
| 109 | PIK3R1 | PIK3R1 | PIK3R1 | 12279 | -0.038 | 0.27 | NO |
| 110 | HRAS | HRAS | HRAS | 12316 | -0.039 | 0.28 | NO |
| 111 | PSMC6 | PSMC6 | PSMC6 | 12403 | -0.04 | 0.27 | NO |
| 112 | MLST8 | MLST8 | MLST8 | 12408 | -0.04 | 0.28 | NO |
| 113 | KRAS | KRAS | KRAS | 13082 | -0.05 | 0.24 | NO |
| 114 | AKT1 | AKT1 | AKT1 | 13673 | -0.061 | 0.21 | NO |
| 115 | STIM1 | STIM1 | STIM1 | 13675 | -0.061 | 0.22 | NO |
| 116 | BAD | BAD | BAD | 13941 | -0.066 | 0.21 | NO |
| 117 | MDM2 | MDM2 | MDM2 | 14057 | -0.069 | 0.21 | NO |
| 118 | SHC1 | SHC1 | SHC1 | 14128 | -0.07 | 0.21 | NO |
| 119 | CDKN1A | CDKN1A | CDKN1A | 14521 | -0.08 | 0.19 | NO |
| 120 | ITPR2 | ITPR2 | ITPR2 | 14939 | -0.092 | 0.17 | NO |
| 121 | PHLPP1 | PHLPP1 | PHLPP1 | 16100 | -0.14 | 0.12 | NO |
Figure S123. Get High-res Image This plot shows mRNAseq_cNMF expression data heatmap (on the left) a RunningEnrichmentScore(RES) plot (on the top right) and a Signal2Noise(S2N) plot (on the bottom right) of genes in the pathway: KEGG AMINO SUGAR AND NUCLEOTIDE SUGAR METABOLISM.
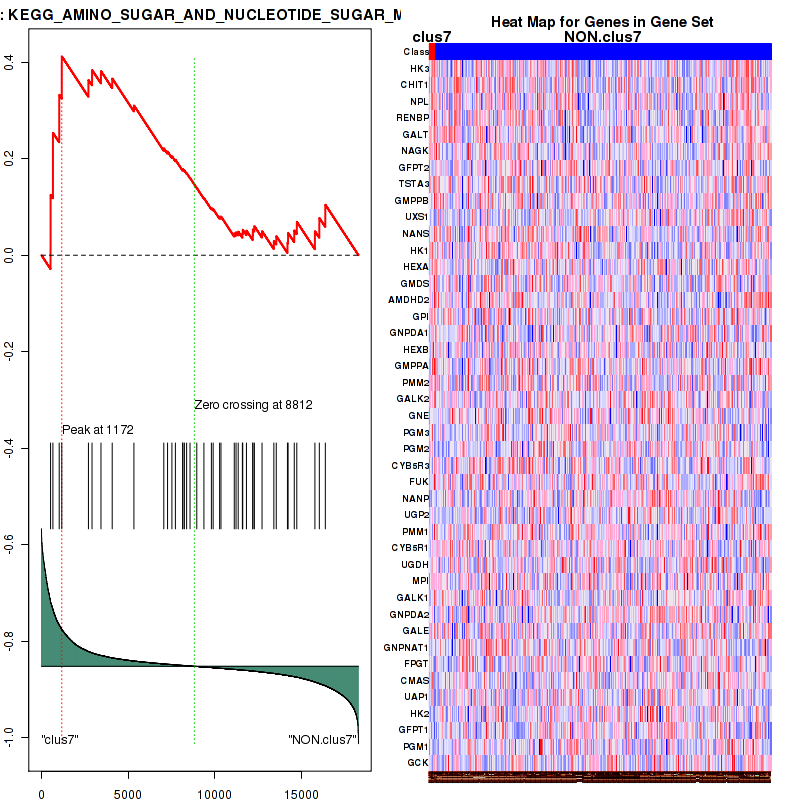
Figure S124. Get High-res Image For the top 5 core enriched genes in the pathway: KEGG AMINO SUGAR AND NUCLEOTIDE SUGAR METABOLISM, this volcano plot shows how much they are up/down-regulated and significant. The significance was calculated by empirical bayesian fit
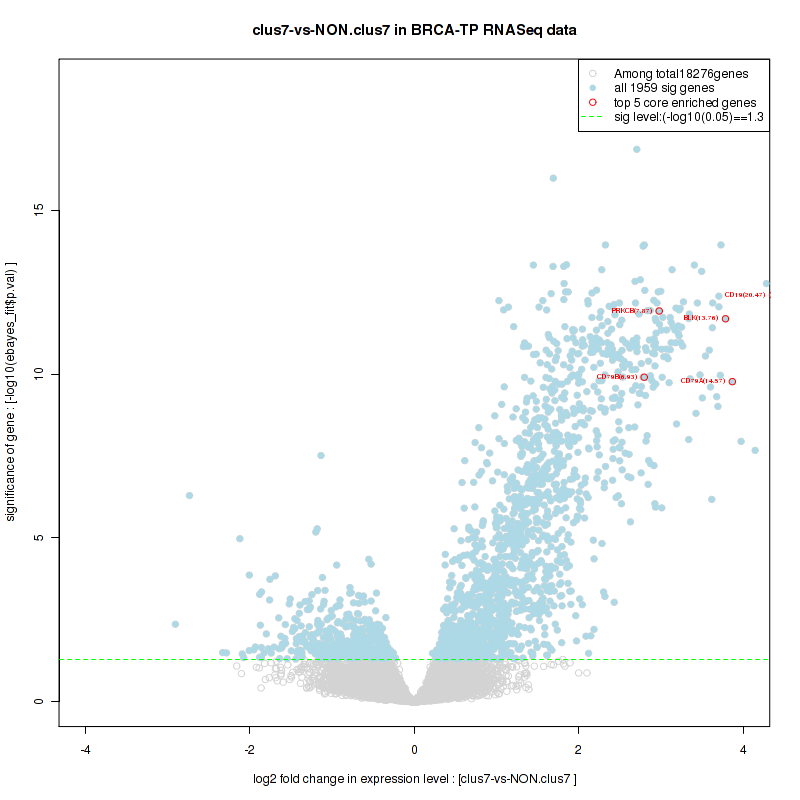
Table S63. Get Full Table This table shows a Running Enrichment Score (RES) of each gene in this pathway, that is, the enrichment score at this point in the ranked list of genes. All genes are ranked by Signal-to-Noise (S2N), a measure of similarity as default and are used to obtain ES matrix of all genes. In this way, GSEA tool uses expression pattern of not only overlapped genes but also not-overlapped genes to produce ES matrix.
| Rank | GENE | SYMBOL | DESC | LIST.LOC | S2N | RES | CORE_ENRICHMENT |
|---|---|---|---|---|---|---|---|
| 1 | CD247 | CD247 | CD247 | 95 | 0.86 | 0.054 | YES |
| 2 | CD28 | CD28 | CD28 | 129 | 0.82 | 0.11 | YES |
| 3 | CD8B | CD8B | CD8B | 130 | 0.82 | 0.16 | YES |
| 4 | LCK | LCK | LCK | 159 | 0.8 | 0.22 | YES |
| 5 | CCR5 | CCR5 | CCR5 | 260 | 0.7 | 0.26 | YES |
| 6 | APOBEC3G | APOBEC3G | APOBEC3G | 452 | 0.56 | 0.29 | YES |
| 7 | DOCK2 | DOCK2 | DOCK2 | 477 | 0.53 | 0.32 | YES |
| 8 | PSMB9 | PSMB9 | PSMB9 | 652 | 0.45 | 0.34 | YES |
| 9 | PSMA8 | PSMA8 | PSMA8 | 713 | 0.42 | 0.37 | YES |
| 10 | CXCR4 | CXCR4 | CXCR4 | 814 | 0.38 | 0.39 | YES |
| 11 | CD4 | CD4 | CD4 | 850 | 0.37 | 0.42 | YES |
| 12 | HCK | HCK | HCK | 950 | 0.34 | 0.43 | YES |
| 13 | ELMO1 | ELMO1 | ELMO1 | 976 | 0.34 | 0.46 | YES |
| 14 | FYN | FYN | FYN | 1084 | 0.31 | 0.47 | YES |
| 15 | PSMB8 | PSMB8 | PSMB8 | 1276 | 0.27 | 0.48 | YES |
| 16 | AP1S2 | AP1S2 | AP1S2 | 1559 | 0.22 | 0.48 | YES |
| 17 | HLA-A | HLA-A | HLA-A | 1573 | 0.22 | 0.49 | YES |
| 18 | PSMB10 | PSMB10 | PSMB10 | 1580 | 0.22 | 0.51 | YES |
| 19 | B2M | B2M | B2M | 1616 | 0.21 | 0.52 | YES |
| 20 | PSME2 | PSME2 | PSME2 | 1644 | 0.21 | 0.53 | YES |
| 21 | TAF4B | TAF4B | TAF4B | 2026 | 0.16 | 0.52 | YES |
| 22 | TAF5 | TAF5 | TAF5 | 2117 | 0.16 | 0.53 | YES |
| 23 | PSME1 | PSME1 | PSME1 | 2162 | 0.15 | 0.54 | YES |
| 24 | LIG1 | LIG1 | LIG1 | 2931 | 0.1 | 0.5 | NO |
| 25 | GTF2E1 | GTF2E1 | GTF2E1 | 3348 | 0.087 | 0.48 | NO |
| 26 | NUP93 | NUP93 | NUP93 | 3658 | 0.078 | 0.47 | NO |
| 27 | PSMA5 | PSMA5 | PSMA5 | 3693 | 0.077 | 0.48 | NO |
| 28 | SLC25A6 | SLC25A6 | SLC25A6 | 3841 | 0.072 | 0.47 | NO |
| 29 | POLR2K | POLR2K | POLR2K | 3870 | 0.071 | 0.48 | NO |
| 30 | AP1M1 | AP1M1 | AP1M1 | 3929 | 0.07 | 0.48 | NO |
| 31 | NUP62 | NUP62 | NUP62 | 3942 | 0.069 | 0.48 | NO |
| 32 | NUP210 | NUP210 | NUP210 | 4140 | 0.064 | 0.48 | NO |
| 33 | ELL | ELL | ELL | 4188 | 0.063 | 0.48 | NO |
| 34 | HMGA1 | HMGA1 | HMGA1 | 4225 | 0.063 | 0.48 | NO |
| 35 | NUP54 | NUP54 | NUP54 | 4550 | 0.056 | 0.47 | NO |
| 36 | RNGTT | RNGTT | RNGTT | 4635 | 0.054 | 0.46 | NO |
| 37 | PSMA6 | PSMA6 | PSMA6 | 4648 | 0.054 | 0.47 | NO |
| 38 | TCEB1 | TCEB1 | TCEB1 | 4653 | 0.054 | 0.47 | NO |
| 39 | SLC25A5 | SLC25A5 | SLC25A5 | 4659 | 0.054 | 0.48 | NO |
| 40 | POLR2D | POLR2D | POLR2D | 4882 | 0.049 | 0.47 | NO |
| 41 | NMT2 | NMT2 | NMT2 | 4983 | 0.047 | 0.46 | NO |
| 42 | UBA52 | UBA52 | UBA52 | 5070 | 0.046 | 0.46 | NO |
| 43 | AP1B1 | AP1B1 | AP1B1 | 5078 | 0.046 | 0.46 | NO |
| 44 | PSIP1 | PSIP1 | PSIP1 | 5085 | 0.046 | 0.47 | NO |
| 45 | NCBP2 | NCBP2 | NCBP2 | 5129 | 0.045 | 0.47 | NO |
| 46 | GTF2B | GTF2B | GTF2B | 5150 | 0.044 | 0.47 | NO |
| 47 | PSMA2 | PSMA2 | PSMA2 | 5176 | 0.044 | 0.47 | NO |
| 48 | NUPL2 | NUPL2 | NUPL2 | 5344 | 0.041 | 0.47 | NO |
| 49 | VPS28 | VPS28 | VPS28 | 5389 | 0.041 | 0.47 | NO |
| 50 | RPS27A | RPS27A | RPS27A | 5423 | 0.04 | 0.47 | NO |
| 51 | FEN1 | FEN1 | FEN1 | 5470 | 0.039 | 0.47 | NO |
| 52 | PSMF1 | PSMF1 | PSMF1 | 5516 | 0.038 | 0.47 | NO |
| 53 | AP2A1 | AP2A1 | AP2A1 | 5517 | 0.038 | 0.47 | NO |
| 54 | POLR2H | POLR2H | POLR2H | 5534 | 0.038 | 0.47 | NO |
| 55 | KPNB1 | KPNB1 | KPNB1 | 5631 | 0.037 | 0.47 | NO |
| 56 | TAF11 | TAF11 | TAF11 | 5664 | 0.036 | 0.47 | NO |
| 57 | PSMA4 | PSMA4 | PSMA4 | 5696 | 0.036 | 0.47 | NO |
| 58 | SUPT5H | SUPT5H | SUPT5H | 5778 | 0.035 | 0.47 | NO |
| 59 | SUPT4H1 | SUPT4H1 | SUPT4H1 | 5825 | 0.034 | 0.47 | NO |
| 60 | NMT1 | NMT1 | NMT1 | 5985 | 0.032 | 0.46 | NO |
| 61 | ATP6V1H | ATP6V1H | ATP6V1H | 6002 | 0.032 | 0.46 | NO |
| 62 | PSMA3 | PSMA3 | PSMA3 | 6017 | 0.031 | 0.46 | NO |
| 63 | XRCC5 | XRCC5 | XRCC5 | 6053 | 0.031 | 0.46 | NO |
| 64 | NUP153 | NUP153 | NUP153 | 6113 | 0.03 | 0.46 | NO |
| 65 | PSMD13 | PSMD13 | PSMD13 | 6142 | 0.03 | 0.46 | NO |
| 66 | GTF2H4 | GTF2H4 | GTF2H4 | 6143 | 0.03 | 0.47 | NO |
| 67 | PSMB1 | PSMB1 | PSMB1 | 6196 | 0.029 | 0.46 | NO |
| 68 | CTDP1 | CTDP1 | CTDP1 | 6336 | 0.027 | 0.46 | NO |
| 69 | RAN | RAN | RAN | 6348 | 0.027 | 0.46 | NO |
| 70 | PSMB2 | PSMB2 | PSMB2 | 6363 | 0.027 | 0.46 | NO |
| 71 | TCEB3 | TCEB3 | TCEB3 | 6482 | 0.025 | 0.46 | NO |
| 72 | TCEA1 | TCEA1 | TCEA1 | 6569 | 0.024 | 0.45 | NO |
| 73 | RCC1 | RCC1 | RCC1 | 6576 | 0.024 | 0.46 | NO |
| 74 | CDK7 | CDK7 | CDK7 | 6586 | 0.024 | 0.46 | NO |
| 75 | PSMD1 | PSMD1 | PSMD1 | 6600 | 0.024 | 0.46 | NO |
| 76 | NUP85 | NUP85 | NUP85 | 6601 | 0.024 | 0.46 | NO |
| 77 | TH1L | TH1L | TH1L | 6630 | 0.024 | 0.46 | NO |
| 78 | AP2S1 | AP2S1 | AP2S1 | 6639 | 0.024 | 0.46 | NO |
| 79 | NUP43 | NUP43 | NUP43 | 6779 | 0.022 | 0.45 | NO |
| 80 | KPNA1 | KPNA1 | KPNA1 | 6834 | 0.021 | 0.45 | NO |
| 81 | PSMC4 | PSMC4 | PSMC4 | 6856 | 0.021 | 0.45 | NO |
| 82 | TAF12 | TAF12 | TAF12 | 6867 | 0.021 | 0.45 | NO |
| 83 | AAAS | AAAS | AAAS | 6925 | 0.02 | 0.45 | NO |
| 84 | PSMD11 | PSMD11 | PSMD11 | 6929 | 0.02 | 0.45 | NO |
| 85 | TBP | TBP | TBP | 7004 | 0.019 | 0.45 | NO |
| 86 | GTF2H3 | GTF2H3 | GTF2H3 | 7052 | 0.019 | 0.45 | NO |
| 87 | RANBP1 | RANBP1 | RANBP1 | 7080 | 0.018 | 0.45 | NO |
| 88 | POLR2C | POLR2C | POLR2C | 7126 | 0.018 | 0.45 | NO |
| 89 | PAK2 | PAK2 | PAK2 | 7128 | 0.018 | 0.45 | NO |
| 90 | NPM1 | NPM1 | NPM1 | 7172 | 0.018 | 0.45 | NO |
| 91 | PSMD14 | PSMD14 | PSMD14 | 7175 | 0.018 | 0.45 | NO |
| 92 | NUP35 | NUP35 | NUP35 | 7178 | 0.018 | 0.45 | NO |
| 93 | CDK9 | CDK9 | CDK9 | 7179 | 0.018 | 0.45 | NO |
| 94 | PSMD7 | PSMD7 | PSMD7 | 7190 | 0.017 | 0.45 | NO |
| 95 | TAF10 | TAF10 | TAF10 | 7311 | 0.016 | 0.45 | NO |
| 96 | XRCC6 | XRCC6 | XRCC6 | 7442 | 0.014 | 0.44 | NO |
| 97 | PSMB6 | PSMB6 | PSMB6 | 7589 | 0.013 | 0.43 | NO |
| 98 | NUP188 | NUP188 | NUP188 | 7687 | 0.012 | 0.43 | NO |
| 99 | NUP88 | NUP88 | NUP88 | 7717 | 0.011 | 0.43 | NO |
| 100 | PSMD2 | PSMD2 | PSMD2 | 7871 | 0.0098 | 0.42 | NO |
| 101 | RANGAP1 | RANGAP1 | RANGAP1 | 7894 | 0.0096 | 0.42 | NO |
| 102 | NUP107 | NUP107 | NUP107 | 7908 | 0.0094 | 0.42 | NO |
| 103 | PSMC5 | PSMC5 | PSMC5 | 7970 | 0.0088 | 0.42 | NO |
| 104 | PSMD12 | PSMD12 | PSMD12 | 7986 | 0.0087 | 0.42 | NO |
| 105 | NUP37 | NUP37 | NUP37 | 8005 | 0.0085 | 0.42 | NO |
| 106 | TAF1 | TAF1 | TAF1 | 8026 | 0.0083 | 0.42 | NO |
| 107 | PSMA1 | PSMA1 | PSMA1 | 8113 | 0.0073 | 0.41 | NO |
| 108 | PSMD6 | PSMD6 | PSMD6 | 8119 | 0.0072 | 0.41 | NO |
| 109 | NUP155 | NUP155 | NUP155 | 8137 | 0.007 | 0.41 | NO |
| 110 | PSMD10 | PSMD10 | PSMD10 | 8153 | 0.0069 | 0.41 | NO |
| 111 | RBX1 | RBX1 | RBX1 | 8163 | 0.0068 | 0.41 | NO |
| 112 | PSMB7 | PSMB7 | PSMB7 | 8251 | 0.0059 | 0.41 | NO |
| 113 | TAF9 | TAF9 | TAF9 | 8293 | 0.0055 | 0.4 | NO |
| 114 | RAE1 | RAE1 | RAE1 | 8297 | 0.0055 | 0.4 | NO |
| 115 | ERCC2 | ERCC2 | ERCC2 | 8306 | 0.0054 | 0.4 | NO |
| 116 | NUP50 | NUP50 | NUP50 | 8415 | 0.0042 | 0.4 | NO |
| 117 | POLR2B | POLR2B | POLR2B | 8416 | 0.0042 | 0.4 | NO |
| 118 | PSMA7 | PSMA7 | PSMA7 | 8557 | 0.0027 | 0.39 | NO |
| 119 | PSMD8 | PSMD8 | PSMD8 | 8638 | 0.0016 | 0.39 | NO |
| 120 | POLR2G | POLR2G | POLR2G | 8649 | 0.0015 | 0.39 | NO |
| 121 | PPIA | PPIA | PPIA | 8651 | 0.0015 | 0.39 | NO |
| 122 | SUPT16H | SUPT16H | SUPT16H | 8654 | 0.0014 | 0.39 | NO |
| 123 | POM121 | POM121 | POM121 | 8658 | 0.0014 | 0.39 | NO |
| 124 | PSMC3 | PSMC3 | PSMC3 | 8679 | 0.0012 | 0.38 | NO |
| 125 | ERCC3 | ERCC3 | ERCC3 | 8715 | 0.00096 | 0.38 | NO |
| 126 | RDBP | RDBP | RDBP | 8800 | 0.00016 | 0.38 | NO |
| 127 | SSRP1 | SSRP1 | SSRP1 | 8834 | -0.00019 | 0.38 | NO |
| 128 | PSME4 | PSME4 | PSME4 | 8840 | -0.00024 | 0.38 | NO |
| 129 | PSMD9 | PSMD9 | PSMD9 | 8841 | -0.00024 | 0.38 | NO |
| 130 | PSMB5 | PSMB5 | PSMB5 | 8900 | -0.00083 | 0.37 | NO |
| 131 | BTRC | BTRC | BTRC | 8924 | -0.001 | 0.37 | NO |
| 132 | POLR2A | POLR2A | POLR2A | 9019 | -0.002 | 0.37 | NO |
| 133 | POLR2F | POLR2F | POLR2F | 9230 | -0.0042 | 0.36 | NO |
| 134 | NUP214 | NUP214 | NUP214 | 9409 | -0.0059 | 0.35 | NO |
| 135 | XPO1 | XPO1 | XPO1 | 9416 | -0.006 | 0.35 | NO |
| 136 | AP2A2 | AP2A2 | AP2A2 | 9436 | -0.0062 | 0.35 | NO |
| 137 | COBRA1 | COBRA1 | COBRA1 | 9541 | -0.007 | 0.34 | NO |
| 138 | TAF4 | TAF4 | TAF4 | 9577 | -0.0076 | 0.34 | NO |
| 139 | PACS1 | PACS1 | PACS1 | 9622 | -0.0082 | 0.34 | NO |
| 140 | NUP205 | NUP205 | NUP205 | 9626 | -0.0082 | 0.34 | NO |
| 141 | TPR | TPR | TPR | 9700 | -0.009 | 0.33 | NO |
| 142 | WHSC2 | WHSC2 | WHSC2 | 9776 | -0.0096 | 0.33 | NO |
| 143 | GTF2H1 | GTF2H1 | GTF2H1 | 9846 | -0.01 | 0.33 | NO |
| 144 | RANBP2 | RANBP2 | RANBP2 | 9850 | -0.01 | 0.33 | NO |
| 145 | BANF1 | BANF1 | BANF1 | 9876 | -0.01 | 0.33 | NO |
| 146 | CCNT2 | CCNT2 | CCNT2 | 9979 | -0.012 | 0.32 | NO |
| 147 | NCBP1 | NCBP1 | NCBP1 | 9989 | -0.012 | 0.32 | NO |
| 148 | AP2M1 | AP2M1 | AP2M1 | 10000 | -0.012 | 0.32 | NO |
| 149 | NUP133 | NUP133 | NUP133 | 10062 | -0.013 | 0.32 | NO |
| 150 | GTF2E2 | GTF2E2 | GTF2E2 | 10116 | -0.013 | 0.32 | NO |
| 151 | PSMB3 | PSMB3 | PSMB3 | 10223 | -0.014 | 0.31 | NO |
| 152 | GTF2A2 | GTF2A2 | GTF2A2 | 10450 | -0.017 | 0.3 | NO |
| 153 | PSMC2 | PSMC2 | PSMC2 | 10488 | -0.017 | 0.3 | NO |
| 154 | GTF2F1 | GTF2F1 | GTF2F1 | 10542 | -0.018 | 0.3 | NO |
| 155 | XRCC4 | XRCC4 | XRCC4 | 10626 | -0.019 | 0.3 | NO |
| 156 | PSMB4 | PSMB4 | PSMB4 | 10694 | -0.019 | 0.29 | NO |
| 157 | LIG4 | LIG4 | LIG4 | 10724 | -0.02 | 0.29 | NO |
| 158 | POLR2L | POLR2L | POLR2L | 10776 | -0.02 | 0.29 | NO |
| 159 | TAF13 | TAF13 | TAF13 | 10893 | -0.022 | 0.29 | NO |
| 160 | POLR2I | POLR2I | POLR2I | 11015 | -0.023 | 0.28 | NO |
| 161 | RAC1 | RAC1 | RAC1 | 11074 | -0.024 | 0.28 | NO |
| 162 | PSMD4 | PSMD4 | PSMD4 | 11111 | -0.024 | 0.28 | NO |
| 163 | SKP1 | SKP1 | SKP1 | 11147 | -0.024 | 0.28 | NO |
| 164 | CUL5 | CUL5 | CUL5 | 11162 | -0.024 | 0.28 | NO |
| 165 | ARF1 | ARF1 | ARF1 | 11184 | -0.025 | 0.28 | NO |
| 166 | PSMD5 | PSMD5 | PSMD5 | 11318 | -0.026 | 0.28 | NO |
| 167 | TCEB2 | TCEB2 | TCEB2 | 11325 | -0.026 | 0.28 | NO |
| 168 | RNMT | RNMT | RNMT | 11428 | -0.028 | 0.27 | NO |
| 169 | AP1G1 | AP1G1 | AP1G1 | 11477 | -0.028 | 0.27 | NO |
| 170 | GTF2F2 | GTF2F2 | GTF2F2 | 11512 | -0.029 | 0.27 | NO |
| 171 | VPS37C | VPS37C | VPS37C | 11545 | -0.029 | 0.27 | NO |
| 172 | VPS37B | VPS37B | VPS37B | 11648 | -0.03 | 0.27 | NO |
| 173 | POLR2E | POLR2E | POLR2E | 11674 | -0.031 | 0.27 | NO |
| 174 | POLR2J | POLR2J | POLR2J | 12027 | -0.035 | 0.25 | NO |
| 175 | AP2B1 | AP2B1 | AP2B1 | 12045 | -0.035 | 0.26 | NO |
| 176 | CCNH | CCNH | CCNH | 12075 | -0.036 | 0.26 | NO |
| 177 | PSMC1 | PSMC1 | PSMC1 | 12144 | -0.036 | 0.26 | NO |
| 178 | PSMD3 | PSMD3 | PSMD3 | 12250 | -0.038 | 0.25 | NO |
| 179 | PSMC6 | PSMC6 | PSMC6 | 12403 | -0.04 | 0.25 | NO |
| 180 | SLC25A4 | SLC25A4 | SLC25A4 | 12754 | -0.046 | 0.23 | NO |
| 181 | CCNT1 | CCNT1 | CCNT1 | 12953 | -0.049 | 0.22 | NO |
| 182 | SEH1L | SEH1L | SEH1L | 12977 | -0.049 | 0.22 | NO |
| 183 | TSG101 | TSG101 | TSG101 | 13096 | -0.051 | 0.22 | NO |
| 184 | GTF2A1 | GTF2A1 | GTF2A1 | 13131 | -0.051 | 0.22 | NO |
| 185 | AP1M2 | AP1M2 | AP1M2 | 13282 | -0.054 | 0.22 | NO |
| 186 | TAF6 | TAF6 | TAF6 | 13693 | -0.062 | 0.2 | NO |
| 187 | NUPL1 | NUPL1 | NUPL1 | 14404 | -0.077 | 0.17 | NO |
| 188 | GTF2H2B | GTF2H2B | GTF2H2B | 14628 | -0.082 | 0.16 | NO |
| 189 | MNAT1 | MNAT1 | MNAT1 | 14967 | -0.093 | 0.15 | NO |
| 190 | AP1S1 | AP1S1 | AP1S1 | 15148 | -0.099 | 0.14 | NO |
| 191 | VPS37A | VPS37A | VPS37A | 15636 | -0.12 | 0.12 | NO |
| 192 | GTF2H2 | GTF2H2 | GTF2H2 | 15646 | -0.12 | 0.13 | NO |
| 193 | VPS37D | VPS37D | VPS37D | 16872 | -0.19 | 0.078 | NO |
Figure S125. Get High-res Image This plot shows mRNAseq_cNMF expression data heatmap (on the left) a RunningEnrichmentScore(RES) plot (on the top right) and a Signal2Noise(S2N) plot (on the bottom right) of genes in the pathway: KEGG INOSITOL PHOSPHATE METABOLISM.
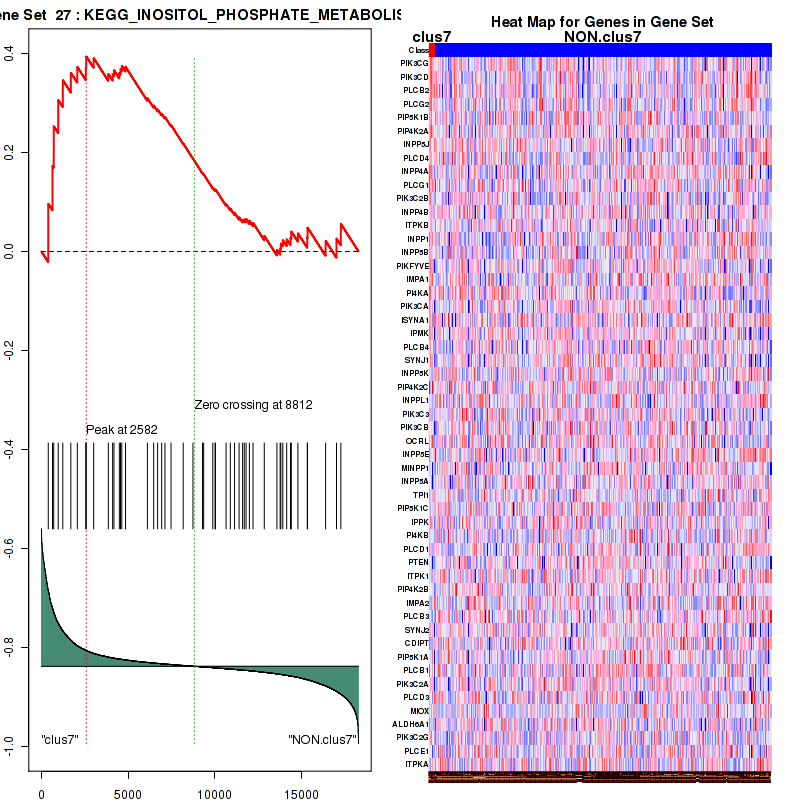
Figure S126. Get High-res Image For the top 5 core enriched genes in the pathway: KEGG INOSITOL PHOSPHATE METABOLISM, this volcano plot shows how much they are up/down-regulated and significant. The significance was calculated by empirical bayesian fit

Table S64. Get Full Table This table shows a Running Enrichment Score (RES) of each gene in this pathway, that is, the enrichment score at this point in the ranked list of genes. All genes are ranked by Signal-to-Noise (S2N), a measure of similarity as default and are used to obtain ES matrix of all genes. In this way, GSEA tool uses expression pattern of not only overlapped genes but also not-overlapped genes to produce ES matrix.
| Rank | GENE | SYMBOL | DESC | LIST.LOC | S2N | RES | CORE_ENRICHMENT |
|---|---|---|---|---|---|---|---|
| 1 | PRKCB | PRKCB | PRKCB | 114 | 0.84 | 0.12 | YES |
| 2 | CARD11 | CARD11 | CARD11 | 234 | 0.73 | 0.22 | YES |
| 3 | PSMB9 | PSMB9 | PSMB9 | 652 | 0.45 | 0.27 | YES |
| 4 | PSMA8 | PSMA8 | PSMA8 | 713 | 0.42 | 0.33 | YES |
| 5 | PSMB8 | PSMB8 | PSMB8 | 1276 | 0.27 | 0.34 | YES |
| 6 | RASGRP1 | RASGRP1 | RASGRP1 | 1321 | 0.26 | 0.38 | YES |
| 7 | PSMB10 | PSMB10 | PSMB10 | 1580 | 0.22 | 0.4 | YES |
| 8 | RASGRP3 | RASGRP3 | RASGRP3 | 1615 | 0.22 | 0.43 | YES |
| 9 | PSME2 | PSME2 | PSME2 | 1644 | 0.21 | 0.46 | YES |
| 10 | FOXO1 | FOXO1 | FOXO1 | 1796 | 0.19 | 0.48 | YES |
| 11 | NFKBIE | NFKBIE | NFKBIE | 2014 | 0.17 | 0.49 | YES |
| 12 | PSME1 | PSME1 | PSME1 | 2162 | 0.15 | 0.51 | YES |
| 13 | MALT1 | MALT1 | MALT1 | 2846 | 0.11 | 0.49 | YES |
| 14 | FOXO4 | FOXO4 | FOXO4 | 3063 | 0.098 | 0.49 | YES |
| 15 | NFKBIA | NFKBIA | NFKBIA | 3283 | 0.09 | 0.49 | YES |
| 16 | CHUK | CHUK | CHUK | 3492 | 0.083 | 0.49 | YES |
| 17 | NFKBIB | NFKBIB | NFKBIB | 3513 | 0.083 | 0.5 | YES |
| 18 | RPS6KB2 | RPS6KB2 | RPS6KB2 | 3634 | 0.079 | 0.51 | YES |
| 19 | PSMA5 | PSMA5 | PSMA5 | 3693 | 0.077 | 0.52 | YES |
| 20 | FOXO3 | FOXO3 | FOXO3 | 4265 | 0.062 | 0.5 | NO |
| 21 | PSMA6 | PSMA6 | PSMA6 | 4648 | 0.054 | 0.48 | NO |
| 22 | NRAS | NRAS | NRAS | 4699 | 0.053 | 0.49 | NO |
| 23 | UBA52 | UBA52 | UBA52 | 5070 | 0.046 | 0.48 | NO |
| 24 | PSMA2 | PSMA2 | PSMA2 | 5176 | 0.044 | 0.48 | NO |
| 25 | IKBKG | IKBKG | IKBKG | 5202 | 0.043 | 0.48 | NO |
| 26 | RPS27A | RPS27A | RPS27A | 5423 | 0.04 | 0.48 | NO |
| 27 | PSMF1 | PSMF1 | PSMF1 | 5516 | 0.038 | 0.48 | NO |
| 28 | PSMA4 | PSMA4 | PSMA4 | 5696 | 0.036 | 0.47 | NO |
| 29 | PSMA3 | PSMA3 | PSMA3 | 6017 | 0.031 | 0.46 | NO |
| 30 | PSMD13 | PSMD13 | PSMD13 | 6142 | 0.03 | 0.46 | NO |
| 31 | PSMB1 | PSMB1 | PSMB1 | 6196 | 0.029 | 0.46 | NO |
| 32 | MTOR | MTOR | MTOR | 6262 | 0.028 | 0.46 | NO |
| 33 | PSMB2 | PSMB2 | PSMB2 | 6363 | 0.027 | 0.46 | NO |
| 34 | PSMD1 | PSMD1 | PSMD1 | 6600 | 0.024 | 0.45 | NO |
| 35 | CASP9 | CASP9 | CASP9 | 6616 | 0.024 | 0.45 | NO |
| 36 | AKT2 | AKT2 | AKT2 | 6736 | 0.022 | 0.45 | NO |
| 37 | TRIB3 | TRIB3 | TRIB3 | 6793 | 0.022 | 0.45 | NO |
| 38 | PSMC4 | PSMC4 | PSMC4 | 6856 | 0.021 | 0.45 | NO |
| 39 | PSMD11 | PSMD11 | PSMD11 | 6929 | 0.02 | 0.45 | NO |
| 40 | THEM4 | THEM4 | THEM4 | 7144 | 0.018 | 0.44 | NO |
| 41 | PSMD14 | PSMD14 | PSMD14 | 7175 | 0.018 | 0.44 | NO |
| 42 | PSMD7 | PSMD7 | PSMD7 | 7190 | 0.017 | 0.44 | NO |
| 43 | AKT3 | AKT3 | AKT3 | 7335 | 0.016 | 0.44 | NO |
| 44 | PSMB6 | PSMB6 | PSMB6 | 7589 | 0.013 | 0.42 | NO |
| 45 | AKT1S1 | AKT1S1 | AKT1S1 | 7629 | 0.012 | 0.42 | NO |
| 46 | RICTOR | RICTOR | RICTOR | 7667 | 0.012 | 0.42 | NO |
| 47 | PSMD2 | PSMD2 | PSMD2 | 7871 | 0.0098 | 0.41 | NO |
| 48 | CDKN1B | CDKN1B | CDKN1B | 7909 | 0.0094 | 0.41 | NO |
| 49 | PSMC5 | PSMC5 | PSMC5 | 7970 | 0.0088 | 0.41 | NO |
| 50 | PSMD12 | PSMD12 | PSMD12 | 7986 | 0.0087 | 0.41 | NO |
| 51 | CREB1 | CREB1 | CREB1 | 8094 | 0.0075 | 0.41 | NO |
| 52 | PSMA1 | PSMA1 | PSMA1 | 8113 | 0.0073 | 0.41 | NO |
| 53 | PSMD6 | PSMD6 | PSMD6 | 8119 | 0.0072 | 0.41 | NO |
| 54 | PSMD10 | PSMD10 | PSMD10 | 8153 | 0.0069 | 0.41 | NO |
| 55 | BCL10 | BCL10 | BCL10 | 8236 | 0.0061 | 0.4 | NO |
| 56 | PSMB7 | PSMB7 | PSMB7 | 8251 | 0.0059 | 0.4 | NO |
| 57 | PSMA7 | PSMA7 | PSMA7 | 8557 | 0.0027 | 0.39 | NO |
| 58 | MAPKAP1 | MAPKAP1 | MAPKAP1 | 8600 | 0.0021 | 0.38 | NO |
| 59 | PSMD8 | PSMD8 | PSMD8 | 8638 | 0.0016 | 0.38 | NO |
| 60 | PSMC3 | PSMC3 | PSMC3 | 8679 | 0.0012 | 0.38 | NO |
| 61 | MAP3K7 | MAP3K7 | MAP3K7 | 8695 | 0.0011 | 0.38 | NO |
| 62 | PSME4 | PSME4 | PSME4 | 8840 | -0.00024 | 0.37 | NO |
| 63 | PSMD9 | PSMD9 | PSMD9 | 8841 | -0.00024 | 0.37 | NO |
| 64 | PSMB5 | PSMB5 | PSMB5 | 8900 | -0.00083 | 0.37 | NO |
| 65 | BTRC | BTRC | BTRC | 8924 | -0.001 | 0.37 | NO |
| 66 | RELA | RELA | RELA | 8928 | -0.001 | 0.37 | NO |
| 67 | CUL1 | CUL1 | CUL1 | 8957 | -0.0014 | 0.37 | NO |
| 68 | REL | REL | REL | 9239 | -0.0043 | 0.35 | NO |
| 69 | GSK3A | GSK3A | GSK3A | 9513 | -0.0068 | 0.34 | NO |
| 70 | PSMB3 | PSMB3 | PSMB3 | 10223 | -0.014 | 0.3 | NO |
| 71 | FBXW11 | FBXW11 | FBXW11 | 10432 | -0.017 | 0.29 | NO |
| 72 | NR4A1 | NR4A1 | NR4A1 | 10434 | -0.017 | 0.29 | NO |
| 73 | PSMC2 | PSMC2 | PSMC2 | 10488 | -0.017 | 0.29 | NO |
| 74 | TSC2 | TSC2 | TSC2 | 10497 | -0.017 | 0.3 | NO |
| 75 | PSMB4 | PSMB4 | PSMB4 | 10694 | -0.019 | 0.29 | NO |
| 76 | PSMD4 | PSMD4 | PSMD4 | 11111 | -0.024 | 0.27 | NO |
| 77 | SKP1 | SKP1 | SKP1 | 11147 | -0.024 | 0.27 | NO |
| 78 | PSMD5 | PSMD5 | PSMD5 | 11318 | -0.026 | 0.27 | NO |
| 79 | PTEN | PTEN | PTEN | 11984 | -0.034 | 0.23 | NO |
| 80 | PDPK1 | PDPK1 | PDPK1 | 12034 | -0.035 | 0.24 | NO |
| 81 | PSMC1 | PSMC1 | PSMC1 | 12144 | -0.036 | 0.24 | NO |
| 82 | IKBKB | IKBKB | IKBKB | 12216 | -0.037 | 0.24 | NO |
| 83 | PSMD3 | PSMD3 | PSMD3 | 12250 | -0.038 | 0.24 | NO |
| 84 | HRAS | HRAS | HRAS | 12316 | -0.039 | 0.24 | NO |
| 85 | PSMC6 | PSMC6 | PSMC6 | 12403 | -0.04 | 0.25 | NO |
| 86 | MLST8 | MLST8 | MLST8 | 12408 | -0.04 | 0.25 | NO |
| 87 | KRAS | KRAS | KRAS | 13082 | -0.05 | 0.22 | NO |
| 88 | AKT1 | AKT1 | AKT1 | 13673 | -0.061 | 0.2 | NO |
| 89 | BAD | BAD | BAD | 13941 | -0.066 | 0.2 | NO |
| 90 | MDM2 | MDM2 | MDM2 | 14057 | -0.069 | 0.2 | NO |
| 91 | CDKN1A | CDKN1A | CDKN1A | 14521 | -0.08 | 0.18 | NO |
| 92 | PHLPP1 | PHLPP1 | PHLPP1 | 16100 | -0.14 | 0.12 | NO |
Figure S127. Get High-res Image This plot shows mRNAseq_cNMF expression data heatmap (on the left) a RunningEnrichmentScore(RES) plot (on the top right) and a Signal2Noise(S2N) plot (on the bottom right) of genes in the pathway: KEGG ETHER LIPID METABOLISM.

Figure S128. Get High-res Image For the top 5 core enriched genes in the pathway: KEGG ETHER LIPID METABOLISM, this volcano plot shows how much they are up/down-regulated and significant. The significance was calculated by empirical bayesian fit

Table S65. Get Full Table This table shows a Running Enrichment Score (RES) of each gene in this pathway, that is, the enrichment score at this point in the ranked list of genes. All genes are ranked by Signal-to-Noise (S2N), a measure of similarity as default and are used to obtain ES matrix of all genes. In this way, GSEA tool uses expression pattern of not only overlapped genes but also not-overlapped genes to produce ES matrix.
| Rank | GENE | SYMBOL | DESC | LIST.LOC | S2N | RES | CORE_ENRICHMENT |
|---|---|---|---|---|---|---|---|
| 1 | IFNG | IFNG | IFNG | 32 | 0.95 | 0.02 | YES |
| 2 | IRF4 | IRF4 | IRF4 | 122 | 0.83 | 0.034 | YES |
| 3 | IL2RA | IL2RA | IL2RA | 151 | 0.8 | 0.05 | YES |
| 4 | LCK | LCK | LCK | 159 | 0.8 | 0.068 | YES |
| 5 | IL7R | IL7R | IL7R | 224 | 0.74 | 0.082 | YES |
| 6 | GBP7 | GBP7 | GBP7 | 263 | 0.7 | 0.095 | YES |
| 7 | IL2RB | IL2RB | IL2RB | 273 | 0.69 | 0.11 | YES |
| 8 | GBP5 | GBP5 | GBP5 | 274 | 0.69 | 0.13 | YES |
| 9 | IL2RG | IL2RG | IL2RG | 276 | 0.69 | 0.14 | YES |
| 10 | IL2 | IL2 | IL2 | 291 | 0.67 | 0.16 | YES |
| 11 | JAK3 | JAK3 | JAK3 | 319 | 0.65 | 0.17 | YES |
| 12 | SOCS1 | SOCS1 | SOCS1 | 412 | 0.58 | 0.18 | YES |
| 13 | IRF8 | IRF8 | IRF8 | 418 | 0.58 | 0.19 | YES |
| 14 | GBP4 | GBP4 | GBP4 | 428 | 0.57 | 0.2 | YES |
| 15 | IL1R2 | IL1R2 | IL1R2 | 435 | 0.57 | 0.22 | YES |
| 16 | CIITA | CIITA | CIITA | 453 | 0.56 | 0.23 | YES |
| 17 | OASL | OASL | OASL | 457 | 0.55 | 0.24 | YES |
| 18 | CSF2RB | CSF2RB | CSF2RB | 476 | 0.53 | 0.25 | YES |
| 19 | VAV1 | VAV1 | VAV1 | 507 | 0.52 | 0.26 | YES |
| 20 | IL7 | IL7 | IL7 | 518 | 0.51 | 0.27 | YES |
| 21 | GBP6 | GBP6 | GBP6 | 531 | 0.5 | 0.28 | YES |
| 22 | PTAFR | PTAFR | PTAFR | 538 | 0.5 | 0.29 | YES |
| 23 | CSF2RA | CSF2RA | CSF2RA | 576 | 0.48 | 0.3 | YES |
| 24 | HLA-DQA1 | HLA-DQA1 | HLA-DQA1 | 627 | 0.46 | 0.31 | YES |
| 25 | PIK3CD | PIK3CD | PIK3CD | 635 | 0.46 | 0.32 | YES |
| 26 | GBP1 | GBP1 | GBP1 | 689 | 0.43 | 0.33 | YES |
| 27 | IL18 | IL18 | IL18 | 694 | 0.43 | 0.34 | YES |
| 28 | HLA-DQA2 | HLA-DQA2 | HLA-DQA2 | 695 | 0.43 | 0.35 | YES |
| 29 | ISG20 | ISG20 | ISG20 | 702 | 0.43 | 0.36 | YES |
| 30 | IFIT3 | IFIT3 | IFIT3 | 710 | 0.42 | 0.36 | YES |
| 31 | IL6R | IL6R | IL6R | 725 | 0.41 | 0.37 | YES |
| 32 | IL5RA | IL5RA | IL5RA | 740 | 0.41 | 0.38 | YES |
| 33 | HERC5 | HERC5 | HERC5 | 770 | 0.4 | 0.39 | YES |
| 34 | IFIT2 | IFIT2 | IFIT2 | 791 | 0.39 | 0.4 | YES |
| 35 | XAF1 | XAF1 | XAF1 | 800 | 0.39 | 0.4 | YES |
| 36 | IFIT1 | IFIT1 | IFIT1 | 815 | 0.38 | 0.41 | YES |
| 37 | CASP1 | CASP1 | CASP1 | 826 | 0.38 | 0.42 | YES |
| 38 | HLA-DRB5 | HLA-DRB5 | HLA-DRB5 | 832 | 0.38 | 0.43 | YES |
| 39 | FCGR1A | FCGR1A | FCGR1A | 841 | 0.37 | 0.44 | YES |
| 40 | MX1 | MX1 | MX1 | 847 | 0.37 | 0.45 | YES |
| 41 | GH1 | GH1 | GH1 | 857 | 0.37 | 0.45 | YES |
| 42 | VCAM1 | VCAM1 | VCAM1 | 874 | 0.36 | 0.46 | YES |
| 43 | IL3RA | IL3RA | IL3RA | 885 | 0.36 | 0.47 | YES |
| 44 | OAS2 | OAS2 | OAS2 | 904 | 0.36 | 0.48 | YES |
| 45 | HLA-F | HLA-F | HLA-F | 917 | 0.35 | 0.48 | YES |
| 46 | ISG15 | ISG15 | ISG15 | 921 | 0.35 | 0.49 | YES |
| 47 | MX2 | MX2 | MX2 | 937 | 0.34 | 0.5 | YES |
| 48 | FCGR1B | FCGR1B | FCGR1B | 939 | 0.34 | 0.5 | YES |
| 49 | HLA-G | HLA-G | HLA-G | 947 | 0.34 | 0.51 | YES |
| 50 | HLA-DRB1 | HLA-DRB1 | HLA-DRB1 | 949 | 0.34 | 0.52 | YES |
| 51 | HCK | HCK | HCK | 950 | 0.34 | 0.53 | YES |
| 52 | IL6 | IL6 | IL6 | 1005 | 0.33 | 0.53 | YES |
| 53 | IFNB1 | IFNB1 | IFNB1 | 1052 | 0.32 | 0.54 | YES |
| 54 | STAT1 | STAT1 | STAT1 | 1064 | 0.31 | 0.54 | YES |
| 55 | IRF1 | IRF1 | IRF1 | 1073 | 0.31 | 0.55 | YES |
| 56 | GBP2 | GBP2 | GBP2 | 1077 | 0.31 | 0.56 | YES |
| 57 | OAS1 | OAS1 | OAS1 | 1079 | 0.31 | 0.56 | YES |
| 58 | FYN | FYN | FYN | 1084 | 0.31 | 0.57 | YES |
| 59 | HLA-DPA1 | HLA-DPA1 | HLA-DPA1 | 1103 | 0.3 | 0.58 | YES |
| 60 | HLA-DPB1 | HLA-DPB1 | HLA-DPB1 | 1122 | 0.3 | 0.58 | YES |
| 61 | NOD2 | NOD2 | NOD2 | 1126 | 0.3 | 0.59 | YES |
| 62 | IFI6 | IFI6 | IFI6 | 1185 | 0.28 | 0.59 | YES |
| 63 | PTK2B | PTK2B | PTK2B | 1204 | 0.28 | 0.6 | YES |
| 64 | IFI27 | IFI27 | IFI27 | 1257 | 0.27 | 0.6 | YES |
| 65 | TEC | TEC | TEC | 1261 | 0.27 | 0.61 | YES |
| 66 | IRF7 | IRF7 | IRF7 | 1268 | 0.27 | 0.61 | YES |
| 67 | PSMB8 | PSMB8 | PSMB8 | 1276 | 0.27 | 0.62 | YES |
| 68 | SYK | SYK | SYK | 1283 | 0.27 | 0.62 | YES |
| 69 | UBE2L6 | UBE2L6 | UBE2L6 | 1298 | 0.27 | 0.63 | YES |
| 70 | BLNK | BLNK | BLNK | 1327 | 0.26 | 0.63 | YES |
| 71 | IFITM1 | IFITM1 | IFITM1 | 1335 | 0.26 | 0.64 | YES |
| 72 | HGF | HGF | HGF | 1343 | 0.26 | 0.64 | YES |
| 73 | IRAK2 | IRAK2 | IRAK2 | 1388 | 0.25 | 0.65 | YES |
| 74 | CSF2 | CSF2 | CSF2 | 1391 | 0.25 | 0.65 | YES |
| 75 | UBA7 | UBA7 | UBA7 | 1396 | 0.25 | 0.66 | YES |
| 76 | LYN | LYN | LYN | 1413 | 0.24 | 0.66 | YES |
| 77 | HLA-B | HLA-B | HLA-B | 1427 | 0.24 | 0.67 | YES |
| 78 | OAS3 | OAS3 | OAS3 | 1446 | 0.24 | 0.67 | YES |
| 79 | USP18 | USP18 | USP18 | 1465 | 0.24 | 0.68 | YES |
| 80 | IFI35 | IFI35 | IFI35 | 1497 | 0.23 | 0.68 | YES |
| 81 | DDX58 | DDX58 | DDX58 | 1503 | 0.23 | 0.69 | YES |
| 82 | IL1RN | IL1RN | IL1RN | 1509 | 0.23 | 0.69 | YES |
| 83 | IRF9 | IRF9 | IRF9 | 1569 | 0.22 | 0.69 | YES |
| 84 | HLA-A | HLA-A | HLA-A | 1573 | 0.22 | 0.7 | YES |
| 85 | STAT5A | STAT5A | STAT5A | 1606 | 0.22 | 0.7 | YES |
| 86 | B2M | B2M | B2M | 1616 | 0.21 | 0.71 | YES |
| 87 | PTPN6 | PTPN6 | PTPN6 | 1636 | 0.21 | 0.71 | YES |
| 88 | JAK2 | JAK2 | JAK2 | 1657 | 0.21 | 0.71 | YES |
| 89 | IL1B | IL1B | IL1B | 1706 | 0.2 | 0.72 | YES |
| 90 | SP100 | SP100 | SP100 | 1723 | 0.2 | 0.72 | YES |
| 91 | IFNAR2 | IFNAR2 | IFNAR2 | 1734 | 0.2 | 0.72 | YES |
| 92 | HLA-C | HLA-C | HLA-C | 1755 | 0.2 | 0.73 | YES |
| 93 | ICAM1 | ICAM1 | ICAM1 | 1764 | 0.2 | 0.73 | YES |
| 94 | IRF5 | IRF5 | IRF5 | 1872 | 0.18 | 0.73 | YES |
| 95 | NFKB2 | NFKB2 | NFKB2 | 1884 | 0.18 | 0.73 | YES |
| 96 | IRAK3 | IRAK3 | IRAK3 | 1936 | 0.17 | 0.73 | YES |
| 97 | STAT2 | STAT2 | STAT2 | 1971 | 0.17 | 0.74 | YES |
| 98 | MAP3K8 | MAP3K8 | MAP3K8 | 2032 | 0.16 | 0.74 | YES |
| 99 | IRF3 | IRF3 | IRF3 | 2131 | 0.16 | 0.73 | NO |
| 100 | MT2A | MT2A | MT2A | 2319 | 0.14 | 0.73 | NO |
| 101 | EIF2AK2 | EIF2AK2 | EIF2AK2 | 2335 | 0.14 | 0.73 | NO |
| 102 | GHR | GHR | GHR | 2392 | 0.14 | 0.73 | NO |
| 103 | NOD1 | NOD1 | NOD1 | 2578 | 0.12 | 0.72 | NO |
| 104 | KPNA5 | KPNA5 | KPNA5 | 2584 | 0.12 | 0.72 | NO |
| 105 | IFITM3 | IFITM3 | IFITM3 | 2678 | 0.12 | 0.72 | NO |
| 106 | GRB2 | GRB2 | GRB2 | 2705 | 0.12 | 0.72 | NO |
| 107 | SOCS3 | SOCS3 | SOCS3 | 2829 | 0.11 | 0.72 | NO |
| 108 | PML | PML | PML | 2850 | 0.11 | 0.72 | NO |
| 109 | CAMK2D | CAMK2D | CAMK2D | 2903 | 0.11 | 0.72 | NO |
| 110 | STAT5B | STAT5B | STAT5B | 2946 | 0.1 | 0.72 | NO |
| 111 | MAP2K6 | MAP2K6 | MAP2K6 | 2961 | 0.1 | 0.72 | NO |
| 112 | RAPGEF1 | RAPGEF1 | RAPGEF1 | 2991 | 0.1 | 0.72 | NO |
| 113 | PLCG1 | PLCG1 | PLCG1 | 3008 | 0.1 | 0.72 | NO |
| 114 | IL1R1 | IL1R1 | IL1R1 | 3079 | 0.098 | 0.72 | NO |
| 115 | PRKACB | PRKACB | PRKACB | 3211 | 0.093 | 0.72 | NO |
| 116 | MYD88 | MYD88 | MYD88 | 3303 | 0.089 | 0.71 | NO |
| 117 | PTPN2 | PTPN2 | PTPN2 | 3446 | 0.084 | 0.71 | NO |
| 118 | CHUK | CHUK | CHUK | 3492 | 0.083 | 0.71 | NO |
| 119 | IRF2 | IRF2 | IRF2 | 3591 | 0.08 | 0.7 | NO |
| 120 | NUP93 | NUP93 | NUP93 | 3658 | 0.078 | 0.7 | NO |
| 121 | TYK2 | TYK2 | TYK2 | 3674 | 0.078 | 0.7 | NO |
| 122 | CDK1 | CDK1 | CDK1 | 3723 | 0.076 | 0.7 | NO |
| 123 | SOCS2 | SOCS2 | SOCS2 | 3814 | 0.073 | 0.7 | NO |
| 124 | TAB2 | TAB2 | TAB2 | 3865 | 0.071 | 0.7 | NO |
| 125 | NUP62 | NUP62 | NUP62 | 3942 | 0.069 | 0.69 | NO |
| 126 | NUP210 | NUP210 | NUP210 | 4140 | 0.064 | 0.68 | NO |
| 127 | NUP54 | NUP54 | NUP54 | 4550 | 0.056 | 0.66 | NO |
| 128 | TRIM25 | TRIM25 | TRIM25 | 4560 | 0.056 | 0.66 | NO |
| 129 | MAP3K3 | MAP3K3 | MAP3K3 | 4640 | 0.054 | 0.66 | NO |
| 130 | GAB2 | GAB2 | GAB2 | 4649 | 0.054 | 0.66 | NO |
| 131 | NRAS | NRAS | NRAS | 4699 | 0.053 | 0.66 | NO |
| 132 | CISH | CISH | CISH | 4700 | 0.053 | 0.66 | NO |
| 133 | CBL | CBL | CBL | 4701 | 0.053 | 0.66 | NO |
| 134 | RIPK2 | RIPK2 | RIPK2 | 4814 | 0.051 | 0.66 | NO |
| 135 | PTPN1 | PTPN1 | PTPN1 | 4816 | 0.05 | 0.66 | NO |
| 136 | MAP2K1 | MAP2K1 | MAP2K1 | 4916 | 0.049 | 0.65 | NO |
| 137 | ADAR | ADAR | ADAR | 5046 | 0.046 | 0.65 | NO |
| 138 | UBA52 | UBA52 | UBA52 | 5070 | 0.046 | 0.65 | NO |
| 139 | IFNGR1 | IFNGR1 | IFNGR1 | 5093 | 0.046 | 0.65 | NO |
| 140 | TNIP2 | TNIP2 | TNIP2 | 5113 | 0.045 | 0.65 | NO |
| 141 | IRAK4 | IRAK4 | IRAK4 | 5160 | 0.044 | 0.64 | NO |
| 142 | IKBKG | IKBKG | IKBKG | 5202 | 0.043 | 0.64 | NO |
| 143 | YWHAZ | YWHAZ | YWHAZ | 5235 | 0.043 | 0.64 | NO |
| 144 | NUPL2 | NUPL2 | NUPL2 | 5344 | 0.041 | 0.64 | NO |
| 145 | JAK1 | JAK1 | JAK1 | 5416 | 0.04 | 0.64 | NO |
| 146 | RPS27A | RPS27A | RPS27A | 5423 | 0.04 | 0.64 | NO |
| 147 | KPNA2 | KPNA2 | KPNA2 | 5437 | 0.04 | 0.64 | NO |
| 148 | EIF4E3 | EIF4E3 | EIF4E3 | 5578 | 0.038 | 0.63 | NO |
| 149 | UBE2N | UBE2N | UBE2N | 5621 | 0.037 | 0.63 | NO |
| 150 | KPNB1 | KPNB1 | KPNB1 | 5631 | 0.037 | 0.63 | NO |
| 151 | RNASEL | RNASEL | RNASEL | 5705 | 0.036 | 0.62 | NO |
| 152 | IFNGR2 | IFNGR2 | IFNGR2 | 5715 | 0.036 | 0.62 | NO |
| 153 | CD44 | CD44 | CD44 | 5733 | 0.035 | 0.62 | NO |
| 154 | PRKCD | PRKCD | PRKCD | 5815 | 0.034 | 0.62 | NO |
| 155 | NUP153 | NUP153 | NUP153 | 6113 | 0.03 | 0.6 | NO |
| 156 | PRLR | PRLR | PRLR | 6351 | 0.027 | 0.59 | NO |
| 157 | EIF4A3 | EIF4A3 | EIF4A3 | 6444 | 0.026 | 0.59 | NO |
| 158 | IFITM2 | IFITM2 | IFITM2 | 6445 | 0.026 | 0.59 | NO |
| 159 | SOS1 | SOS1 | SOS1 | 6448 | 0.026 | 0.59 | NO |
| 160 | IL6ST | IL6ST | IL6ST | 6450 | 0.026 | 0.59 | NO |
| 161 | PIK3CA | PIK3CA | PIK3CA | 6468 | 0.026 | 0.59 | NO |
| 162 | PIAS1 | PIAS1 | PIAS1 | 6546 | 0.025 | 0.59 | NO |
| 163 | NUP85 | NUP85 | NUP85 | 6601 | 0.024 | 0.58 | NO |
| 164 | EIF4E | EIF4E | EIF4E | 6700 | 0.023 | 0.58 | NO |
| 165 | NUP43 | NUP43 | NUP43 | 6779 | 0.022 | 0.57 | NO |
| 166 | MAPK1 | MAPK1 | MAPK1 | 6797 | 0.022 | 0.57 | NO |
| 167 | KPNA1 | KPNA1 | KPNA1 | 6834 | 0.021 | 0.57 | NO |
| 168 | AAAS | AAAS | AAAS | 6925 | 0.02 | 0.57 | NO |
| 169 | CRKL | CRKL | CRKL | 6965 | 0.02 | 0.57 | NO |
| 170 | EIF4E2 | EIF4E2 | EIF4E2 | 6975 | 0.02 | 0.57 | NO |
| 171 | EIF4A1 | EIF4A1 | EIF4A1 | 6996 | 0.019 | 0.57 | NO |
| 172 | NUP35 | NUP35 | NUP35 | 7178 | 0.018 | 0.56 | NO |
| 173 | YWHAB | YWHAB | YWHAB | 7269 | 0.016 | 0.55 | NO |
| 174 | PIN1 | PIN1 | PIN1 | 7305 | 0.016 | 0.55 | NO |
| 175 | TAB3 | TAB3 | TAB3 | 7339 | 0.016 | 0.55 | NO |
| 176 | IFNAR1 | IFNAR1 | IFNAR1 | 7344 | 0.016 | 0.55 | NO |
| 177 | PIK3R3 | PIK3R3 | PIK3R3 | 7443 | 0.014 | 0.54 | NO |
| 178 | EIF4G1 | EIF4G1 | EIF4G1 | 7521 | 0.014 | 0.54 | NO |
| 179 | NUP188 | NUP188 | NUP188 | 7687 | 0.012 | 0.53 | NO |
| 180 | NUP88 | NUP88 | NUP88 | 7717 | 0.011 | 0.53 | NO |
| 181 | SUMO1 | SUMO1 | SUMO1 | 7809 | 0.01 | 0.52 | NO |
| 182 | NUP107 | NUP107 | NUP107 | 7908 | 0.0094 | 0.52 | NO |
| 183 | EIF4A2 | EIF4A2 | EIF4A2 | 7972 | 0.0088 | 0.52 | NO |
| 184 | NUP37 | NUP37 | NUP37 | 8005 | 0.0085 | 0.51 | NO |
| 185 | STAT3 | STAT3 | STAT3 | 8028 | 0.0083 | 0.51 | NO |
| 186 | NUP155 | NUP155 | NUP155 | 8137 | 0.007 | 0.51 | NO |
| 187 | TAB1 | TAB1 | TAB1 | 8158 | 0.0068 | 0.51 | NO |
| 188 | RBX1 | RBX1 | RBX1 | 8163 | 0.0068 | 0.51 | NO |
| 189 | EIF4G2 | EIF4G2 | EIF4G2 | 8192 | 0.0065 | 0.5 | NO |
| 190 | PPM1B | PPM1B | PPM1B | 8275 | 0.0056 | 0.5 | NO |
| 191 | RAE1 | RAE1 | RAE1 | 8297 | 0.0055 | 0.5 | NO |
| 192 | NUP50 | NUP50 | NUP50 | 8415 | 0.0042 | 0.49 | NO |
| 193 | NCAM1 | NCAM1 | NCAM1 | 8432 | 0.004 | 0.49 | NO |
| 194 | RAF1 | RAF1 | RAF1 | 8483 | 0.0035 | 0.49 | NO |
| 195 | PELI1 | PELI1 | PELI1 | 8603 | 0.0021 | 0.48 | NO |
| 196 | POM121 | POM121 | POM121 | 8658 | 0.0014 | 0.48 | NO |
| 197 | MAP3K7 | MAP3K7 | MAP3K7 | 8695 | 0.0011 | 0.48 | NO |
| 198 | MAP2K2 | MAP2K2 | MAP2K2 | 8807 | 0.000046 | 0.47 | NO |
| 199 | KPNA3 | KPNA3 | KPNA3 | 8853 | -0.00034 | 0.47 | NO |
| 200 | KPNA4 | KPNA4 | KPNA4 | 8880 | -0.00064 | 0.47 | NO |
| 201 | BTRC | BTRC | BTRC | 8924 | -0.001 | 0.47 | NO |
| 202 | RELA | RELA | RELA | 8928 | -0.001 | 0.46 | NO |
| 203 | IRAK1 | IRAK1 | IRAK1 | 8933 | -0.0011 | 0.46 | NO |
| 204 | CUL1 | CUL1 | CUL1 | 8957 | -0.0014 | 0.46 | NO |
| 205 | INPPL1 | INPPL1 | INPPL1 | 9282 | -0.0048 | 0.45 | NO |
| 206 | NUP214 | NUP214 | NUP214 | 9409 | -0.0059 | 0.44 | NO |
| 207 | UBE2E1 | UBE2E1 | UBE2E1 | 9450 | -0.0063 | 0.44 | NO |
| 208 | EIF4G3 | EIF4G3 | EIF4G3 | 9543 | -0.0071 | 0.43 | NO |
| 209 | NUP205 | NUP205 | NUP205 | 9626 | -0.0082 | 0.43 | NO |
| 210 | EGR1 | EGR1 | EGR1 | 9643 | -0.0084 | 0.43 | NO |
| 211 | TPR | TPR | TPR | 9700 | -0.009 | 0.42 | NO |
| 212 | RANBP2 | RANBP2 | RANBP2 | 9850 | -0.01 | 0.42 | NO |
| 213 | PIK3CB | PIK3CB | PIK3CB | 9877 | -0.01 | 0.42 | NO |
| 214 | NUP133 | NUP133 | NUP133 | 10062 | -0.013 | 0.4 | NO |
| 215 | TRAF6 | TRAF6 | TRAF6 | 10201 | -0.014 | 0.4 | NO |
| 216 | IRS1 | IRS1 | IRS1 | 10273 | -0.015 | 0.39 | NO |
| 217 | IP6K2 | IP6K2 | IP6K2 | 10334 | -0.016 | 0.39 | NO |
| 218 | IL1A | IL1A | IL1A | 10436 | -0.017 | 0.39 | NO |
| 219 | PIK3R2 | PIK3R2 | PIK3R2 | 10442 | -0.017 | 0.39 | NO |
| 220 | ARIH1 | ARIH1 | ARIH1 | 10859 | -0.021 | 0.36 | NO |
| 221 | SKP1 | SKP1 | SKP1 | 11147 | -0.024 | 0.35 | NO |
| 222 | SQSTM1 | SQSTM1 | SQSTM1 | 11279 | -0.026 | 0.34 | NO |
| 223 | MAPK3 | MAPK3 | MAPK3 | 11362 | -0.027 | 0.34 | NO |
| 224 | TOLLIP | TOLLIP | TOLLIP | 11600 | -0.03 | 0.32 | NO |
| 225 | ADAM17 | ADAM17 | ADAM17 | 11677 | -0.031 | 0.32 | NO |
| 226 | IKBKB | IKBKB | IKBKB | 12216 | -0.037 | 0.29 | NO |
| 227 | PIK3R1 | PIK3R1 | PIK3R1 | 12279 | -0.038 | 0.29 | NO |
| 228 | HRAS | HRAS | HRAS | 12316 | -0.039 | 0.29 | NO |
| 229 | TMEM189-UBE2V1 | TMEM189-UBE2V1 | TMEM189-UBE2V1 | 12412 | -0.04 | 0.28 | NO |
| 230 | FLNB | FLNB | FLNB | 12847 | -0.047 | 0.26 | NO |
| 231 | SH2B1 | SH2B1 | SH2B1 | 12864 | -0.047 | 0.26 | NO |
| 232 | CRK | CRK | CRK | 12877 | -0.048 | 0.26 | NO |
| 233 | SEH1L | SEH1L | SEH1L | 12977 | -0.049 | 0.26 | NO |
| 234 | KRAS | KRAS | KRAS | 13082 | -0.05 | 0.25 | NO |
| 235 | CAMK2B | CAMK2B | CAMK2B | 13685 | -0.061 | 0.22 | NO |
| 236 | NEDD4 | NEDD4 | NEDD4 | 14123 | -0.07 | 0.2 | NO |
| 237 | SHC1 | SHC1 | SHC1 | 14128 | -0.07 | 0.2 | NO |
| 238 | YES1 | YES1 | YES1 | 14385 | -0.076 | 0.19 | NO |
| 239 | NUPL1 | NUPL1 | NUPL1 | 14404 | -0.077 | 0.19 | NO |
| 240 | MAP2K4 | MAP2K4 | MAP2K4 | 14585 | -0.081 | 0.18 | NO |
| 241 | PELI3 | PELI3 | PELI3 | 14640 | -0.083 | 0.18 | NO |
| 242 | CAMK2A | CAMK2A | CAMK2A | 14696 | -0.084 | 0.18 | NO |
| 243 | PELI2 | PELI2 | PELI2 | 14933 | -0.092 | 0.17 | NO |
| 244 | IL1RAP | IL1RAP | IL1RAP | 15767 | -0.12 | 0.12 | NO |
| 245 | PRL | PRL | PRL | 16856 | -0.18 | 0.067 | NO |
| 246 | IRF6 | IRF6 | IRF6 | 17399 | -0.23 | 0.042 | NO |
| 247 | IRS2 | IRS2 | IRS2 | 17718 | -0.27 | 0.031 | NO |
Figure S129. Get High-res Image This plot shows mRNAseq_cNMF expression data heatmap (on the left) a RunningEnrichmentScore(RES) plot (on the top right) and a Signal2Noise(S2N) plot (on the bottom right) of genes in the pathway: KEGG RIBOSOME.
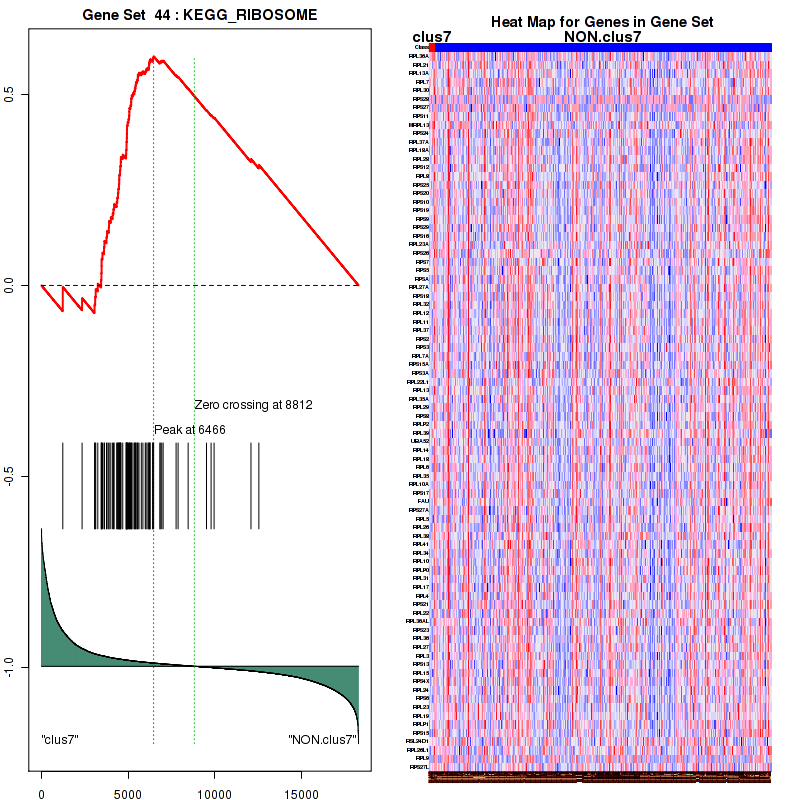
Figure S130. Get High-res Image For the top 5 core enriched genes in the pathway: KEGG RIBOSOME, this volcano plot shows how much they are up/down-regulated and significant. The significance was calculated by empirical bayesian fit

Table S66. Get Full Table This table shows a Running Enrichment Score (RES) of each gene in this pathway, that is, the enrichment score at this point in the ranked list of genes. All genes are ranked by Signal-to-Noise (S2N), a measure of similarity as default and are used to obtain ES matrix of all genes. In this way, GSEA tool uses expression pattern of not only overlapped genes but also not-overlapped genes to produce ES matrix.
| Rank | GENE | SYMBOL | DESC | LIST.LOC | S2N | RES | CORE_ENRICHMENT |
|---|---|---|---|---|---|---|---|
| 1 | NLRC5 | NLRC5 | NLRC5 | 582 | 0.48 | 0.032 | YES |
| 2 | HERC5 | HERC5 | HERC5 | 770 | 0.4 | 0.076 | YES |
| 3 | AGER | AGER | AGER | 797 | 0.39 | 0.13 | YES |
| 4 | TNFAIP3 | TNFAIP3 | TNFAIP3 | 905 | 0.35 | 0.17 | YES |
| 5 | ISG15 | ISG15 | ISG15 | 921 | 0.35 | 0.22 | YES |
| 6 | CASP10 | CASP10 | CASP10 | 924 | 0.35 | 0.26 | YES |
| 7 | IFNB1 | IFNB1 | IFNB1 | 1052 | 0.32 | 0.3 | YES |
| 8 | IRF1 | IRF1 | IRF1 | 1073 | 0.31 | 0.34 | YES |
| 9 | IFIH1 | IFIH1 | IFIH1 | 1134 | 0.3 | 0.37 | YES |
| 10 | IRF7 | IRF7 | IRF7 | 1268 | 0.27 | 0.4 | YES |
| 11 | UBE2L6 | UBE2L6 | UBE2L6 | 1298 | 0.27 | 0.44 | YES |
| 12 | UBA7 | UBA7 | UBA7 | 1396 | 0.25 | 0.46 | YES |
| 13 | DDX58 | DDX58 | DDX58 | 1503 | 0.23 | 0.49 | YES |
| 14 | S100A12 | S100A12 | S100A12 | 1517 | 0.23 | 0.52 | YES |
| 15 | DHX58 | DHX58 | DHX58 | 1574 | 0.22 | 0.55 | YES |
| 16 | NFKB2 | NFKB2 | NFKB2 | 1884 | 0.18 | 0.55 | YES |
| 17 | RNF125 | RNF125 | RNF125 | 1908 | 0.18 | 0.58 | YES |
| 18 | CYLD | CYLD | CYLD | 1916 | 0.18 | 0.6 | YES |
| 19 | S100B | S100B | S100B | 2040 | 0.16 | 0.62 | YES |
| 20 | IRF3 | IRF3 | IRF3 | 2131 | 0.16 | 0.63 | YES |
| 21 | CASP8 | CASP8 | CASP8 | 2159 | 0.15 | 0.65 | YES |
| 22 | IKBKE | IKBKE | IKBKE | 2289 | 0.14 | 0.66 | YES |
| 23 | TRAF3 | TRAF3 | TRAF3 | 2566 | 0.12 | 0.66 | YES |
| 24 | NFKBIA | NFKBIA | NFKBIA | 3283 | 0.09 | 0.64 | NO |
| 25 | CHUK | CHUK | CHUK | 3492 | 0.083 | 0.64 | NO |
| 26 | NFKBIB | NFKBIB | NFKBIB | 3513 | 0.083 | 0.65 | NO |
| 27 | IRF2 | IRF2 | IRF2 | 3591 | 0.08 | 0.65 | NO |
| 28 | UBE2D1 | UBE2D1 | UBE2D1 | 4214 | 0.063 | 0.63 | NO |
| 29 | ATG5 | ATG5 | ATG5 | 4426 | 0.058 | 0.62 | NO |
| 30 | TRAF2 | TRAF2 | TRAF2 | 4429 | 0.058 | 0.63 | NO |
| 31 | TRIM25 | TRIM25 | TRIM25 | 4560 | 0.056 | 0.63 | NO |
| 32 | MAP3K1 | MAP3K1 | MAP3K1 | 4937 | 0.048 | 0.62 | NO |
| 33 | UBA52 | UBA52 | UBA52 | 5070 | 0.046 | 0.62 | NO |
| 34 | FADD | FADD | FADD | 5194 | 0.044 | 0.62 | NO |
| 35 | IKBKG | IKBKG | IKBKG | 5202 | 0.043 | 0.62 | NO |
| 36 | RIPK1 | RIPK1 | RIPK1 | 5254 | 0.043 | 0.62 | NO |
| 37 | TBK1 | TBK1 | TBK1 | 5383 | 0.041 | 0.62 | NO |
| 38 | RPS27A | RPS27A | RPS27A | 5423 | 0.04 | 0.62 | NO |
| 39 | HMGB1 | HMGB1 | HMGB1 | 5726 | 0.036 | 0.61 | NO |
| 40 | OTUD5 | OTUD5 | OTUD5 | 6355 | 0.027 | 0.58 | NO |
| 41 | PIN1 | PIN1 | PIN1 | 7305 | 0.016 | 0.53 | NO |
| 42 | UBE2D3 | UBE2D3 | UBE2D3 | 7449 | 0.014 | 0.53 | NO |
| 43 | TANK | TANK | TANK | 7502 | 0.014 | 0.53 | NO |
| 44 | UBE2K | UBE2K | UBE2K | 7801 | 0.011 | 0.51 | NO |
| 45 | PCBP2 | PCBP2 | PCBP2 | 8140 | 0.007 | 0.49 | NO |
| 46 | MAVS | MAVS | MAVS | 8406 | 0.0043 | 0.48 | NO |
| 47 | RELA | RELA | RELA | 8928 | -0.001 | 0.45 | NO |
| 48 | UBE2D2 | UBE2D2 | UBE2D2 | 9144 | -0.0033 | 0.44 | NO |
| 49 | SIKE1 | SIKE1 | SIKE1 | 9482 | -0.0066 | 0.42 | NO |
| 50 | ATG12 | ATG12 | ATG12 | 9727 | -0.0091 | 0.41 | NO |
| 51 | EP300 | EP300 | EP300 | 9770 | -0.0095 | 0.41 | NO |
| 52 | TRAF6 | TRAF6 | TRAF6 | 10201 | -0.014 | 0.39 | NO |
| 53 | CREBBP | CREBBP | CREBBP | 10283 | -0.015 | 0.38 | NO |
| 54 | RNF135 | RNF135 | RNF135 | 10345 | -0.016 | 0.38 | NO |
| 55 | DAK | DAK | DAK | 11167 | -0.024 | 0.34 | NO |
| 56 | IKBKB | IKBKB | IKBKB | 12216 | -0.037 | 0.29 | NO |
| 57 | TAX1BP1 | TAX1BP1 | TAX1BP1 | 12718 | -0.045 | 0.27 | NO |
| 58 | APP | APP | APP | 13187 | -0.052 | 0.25 | NO |
| 59 | NLRX1 | NLRX1 | NLRX1 | 15111 | -0.098 | 0.16 | NO |
| 60 | SAA1 | SAA1 | SAA1 | 15943 | -0.13 | 0.13 | NO |
Figure S131. Get High-res Image This plot shows mRNAseq_cNMF expression data heatmap (on the left) a RunningEnrichmentScore(RES) plot (on the top right) and a Signal2Noise(S2N) plot (on the bottom right) of genes in the pathway: KEGG PROTEASOME.
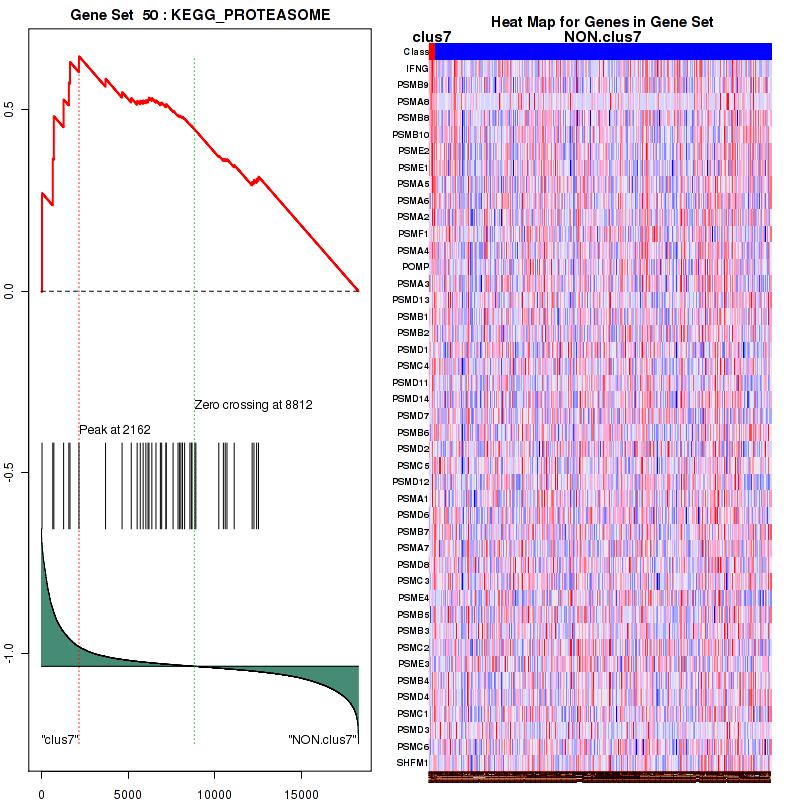
Figure S132. Get High-res Image For the top 5 core enriched genes in the pathway: KEGG PROTEASOME, this volcano plot shows how much they are up/down-regulated and significant. The significance was calculated by empirical bayesian fit

Table S67. Get Full Table This table shows a Running Enrichment Score (RES) of each gene in this pathway, that is, the enrichment score at this point in the ranked list of genes. All genes are ranked by Signal-to-Noise (S2N), a measure of similarity as default and are used to obtain ES matrix of all genes. In this way, GSEA tool uses expression pattern of not only overlapped genes but also not-overlapped genes to produce ES matrix.
| Rank | GENE | SYMBOL | DESC | LIST.LOC | S2N | RES | CORE_ENRICHMENT |
|---|---|---|---|---|---|---|---|
| 1 | IFNG | IFNG | IFNG | 32 | 0.95 | 0.036 | YES |
| 2 | IRF4 | IRF4 | IRF4 | 122 | 0.83 | 0.063 | YES |
| 3 | GBP7 | GBP7 | GBP7 | 263 | 0.7 | 0.083 | YES |
| 4 | GBP5 | GBP5 | GBP5 | 274 | 0.69 | 0.11 | YES |
| 5 | SOCS1 | SOCS1 | SOCS1 | 412 | 0.58 | 0.12 | YES |
| 6 | IRF8 | IRF8 | IRF8 | 418 | 0.58 | 0.15 | YES |
| 7 | GBP4 | GBP4 | GBP4 | 428 | 0.57 | 0.17 | YES |
| 8 | CIITA | CIITA | CIITA | 453 | 0.56 | 0.19 | YES |
| 9 | OASL | OASL | OASL | 457 | 0.55 | 0.21 | YES |
| 10 | GBP6 | GBP6 | GBP6 | 531 | 0.5 | 0.23 | YES |
| 11 | PTAFR | PTAFR | PTAFR | 538 | 0.5 | 0.24 | YES |
| 12 | HLA-DQA1 | HLA-DQA1 | HLA-DQA1 | 627 | 0.46 | 0.26 | YES |
| 13 | GBP1 | GBP1 | GBP1 | 689 | 0.43 | 0.27 | YES |
| 14 | HLA-DQA2 | HLA-DQA2 | HLA-DQA2 | 695 | 0.43 | 0.29 | YES |
| 15 | ISG20 | ISG20 | ISG20 | 702 | 0.43 | 0.3 | YES |
| 16 | IFIT3 | IFIT3 | IFIT3 | 710 | 0.42 | 0.32 | YES |
| 17 | HERC5 | HERC5 | HERC5 | 770 | 0.4 | 0.33 | YES |
| 18 | IFIT2 | IFIT2 | IFIT2 | 791 | 0.39 | 0.35 | YES |
| 19 | XAF1 | XAF1 | XAF1 | 800 | 0.39 | 0.36 | YES |
| 20 | IFIT1 | IFIT1 | IFIT1 | 815 | 0.38 | 0.38 | YES |
| 21 | HLA-DRB5 | HLA-DRB5 | HLA-DRB5 | 832 | 0.38 | 0.39 | YES |
| 22 | FCGR1A | FCGR1A | FCGR1A | 841 | 0.37 | 0.4 | YES |
| 23 | MX1 | MX1 | MX1 | 847 | 0.37 | 0.42 | YES |
| 24 | VCAM1 | VCAM1 | VCAM1 | 874 | 0.36 | 0.43 | YES |
| 25 | OAS2 | OAS2 | OAS2 | 904 | 0.36 | 0.44 | YES |
| 26 | HLA-F | HLA-F | HLA-F | 917 | 0.35 | 0.46 | YES |
| 27 | ISG15 | ISG15 | ISG15 | 921 | 0.35 | 0.47 | YES |
| 28 | MX2 | MX2 | MX2 | 937 | 0.34 | 0.48 | YES |
| 29 | FCGR1B | FCGR1B | FCGR1B | 939 | 0.34 | 0.5 | YES |
| 30 | HLA-G | HLA-G | HLA-G | 947 | 0.34 | 0.51 | YES |
| 31 | HLA-DRB1 | HLA-DRB1 | HLA-DRB1 | 949 | 0.34 | 0.52 | YES |
| 32 | IFNB1 | IFNB1 | IFNB1 | 1052 | 0.32 | 0.53 | YES |
| 33 | STAT1 | STAT1 | STAT1 | 1064 | 0.31 | 0.54 | YES |
| 34 | IRF1 | IRF1 | IRF1 | 1073 | 0.31 | 0.55 | YES |
| 35 | GBP2 | GBP2 | GBP2 | 1077 | 0.31 | 0.56 | YES |
| 36 | OAS1 | OAS1 | OAS1 | 1079 | 0.31 | 0.58 | YES |
| 37 | HLA-DPA1 | HLA-DPA1 | HLA-DPA1 | 1103 | 0.3 | 0.59 | YES |
| 38 | HLA-DPB1 | HLA-DPB1 | HLA-DPB1 | 1122 | 0.3 | 0.6 | YES |
| 39 | IFI6 | IFI6 | IFI6 | 1185 | 0.28 | 0.61 | YES |
| 40 | IFI27 | IFI27 | IFI27 | 1257 | 0.27 | 0.61 | YES |
| 41 | IRF7 | IRF7 | IRF7 | 1268 | 0.27 | 0.62 | YES |
| 42 | PSMB8 | PSMB8 | PSMB8 | 1276 | 0.27 | 0.63 | YES |
| 43 | UBE2L6 | UBE2L6 | UBE2L6 | 1298 | 0.27 | 0.64 | YES |
| 44 | IFITM1 | IFITM1 | IFITM1 | 1335 | 0.26 | 0.65 | YES |
| 45 | UBA7 | UBA7 | UBA7 | 1396 | 0.25 | 0.66 | YES |
| 46 | HLA-B | HLA-B | HLA-B | 1427 | 0.24 | 0.66 | YES |
| 47 | OAS3 | OAS3 | OAS3 | 1446 | 0.24 | 0.67 | YES |
| 48 | USP18 | USP18 | USP18 | 1465 | 0.24 | 0.68 | YES |
| 49 | IFI35 | IFI35 | IFI35 | 1497 | 0.23 | 0.69 | YES |
| 50 | DDX58 | DDX58 | DDX58 | 1503 | 0.23 | 0.7 | YES |
| 51 | IRF9 | IRF9 | IRF9 | 1569 | 0.22 | 0.7 | YES |
| 52 | HLA-A | HLA-A | HLA-A | 1573 | 0.22 | 0.71 | YES |
| 53 | B2M | B2M | B2M | 1616 | 0.21 | 0.72 | YES |
| 54 | PTPN6 | PTPN6 | PTPN6 | 1636 | 0.21 | 0.72 | YES |
| 55 | JAK2 | JAK2 | JAK2 | 1657 | 0.21 | 0.73 | YES |
| 56 | SP100 | SP100 | SP100 | 1723 | 0.2 | 0.74 | YES |
| 57 | IFNAR2 | IFNAR2 | IFNAR2 | 1734 | 0.2 | 0.74 | YES |
| 58 | HLA-C | HLA-C | HLA-C | 1755 | 0.2 | 0.75 | YES |
| 59 | ICAM1 | ICAM1 | ICAM1 | 1764 | 0.2 | 0.76 | YES |
| 60 | IRF5 | IRF5 | IRF5 | 1872 | 0.18 | 0.76 | YES |
| 61 | STAT2 | STAT2 | STAT2 | 1971 | 0.17 | 0.76 | YES |
| 62 | IRF3 | IRF3 | IRF3 | 2131 | 0.16 | 0.76 | NO |
| 63 | MT2A | MT2A | MT2A | 2319 | 0.14 | 0.75 | NO |
| 64 | EIF2AK2 | EIF2AK2 | EIF2AK2 | 2335 | 0.14 | 0.76 | NO |
| 65 | KPNA5 | KPNA5 | KPNA5 | 2584 | 0.12 | 0.75 | NO |
| 66 | IFITM3 | IFITM3 | IFITM3 | 2678 | 0.12 | 0.75 | NO |
| 67 | SOCS3 | SOCS3 | SOCS3 | 2829 | 0.11 | 0.74 | NO |
| 68 | PML | PML | PML | 2850 | 0.11 | 0.75 | NO |
| 69 | CAMK2D | CAMK2D | CAMK2D | 2903 | 0.11 | 0.75 | NO |
| 70 | PLCG1 | PLCG1 | PLCG1 | 3008 | 0.1 | 0.75 | NO |
| 71 | PTPN2 | PTPN2 | PTPN2 | 3446 | 0.084 | 0.73 | NO |
| 72 | IRF2 | IRF2 | IRF2 | 3591 | 0.08 | 0.72 | NO |
| 73 | NUP93 | NUP93 | NUP93 | 3658 | 0.078 | 0.72 | NO |
| 74 | TYK2 | TYK2 | TYK2 | 3674 | 0.078 | 0.72 | NO |
| 75 | NUP62 | NUP62 | NUP62 | 3942 | 0.069 | 0.71 | NO |
| 76 | NUP210 | NUP210 | NUP210 | 4140 | 0.064 | 0.7 | NO |
| 77 | NUP54 | NUP54 | NUP54 | 4550 | 0.056 | 0.68 | NO |
| 78 | TRIM25 | TRIM25 | TRIM25 | 4560 | 0.056 | 0.68 | NO |
| 79 | PTPN1 | PTPN1 | PTPN1 | 4816 | 0.05 | 0.67 | NO |
| 80 | ADAR | ADAR | ADAR | 5046 | 0.046 | 0.66 | NO |
| 81 | UBA52 | UBA52 | UBA52 | 5070 | 0.046 | 0.66 | NO |
| 82 | IFNGR1 | IFNGR1 | IFNGR1 | 5093 | 0.046 | 0.66 | NO |
| 83 | NUPL2 | NUPL2 | NUPL2 | 5344 | 0.041 | 0.65 | NO |
| 84 | JAK1 | JAK1 | JAK1 | 5416 | 0.04 | 0.65 | NO |
| 85 | RPS27A | RPS27A | RPS27A | 5423 | 0.04 | 0.65 | NO |
| 86 | KPNA2 | KPNA2 | KPNA2 | 5437 | 0.04 | 0.65 | NO |
| 87 | EIF4E3 | EIF4E3 | EIF4E3 | 5578 | 0.038 | 0.64 | NO |
| 88 | UBE2N | UBE2N | UBE2N | 5621 | 0.037 | 0.64 | NO |
| 89 | KPNB1 | KPNB1 | KPNB1 | 5631 | 0.037 | 0.64 | NO |
| 90 | RNASEL | RNASEL | RNASEL | 5705 | 0.036 | 0.64 | NO |
| 91 | IFNGR2 | IFNGR2 | IFNGR2 | 5715 | 0.036 | 0.64 | NO |
| 92 | CD44 | CD44 | CD44 | 5733 | 0.035 | 0.64 | NO |
| 93 | PRKCD | PRKCD | PRKCD | 5815 | 0.034 | 0.64 | NO |
| 94 | NUP153 | NUP153 | NUP153 | 6113 | 0.03 | 0.62 | NO |
| 95 | EIF4A3 | EIF4A3 | EIF4A3 | 6444 | 0.026 | 0.61 | NO |
| 96 | IFITM2 | IFITM2 | IFITM2 | 6445 | 0.026 | 0.61 | NO |
| 97 | PIAS1 | PIAS1 | PIAS1 | 6546 | 0.025 | 0.6 | NO |
| 98 | NUP85 | NUP85 | NUP85 | 6601 | 0.024 | 0.6 | NO |
| 99 | EIF4E | EIF4E | EIF4E | 6700 | 0.023 | 0.6 | NO |
| 100 | NUP43 | NUP43 | NUP43 | 6779 | 0.022 | 0.59 | NO |
| 101 | KPNA1 | KPNA1 | KPNA1 | 6834 | 0.021 | 0.59 | NO |
| 102 | AAAS | AAAS | AAAS | 6925 | 0.02 | 0.59 | NO |
| 103 | EIF4E2 | EIF4E2 | EIF4E2 | 6975 | 0.02 | 0.58 | NO |
| 104 | EIF4A1 | EIF4A1 | EIF4A1 | 6996 | 0.019 | 0.58 | NO |
| 105 | NUP35 | NUP35 | NUP35 | 7178 | 0.018 | 0.57 | NO |
| 106 | PIN1 | PIN1 | PIN1 | 7305 | 0.016 | 0.57 | NO |
| 107 | IFNAR1 | IFNAR1 | IFNAR1 | 7344 | 0.016 | 0.57 | NO |
| 108 | EIF4G1 | EIF4G1 | EIF4G1 | 7521 | 0.014 | 0.56 | NO |
| 109 | NUP188 | NUP188 | NUP188 | 7687 | 0.012 | 0.55 | NO |
| 110 | NUP88 | NUP88 | NUP88 | 7717 | 0.011 | 0.55 | NO |
| 111 | SUMO1 | SUMO1 | SUMO1 | 7809 | 0.01 | 0.54 | NO |
| 112 | NUP107 | NUP107 | NUP107 | 7908 | 0.0094 | 0.54 | NO |
| 113 | EIF4A2 | EIF4A2 | EIF4A2 | 7972 | 0.0088 | 0.54 | NO |
| 114 | NUP37 | NUP37 | NUP37 | 8005 | 0.0085 | 0.53 | NO |
| 115 | NUP155 | NUP155 | NUP155 | 8137 | 0.007 | 0.53 | NO |
| 116 | EIF4G2 | EIF4G2 | EIF4G2 | 8192 | 0.0065 | 0.52 | NO |
| 117 | PPM1B | PPM1B | PPM1B | 8275 | 0.0056 | 0.52 | NO |
| 118 | RAE1 | RAE1 | RAE1 | 8297 | 0.0055 | 0.52 | NO |
| 119 | NUP50 | NUP50 | NUP50 | 8415 | 0.0042 | 0.51 | NO |
| 120 | NCAM1 | NCAM1 | NCAM1 | 8432 | 0.004 | 0.51 | NO |
| 121 | POM121 | POM121 | POM121 | 8658 | 0.0014 | 0.5 | NO |
| 122 | KPNA3 | KPNA3 | KPNA3 | 8853 | -0.00034 | 0.49 | NO |
| 123 | KPNA4 | KPNA4 | KPNA4 | 8880 | -0.00064 | 0.49 | NO |
| 124 | NUP214 | NUP214 | NUP214 | 9409 | -0.0059 | 0.46 | NO |
| 125 | UBE2E1 | UBE2E1 | UBE2E1 | 9450 | -0.0063 | 0.46 | NO |
| 126 | EIF4G3 | EIF4G3 | EIF4G3 | 9543 | -0.0071 | 0.45 | NO |
| 127 | NUP205 | NUP205 | NUP205 | 9626 | -0.0082 | 0.45 | NO |
| 128 | EGR1 | EGR1 | EGR1 | 9643 | -0.0084 | 0.45 | NO |
| 129 | TPR | TPR | TPR | 9700 | -0.009 | 0.44 | NO |
| 130 | RANBP2 | RANBP2 | RANBP2 | 9850 | -0.01 | 0.44 | NO |
| 131 | NUP133 | NUP133 | NUP133 | 10062 | -0.013 | 0.43 | NO |
| 132 | IP6K2 | IP6K2 | IP6K2 | 10334 | -0.016 | 0.41 | NO |
| 133 | ARIH1 | ARIH1 | ARIH1 | 10859 | -0.021 | 0.38 | NO |
| 134 | MAPK3 | MAPK3 | MAPK3 | 11362 | -0.027 | 0.36 | NO |
| 135 | FLNB | FLNB | FLNB | 12847 | -0.047 | 0.28 | NO |
| 136 | SEH1L | SEH1L | SEH1L | 12977 | -0.049 | 0.27 | NO |
| 137 | CAMK2B | CAMK2B | CAMK2B | 13685 | -0.061 | 0.24 | NO |
| 138 | NEDD4 | NEDD4 | NEDD4 | 14123 | -0.07 | 0.21 | NO |
| 139 | NUPL1 | NUPL1 | NUPL1 | 14404 | -0.077 | 0.2 | NO |
| 140 | CAMK2A | CAMK2A | CAMK2A | 14696 | -0.084 | 0.19 | NO |
| 141 | IRF6 | IRF6 | IRF6 | 17399 | -0.23 | 0.048 | NO |
Figure S133. Get High-res Image This plot shows mRNAseq_cNMF expression data heatmap (on the left) a RunningEnrichmentScore(RES) plot (on the top right) and a Signal2Noise(S2N) plot (on the bottom right) of genes in the pathway: KEGG CYTOKINE CYTOKINE RECEPTOR INTERACTION.
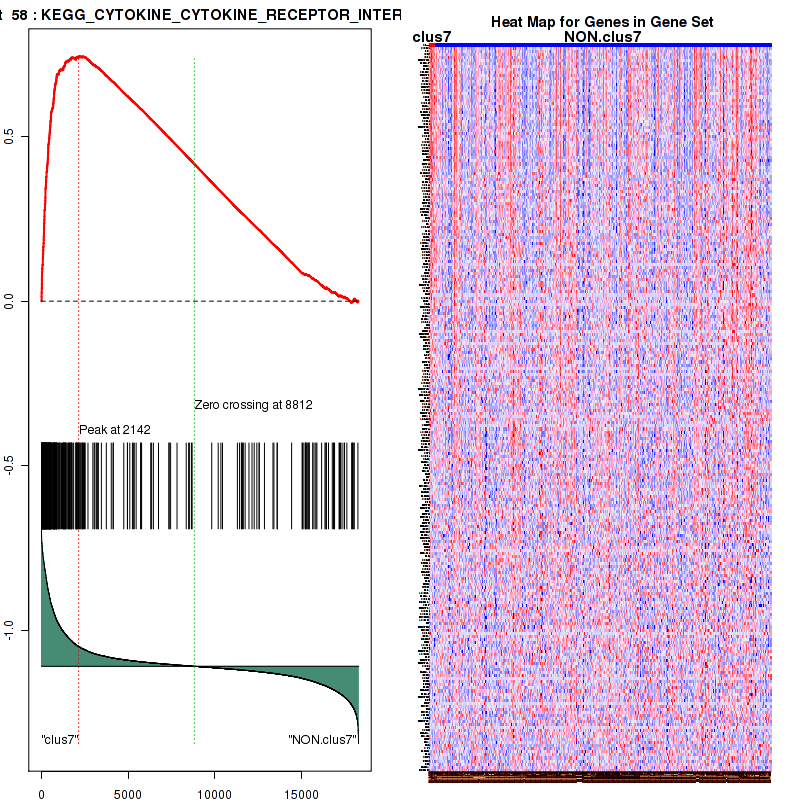
Figure S134. Get High-res Image For the top 5 core enriched genes in the pathway: KEGG CYTOKINE CYTOKINE RECEPTOR INTERACTION, this volcano plot shows how much they are up/down-regulated and significant. The significance was calculated by empirical bayesian fit

Table S68. Get Full Table This table shows a Running Enrichment Score (RES) of each gene in this pathway, that is, the enrichment score at this point in the ranked list of genes. All genes are ranked by Signal-to-Noise (S2N), a measure of similarity as default and are used to obtain ES matrix of all genes. In this way, GSEA tool uses expression pattern of not only overlapped genes but also not-overlapped genes to produce ES matrix.
| Rank | GENE | SYMBOL | DESC | LIST.LOC | S2N | RES | CORE_ENRICHMENT |
|---|---|---|---|---|---|---|---|
| 1 | PRKCB | PRKCB | PRKCB | 114 | 0.84 | 0.17 | YES |
| 2 | CARD11 | CARD11 | CARD11 | 234 | 0.73 | 0.31 | YES |
| 3 | PSMB9 | PSMB9 | PSMB9 | 652 | 0.45 | 0.38 | YES |
| 4 | PSMA8 | PSMA8 | PSMA8 | 713 | 0.42 | 0.47 | YES |
| 5 | PSMB8 | PSMB8 | PSMB8 | 1276 | 0.27 | 0.49 | YES |
| 6 | PSMB10 | PSMB10 | PSMB10 | 1580 | 0.22 | 0.52 | YES |
| 7 | PSME2 | PSME2 | PSME2 | 1644 | 0.21 | 0.56 | YES |
| 8 | NFKBIE | NFKBIE | NFKBIE | 2014 | 0.17 | 0.58 | YES |
| 9 | PSME1 | PSME1 | PSME1 | 2162 | 0.15 | 0.6 | YES |
| 10 | MALT1 | MALT1 | MALT1 | 2846 | 0.11 | 0.59 | YES |
| 11 | NFKBIA | NFKBIA | NFKBIA | 3283 | 0.09 | 0.58 | YES |
| 12 | CHUK | CHUK | CHUK | 3492 | 0.083 | 0.59 | YES |
| 13 | NFKBIB | NFKBIB | NFKBIB | 3513 | 0.083 | 0.6 | YES |
| 14 | PSMA5 | PSMA5 | PSMA5 | 3693 | 0.077 | 0.61 | YES |
| 15 | PSMA6 | PSMA6 | PSMA6 | 4648 | 0.054 | 0.57 | NO |
| 16 | UBA52 | UBA52 | UBA52 | 5070 | 0.046 | 0.56 | NO |
| 17 | PSMA2 | PSMA2 | PSMA2 | 5176 | 0.044 | 0.56 | NO |
| 18 | IKBKG | IKBKG | IKBKG | 5202 | 0.043 | 0.57 | NO |
| 19 | RPS27A | RPS27A | RPS27A | 5423 | 0.04 | 0.56 | NO |
| 20 | PSMF1 | PSMF1 | PSMF1 | 5516 | 0.038 | 0.57 | NO |
| 21 | PSMA4 | PSMA4 | PSMA4 | 5696 | 0.036 | 0.56 | NO |
| 22 | PSMA3 | PSMA3 | PSMA3 | 6017 | 0.031 | 0.55 | NO |
| 23 | PSMD13 | PSMD13 | PSMD13 | 6142 | 0.03 | 0.55 | NO |
| 24 | PSMB1 | PSMB1 | PSMB1 | 6196 | 0.029 | 0.56 | NO |
| 25 | PSMB2 | PSMB2 | PSMB2 | 6363 | 0.027 | 0.55 | NO |
| 26 | PSMD1 | PSMD1 | PSMD1 | 6600 | 0.024 | 0.54 | NO |
| 27 | PSMC4 | PSMC4 | PSMC4 | 6856 | 0.021 | 0.53 | NO |
| 28 | PSMD11 | PSMD11 | PSMD11 | 6929 | 0.02 | 0.53 | NO |
| 29 | PSMD14 | PSMD14 | PSMD14 | 7175 | 0.018 | 0.52 | NO |
| 30 | PSMD7 | PSMD7 | PSMD7 | 7190 | 0.017 | 0.53 | NO |
| 31 | PSMB6 | PSMB6 | PSMB6 | 7589 | 0.013 | 0.51 | NO |
| 32 | PSMD2 | PSMD2 | PSMD2 | 7871 | 0.0098 | 0.5 | NO |
| 33 | PSMC5 | PSMC5 | PSMC5 | 7970 | 0.0088 | 0.49 | NO |
| 34 | PSMD12 | PSMD12 | PSMD12 | 7986 | 0.0087 | 0.49 | NO |
| 35 | PSMA1 | PSMA1 | PSMA1 | 8113 | 0.0073 | 0.49 | NO |
| 36 | PSMD6 | PSMD6 | PSMD6 | 8119 | 0.0072 | 0.49 | NO |
| 37 | PSMD10 | PSMD10 | PSMD10 | 8153 | 0.0069 | 0.49 | NO |
| 38 | BCL10 | BCL10 | BCL10 | 8236 | 0.0061 | 0.48 | NO |
| 39 | PSMB7 | PSMB7 | PSMB7 | 8251 | 0.0059 | 0.48 | NO |
| 40 | PSMA7 | PSMA7 | PSMA7 | 8557 | 0.0027 | 0.47 | NO |
| 41 | PSMD8 | PSMD8 | PSMD8 | 8638 | 0.0016 | 0.46 | NO |
| 42 | PSMC3 | PSMC3 | PSMC3 | 8679 | 0.0012 | 0.46 | NO |
| 43 | MAP3K7 | MAP3K7 | MAP3K7 | 8695 | 0.0011 | 0.46 | NO |
| 44 | PSME4 | PSME4 | PSME4 | 8840 | -0.00024 | 0.45 | NO |
| 45 | PSMD9 | PSMD9 | PSMD9 | 8841 | -0.00024 | 0.45 | NO |
| 46 | PSMB5 | PSMB5 | PSMB5 | 8900 | -0.00083 | 0.45 | NO |
| 47 | BTRC | BTRC | BTRC | 8924 | -0.001 | 0.45 | NO |
| 48 | RELA | RELA | RELA | 8928 | -0.001 | 0.45 | NO |
| 49 | CUL1 | CUL1 | CUL1 | 8957 | -0.0014 | 0.45 | NO |
| 50 | REL | REL | REL | 9239 | -0.0043 | 0.43 | NO |
| 51 | PSMB3 | PSMB3 | PSMB3 | 10223 | -0.014 | 0.38 | NO |
| 52 | FBXW11 | FBXW11 | FBXW11 | 10432 | -0.017 | 0.38 | NO |
| 53 | PSMC2 | PSMC2 | PSMC2 | 10488 | -0.017 | 0.38 | NO |
| 54 | PSMB4 | PSMB4 | PSMB4 | 10694 | -0.019 | 0.37 | NO |
| 55 | PSMD4 | PSMD4 | PSMD4 | 11111 | -0.024 | 0.35 | NO |
| 56 | SKP1 | SKP1 | SKP1 | 11147 | -0.024 | 0.35 | NO |
| 57 | PSMD5 | PSMD5 | PSMD5 | 11318 | -0.026 | 0.35 | NO |
| 58 | PSMC1 | PSMC1 | PSMC1 | 12144 | -0.036 | 0.31 | NO |
| 59 | IKBKB | IKBKB | IKBKB | 12216 | -0.037 | 0.32 | NO |
| 60 | PSMD3 | PSMD3 | PSMD3 | 12250 | -0.038 | 0.32 | NO |
| 61 | PSMC6 | PSMC6 | PSMC6 | 12403 | -0.04 | 0.32 | NO |
Figure S135. Get High-res Image This plot shows mRNAseq_cNMF expression data heatmap (on the left) a RunningEnrichmentScore(RES) plot (on the top right) and a Signal2Noise(S2N) plot (on the bottom right) of genes in the pathway: KEGG CHEMOKINE SIGNALING PATHWAY.
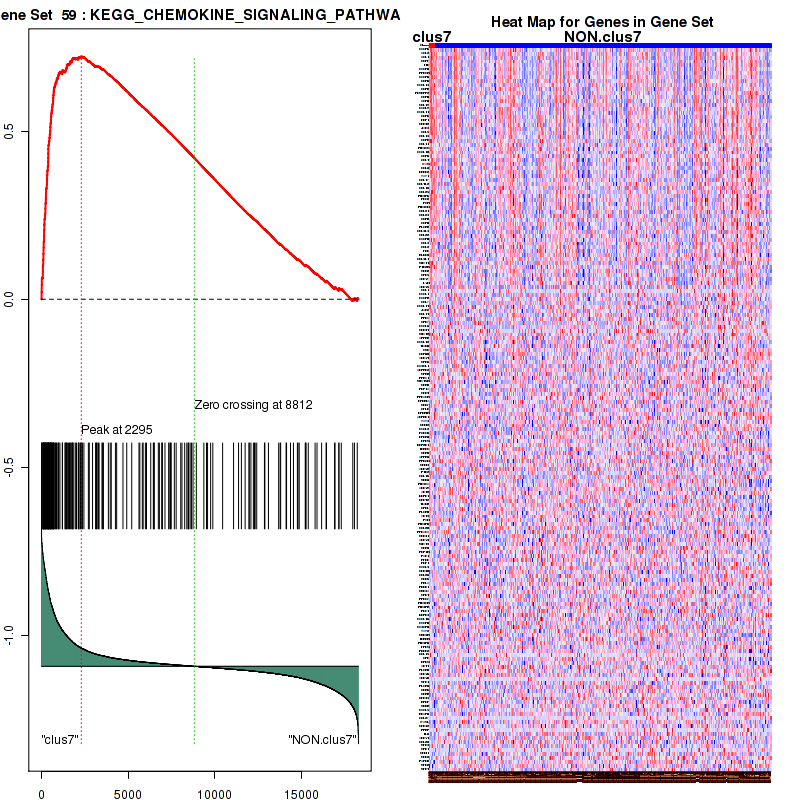
Figure S136. Get High-res Image For the top 5 core enriched genes in the pathway: KEGG CHEMOKINE SIGNALING PATHWAY, this volcano plot shows how much they are up/down-regulated and significant. The significance was calculated by empirical bayesian fit

Table S69. Get Full Table This table shows a Running Enrichment Score (RES) of each gene in this pathway, that is, the enrichment score at this point in the ranked list of genes. All genes are ranked by Signal-to-Noise (S2N), a measure of similarity as default and are used to obtain ES matrix of all genes. In this way, GSEA tool uses expression pattern of not only overlapped genes but also not-overlapped genes to produce ES matrix.
| Rank | GENE | SYMBOL | DESC | LIST.LOC | S2N | RES | CORE_ENRICHMENT |
|---|---|---|---|---|---|---|---|
| 1 | IL2RA | IL2RA | IL2RA | 151 | 0.8 | 0.14 | YES |
| 2 | LCK | LCK | LCK | 159 | 0.8 | 0.29 | YES |
| 3 | IL2RB | IL2RB | IL2RB | 273 | 0.69 | 0.41 | YES |
| 4 | IL2RG | IL2RG | IL2RG | 276 | 0.69 | 0.54 | YES |
| 5 | IL2 | IL2 | IL2 | 291 | 0.67 | 0.66 | YES |
| 6 | JAK3 | JAK3 | JAK3 | 319 | 0.65 | 0.78 | YES |
| 7 | GRB2 | GRB2 | GRB2 | 2705 | 0.12 | 0.67 | NO |
| 8 | UGCG | UGCG | UGCG | 3020 | 0.1 | 0.67 | NO |
| 9 | MYC | MYC | MYC | 3120 | 0.096 | 0.68 | NO |
| 10 | FOXO3 | FOXO3 | FOXO3 | 4265 | 0.062 | 0.63 | NO |
| 11 | NFKB1 | NFKB1 | NFKB1 | 4336 | 0.06 | 0.64 | NO |
| 12 | GAB2 | GAB2 | GAB2 | 4649 | 0.054 | 0.63 | NO |
| 13 | BCL2 | BCL2 | BCL2 | 5155 | 0.044 | 0.61 | NO |
| 14 | E2F1 | E2F1 | E2F1 | 5214 | 0.043 | 0.62 | NO |
| 15 | JAK1 | JAK1 | JAK1 | 5416 | 0.04 | 0.61 | NO |
| 16 | MTOR | MTOR | MTOR | 6262 | 0.028 | 0.57 | NO |
| 17 | EIF3A | EIF3A | EIF3A | 6321 | 0.028 | 0.57 | NO |
| 18 | SOS1 | SOS1 | SOS1 | 6448 | 0.026 | 0.57 | NO |
| 19 | PIK3CA | PIK3CA | PIK3CA | 6468 | 0.026 | 0.57 | NO |
| 20 | RPS6 | RPS6 | RPS6 | 7013 | 0.019 | 0.55 | NO |
| 21 | MYB | MYB | MYB | 8082 | 0.0077 | 0.49 | NO |
| 22 | RELA | RELA | RELA | 8928 | -0.001 | 0.44 | NO |
| 23 | BCL2L1 | BCL2L1 | BCL2L1 | 9215 | -0.0041 | 0.43 | NO |
| 24 | SMPD1 | SMPD1 | SMPD1 | 9480 | -0.0066 | 0.42 | NO |
| 25 | PRKCZ | PRKCZ | PRKCZ | 9750 | -0.0094 | 0.4 | NO |
| 26 | RPS6KB1 | RPS6KB1 | RPS6KB1 | 10076 | -0.013 | 0.39 | NO |
| 27 | TERT | TERT | TERT | 10293 | -0.015 | 0.38 | NO |
| 28 | PTPN11 | PTPN11 | PTPN11 | 10425 | -0.016 | 0.38 | NO |
| 29 | RAC1 | RAC1 | RAC1 | 11074 | -0.024 | 0.34 | NO |
| 30 | PIK3R1 | PIK3R1 | PIK3R1 | 12279 | -0.038 | 0.28 | NO |
| 31 | HSP90AA1 | HSP90AA1 | HSP90AA1 | 12325 | -0.039 | 0.29 | NO |
| 32 | AKT1 | AKT1 | AKT1 | 13673 | -0.061 | 0.23 | NO |
| 33 | SGMS1 | SGMS1 | SGMS1 | 14033 | -0.068 | 0.22 | NO |
| 34 | SHC1 | SHC1 | SHC1 | 14128 | -0.07 | 0.23 | NO |
Figure S137. Get High-res Image This plot shows mRNAseq_cNMF expression data heatmap (on the left) a RunningEnrichmentScore(RES) plot (on the top right) and a Signal2Noise(S2N) plot (on the bottom right) of genes in the pathway: KEGG PHOSPHATIDYLINOSITOL SIGNALING SYSTEM.
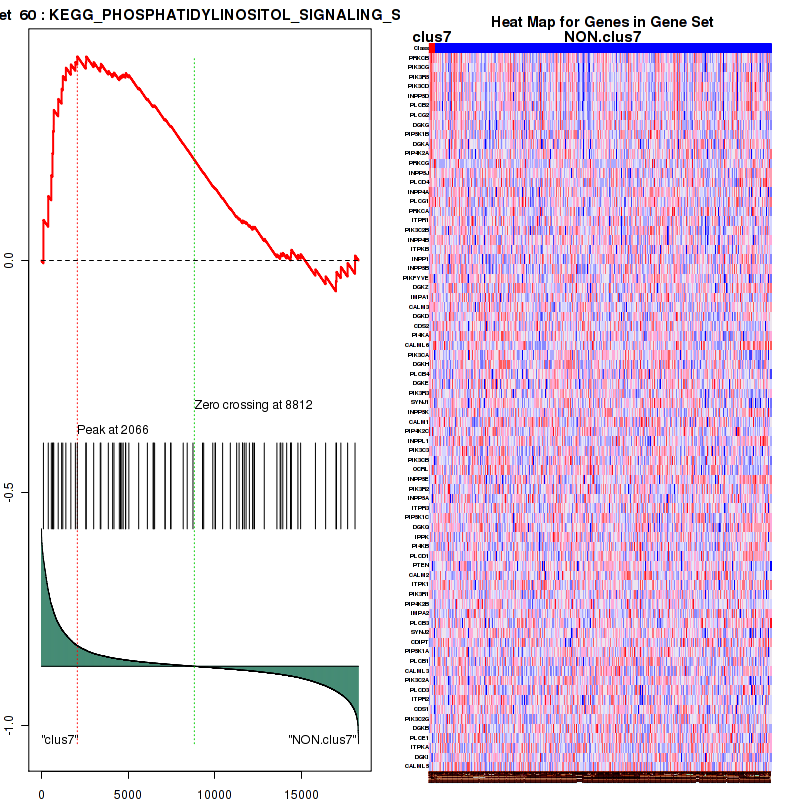
Figure S138. Get High-res Image For the top 5 core enriched genes in the pathway: KEGG PHOSPHATIDYLINOSITOL SIGNALING SYSTEM, this volcano plot shows how much they are up/down-regulated and significant. The significance was calculated by empirical bayesian fit

Table S70. Get Full Table This table shows a Running Enrichment Score (RES) of each gene in this pathway, that is, the enrichment score at this point in the ranked list of genes. All genes are ranked by Signal-to-Noise (S2N), a measure of similarity as default and are used to obtain ES matrix of all genes. In this way, GSEA tool uses expression pattern of not only overlapped genes but also not-overlapped genes to produce ES matrix.
| Rank | GENE | SYMBOL | DESC | LIST.LOC | S2N | RES | CORE_ENRICHMENT |
|---|---|---|---|---|---|---|---|
| 1 | NLRC5 | NLRC5 | NLRC5 | 582 | 0.48 | 0.089 | YES |
| 2 | HERC5 | HERC5 | HERC5 | 770 | 0.4 | 0.18 | YES |
| 3 | TNFAIP3 | TNFAIP3 | TNFAIP3 | 905 | 0.35 | 0.26 | YES |
| 4 | ISG15 | ISG15 | ISG15 | 921 | 0.35 | 0.35 | YES |
| 5 | IFIH1 | IFIH1 | IFIH1 | 1134 | 0.3 | 0.41 | YES |
| 6 | UBE2L6 | UBE2L6 | UBE2L6 | 1298 | 0.27 | 0.47 | YES |
| 7 | UBA7 | UBA7 | UBA7 | 1396 | 0.25 | 0.53 | YES |
| 8 | DDX58 | DDX58 | DDX58 | 1503 | 0.23 | 0.58 | YES |
| 9 | RNF125 | RNF125 | RNF125 | 1908 | 0.18 | 0.6 | YES |
| 10 | CYLD | CYLD | CYLD | 1916 | 0.18 | 0.65 | YES |
| 11 | IRF3 | IRF3 | IRF3 | 2131 | 0.16 | 0.68 | YES |
| 12 | IKBKE | IKBKE | IKBKE | 2289 | 0.14 | 0.7 | YES |
| 13 | TRAF3 | TRAF3 | TRAF3 | 2566 | 0.12 | 0.72 | YES |
| 14 | UBE2D1 | UBE2D1 | UBE2D1 | 4214 | 0.063 | 0.65 | NO |
| 15 | ATG5 | ATG5 | ATG5 | 4426 | 0.058 | 0.65 | NO |
| 16 | TRIM25 | TRIM25 | TRIM25 | 4560 | 0.056 | 0.66 | NO |
| 17 | UBA52 | UBA52 | UBA52 | 5070 | 0.046 | 0.64 | NO |
| 18 | TBK1 | TBK1 | TBK1 | 5383 | 0.041 | 0.63 | NO |
| 19 | RPS27A | RPS27A | RPS27A | 5423 | 0.04 | 0.64 | NO |
| 20 | OTUD5 | OTUD5 | OTUD5 | 6355 | 0.027 | 0.6 | NO |
| 21 | PIN1 | PIN1 | PIN1 | 7305 | 0.016 | 0.55 | NO |
| 22 | UBE2D3 | UBE2D3 | UBE2D3 | 7449 | 0.014 | 0.54 | NO |
| 23 | UBE2K | UBE2K | UBE2K | 7801 | 0.011 | 0.53 | NO |
| 24 | PCBP2 | PCBP2 | PCBP2 | 8140 | 0.007 | 0.51 | NO |
| 25 | MAVS | MAVS | MAVS | 8406 | 0.0043 | 0.5 | NO |
| 26 | UBE2D2 | UBE2D2 | UBE2D2 | 9144 | -0.0033 | 0.46 | NO |
| 27 | ATG12 | ATG12 | ATG12 | 9727 | -0.0091 | 0.43 | NO |
| 28 | RNF135 | RNF135 | RNF135 | 10345 | -0.016 | 0.4 | NO |
| 29 | TAX1BP1 | TAX1BP1 | TAX1BP1 | 12718 | -0.045 | 0.28 | NO |
| 30 | NLRX1 | NLRX1 | NLRX1 | 15111 | -0.098 | 0.17 | NO |
Figure S139. Get High-res Image This plot shows mRNAseq_cNMF expression data heatmap (on the left) a RunningEnrichmentScore(RES) plot (on the top right) and a Signal2Noise(S2N) plot (on the bottom right) of genes in the pathway: KEGG UBIQUITIN MEDIATED PROTEOLYSIS.
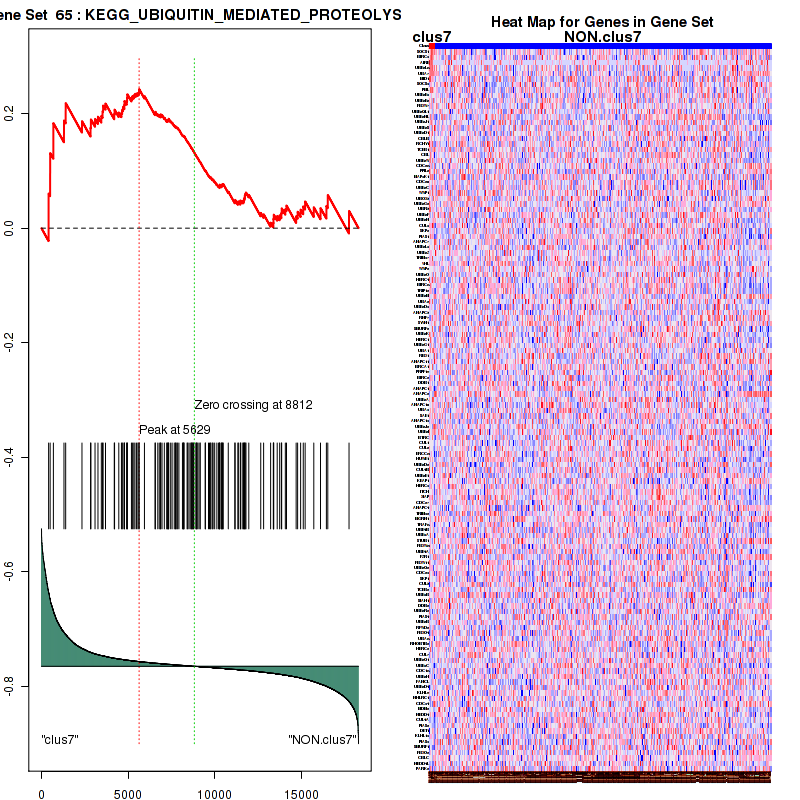
Figure S140. Get High-res Image For the top 5 core enriched genes in the pathway: KEGG UBIQUITIN MEDIATED PROTEOLYSIS, this volcano plot shows how much they are up/down-regulated and significant. The significance was calculated by empirical bayesian fit
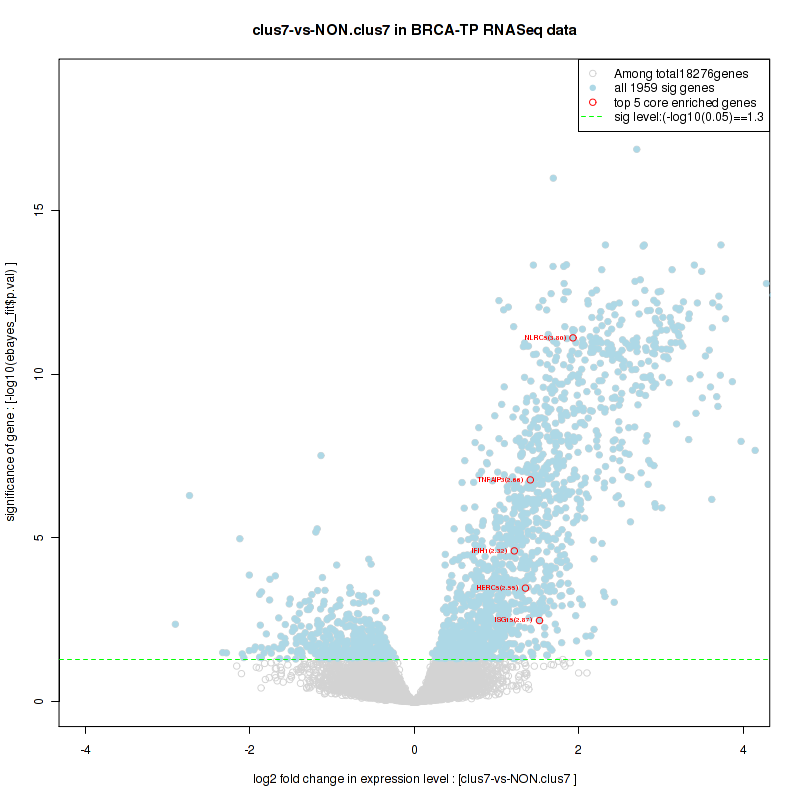
For the top enriched genes, if you want to check whether they are
-
up-regulated, please check the list of up-regulated genes
-
down-regulated, please check the list of down-regulated genes
For the top enriched genes, if you want to check whether they are
-
highly expressed genes, please check the list of high (top 30%) expressed genes
-
low expressed genes, please check the list of low (bottom 30%) expressed genes
An expression pattern of top(30%)/middle(30%)/low(30%) in this subtype against other subtypes is available in a heatmap
For the top enriched genes, if you want to check whether they are
-
significantly differently expressed genes by eBayes lm fit, please check the list of significant genes
-
Gene set database = c2.cp.v4.0.symbols.gmt
-
Expression data file = BRCA-TP.uncv2.mRNAseq_RSEM_normalized_log2.txt
-
Phenotype data file = BRCA-TP.mergedcluster.txt
For the Gene Set Enrichment Analysis (GSEA), Broad GSEA-P-R.1.0 version is used with class2: canonical pathways geneses from MSigDB. Further details about statistics are available inThe Broad GSEA website.
In addition to the links below, the full results of the analysis summarized in this report can also be downloaded programmatically using firehose_get, or interactively from either the Broad GDAC website or TCGA Data Coordination Center Portal.