This report serves to describe the mutational landscape and properties of a given individual set, as well as rank genes and genesets according to mutational significance. MutSig v2.0 was used to generate the results found in this report.
-
Working with individual set: CESC-TP
-
Number of patients in set: 194
The input for this pipeline is a set of individuals with the following files associated for each:
-
An annotated .maf file describing the mutations called for the respective individual, and their properties.
-
A .wig file that contains information about the coverage of the sample.
-
MAF used for this analysis:CESC-TP.final_analysis_set.maf
-
Blacklist used for this analysis: pancan_mutation_blacklist.v14.hg19.txt
-
Significantly mutated genes (q ≤ 0.1): 16
-
Mutations seen in COSMIC: 192
-
Significantly mutated genes in COSMIC territory: 10
-
Significantly mutated genesets: 34
-
Significantly mutated genesets: (excluding sig. mutated genes):0
-
Read 194 MAFs of type "maf1"
-
Total number of mutations in input MAFs: 46462
-
After removing 120 mutations outside chr1-24: 46342
-
After removing 300 blacklisted mutations: 46042
-
After removing 7441 noncoding mutations: 38601
-
After collapsing adjacent/redundant mutations: 38003
-
Number of mutations before filtering: 38003
-
After removing 2731 mutations outside gene set: 35272
-
After removing 59 mutations outside category set: 35213
-
After removing 5 "impossible" mutations in
-
gene-patient-category bins of zero coverage: 32418
Table 1. Get Full Table Table representing breakdown of mutations by type.
| type | count |
|---|---|
| De_novo_Start_InFrame | 10 |
| De_novo_Start_OutOfFrame | 19 |
| Frame_Shift_Del | 144 |
| Frame_Shift_Ins | 180 |
| In_Frame_Del | 36 |
| In_Frame_Ins | 22 |
| Missense_Mutation | 23007 |
| Nonsense_Mutation | 2256 |
| Nonstop_Mutation | 57 |
| Silent | 8607 |
| Splice_Site | 836 |
| Start_Codon_Ins | 3 |
| Start_Codon_SNP | 35 |
| Stop_Codon_Ins | 1 |
| Total | 35213 |
Table 2. Get Full Table A breakdown of mutation rates per category discovered for this individual set.
| category | n | N | rate | rate_per_mb | relative_rate | exp_ns_s_ratio |
|---|---|---|---|---|---|---|
| Tp*C->(T/G) | 14714 | 783553866 | 0.000019 | 19 | 4.2 | 3 |
| Tp*C->A | 1186 | 783553866 | 1.5e-06 | 1.5 | 0.34 | 4 |
| (A/C/G)p*C->mut | 5308 | 2209833766 | 2.4e-06 | 2.4 | 0.53 | 3.2 |
| A->mut | 1831 | 2900241563 | 6.3e-07 | 0.63 | 0.14 | 3.9 |
| indel+null | 3512 | 5893629195 | 6e-07 | 0.6 | 0.13 | NaN |
| double_null | 52 | 5893629195 | 8.8e-09 | 0.0088 | 0.002 | NaN |
| Total | 26603 | 5893629195 | 4.5e-06 | 4.5 | 1 | 3.5 |
The x axis represents the samples. The y axis represents the exons, one row per exon, and they are sorted by average coverage across samples. For exons with exactly the same average coverage, they are sorted next by the %GC of the exon. (The secondary sort is especially useful for the zero-coverage exons at the bottom). If the figure is unpopulated, then full coverage is assumed (e.g. MutSig CV doesn't use WIGs and assumes full coverage).
Figure 1.
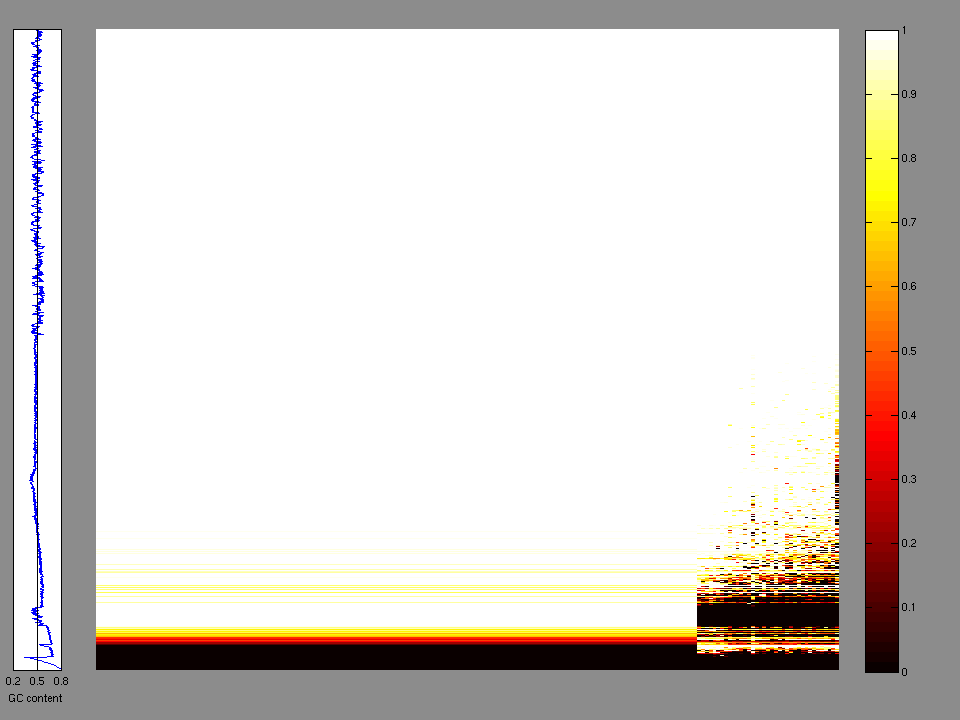
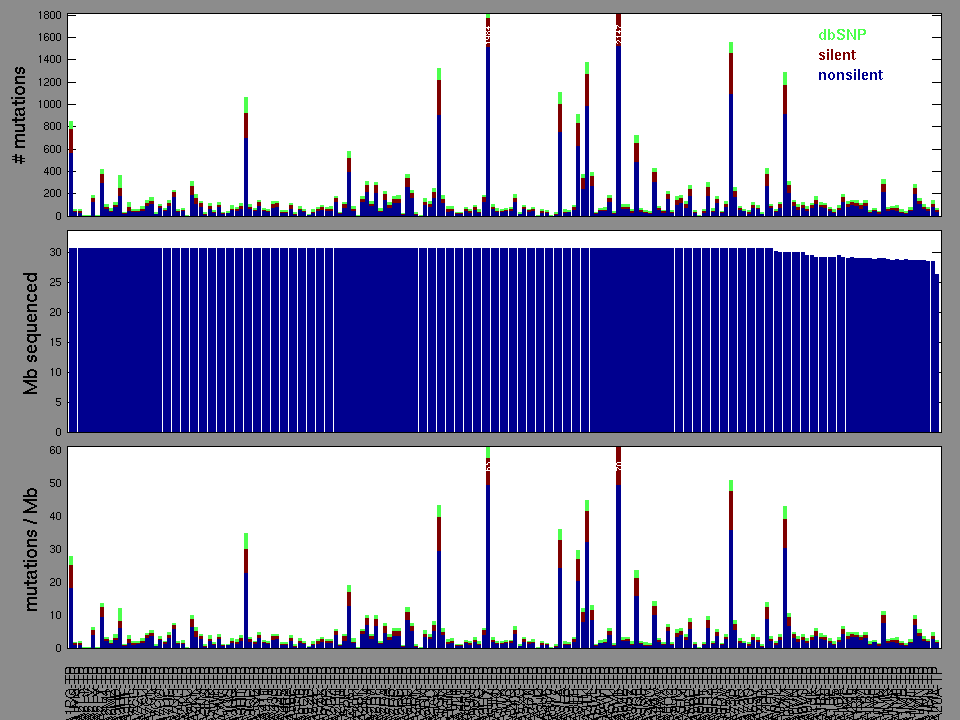
Figure 2. Patients counts and rates file used to generate this plot: CESC-TP.patients.counts_and_rates.txt
The mutation spectrum is depicted in the lego plots below in which the 96 possible mutation types are subdivided into six large blocks, color-coded to reflect the base substitution type. Each large block is further subdivided into the 16 possible pairs of 5' and 3' neighbors, as listed in the 4x4 trinucleotide context legend. The height of each block corresponds to the mutation frequency for that kind of mutation (counts of mutations normalized by the base coverage in a given bin). The shape of the spectrum is a signature for dominant mutational mechanisms in different tumor types.
Figure 3. Get High-res Image SNV Mutation rate lego plot for entire set. Each bin is normalized by base coverage for that bin. Colors represent the six SNV types on the upper right. The three-base context for each mutation is labeled in the 4x4 legend on the lower right. The fractional breakdown of SNV counts is shown in the pie chart on the upper left. If this figure is blank, not enough information was provided in the MAF to generate it.
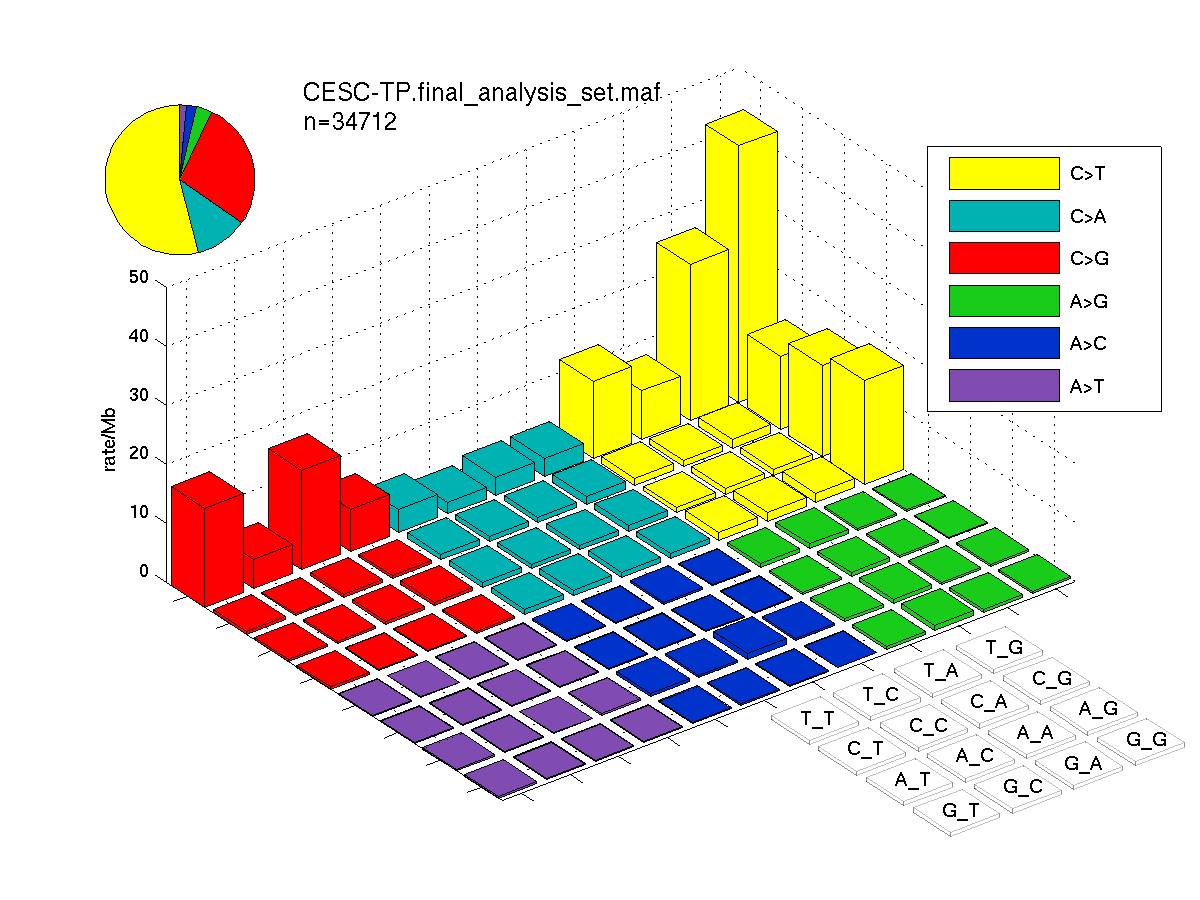
Figure 4. Get High-res Image SNV Mutation rate lego plots for 4 slices of mutation allele fraction (0<=AF<0.1, 0.1<=AF<0.25, 0.25<=AF<0.5, & 0.5<=AF) . The color code and three-base context legends are the same as the previous figure. If this figure is blank, not enough information was provided in the MAF to generate it.

Column Descriptions:
-
N = number of sequenced bases in this gene across the individual set
-
n = number of (nonsilent) mutations in this gene across the individual set
-
npat = number of patients (individuals) with at least one nonsilent mutation
-
nsite = number of unique sites having a non-silent mutation
-
nsil = number of silent mutations in this gene across the individual set
-
n1 = number of nonsilent mutations of type: Tp*C->(T/G)
-
n2 = number of nonsilent mutations of type: Tp*C->A
-
n3 = number of nonsilent mutations of type: (A/C/G)p*C->mut
-
n4 = number of nonsilent mutations of type: A->mut
-
n5 = number of nonsilent mutations of type: indel+null
-
n6 = number of nonsilent mutations of type: double_null
-
p_classic = p-value for the observed amount of nonsilent mutations being elevated in this gene
-
p_ns_s = p-value for the observed nonsilent/silent ratio being elevated in this gene
-
p_cons = p-value for enrichment of mutations at evolutionarily most-conserved sites in gene
-
p_joint = p-value for clustering + conservation
-
p = p-value (overall)
-
q = q-value, False Discovery Rate (Benjamini-Hochberg procedure)
Table 3. Get Full Table A Ranked List of Significantly Mutated Genes. Number of significant genes found: 16. Number of genes displayed: 35. Click on a gene name to display its stick figure depicting the distribution of mutations and mutation types across the chosen gene (this feature may not be available for all significant genes).
| rank | gene | description | N | n | npat | nsite | nsil | n1 | n2 | n3 | n4 | n5 | n6 | p_classic | p_ns_s | p_clust | p_cons | p_joint | p | q |
|---|---|---|---|---|---|---|---|---|---|---|---|---|---|---|---|---|---|---|---|---|
| 1 | FBXW7 | F-box and WD repeat domain containing 7 | 495633 | 20 | 19 | 14 | 1 | 8 | 0 | 7 | 0 | 5 | 0 | 1.2e-14 | 0.067 | 4.4e-06 | 0.17 | 0.000014 | 0.000 | 0.000 |
| 2 | PIK3CA | phosphoinositide-3-kinase, catalytic, alpha polypeptide | 636279 | 58 | 53 | 19 | 0 | 45 | 1 | 4 | 7 | 1 | 0 | 4.7e-15 | 0.000014 | 0 | 5.8e-06 | 0 | <1.00e-15 | <4.58e-12 |
| 3 | KRAS | v-Ki-ras2 Kirsten rat sarcoma viral oncogene homolog | 136796 | 11 | 11 | 5 | 0 | 0 | 0 | 10 | 1 | 0 | 0 | 9.3e-15 | 0.15 | 0 | 0.01 | 0 | <1.00e-15 | <4.58e-12 |
| 4 | ANKRD12 | ankyrin repeat domain 12 | 1197621 | 20 | 6 | 17 | 3 | 14 | 0 | 1 | 2 | 3 | 0 | 0.54 | 0.74 | 0 | 0.12 | 0 | <1.00e-15 | <4.58e-12 |
| 5 | PTEN | phosphatase and tensin homolog (mutated in multiple advanced cancers 1) | 239894 | 17 | 15 | 15 | 0 | 6 | 0 | 0 | 0 | 11 | 0 | 4.1e-15 | 0.09 | 0.18 | 0.88 | 0.28 | 4.10e-14 | 1.50e-10 |
| 6 | HLA-A | major histocompatibility complex, class I, A | 155775 | 17 | 16 | 14 | 1 | 2 | 0 | 1 | 1 | 13 | 0 | 1.1e-14 | 0.068 | 0.4 | 0.68 | 0.57 | 2.08e-13 | 6.35e-10 |
| 7 | MAPK1 | mitogen-activated protein kinase 1 | 192420 | 9 | 9 | 3 | 0 | 9 | 0 | 0 | 0 | 0 | 0 | 4.4e-09 | 0.067 | 4e-06 | 0.0082 | 6.8e-06 | 9.63e-13 | 2.52e-09 |
| 8 | EP300 | E1A binding protein p300 | 1421010 | 23 | 21 | 19 | 1 | 9 | 2 | 1 | 0 | 8 | 3 | 1.6e-11 | 0.042 | 0.015 | 0.32 | 0.025 | 1.20e-11 | 2.75e-08 |
| 9 | HLA-B | major histocompatibility complex, class I, B | 171702 | 11 | 11 | 8 | 0 | 0 | 0 | 2 | 1 | 7 | 1 | 6.8e-12 | 0.053 | 0.53 | 0.1 | 0.25 | 4.83e-11 | 9.85e-08 |
| 10 | NFE2L2 | nuclear factor (erythroid-derived 2)-like 2 | 350802 | 16 | 12 | 14 | 1 | 11 | 2 | 0 | 1 | 2 | 0 | 8.7e-09 | 0.27 | 0.041 | 0.019 | 0.0062 | 1.32e-09 | 2.41e-06 |
| 11 | MUC4 | mucin 4, cell surface associated | 656842 | 85 | 37 | 83 | 12 | 56 | 2 | 11 | 4 | 10 | 2 | 4.8e-10 | 0.000017 | 0.61 | 0.67 | 1 | 1.07e-08 | 1.79e-05 |
| 12 | CASP8 | caspase 8, apoptosis-related cysteine peptidase | 339514 | 9 | 9 | 8 | 1 | 1 | 0 | 0 | 2 | 6 | 0 | 3.6e-07 | 0.34 | 0.23 | 0.15 | 0.14 | 9.09e-07 | 0.00139 |
| 13 | C3orf70 | chromosome 3 open reading frame 70 | 144474 | 4 | 4 | 1 | 1 | 3 | 0 | 0 | 0 | 1 | 0 | 0.0026 | 0.76 | 8.2e-06 | 0.97 | 0.000034 | 1.52e-06 | 0.00215 |
| 14 | ARID1A | AT rich interactive domain 1A (SWI-like) | 1119004 | 14 | 14 | 14 | 1 | 4 | 0 | 1 | 0 | 6 | 3 | 2.6e-06 | 0.24 | 0.22 | 0.33 | 0.35 | 1.38e-05 | 0.0171 |
| 15 | RB1 | retinoblastoma 1 (including osteosarcoma) | 528233 | 9 | 9 | 9 | 1 | 1 | 2 | 1 | 0 | 4 | 1 | 4.2e-06 | 0.6 | 0.17 | 0.18 | 0.22 | 1.40e-05 | 0.0171 |
| 16 | ZNF578 | zinc finger protein 578 | 346290 | 7 | 6 | 7 | 0 | 4 | 1 | 1 | 0 | 1 | 0 | 0.0018 | 0.36 | 0.0012 | 0.37 | 0.0028 | 6.77e-05 | 0.0776 |
| 17 | SMAD4 | SMAD family member 4 | 330304 | 7 | 7 | 7 | 0 | 2 | 0 | 3 | 0 | 2 | 0 | 8e-05 | 0.29 | 0.19 | 0.28 | 0.16 | 0.000155 | 0.164 |
| 18 | PTPRC | protein tyrosine phosphatase, receptor type, C | 763686 | 9 | 9 | 9 | 0 | 3 | 1 | 0 | 1 | 4 | 0 | 0.00061 | 0.18 | 0.012 | 0.32 | 0.022 | 0.000163 | 0.164 |
| 19 | MSH4 | mutS homolog 4 (E. coli) | 527272 | 5 | 5 | 5 | 0 | 4 | 0 | 0 | 1 | 0 | 0 | 0.033 | 0.39 | 0.00098 | 0.01 | 0.00042 | 0.000170 | 0.164 |
| 20 | HIST1H4E | histone cluster 1, H4e | 61304 | 4 | 4 | 4 | 0 | 3 | 0 | 1 | 0 | 0 | 0 | 0.000039 | 0.21 | 0.56 | 0.26 | 0.5 | 0.000235 | 0.213 |
| 21 | DHRSX | dehydrogenase/reductase (SDR family) X-linked | 176122 | 4 | 4 | 4 | 0 | 2 | 0 | 1 | 1 | 0 | 0 | 0.0011 | 0.24 | 0.096 | 0.023 | 0.019 | 0.000244 | 0.213 |
| 22 | LIN9 | lin-9 homolog (C. elegans) | 336749 | 7 | 7 | 6 | 0 | 4 | 0 | 1 | 0 | 2 | 0 | 0.000099 | 0.27 | 0.16 | 0.35 | 0.24 | 0.000274 | 0.228 |
| 23 | MED1 | mediator complex subunit 1 | 933799 | 14 | 11 | 14 | 0 | 7 | 1 | 2 | 0 | 4 | 0 | 0.00028 | 0.079 | 0.093 | 0.53 | 0.14 | 0.000439 | 0.350 |
| 24 | COL19A1 | collagen, type XIX, alpha 1 | 695739 | 9 | 9 | 9 | 1 | 3 | 1 | 1 | 1 | 3 | 0 | 0.000084 | 0.54 | 0.42 | 0.8 | 0.58 | 0.000539 | 0.399 |
| 25 | STK11 | serine/threonine kinase 11 | 210281 | 8 | 5 | 8 | 1 | 3 | 1 | 2 | 1 | 1 | 0 | 0.0001 | 0.26 | 0.77 | 0.19 | 0.48 | 0.000544 | 0.399 |
| 26 | ERBB3 | v-erb-b2 erythroblastic leukemia viral oncogene homolog 3 (avian) | 825967 | 12 | 11 | 9 | 1 | 5 | 1 | 4 | 2 | 0 | 0 | 0.00012 | 0.14 | 0.35 | 0.42 | 0.47 | 0.000581 | 0.406 |
| 27 | HLA-C | major histocompatibility complex, class I, C | 180752 | 4 | 4 | 4 | 1 | 1 | 0 | 1 | 0 | 1 | 1 | 0.00095 | 0.71 | 0.034 | 0.71 | 0.062 | 0.000637 | 0.406 |
| 28 | NHS | Nance-Horan syndrome (congenital cataracts and dental anomalies) | 862695 | 12 | 12 | 12 | 1 | 7 | 0 | 2 | 0 | 3 | 0 | 0.00038 | 0.3 | 0.14 | 0.24 | 0.16 | 0.000638 | 0.406 |
| 29 | UNC93B1 | unc-93 homolog B1 (C. elegans) | 200792 | 3 | 3 | 2 | 0 | 0 | 0 | 3 | 0 | 0 | 0 | 0.014 | 0.37 | 0.0023 | 0.98 | 0.0045 | 0.000658 | 0.406 |
| 30 | ZNF750 | zinc finger protein 750 | 422763 | 11 | 10 | 11 | 2 | 3 | 0 | 1 | 1 | 6 | 0 | 0.00078 | 0.63 | 0.11 | 0.16 | 0.083 | 0.000692 | 0.406 |
| 31 | UROC1 | urocanase domain containing 1 | 440110 | 7 | 7 | 7 | 0 | 0 | 0 | 5 | 0 | 2 | 0 | 0.00064 | 0.1 | 0.055 | 0.9 | 0.1 | 0.000708 | 0.406 |
| 32 | PDE1C | phosphodiesterase 1C, calmodulin-dependent 70kDa | 381724 | 6 | 6 | 6 | 1 | 1 | 0 | 3 | 1 | 1 | 0 | 0.00046 | 0.51 | 0.3 | 0.059 | 0.15 | 0.000716 | 0.406 |
| 33 | CLEC11A | C-type lectin domain family 11, member A | 76213 | 2 | 2 | 2 | 1 | 2 | 0 | 0 | 0 | 0 | 0 | 0.03 | 0.88 | 0.3 | 0.011 | 0.0023 | 0.000734 | 0.406 |
| 34 | SOX2 | SRY (sex determining region Y)-box 2 | 97393 | 4 | 4 | 4 | 0 | 1 | 0 | 2 | 0 | 1 | 0 | 0.00066 | 0.26 | 0.9 | 0.016 | 0.11 | 0.000753 | 0.406 |
| 35 | PCIF1 | PDX1 C-terminal inhibiting factor 1 | 409924 | 4 | 4 | 4 | 0 | 3 | 0 | 1 | 0 | 0 | 0 | 0.072 | 0.28 | 0.00064 | 0.4 | 0.0012 | 0.000900 | 0.447 |
Figure S1. This figure depicts the distribution of mutations and mutation types across the FBXW7 significant gene.

Figure S2. This figure depicts the distribution of mutations and mutation types across the PIK3CA significant gene.
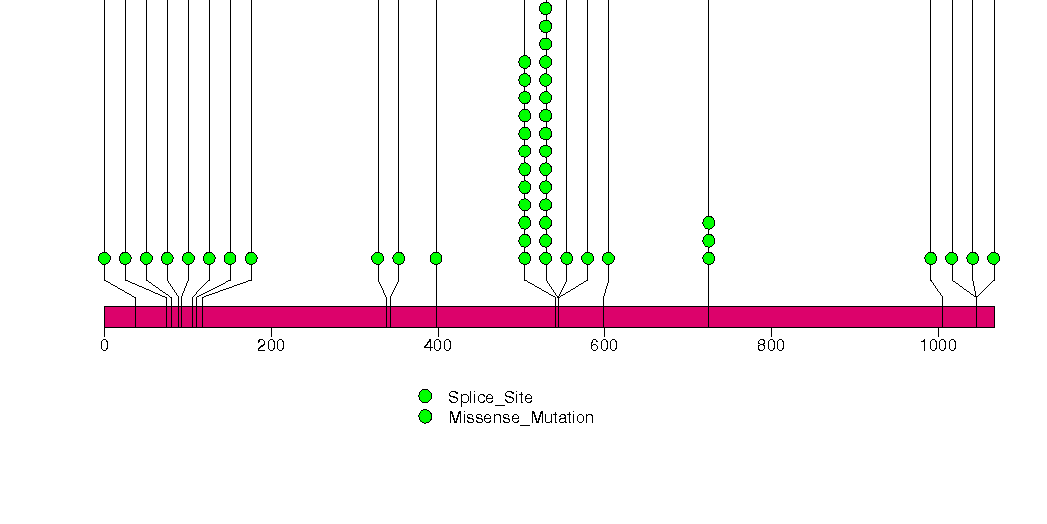
Figure S3. This figure depicts the distribution of mutations and mutation types across the KRAS significant gene.
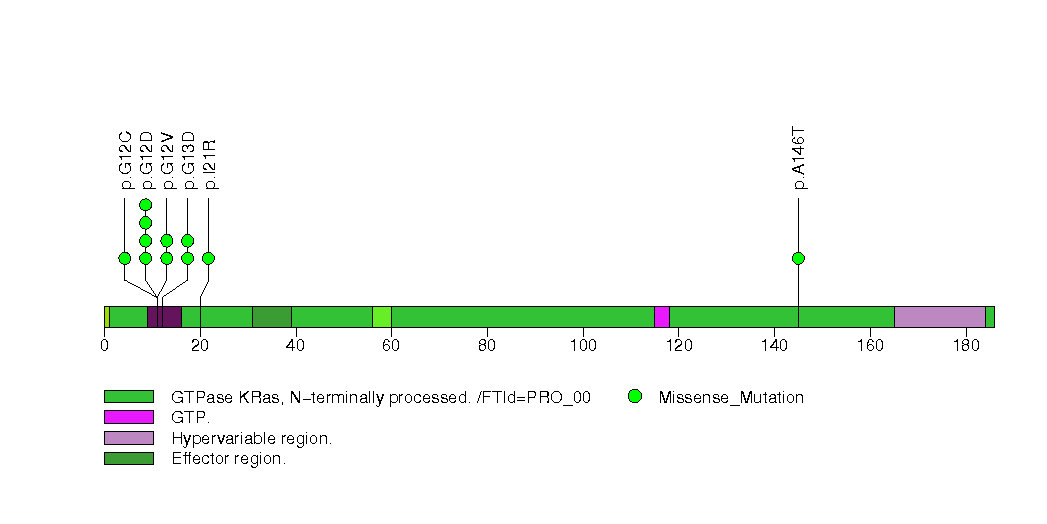
Figure S4. This figure depicts the distribution of mutations and mutation types across the ANKRD12 significant gene.
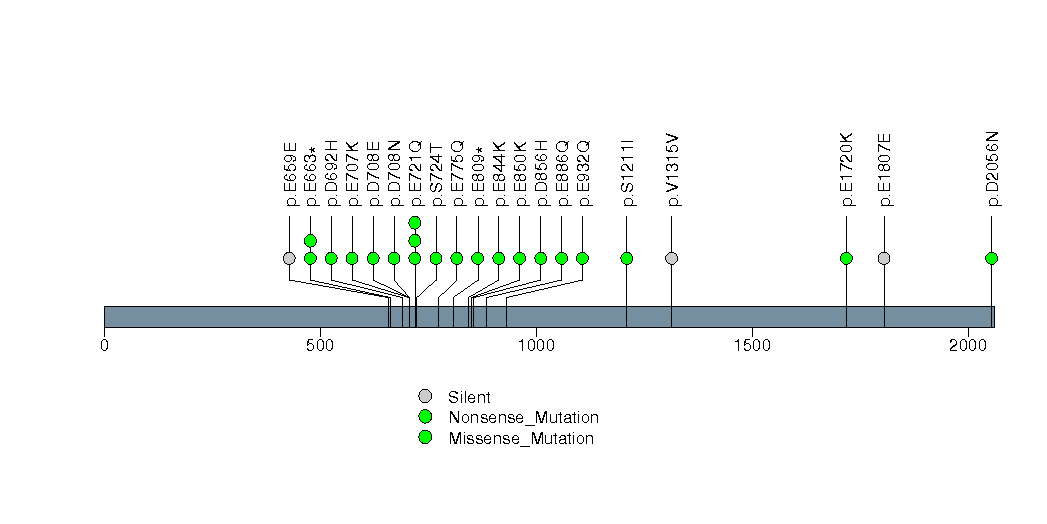
Figure S5. This figure depicts the distribution of mutations and mutation types across the PTEN significant gene.
Figure S6. This figure depicts the distribution of mutations and mutation types across the HLA-A significant gene.
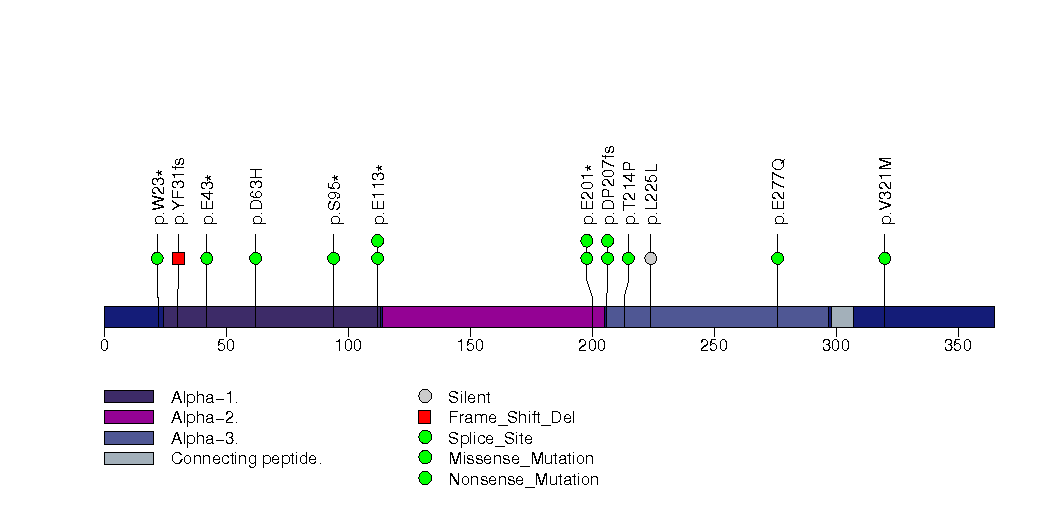
Figure S7. This figure depicts the distribution of mutations and mutation types across the MAPK1 significant gene.
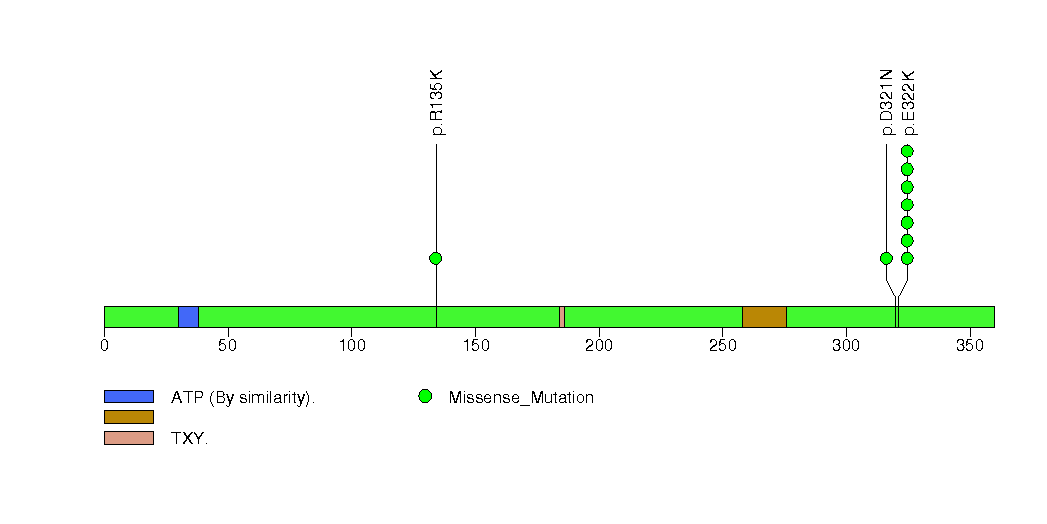
Figure S8. This figure depicts the distribution of mutations and mutation types across the EP300 significant gene.

Figure S9. This figure depicts the distribution of mutations and mutation types across the HLA-B significant gene.
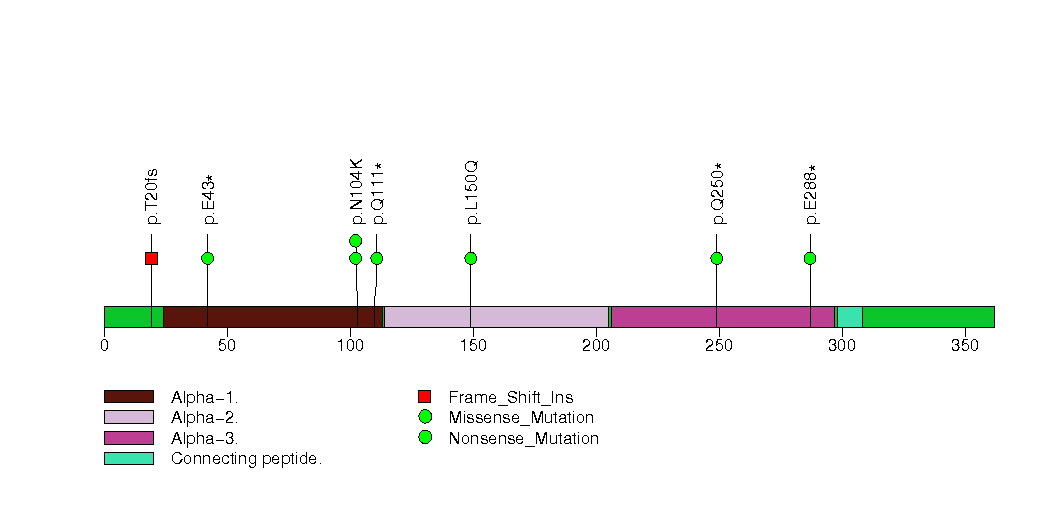
Figure S10. This figure depicts the distribution of mutations and mutation types across the NFE2L2 significant gene.
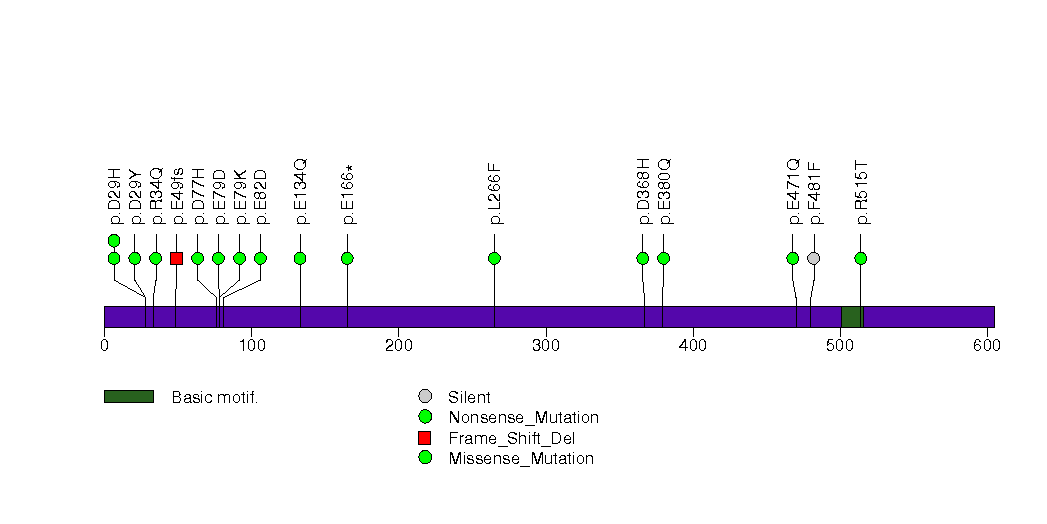
Figure S11. This figure depicts the distribution of mutations and mutation types across the MUC4 significant gene.
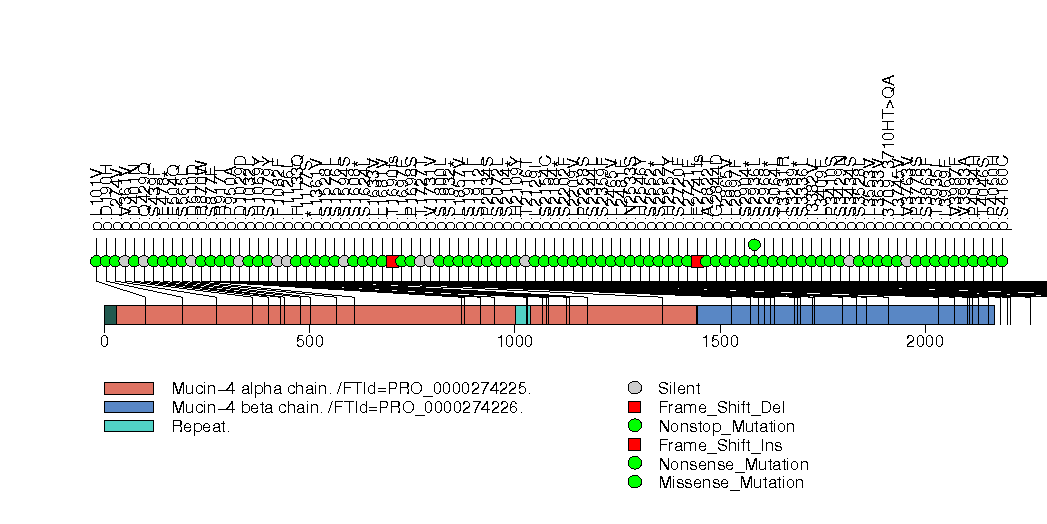
Figure S12. This figure depicts the distribution of mutations and mutation types across the C3orf70 significant gene.
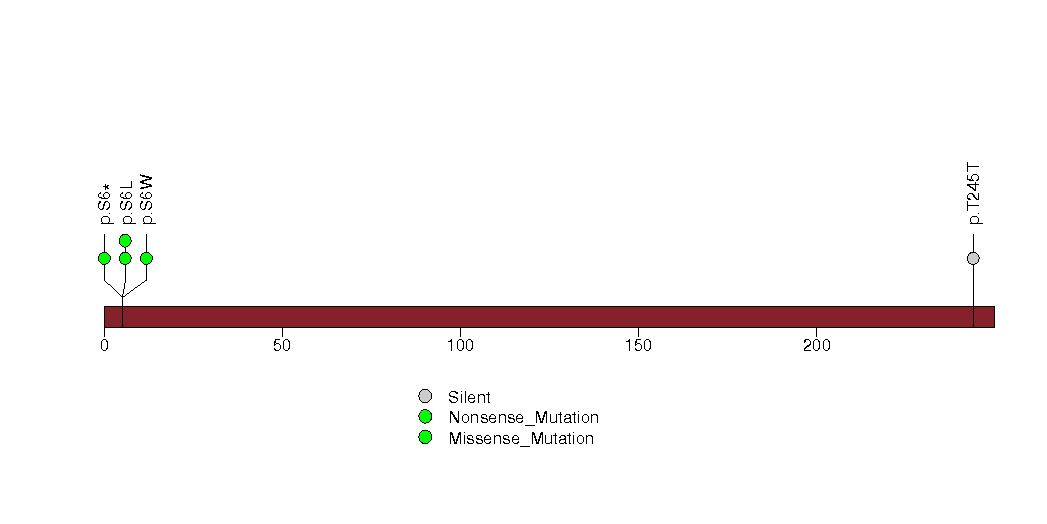
Figure S13. This figure depicts the distribution of mutations and mutation types across the ARID1A significant gene.
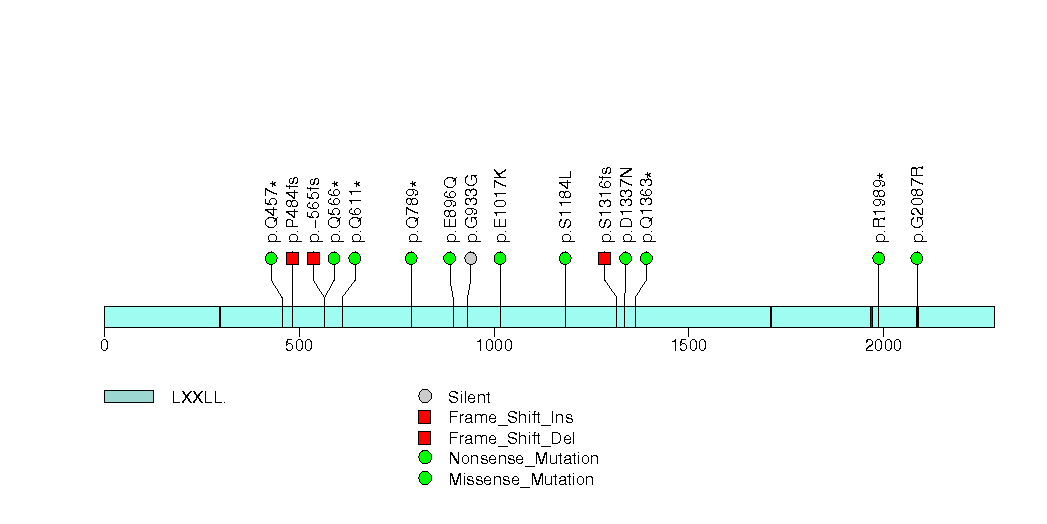
Figure S14. This figure depicts the distribution of mutations and mutation types across the RB1 significant gene.
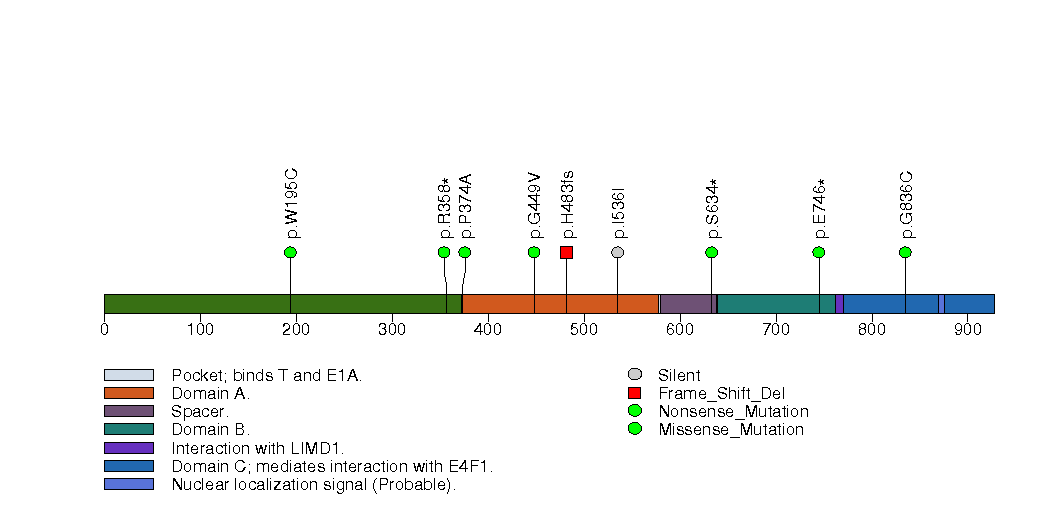
Figure S15. This figure depicts the distribution of mutations and mutation types across the ZNF578 significant gene.

In this analysis, COSMIC is used as a filter to increase power by restricting the territory of each gene. Cosmic version: v48.
Table 4. Get Full Table Significantly mutated genes (COSMIC territory only). To access the database please go to: COSMIC. Number of significant genes found: 10. Number of genes displayed: 10
| rank | gene | description | n | cos | n_cos | N_cos | cos_ev | p | q |
|---|---|---|---|---|---|---|---|---|---|
| 1 | KRAS | v-Ki-ras2 Kirsten rat sarcoma viral oncogene homolog | 11 | 52 | 11 | 10088 | 106540 | 4.5e-13 | 1.7e-09 |
| 2 | FBXW7 | F-box and WD repeat domain containing 7 | 20 | 91 | 14 | 17654 | 534 | 7.6e-13 | 1.7e-09 |
| 3 | PIK3CA | phosphoinositide-3-kinase, catalytic, alpha polypeptide | 58 | 220 | 52 | 42680 | 24079 | 1.6e-12 | 2.5e-09 |
| 4 | PTEN | phosphatase and tensin homolog (mutated in multiple advanced cancers 1) | 17 | 767 | 16 | 148798 | 773 | 3.6e-12 | 3.8e-09 |
| 5 | TP53 | tumor protein p53 | 12 | 356 | 10 | 69064 | 707 | 4.2e-12 | 3.8e-09 |
| 6 | ERBB3 | v-erb-b2 erythroblastic leukemia viral oncogene homolog 3 (avian) | 12 | 6 | 4 | 1164 | 4 | 3.2e-11 | 2.4e-08 |
| 7 | ERBB2 | v-erb-b2 erythroblastic leukemia viral oncogene homolog 2, neuro/glioblastoma derived oncogene homolog (avian) | 11 | 42 | 5 | 8148 | 11 | 5.4e-10 | 3.5e-07 |
| 8 | RB1 | retinoblastoma 1 (including osteosarcoma) | 9 | 267 | 5 | 51798 | 12 | 4.8e-06 | 0.0027 |
| 9 | STK11 | serine/threonine kinase 11 | 8 | 130 | 4 | 25220 | 7 | 6.4e-06 | 0.0032 |
| 10 | MTOR | mechanistic target of rapamycin (serine/threonine kinase) | 12 | 10 | 2 | 1940 | 2 | 0.000038 | 0.017 |
Note:
n - number of (nonsilent) mutations in this gene across the individual set.
cos = number of unique mutated sites in this gene in COSMIC
n_cos = overlap between n and cos.
N_cos = number of individuals times cos.
cos_ev = total evidence: number of reports in COSMIC for mutations seen in this gene.
p = p-value for seeing the observed amount of overlap in this gene)
q = q-value, False Discovery Rate (Benjamini-Hochberg procedure)
Table 5. Get Full Table A Ranked List of Significantly Mutated Genesets. (Source: MSigDB GSEA Cannonical Pathway Set).Number of significant genesets found: 34. Number of genesets displayed: 10
| rank | geneset | description | genes | N_genes | mut_tally | N | n | npat | nsite | nsil | n1 | n2 | n3 | n4 | n5 | n6 | p_ns_s | p | q |
|---|---|---|---|---|---|---|---|---|---|---|---|---|---|---|---|---|---|---|---|
| 1 | CTLA4PATHWAY | T cell activation requires interaction with an antigen-MHC-I complex on an antigen-presenting cell (APC), as well as CD28 interaction with the APC's CD80 or 86. | CD28, CD3D, CD3E, CD3G, CD3Z, CD80, CD86, CTLA4, GRB2, HLA-DRA, HLA-DRB1, ICOS, ICOSL, IL2, ITK, LCK, PIK3CA, PIK3R1, PTPN11, TRA@, TRB@ | 17 | CD3D(2), HLA-DRA(1), HLA-DRB1(1), ITK(1), PIK3CA(58), PIK3R1(9) | 3581149 | 72 | 60 | 33 | 1 | 50 | 4 | 6 | 8 | 4 | 0 | 1.7e-07 | <1.00e-15 | <4.33e-13 |
| 2 | PTENPATHWAY | PTEN suppresses AKT-induced cell proliferation and antagonizes the action of PI3K. | AKT1, BCAR1, CDKN1B, FOXO3A, GRB2, ILK, ITGB1, MAPK1, MAPK3, PDK2, PDPK1, PIK3CA, PIK3R1, PTEN, PTK2, SHC1, SOS1, TNFSF6 | 16 | AKT1(3), ITGB1(2), MAPK1(9), MAPK3(1), PDK2(1), PDPK1(2), PIK3CA(58), PIK3R1(9), PTEN(17), PTK2(2), SOS1(5) | 5594594 | 109 | 76 | 61 | 6 | 73 | 5 | 8 | 9 | 14 | 0 | 2.5e-06 | 2.33e-15 | 4.33e-13 |
| 3 | SA_PTEN_PATHWAY | PTEN is a tumor suppressor that dephosphorylates the lipid messenger phosphatidylinositol triphosphate. | AKT1, AKT2, AKT3, BPNT1, GRB2, ILK, MAPK1, MAPK3, PDK1, PIK3CA, PIK3CD, PIP3-E, PTEN, PTK2B, RBL2, SHC1, SOS1 | 16 | AKT1(3), AKT2(1), AKT3(3), MAPK1(9), MAPK3(1), PDK1(3), PIK3CA(58), PIK3CD(1), PTEN(17), PTK2B(3), RBL2(2), SOS1(5) | 5880977 | 106 | 74 | 58 | 6 | 74 | 2 | 7 | 8 | 15 | 0 | 4.3e-07 | 3.44e-15 | 4.33e-13 |
| 4 | AKTPATHWAY | Second messenger PIP3 promotes cell survival by activating the anti-apoptotic kinase AKT. | AKT1, BAD, CASP9, CHUK, FOXO1A, FOXO3A, GH1, GHR, HSPCA, MLLT7, NFKB1, NFKBIA, PDPK1, PIK3CA, PIK3R1, PPP2CA, RELA, TNFSF6, YWHAH | 14 | AKT1(3), BAD(2), CASP9(1), CHUK(2), GHR(6), NFKB1(2), NFKBIA(2), PDPK1(2), PIK3CA(58), PIK3R1(9), RELA(5) | 4124019 | 92 | 71 | 52 | 7 | 63 | 3 | 9 | 10 | 7 | 0 | 0.00011 | 4.22e-15 | 4.33e-13 |
| 5 | PLCPATHWAY | Phospholipase C hydrolyzes the membrane lipid PIP2 to DAG, which activates protein kinase C, and IP3, which causes calcium influx. | AKT1, PIK3CA, PIK3R1, PLCB1, PLCG1, PRKCA, PRKCB1, VAV1 | 7 | AKT1(3), PIK3CA(58), PIK3R1(9), PLCB1(10), PLCG1(3), PRKCA(3), VAV1(2) | 3764925 | 88 | 70 | 48 | 5 | 65 | 2 | 7 | 9 | 5 | 0 | 4.7e-06 | 5.22e-15 | 4.33e-13 |
| 6 | NKCELLSPATHWAY | Natural killer (NK) lymphocytes are inhibited by MHC and activated by surface glycoproteins on tumor or virus-infected cells, which undergo perforin-mediated lysis. | B2M, HLA-A, IL18, ITGB1, KLRC1, KLRC2, KLRC3, KLRC4, KLRD1, LAT, MAP2K1, MAPK3, PAK1, PIK3CA, PIK3R1, PTK2B, PTPN6, RAC1, SYK, VAV1 | 20 | B2M(3), HLA-A(17), ITGB1(2), KLRC4(1), KLRD1(2), LAT(1), MAP2K1(2), MAPK3(1), PAK1(1), PIK3CA(58), PIK3R1(9), PTK2B(3), RAC1(1), SYK(1), VAV1(2) | 5484583 | 104 | 78 | 62 | 7 | 59 | 2 | 10 | 10 | 23 | 0 | 5.4e-06 | 5.33e-15 | 4.33e-13 |
| 7 | ERK5PATHWAY | Signaling between a tissue and its innervating axon stimulates retrograde transport via Trk receptors, which activate Erk5, which induces transcription of anti-apoptotic factors. | AKT1, CREB1, GRB2, HRAS, MAPK1, MAPK3, MAPK7, MEF2A, MEF2B, MEF2C, MEF2D, NTRK1, PIK3CA, PIK3R1, PLCG1, RPS6KA1, SHC1 | 17 | AKT1(3), CREB1(2), HRAS(1), MAPK1(9), MAPK3(1), MAPK7(2), MEF2A(1), MEF2B(1), MEF2C(1), MEF2D(2), PIK3CA(58), PIK3R1(9), PLCG1(3), RPS6KA1(1) | 5735427 | 94 | 73 | 48 | 5 | 67 | 4 | 10 | 9 | 4 | 0 | 2.2e-07 | 5.55e-15 | 4.33e-13 |
| 8 | ACHPATHWAY | Nicotinic acetylcholine receptors are ligand-gated ion channels that primarily mediate neuromuscular signaling and may inhibit neuronal apoptosis via the AKT pathway. | AKT1, BAD, CHRNB1, CHRNG, FOXO3A, MUSK, PIK3CA, PIK3R1, PTK2, PTK2B, RAPSN, SRC, TERT, TNFSF6, YWHAH | 13 | AKT1(3), BAD(2), CHRNB1(1), CHRNG(1), MUSK(2), PIK3CA(58), PIK3R1(9), PTK2(2), PTK2B(3), TERT(1) | 4886895 | 82 | 67 | 42 | 5 | 54 | 3 | 9 | 10 | 6 | 0 | 1.3e-06 | 6.22e-15 | 4.33e-13 |
| 9 | CDC42RACPATHWAY | PI3 kinase stimulates cell migration by activating cdc42, which activates ARP2/3, which in turn promotes formation of new actin fibers. | ACTR2, ACTR3, ARHA, ARPC1A, ARPC1B, ARPC2, ARPC3, ARPC4, CDC42, PAK1, PDGFRA, PIK3CA, PIK3R1, RAC1, WASL | 14 | ACTR2(1), ARPC1A(2), ARPC2(3), CDC42(1), PAK1(1), PDGFRA(2), PIK3CA(58), PIK3R1(9), RAC1(1), WASL(4) | 3919913 | 82 | 66 | 43 | 4 | 58 | 2 | 7 | 9 | 6 | 0 | 0.000013 | 6.33e-15 | 4.33e-13 |
| 10 | HCMVPATHWAY | Cytomegalovirus activates MAP kinase pathways in the host cell, inducing transcription of viral genes. | AKT1, CREB1, MAP2K1, MAP2K2, MAP2K3, MAP2K6, MAP3K1, MAPK1, MAPK14, MAPK3, NFKB1, PIK3CA, PIK3R1, RB1, RELA, SP1 | 16 | AKT1(3), CREB1(2), MAP2K1(2), MAP2K3(2), MAP3K1(4), MAPK1(9), MAPK3(1), NFKB1(2), PIK3CA(58), PIK3R1(9), RB1(9), RELA(5), SP1(3) | 5748570 | 109 | 75 | 63 | 7 | 74 | 4 | 11 | 10 | 9 | 1 | 5.2e-06 | 7.66e-15 | 4.54e-13 |
Table 6. Get Full Table A Ranked List of Significantly Mutated Genesets (Excluding Significantly Mutated Genes). Number of significant genesets found: 0. Number of genesets displayed: 10
| rank | geneset | description | genes | N_genes | mut_tally | N | n | npat | nsite | nsil | n1 | n2 | n3 | n4 | n5 | n6 | p_ns_s | p | q |
|---|---|---|---|---|---|---|---|---|---|---|---|---|---|---|---|---|---|---|---|
| 1 | HSA00130_UBIQUINONE_BIOSYNTHESIS | Genes involved in ubiquinone biosynthesis | COQ2, COQ3, COQ5, COQ6, COQ7, ND1, ND2, ND3, ND4, ND4L, ND5, ND6, NDUFA12, NDUFA13, NDUFB11 | 8 | COQ3(3), COQ5(2), COQ6(1), COQ7(1), NDUFA13(3), NDUFB11(3) | 1217340 | 13 | 13 | 13 | 1 | 6 | 1 | 3 | 0 | 2 | 1 | 0.18 | 0.00027 | 0.17 |
| 2 | GSPATHWAY | Activated G-protein coupled receptors stimulate cAMP production and thus activate protein kinase A, involved in a number of signal transduction pathways. | ADCY1, GNAS, GNB1, GNGT1, PRKACA, PRKAR1A | 6 | ADCY1(4), GNAS(6), GNB1(1), GNGT1(1), PRKACA(2) | 1769339 | 14 | 14 | 14 | 1 | 7 | 1 | 4 | 1 | 1 | 0 | 0.076 | 0.039 | 1 |
| 3 | TUBBYPATHWAY | Tubby is activated by phospholipase C activity and hydrolysis of PIP2, after which it enters the nucleus and regulates transcription. | CHRM1, GNAQ, GNB1, GNGT1, HTR2C, PLCB1, TUB | 7 | CHRM1(1), GNAQ(2), GNB1(1), GNGT1(1), HTR2C(2), PLCB1(10), TUB(3) | 2066687 | 20 | 18 | 20 | 3 | 11 | 1 | 3 | 4 | 1 | 0 | 0.14 | 0.053 | 1 |
| 4 | TERCPATHWAY | hTERC, the RNA subunit of telomerase, and hTERT, the catalytic protein subunit, are required for telomerase activity and are overexpressed in many cancers. | NFYA, NFYB, NFYC, RB1, SP1, SP3 | 5 | NFYA(3), NFYB(1), NFYC(1), SP1(3), SP3(2) | 1417365 | 10 | 10 | 10 | 0 | 8 | 0 | 2 | 0 | 0 | 0 | 0.076 | 0.058 | 1 |
| 5 | HSA00643_STYRENE_DEGRADATION | Genes involved in styrene degradation | FAH, GSTZ1, HGD | 3 | FAH(3), GSTZ1(1), HGD(2) | 656562 | 6 | 6 | 6 | 0 | 5 | 0 | 0 | 1 | 0 | 0 | 0.14 | 0.068 | 1 |
| 6 | HSA00791_ATRAZINE_DEGRADATION | Genes involved in atrazine degradation | ADAR, APOBEC1, APOBEC2, APOBEC3A, APOBEC3B, APOBEC3C, APOBEC3F, APOBEC3G, APOBEC4 | 9 | ADAR(5), APOBEC1(1), APOBEC3B(1), APOBEC3F(2), APOBEC3G(6), APOBEC4(3) | 2134444 | 18 | 16 | 18 | 3 | 6 | 1 | 8 | 0 | 3 | 0 | 0.18 | 0.077 | 1 |
| 7 | TCRAPATHWAY | The kinases Lck and Fyn phosphorylate and activate the T cell receptor, which recognizes antigen-bound MHCII and leads to T cell activation. | CD3D, CD3E, CD3G, CD3Z, CD4, FYN, HLA-DRA, HLA-DRB1, LCK, PTPRC, TRA@, TRB@, ZAP70 | 10 | CD3D(2), CD4(1), FYN(3), HLA-DRA(1), HLA-DRB1(1), PTPRC(9), ZAP70(2) | 2462474 | 19 | 18 | 19 | 3 | 8 | 3 | 3 | 1 | 4 | 0 | 0.21 | 0.079 | 1 |
| 8 | STEROID_BIOSYNTHESIS | CYP17A1, F13B, HSD17B1, HSD17B2, HSD17B3, HSD17B4, HSD17B7, HSD3B1, HSD3B2 | 9 | CYP17A1(2), F13B(2), HSD17B4(10), HSD17B7(2), HSD3B1(2), HSD3B2(1) | 2356166 | 19 | 14 | 19 | 2 | 10 | 0 | 3 | 2 | 4 | 0 | 0.074 | 0.09 | 1 | |
| 9 | IFNGPATHWAY | IFN gamma signaling pathway | IFNG, IFNGR1, IFNGR2, JAK1, JAK2, STAT1 | 6 | IFNG(1), IFNGR1(6), IFNGR2(2), JAK1(1), JAK2(6), STAT1(2) | 2394449 | 18 | 17 | 17 | 3 | 8 | 2 | 0 | 0 | 7 | 1 | 0.37 | 0.091 | 1 |
| 10 | HSA00062_FATTY_ACID_ELONGATION_IN_MITOCHONDRIA | Genes involved in fatty acid elongation in mitochondria | ACAA2, ECHS1, HADH, HADHA, HADHB, HSD17B10, HSD17B4, MECR, PPT1, PPT2 | 10 | ACAA2(1), HADH(1), HSD17B10(1), HSD17B4(10), MECR(1), PPT1(1), PPT2(1) | 2402078 | 16 | 13 | 16 | 1 | 7 | 2 | 3 | 1 | 3 | 0 | 0.062 | 0.1 | 1 |
In brief, we tabulate the number of mutations and the number of covered bases for each gene. The counts are broken down by mutation context category: four context categories that are discovered by MutSig, and one for indel and 'null' mutations, which include indels, nonsense mutations, splice-site mutations, and non-stop (read-through) mutations. For each gene, we calculate the probability of seeing the observed constellation of mutations, i.e. the product P1 x P2 x ... x Pm, or a more extreme one, given the background mutation rates calculated across the dataset. [1]
In addition to the links below, the full results of the analysis summarized in this report can also be downloaded programmatically using firehose_get, or interactively from either the Broad GDAC website or TCGA Data Coordination Center Portal.