This pipeline computes the correlation between APOBRC groups and selected clinical features.
Testing the association between APOBEC groups identified by 2 different apobec score and 15 clinical features across 185 patients, 3 significant findings detected with Q value < 0.25.
-
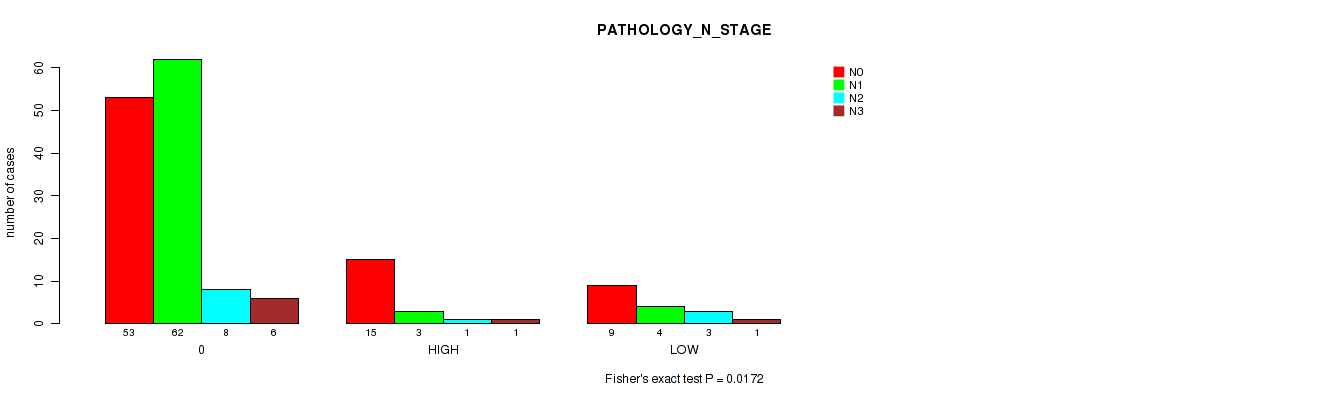
3 subtypes identified in current cancer cohort by 'APOBEC MUTLOAD MINESTIMATE'. These subtypes correlate to 'PATHOLOGY_N_STAGE' and 'HISTOLOGICAL_TYPE'.
-
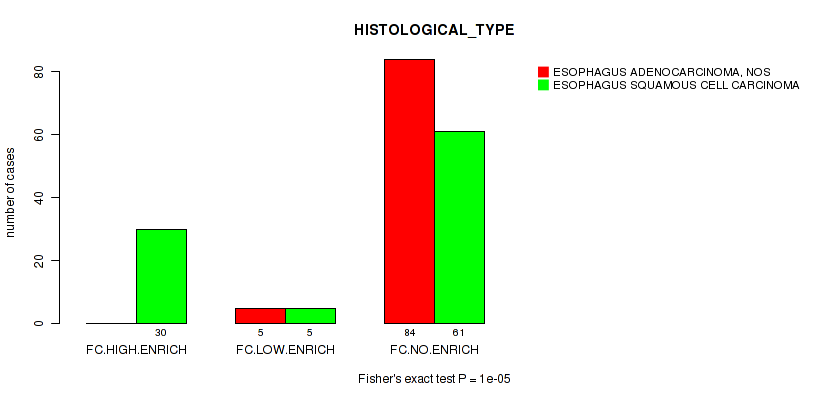
3 subtypes identified in current cancer cohort by 'APOBEC ENRICH'. These subtypes correlate to 'HISTOLOGICAL_TYPE'.
Table 1. Get Full Table Overview of the association between APOBEC groups by 2 different APOBEC scores and 15 clinical features. Shown in the table are P values (Q values). Thresholded by Q value < 0.25, 3 significant findings detected.
|
Clinical Features |
Statistical Tests |
APOBEC MUTLOAD MINESTIMATE |
APOBEC ENRICH |
| Time to Death | logrank test |
0.91 (0.957) |
0.925 (0.957) |
| YEARS TO BIRTH | Kruskal-Wallis (anova) |
0.598 (0.781) |
0.0723 (0.31) |
| PATHOLOGIC STAGE | Fisher's exact test |
0.0913 (0.342) |
0.0687 (0.31) |
| PATHOLOGY T STAGE | Fisher's exact test |
0.294 (0.503) |
0.159 (0.427) |
| PATHOLOGY N STAGE | Fisher's exact test |
0.0172 (0.172) |
0.0369 (0.277) |
| PATHOLOGY M STAGE | Fisher's exact test |
0.504 (0.709) |
1 (1.00) |
| GENDER | Fisher's exact test |
0.0521 (0.31) |
0.52 (0.709) |
| RADIATION THERAPY | Fisher's exact test |
0.152 (0.427) |
0.146 (0.427) |
| KARNOFSKY PERFORMANCE SCORE | Kruskal-Wallis (anova) |
0.648 (0.793) |
0.866 (0.957) |
| HISTOLOGICAL TYPE | Fisher's exact test |
1e-05 (0.00015) |
1e-05 (0.00015) |
| NUMBER PACK YEARS SMOKED | Kruskal-Wallis (anova) |
0.278 (0.503) |
0.185 (0.427) |
| RESIDUAL TUMOR | Fisher's exact test |
0.66 (0.793) |
0.225 (0.481) |
| NUMBER OF LYMPH NODES | Kruskal-Wallis (anova) |
0.302 (0.503) |
0.751 (0.866) |
| RACE | Fisher's exact test |
0.249 (0.498) |
0.173 (0.427) |
| ETHNICITY | Fisher's exact test |
0.52 (0.709) |
0.453 (0.709) |
Table S1. Description of APOBEC group #1: 'APOBEC MUTLOAD MINESTIMATE'
| Cluster Labels | 0 | HIGH | LOW |
|---|---|---|---|
| Number of samples | 145 | 20 | 20 |
P value = 0.0172 (Fisher's exact test), Q value = 0.17
Table S2. Clustering Approach #1: 'APOBEC MUTLOAD MINESTIMATE' versus Clinical Feature #5: 'PATHOLOGY_N_STAGE'
| nPatients | N0 | N1 | N2 | N3 |
|---|---|---|---|---|
| ALL | 77 | 69 | 12 | 8 |
| 0 | 53 | 62 | 8 | 6 |
| HIGH | 15 | 3 | 1 | 1 |
| LOW | 9 | 4 | 3 | 1 |
Figure S1. Get High-res Image Clustering Approach #1: 'APOBEC MUTLOAD MINESTIMATE' versus Clinical Feature #5: 'PATHOLOGY_N_STAGE'
P value = 1e-05 (Fisher's exact test), Q value = 0.00015
Table S3. Clustering Approach #1: 'APOBEC MUTLOAD MINESTIMATE' versus Clinical Feature #10: 'HISTOLOGICAL_TYPE'
| nPatients | ESOPHAGUS ADENOCARCINOMA, NOS | ESOPHAGUS SQUAMOUS CELL CARCINOMA |
|---|---|---|
| ALL | 89 | 96 |
| 0 | 84 | 61 |
| HIGH | 0 | 20 |
| LOW | 5 | 15 |
Figure S2. Get High-res Image Clustering Approach #1: 'APOBEC MUTLOAD MINESTIMATE' versus Clinical Feature #10: 'HISTOLOGICAL_TYPE'
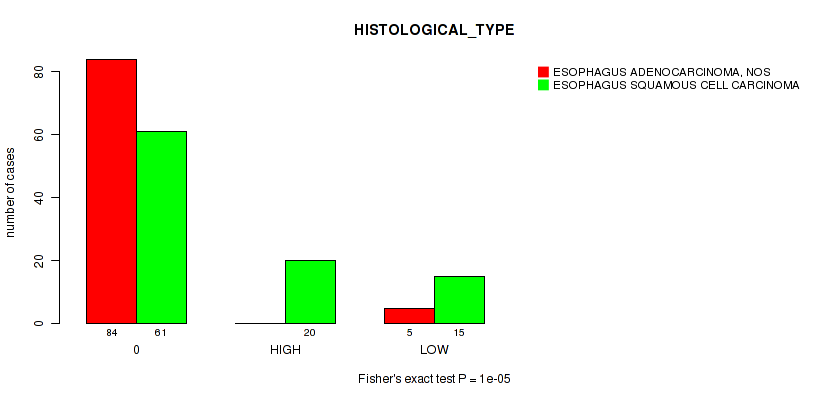
Table S4. Description of APOBEC group #2: 'APOBEC ENRICH'
| Cluster Labels | FC.HIGH.ENRICH | FC.LOW.ENRICH | FC.NO.ENRICH |
|---|---|---|---|
| Number of samples | 30 | 10 | 145 |
P value = 1e-05 (Fisher's exact test), Q value = 0.00015
Table S5. Clustering Approach #2: 'APOBEC ENRICH' versus Clinical Feature #10: 'HISTOLOGICAL_TYPE'
| nPatients | ESOPHAGUS ADENOCARCINOMA, NOS | ESOPHAGUS SQUAMOUS CELL CARCINOMA |
|---|---|---|
| ALL | 89 | 96 |
| FC.HIGH.ENRICH | 0 | 30 |
| FC.LOW.ENRICH | 5 | 5 |
| FC.NO.ENRICH | 84 | 61 |
Figure S3. Get High-res Image Clustering Approach #2: 'APOBEC ENRICH' versus Clinical Feature #10: 'HISTOLOGICAL_TYPE'
-
APOBEC groups file = /xchip/cga/gdac-prod/tcga-gdac/jobResults/APOBEC_Pipelines/ESCA-TP/22533622/APOBEC_clinical_corr_input_22539540/APOBEC_for_clinical.correlaion.input.categorical.txt
-
Clinical data file = /xchip/cga/gdac-prod/tcga-gdac/jobResults/Append_Data/ESCA-TP/22506419/ESCA-TP.merged_data.txt
-
Number of patients = 185
-
Number of selected clinical features = 15
APOBEC classification based on APOBEC_MutLoad_MinEstimate : a. APOBEC non group -- samples with zero value, b. APOBEC high group -- samples above median value in non zero samples, c. APOBEC low group -- samples below median value in non zero samples.
APOBEC classification based on APOBEC_enrich : a. No Enrichmment group -- all samples with BH_Fisher_p-value_tCw > 0.05, b. Low enrichment group -- samples with BH_Fisher_p-value_tCw = < 0.05 and APOBEC_enrich=<2, c. High enrichment group -- samples with BH_Fisher_p-value_tCw =< 0.05 and APOBEC_enrich>2.
For survival clinical features, the Kaplan-Meier survival curves of tumors with and without gene mutations were plotted and the statistical significance P values were estimated by logrank test (Bland and Altman 2004) using the 'survdiff' function in R
For binary clinical features, two-tailed Fisher's exact tests (Fisher 1922) were used to estimate the P values using the 'fisher.test' function in R
For multiple hypothesis correction, Q value is the False Discovery Rate (FDR) analogue of the P value (Benjamini and Hochberg 1995), defined as the minimum FDR at which the test may be called significant. We used the 'Benjamini and Hochberg' method of 'p.adjust' function in R to convert P values into Q values.
In addition to the links below, the full results of the analysis summarized in this report can also be downloaded programmatically using firehose_get, or interactively from either the Broad GDAC website or TCGA Data Coordination Center Portal.