This pipeline computes the correlation between significant arm-level copy number variations (cnvs) and selected clinical features.
Testing the association between copy number variation 82 arm-level events and 8 clinical features across 573 patients, 15 significant findings detected with Q value < 0.25.
-
7p gain cnv correlated to 'Time to Death' and 'YEARS_TO_BIRTH'.
-
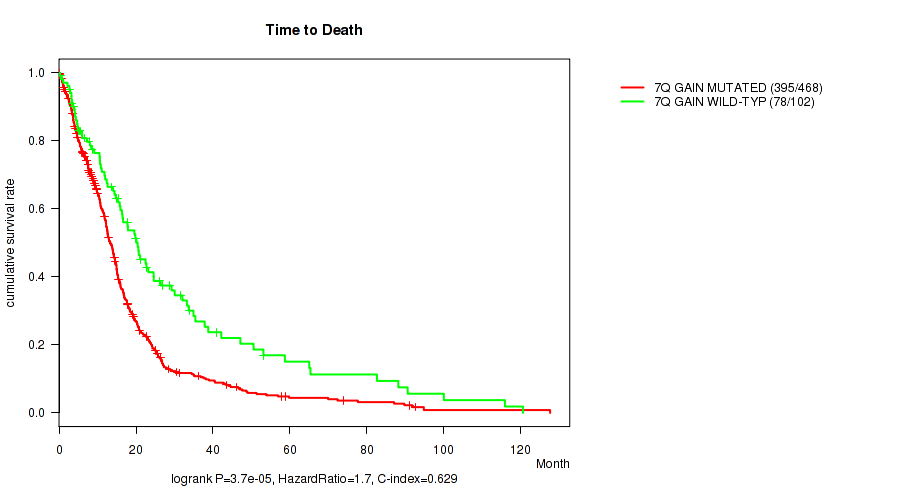
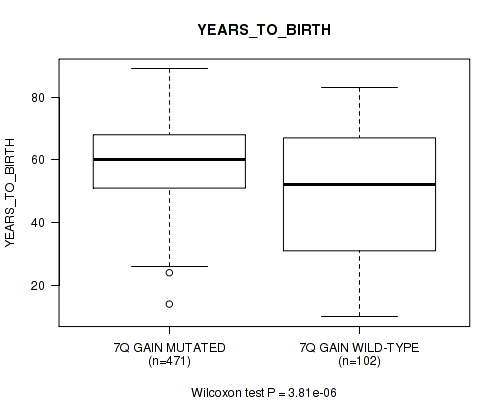
7q gain cnv correlated to 'Time to Death' and 'YEARS_TO_BIRTH'.
-
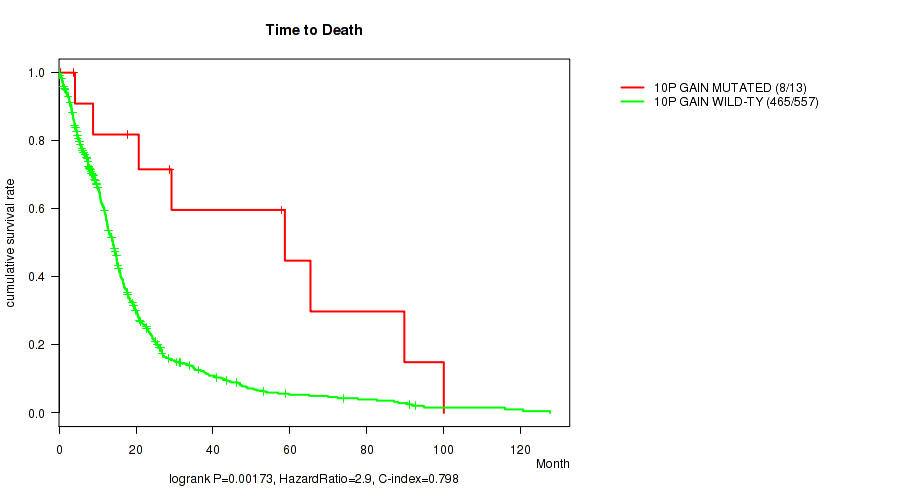
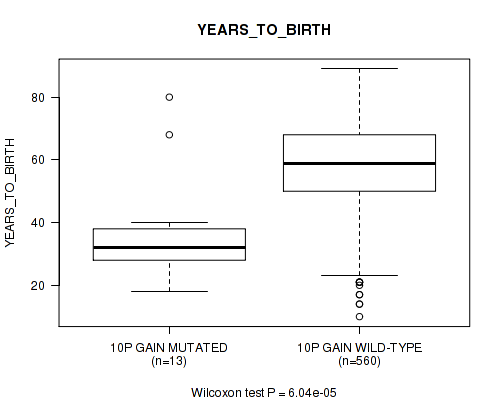
10p gain cnv correlated to 'Time to Death' and 'YEARS_TO_BIRTH'.
-
17q gain cnv correlated to 'YEARS_TO_BIRTH'.
-
20p gain cnv correlated to 'YEARS_TO_BIRTH'.
-
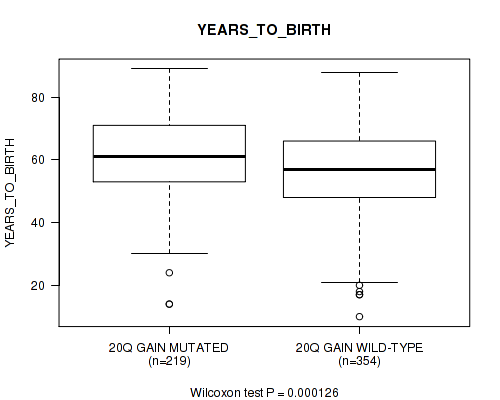
20q gain cnv correlated to 'YEARS_TO_BIRTH'.
-
6p loss cnv correlated to 'Time to Death'.
-
8p loss cnv correlated to 'RACE'.
-
10p loss cnv correlated to 'Time to Death' and 'YEARS_TO_BIRTH'.
-
10q loss cnv correlated to 'Time to Death' and 'YEARS_TO_BIRTH'.
Table 1. Get Full Table Overview of the association between significant copy number variation of 82 arm-level events and 8 clinical features. Shown in the table are P values (Q values). Thresholded by Q value < 0.25, 15 significant findings detected.
|
Clinical Features |
Time to Death |
YEARS TO BIRTH |
GENDER |
RADIATION THERAPY |
KARNOFSKY PERFORMANCE SCORE |
HISTOLOGICAL TYPE |
RACE | ETHNICITY | ||
| nCNV (%) | nWild-Type | logrank test | Wilcoxon-test | Fisher's exact test | Fisher's exact test | Wilcoxon-test | Fisher's exact test | Fisher's exact test | Fisher's exact test | |
| 7p gain | 465 (81%) | 108 |
3.71e-05 (0.00347) |
1.91e-06 (0.000418) |
0.744 (1.00) |
0.207 (1.00) |
0.995 (1.00) |
0.0404 (0.822) |
0.0534 (0.822) |
0.268 (1.00) |
| 7q gain | 471 (82%) | 102 |
3.7e-05 (0.00347) |
3.81e-06 (0.000626) |
0.219 (1.00) |
0.331 (1.00) |
0.688 (1.00) |
0.0401 (0.822) |
0.0358 (0.822) |
0.248 (1.00) |
| 10p gain | 13 (2%) | 560 |
0.00173 (0.0945) |
6.04e-05 (0.00495) |
0.0404 (0.822) |
0.375 (1.00) |
0.336 (1.00) |
0.298 (1.00) |
0.0123 (0.393) |
0.28 (1.00) |
| 10p loss | 476 (83%) | 97 |
0.000102 (0.00741) |
3.55e-09 (2.33e-06) |
0.209 (1.00) |
0.505 (1.00) |
0.0479 (0.822) |
0.00669 (0.274) |
0.128 (0.992) |
0.239 (1.00) |
| 10q loss | 488 (85%) | 85 |
0.000333 (0.0198) |
1.81e-07 (5.92e-05) |
0.549 (1.00) |
0.861 (1.00) |
0.0084 (0.324) |
0.085 (0.887) |
0.0589 (0.84) |
0.0971 (0.91) |
| 17q gain | 61 (11%) | 512 |
0.0126 (0.393) |
0.00564 (0.247) |
0.488 (1.00) |
0.216 (1.00) |
0.51 (1.00) |
0.439 (1.00) |
0.541 (1.00) |
0.632 (1.00) |
| 20p gain | 221 (39%) | 352 |
0.322 (1.00) |
2.45e-05 (0.00322) |
0.292 (1.00) |
0.898 (1.00) |
0.827 (1.00) |
0.489 (1.00) |
0.0385 (0.822) |
1 (1.00) |
| 20q gain | 219 (38%) | 354 |
0.53 (1.00) |
0.000126 (0.00829) |
0.219 (1.00) |
1 (1.00) |
0.75 (1.00) |
0.501 (1.00) |
0.0526 (0.822) |
1 (1.00) |
| 6p loss | 87 (15%) | 486 |
0.00191 (0.0966) |
0.345 (1.00) |
0.721 (1.00) |
0.22 (1.00) |
0.638 (1.00) |
0.515 (1.00) |
0.257 (1.00) |
0.702 (1.00) |
| 8p loss | 58 (10%) | 515 |
0.743 (1.00) |
0.183 (1.00) |
0.157 (1.00) |
0.68 (1.00) |
0.389 (1.00) |
0.496 (1.00) |
0.00421 (0.197) |
0.618 (1.00) |
| 1p gain | 82 (14%) | 491 |
0.281 (1.00) |
0.413 (1.00) |
0.542 (1.00) |
0.155 (1.00) |
0.0837 (0.887) |
0.118 (0.992) |
0.9 (1.00) |
0.667 (1.00) |
| 1q gain | 89 (16%) | 484 |
0.795 (1.00) |
0.553 (1.00) |
0.24 (1.00) |
0.228 (1.00) |
0.205 (1.00) |
0.355 (1.00) |
0.779 (1.00) |
0.69 (1.00) |
| 2p gain | 37 (6%) | 536 |
0.661 (1.00) |
0.798 (1.00) |
0.163 (1.00) |
0.451 (1.00) |
0.379 (1.00) |
0.89 (1.00) |
0.336 (1.00) |
1 (1.00) |
| 2q gain | 35 (6%) | 538 |
0.577 (1.00) |
0.391 (1.00) |
0.476 (1.00) |
0.792 (1.00) |
0.238 (1.00) |
1 (1.00) |
0.309 (1.00) |
1 (1.00) |
| 3p gain | 57 (10%) | 516 |
0.811 (1.00) |
0.0478 (0.822) |
0.319 (1.00) |
0.537 (1.00) |
0.567 (1.00) |
0.572 (1.00) |
0.927 (1.00) |
1 (1.00) |
| 3q gain | 63 (11%) | 510 |
0.669 (1.00) |
0.118 (0.992) |
0.413 (1.00) |
0.843 (1.00) |
0.512 (1.00) |
0.409 (1.00) |
0.932 (1.00) |
1 (1.00) |
| 4p gain | 35 (6%) | 538 |
0.518 (1.00) |
0.653 (1.00) |
1 (1.00) |
0.792 (1.00) |
0.043 (0.822) |
1 (1.00) |
0.723 (1.00) |
0.562 (1.00) |
| 4q gain | 34 (6%) | 539 |
0.879 (1.00) |
0.768 (1.00) |
0.368 (1.00) |
1 (1.00) |
0.086 (0.887) |
1 (1.00) |
0.545 (1.00) |
1 (1.00) |
| 5p gain | 49 (9%) | 524 |
0.714 (1.00) |
0.671 (1.00) |
0.169 (1.00) |
0.375 (1.00) |
0.191 (1.00) |
0.0964 (0.91) |
1 (1.00) |
0.296 (1.00) |
| 5q gain | 41 (7%) | 532 |
0.372 (1.00) |
0.54 (1.00) |
0.134 (0.996) |
0.213 (1.00) |
0.686 (1.00) |
0.126 (0.992) |
0.832 (1.00) |
0.613 (1.00) |
| 6p gain | 24 (4%) | 549 |
0.248 (1.00) |
0.487 (1.00) |
0.671 (1.00) |
1 (1.00) |
0.816 (1.00) |
1 (1.00) |
0.48 (1.00) |
1 (1.00) |
| 6q gain | 23 (4%) | 550 |
0.189 (1.00) |
0.244 (1.00) |
1 (1.00) |
1 (1.00) |
0.779 (1.00) |
1 (1.00) |
0.563 (1.00) |
1 (1.00) |
| 8p gain | 52 (9%) | 521 |
0.839 (1.00) |
0.788 (1.00) |
0.657 (1.00) |
0.375 (1.00) |
0.785 (1.00) |
0.594 (1.00) |
0.322 (1.00) |
1 (1.00) |
| 8q gain | 59 (10%) | 514 |
0.502 (1.00) |
0.356 (1.00) |
0.482 (1.00) |
0.675 (1.00) |
0.894 (1.00) |
0.499 (1.00) |
0.758 (1.00) |
1 (1.00) |
| 9p gain | 47 (8%) | 526 |
0.347 (1.00) |
0.663 (1.00) |
0.164 (1.00) |
0.356 (1.00) |
0.944 (1.00) |
0.11 (0.988) |
0.296 (1.00) |
0.239 (1.00) |
| 9q gain | 70 (12%) | 503 |
0.929 (1.00) |
0.738 (1.00) |
0.243 (1.00) |
0.124 (0.992) |
0.647 (1.00) |
0.584 (1.00) |
0.292 (1.00) |
0.643 (1.00) |
| 10q gain | 3 (1%) | 570 |
0.346 (1.00) |
0.665 (1.00) |
0.564 (1.00) |
1 (1.00) |
1 (1.00) |
1 (1.00) |
0.0723 (0.862) |
|
| 11p gain | 18 (3%) | 555 |
0.681 (1.00) |
0.667 (1.00) |
0.807 (1.00) |
0.491 (1.00) |
0.223 (1.00) |
0.787 (1.00) |
0.611 (1.00) |
0.35 (1.00) |
| 11q gain | 15 (3%) | 558 |
0.33 (1.00) |
0.0537 (0.822) |
0.18 (1.00) |
0.706 (1.00) |
0.0692 (0.856) |
0.502 (1.00) |
1 (1.00) |
0.316 (1.00) |
| 12p gain | 60 (10%) | 513 |
0.597 (1.00) |
0.38 (1.00) |
0.489 (1.00) |
0.0637 (0.84) |
0.594 (1.00) |
0.929 (1.00) |
0.93 (1.00) |
1 (1.00) |
| 12q gain | 49 (9%) | 524 |
0.993 (1.00) |
0.727 (1.00) |
0.285 (1.00) |
0.18 (1.00) |
0.858 (1.00) |
0.48 (1.00) |
0.149 (1.00) |
0.612 (1.00) |
| 13q gain | 10 (2%) | 563 |
0.442 (1.00) |
0.0112 (0.388) |
0.202 (1.00) |
0.294 (1.00) |
0.091 (0.896) |
0.59 (1.00) |
1 (1.00) |
1 (1.00) |
| 14q gain | 22 (4%) | 551 |
0.277 (1.00) |
0.0607 (0.84) |
0.513 (1.00) |
0.742 (1.00) |
0.521 (1.00) |
0.0833 (0.887) |
0.831 (1.00) |
1 (1.00) |
| 15q gain | 25 (4%) | 548 |
0.269 (1.00) |
0.903 (1.00) |
0.677 (1.00) |
0.13 (0.992) |
0.256 (1.00) |
0.839 (1.00) |
0.726 (1.00) |
1 (1.00) |
| 16p gain | 38 (7%) | 535 |
0.0444 (0.822) |
0.84 (1.00) |
0.306 (1.00) |
0.456 (1.00) |
0.971 (1.00) |
0.889 (1.00) |
0.464 (1.00) |
1 (1.00) |
| 16q gain | 37 (6%) | 536 |
0.172 (1.00) |
0.862 (1.00) |
0.606 (1.00) |
0.455 (1.00) |
0.919 (1.00) |
0.889 (1.00) |
0.449 (1.00) |
1 (1.00) |
| 17p gain | 49 (9%) | 524 |
0.0865 (0.887) |
0.0158 (0.451) |
0.223 (1.00) |
0.256 (1.00) |
0.638 (1.00) |
0.529 (1.00) |
0.421 (1.00) |
1 (1.00) |
| 18p gain | 58 (10%) | 515 |
0.445 (1.00) |
0.332 (1.00) |
0.571 (1.00) |
0.835 (1.00) |
0.336 (1.00) |
0.248 (1.00) |
0.192 (1.00) |
0.354 (1.00) |
| 18q gain | 58 (10%) | 515 |
0.554 (1.00) |
0.188 (1.00) |
0.157 (1.00) |
0.835 (1.00) |
0.257 (1.00) |
0.249 (1.00) |
0.404 (1.00) |
1 (1.00) |
| 19p gain | 224 (39%) | 349 |
0.463 (1.00) |
0.963 (1.00) |
0.861 (1.00) |
0.0959 (0.91) |
0.832 (1.00) |
0.524 (1.00) |
0.494 (1.00) |
0.552 (1.00) |
| 19q gain | 196 (34%) | 377 |
0.584 (1.00) |
0.445 (1.00) |
0.719 (1.00) |
0.692 (1.00) |
0.832 (1.00) |
0.832 (1.00) |
0.241 (1.00) |
0.356 (1.00) |
| 21q gain | 64 (11%) | 509 |
0.772 (1.00) |
0.0663 (0.852) |
1 (1.00) |
0.842 (1.00) |
0.655 (1.00) |
0.101 (0.924) |
0.117 (0.992) |
0.376 (1.00) |
| 22q gain | 34 (6%) | 539 |
0.199 (1.00) |
0.584 (1.00) |
1 (1.00) |
0.603 (1.00) |
0.373 (1.00) |
0.284 (1.00) |
0.795 (1.00) |
0.147 (1.00) |
| xp gain | 15 (3%) | 558 |
0.844 (1.00) |
0.433 (1.00) |
0.598 (1.00) |
0.705 (1.00) |
0.564 (1.00) |
0.737 (1.00) |
0.723 (1.00) |
0.203 (1.00) |
| xq gain | 17 (3%) | 556 |
0.507 (1.00) |
0.545 (1.00) |
0.806 (1.00) |
0.706 (1.00) |
0.694 (1.00) |
0.424 (1.00) |
0.571 (1.00) |
0.261 (1.00) |
| 1p loss | 16 (3%) | 557 |
0.565 (1.00) |
0.0299 (0.754) |
0.304 (1.00) |
0.439 (1.00) |
0.144 (1.00) |
0.394 (1.00) |
0.57 (1.00) |
1 (1.00) |
| 1q loss | 15 (3%) | 558 |
0.203 (1.00) |
0.0146 (0.436) |
0.791 (1.00) |
0.417 (1.00) |
0.01 (0.365) |
0.733 (1.00) |
0.725 (1.00) |
1 (1.00) |
| 2p loss | 32 (6%) | 541 |
0.697 (1.00) |
0.0835 (0.887) |
0.135 (0.996) |
0.0537 (0.822) |
0.897 (1.00) |
0.768 (1.00) |
0.89 (1.00) |
1 (1.00) |
| 2q loss | 33 (6%) | 540 |
0.759 (1.00) |
0.0849 (0.887) |
0.146 (1.00) |
0.0606 (0.84) |
0.658 (1.00) |
0.447 (1.00) |
0.893 (1.00) |
1 (1.00) |
| 3p loss | 41 (7%) | 532 |
0.52 (1.00) |
0.0714 (0.862) |
0.868 (1.00) |
0.0461 (0.822) |
0.94 (1.00) |
0.655 (1.00) |
0.75 (1.00) |
0.211 (1.00) |
| 3q loss | 36 (6%) | 537 |
0.96 (1.00) |
0.724 (1.00) |
0.597 (1.00) |
0.292 (1.00) |
0.583 (1.00) |
1 (1.00) |
0.903 (1.00) |
0.538 (1.00) |
| 4p loss | 56 (10%) | 517 |
0.176 (1.00) |
0.695 (1.00) |
0.313 (1.00) |
0.402 (1.00) |
0.311 (1.00) |
0.446 (1.00) |
0.247 (1.00) |
0.325 (1.00) |
| 4q loss | 55 (10%) | 518 |
0.0193 (0.526) |
0.115 (0.992) |
0.886 (1.00) |
0.394 (1.00) |
0.297 (1.00) |
0.71 (1.00) |
0.477 (1.00) |
0.287 (1.00) |
| 5p loss | 43 (8%) | 530 |
0.123 (0.992) |
0.534 (1.00) |
0.871 (1.00) |
0.34 (1.00) |
0.568 (1.00) |
0.898 (1.00) |
0.0898 (0.896) |
0.211 (1.00) |
| 5q loss | 45 (8%) | 528 |
0.0839 (0.887) |
0.442 (1.00) |
1 (1.00) |
0.344 (1.00) |
0.772 (1.00) |
0.446 (1.00) |
0.326 (1.00) |
0.0551 (0.822) |
| 6q loss | 126 (22%) | 447 |
0.172 (1.00) |
0.633 (1.00) |
0.258 (1.00) |
0.451 (1.00) |
0.954 (1.00) |
0.816 (1.00) |
0.254 (1.00) |
0.478 (1.00) |
| 7p loss | 8 (1%) | 565 |
0.464 (1.00) |
0.0523 (0.822) |
1 (1.00) |
1 (1.00) |
0.72 (1.00) |
1 (1.00) |
0.623 (1.00) |
1 (1.00) |
| 7q loss | 6 (1%) | 567 |
0.62 (1.00) |
0.0237 (0.623) |
1 (1.00) |
0.582 (1.00) |
0.303 (1.00) |
1 (1.00) |
0.522 (1.00) |
1 (1.00) |
| 8q loss | 42 (7%) | 531 |
0.064 (0.84) |
0.219 (1.00) |
0.416 (1.00) |
0.635 (1.00) |
0.257 (1.00) |
0.896 (1.00) |
0.285 (1.00) |
1 (1.00) |
| 9p loss | 201 (35%) | 372 |
0.403 (1.00) |
0.482 (1.00) |
0.858 (1.00) |
0.603 (1.00) |
0.766 (1.00) |
0.835 (1.00) |
0.518 (1.00) |
0.0638 (0.84) |
| 9q loss | 94 (16%) | 479 |
0.872 (1.00) |
0.714 (1.00) |
0.357 (1.00) |
0.396 (1.00) |
0.572 (1.00) |
0.201 (1.00) |
0.13 (0.992) |
0.235 (1.00) |
| 11p loss | 98 (17%) | 475 |
0.263 (1.00) |
0.922 (1.00) |
0.0546 (0.822) |
0.869 (1.00) |
0.498 (1.00) |
0.387 (1.00) |
0.665 (1.00) |
0.7 (1.00) |
| 11q loss | 92 (16%) | 481 |
0.863 (1.00) |
0.291 (1.00) |
0.415 (1.00) |
0.503 (1.00) |
0.752 (1.00) |
0.732 (1.00) |
0.952 (1.00) |
0.228 (1.00) |
| 12p loss | 59 (10%) | 514 |
0.556 (1.00) |
0.431 (1.00) |
0.401 (1.00) |
0.537 (1.00) |
0.851 (1.00) |
0.503 (1.00) |
0.167 (1.00) |
1 (1.00) |
| 12q loss | 57 (10%) | 516 |
0.82 (1.00) |
0.603 (1.00) |
0.568 (1.00) |
0.287 (1.00) |
0.99 (1.00) |
0.535 (1.00) |
0.194 (1.00) |
0.335 (1.00) |
| 13q loss | 185 (32%) | 388 |
0.658 (1.00) |
0.947 (1.00) |
1 (1.00) |
0.0836 (0.887) |
0.971 (1.00) |
0.557 (1.00) |
0.55 (1.00) |
0.759 (1.00) |
| 14q loss | 146 (25%) | 427 |
0.747 (1.00) |
0.765 (1.00) |
0.378 (1.00) |
0.2 (1.00) |
0.938 (1.00) |
0.439 (1.00) |
0.312 (1.00) |
0.311 (1.00) |
| 15q loss | 104 (18%) | 469 |
0.909 (1.00) |
0.0374 (0.822) |
0.506 (1.00) |
0.255 (1.00) |
0.871 (1.00) |
0.616 (1.00) |
1 (1.00) |
0.476 (1.00) |
| 16p loss | 63 (11%) | 510 |
0.0915 (0.896) |
0.325 (1.00) |
0.683 (1.00) |
0.414 (1.00) |
0.4 (1.00) |
0.158 (1.00) |
1 (1.00) |
1 (1.00) |
| 16q loss | 83 (14%) | 490 |
0.127 (0.992) |
0.917 (1.00) |
0.904 (1.00) |
0.368 (1.00) |
0.777 (1.00) |
0.568 (1.00) |
0.691 (1.00) |
0.698 (1.00) |
| 17p loss | 65 (11%) | 508 |
0.912 (1.00) |
0.348 (1.00) |
0.349 (1.00) |
0.557 (1.00) |
0.622 (1.00) |
0.487 (1.00) |
0.938 (1.00) |
1 (1.00) |
| 17q loss | 41 (7%) | 532 |
0.619 (1.00) |
0.389 (1.00) |
0.407 (1.00) |
0.809 (1.00) |
0.965 (1.00) |
1 (1.00) |
0.495 (1.00) |
0.596 (1.00) |
| 18p loss | 71 (12%) | 502 |
0.211 (1.00) |
0.833 (1.00) |
0.517 (1.00) |
0.182 (1.00) |
0.385 (1.00) |
0.476 (1.00) |
0.232 (1.00) |
0.65 (1.00) |
| 18q loss | 62 (11%) | 511 |
0.52 (1.00) |
0.767 (1.00) |
0.784 (1.00) |
0.0686 (0.856) |
0.338 (1.00) |
0.689 (1.00) |
0.19 (1.00) |
0.144 (1.00) |
| 19p loss | 26 (5%) | 547 |
0.575 (1.00) |
0.712 (1.00) |
0.838 (1.00) |
0.339 (1.00) |
0.72 (1.00) |
0.849 (1.00) |
1 (1.00) |
1 (1.00) |
| 19q loss | 35 (6%) | 538 |
0.576 (1.00) |
0.507 (1.00) |
0.722 (1.00) |
0.412 (1.00) |
0.98 (1.00) |
0.466 (1.00) |
0.711 (1.00) |
1 (1.00) |
| 20p loss | 19 (3%) | 554 |
0.977 (1.00) |
0.414 (1.00) |
0.24 (1.00) |
0.732 (1.00) |
0.637 (1.00) |
1 (1.00) |
0.197 (1.00) |
0.35 (1.00) |
| 20q loss | 17 (3%) | 556 |
0.755 (1.00) |
0.751 (1.00) |
0.314 (1.00) |
0.49 (1.00) |
0.697 (1.00) |
1 (1.00) |
0.375 (1.00) |
1 (1.00) |
| 21q loss | 42 (7%) | 531 |
0.559 (1.00) |
0.652 (1.00) |
0.416 (1.00) |
1 (1.00) |
0.101 (0.924) |
1 (1.00) |
1 (1.00) |
0.239 (1.00) |
| 22q loss | 181 (32%) | 392 |
0.887 (1.00) |
0.112 (0.991) |
1 (1.00) |
0.506 (1.00) |
0.256 (1.00) |
0.908 (1.00) |
0.657 (1.00) |
1 (1.00) |
| xp loss | 116 (20%) | 457 |
0.136 (0.996) |
0.642 (1.00) |
0.459 (1.00) |
0.349 (1.00) |
0.532 (1.00) |
0.957 (1.00) |
0.119 (0.992) |
0.718 (1.00) |
| xq loss | 106 (18%) | 467 |
0.162 (1.00) |
0.821 (1.00) |
0.509 (1.00) |
0.196 (1.00) |
0.365 (1.00) |
0.755 (1.00) |
0.137 (0.996) |
0.471 (1.00) |
P value = 3.71e-05 (logrank test), Q value = 0.0035
Table S1. Gene #13: '7p gain' versus Clinical Feature #1: 'Time to Death'
| nPatients | nDeath | Duration Range (Median), Month | |
|---|---|---|---|
| ALL | 570 | 473 | 0.1 - 127.6 (12.2) |
| 7P GAIN MUTATED | 462 | 392 | 0.1 - 127.6 (11.8) |
| 7P GAIN WILD-TYPE | 108 | 81 | 0.2 - 120.6 (15.3) |
Figure S1. Get High-res Image Gene #13: '7p gain' versus Clinical Feature #1: 'Time to Death'

P value = 1.91e-06 (Wilcoxon-test), Q value = 0.00042
Table S2. Gene #13: '7p gain' versus Clinical Feature #2: 'YEARS_TO_BIRTH'
| nPatients | Mean (Std.Dev) | |
|---|---|---|
| ALL | 573 | 57.8 (14.5) |
| 7P GAIN MUTATED | 465 | 59.7 (12.4) |
| 7P GAIN WILD-TYPE | 108 | 49.6 (19.4) |
Figure S2. Get High-res Image Gene #13: '7p gain' versus Clinical Feature #2: 'YEARS_TO_BIRTH'

P value = 3.7e-05 (logrank test), Q value = 0.0035
Table S3. Gene #14: '7q gain' versus Clinical Feature #1: 'Time to Death'
| nPatients | nDeath | Duration Range (Median), Month | |
|---|---|---|---|
| ALL | 570 | 473 | 0.1 - 127.6 (12.2) |
| 7Q GAIN MUTATED | 468 | 395 | 0.1 - 127.6 (11.8) |
| 7Q GAIN WILD-TYPE | 102 | 78 | 0.2 - 120.6 (16.2) |
Figure S3. Get High-res Image Gene #14: '7q gain' versus Clinical Feature #1: 'Time to Death'
P value = 3.81e-06 (Wilcoxon-test), Q value = 0.00063
Table S4. Gene #14: '7q gain' versus Clinical Feature #2: 'YEARS_TO_BIRTH'
| nPatients | Mean (Std.Dev) | |
|---|---|---|
| ALL | 573 | 57.8 (14.5) |
| 7Q GAIN MUTATED | 471 | 59.6 (12.2) |
| 7Q GAIN WILD-TYPE | 102 | 49.2 (20.1) |
Figure S4. Get High-res Image Gene #14: '7q gain' versus Clinical Feature #2: 'YEARS_TO_BIRTH'
P value = 0.00173 (logrank test), Q value = 0.094
Table S5. Gene #19: '10p gain' versus Clinical Feature #1: 'Time to Death'
| nPatients | nDeath | Duration Range (Median), Month | |
|---|---|---|---|
| ALL | 570 | 473 | 0.1 - 127.6 (12.2) |
| 10P GAIN MUTATED | 13 | 8 | 0.4 - 100.0 (28.7) |
| 10P GAIN WILD-TYPE | 557 | 465 | 0.1 - 127.6 (12.2) |
Figure S5. Get High-res Image Gene #19: '10p gain' versus Clinical Feature #1: 'Time to Death'
P value = 6.04e-05 (Wilcoxon-test), Q value = 0.005
Table S6. Gene #19: '10p gain' versus Clinical Feature #2: 'YEARS_TO_BIRTH'
| nPatients | Mean (Std.Dev) | |
|---|---|---|
| ALL | 573 | 57.8 (14.5) |
| 10P GAIN MUTATED | 13 | 37.5 (17.4) |
| 10P GAIN WILD-TYPE | 560 | 58.3 (14.1) |
Figure S6. Get High-res Image Gene #19: '10p gain' versus Clinical Feature #2: 'YEARS_TO_BIRTH'
P value = 0.00564 (Wilcoxon-test), Q value = 0.25
Table S7. Gene #31: '17q gain' versus Clinical Feature #2: 'YEARS_TO_BIRTH'
| nPatients | Mean (Std.Dev) | |
|---|---|---|
| ALL | 573 | 57.8 (14.5) |
| 17Q GAIN MUTATED | 61 | 62.2 (13.6) |
| 17Q GAIN WILD-TYPE | 512 | 57.3 (14.5) |
Figure S7. Get High-res Image Gene #31: '17q gain' versus Clinical Feature #2: 'YEARS_TO_BIRTH'

P value = 2.45e-05 (Wilcoxon-test), Q value = 0.0032
Table S8. Gene #36: '20p gain' versus Clinical Feature #2: 'YEARS_TO_BIRTH'
| nPatients | Mean (Std.Dev) | |
|---|---|---|
| ALL | 573 | 57.8 (14.5) |
| 20P GAIN MUTATED | 221 | 61.0 (13.0) |
| 20P GAIN WILD-TYPE | 352 | 55.8 (15.0) |
Figure S8. Get High-res Image Gene #36: '20p gain' versus Clinical Feature #2: 'YEARS_TO_BIRTH'

P value = 0.000126 (Wilcoxon-test), Q value = 0.0083
Table S9. Gene #37: '20q gain' versus Clinical Feature #2: 'YEARS_TO_BIRTH'
| nPatients | Mean (Std.Dev) | |
|---|---|---|
| ALL | 573 | 57.8 (14.5) |
| 20Q GAIN MUTATED | 219 | 60.8 (13.2) |
| 20Q GAIN WILD-TYPE | 354 | 55.9 (14.9) |
Figure S9. Get High-res Image Gene #37: '20q gain' versus Clinical Feature #2: 'YEARS_TO_BIRTH'
P value = 0.00191 (logrank test), Q value = 0.097
Table S10. Gene #52: '6p loss' versus Clinical Feature #1: 'Time to Death'
| nPatients | nDeath | Duration Range (Median), Month | |
|---|---|---|---|
| ALL | 570 | 473 | 0.1 - 127.6 (12.2) |
| 6P LOSS MUTATED | 87 | 78 | 0.2 - 92.7 (9.2) |
| 6P LOSS WILD-TYPE | 483 | 395 | 0.1 - 127.6 (12.6) |
Figure S10. Get High-res Image Gene #52: '6p loss' versus Clinical Feature #1: 'Time to Death'

P value = 0.00421 (Fisher's exact test), Q value = 0.2
Table S11. Gene #56: '8p loss' versus Clinical Feature #7: 'RACE'
| nPatients | ASIAN | BLACK OR AFRICAN AMERICAN | WHITE |
|---|---|---|---|
| ALL | 13 | 50 | 487 |
| 8P LOSS MUTATED | 5 | 2 | 46 |
| 8P LOSS WILD-TYPE | 8 | 48 | 441 |
Figure S11. Get High-res Image Gene #56: '8p loss' versus Clinical Feature #7: 'RACE'

P value = 0.000102 (logrank test), Q value = 0.0074
Table S12. Gene #60: '10p loss' versus Clinical Feature #1: 'Time to Death'
| nPatients | nDeath | Duration Range (Median), Month | |
|---|---|---|---|
| ALL | 570 | 473 | 0.1 - 127.6 (12.2) |
| 10P LOSS MUTATED | 474 | 401 | 0.1 - 127.6 (12.1) |
| 10P LOSS WILD-TYPE | 96 | 72 | 0.4 - 115.9 (14.6) |
Figure S12. Get High-res Image Gene #60: '10p loss' versus Clinical Feature #1: 'Time to Death'

P value = 3.55e-09 (Wilcoxon-test), Q value = 2.3e-06
Table S13. Gene #60: '10p loss' versus Clinical Feature #2: 'YEARS_TO_BIRTH'
| nPatients | Mean (Std.Dev) | |
|---|---|---|
| ALL | 573 | 57.8 (14.5) |
| 10P LOSS MUTATED | 476 | 59.8 (12.6) |
| 10P LOSS WILD-TYPE | 97 | 48.2 (18.9) |
Figure S13. Get High-res Image Gene #60: '10p loss' versus Clinical Feature #2: 'YEARS_TO_BIRTH'

P value = 0.000333 (logrank test), Q value = 0.02
Table S14. Gene #61: '10q loss' versus Clinical Feature #1: 'Time to Death'
| nPatients | nDeath | Duration Range (Median), Month | |
|---|---|---|---|
| ALL | 570 | 473 | 0.1 - 127.6 (12.2) |
| 10Q LOSS MUTATED | 486 | 408 | 0.1 - 127.6 (12.1) |
| 10Q LOSS WILD-TYPE | 84 | 65 | 0.4 - 115.9 (14.3) |
Figure S14. Get High-res Image Gene #61: '10q loss' versus Clinical Feature #1: 'Time to Death'

P value = 1.81e-07 (Wilcoxon-test), Q value = 5.9e-05
Table S15. Gene #61: '10q loss' versus Clinical Feature #2: 'YEARS_TO_BIRTH'
| nPatients | Mean (Std.Dev) | |
|---|---|---|
| ALL | 573 | 57.8 (14.5) |
| 10Q LOSS MUTATED | 488 | 59.4 (13.1) |
| 10Q LOSS WILD-TYPE | 85 | 48.6 (18.5) |
Figure S15. Get High-res Image Gene #61: '10q loss' versus Clinical Feature #2: 'YEARS_TO_BIRTH'

-
Copy number data file = broad_values_by_arm.txt from GISTIC pipeline
-
Processed Copy number data file = /xchip/cga/gdac-prod/tcga-gdac/jobResults/GDAC_Correlate_Genomic_Events_Preprocess/GBM-TP/22538152/transformed.cor.cli.txt
-
Clinical data file = /xchip/cga/gdac-prod/tcga-gdac/jobResults/Append_Data/GBM-TP/22506586/GBM-TP.merged_data.txt
-
Number of patients = 573
-
Number of significantly arm-level cnvs = 82
-
Number of selected clinical features = 8
-
Exclude regions that fewer than K tumors have mutations, K = 3
For survival clinical features, the Kaplan-Meier survival curves of tumors with and without gene mutations were plotted and the statistical significance P values were estimated by logrank test (Bland and Altman 2004) using the 'survdiff' function in R
For binary or multi-class clinical features (nominal or ordinal), two-tailed Fisher's exact tests (Fisher 1922) were used to estimate the P values using the 'fisher.test' function in R
For multiple hypothesis correction, Q value is the False Discovery Rate (FDR) analogue of the P value (Benjamini and Hochberg 1995), defined as the minimum FDR at which the test may be called significant. We used the 'Benjamini and Hochberg' method of 'p.adjust' function in R to convert P values into Q values.
In addition to the links below, the full results of the analysis summarized in this report can also be downloaded programmatically using firehose_get, or interactively from either the Broad GDAC website or TCGA Data Coordination Center Portal.