This pipeline computes the correlation between significant copy number variation (cnv focal) genes and selected clinical features.
Testing the association between copy number variation 68 focal events and 8 clinical features across 573 patients, 39 significant findings detected with Q value < 0.25.
-
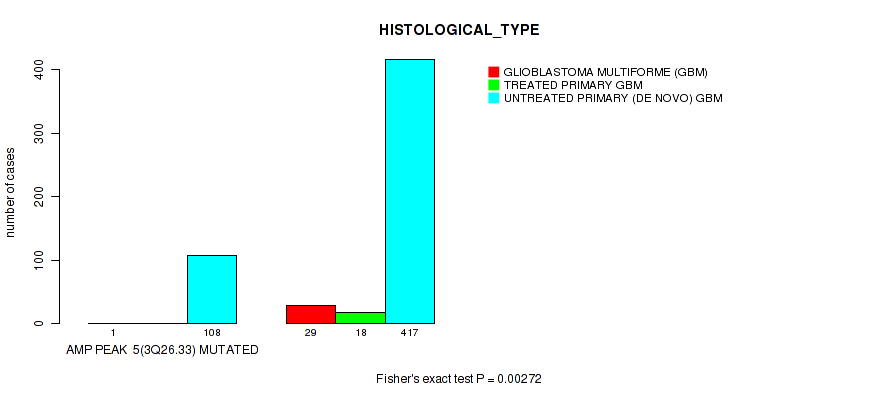
amp_3q26.33 cnv correlated to 'HISTOLOGICAL_TYPE'.
-
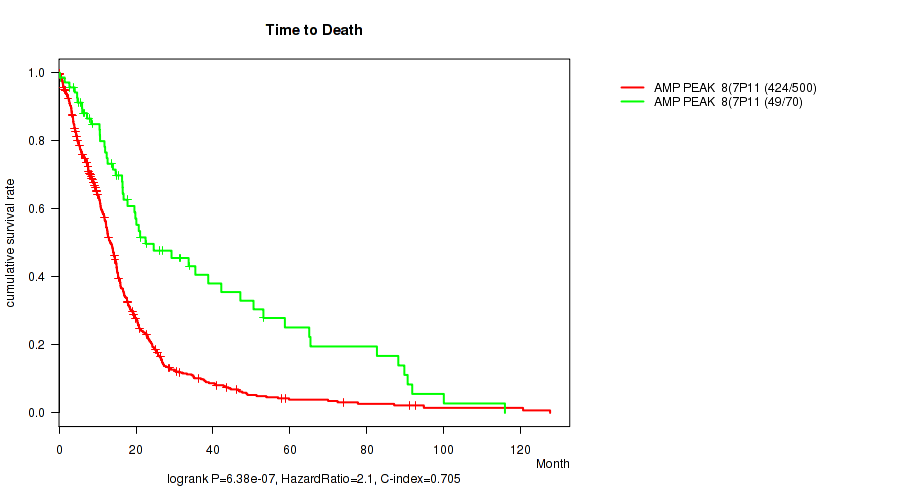
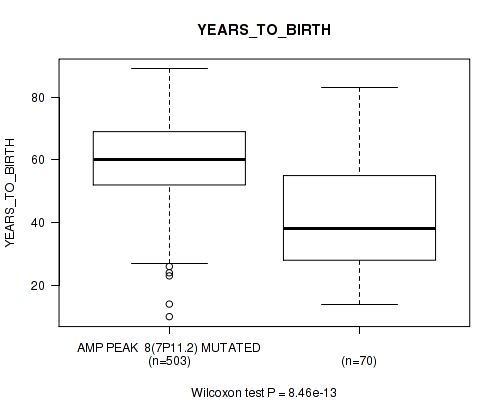
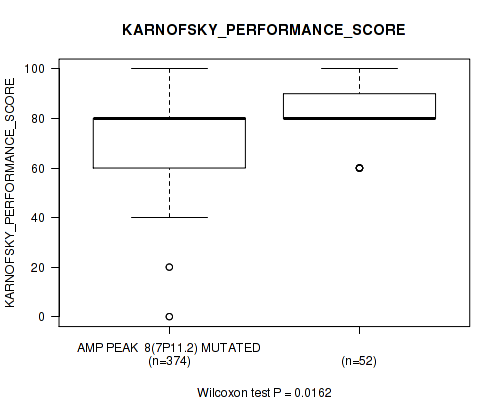
amp_7p11.2 cnv correlated to 'Time to Death', 'YEARS_TO_BIRTH', and 'KARNOFSKY_PERFORMANCE_SCORE'.
-
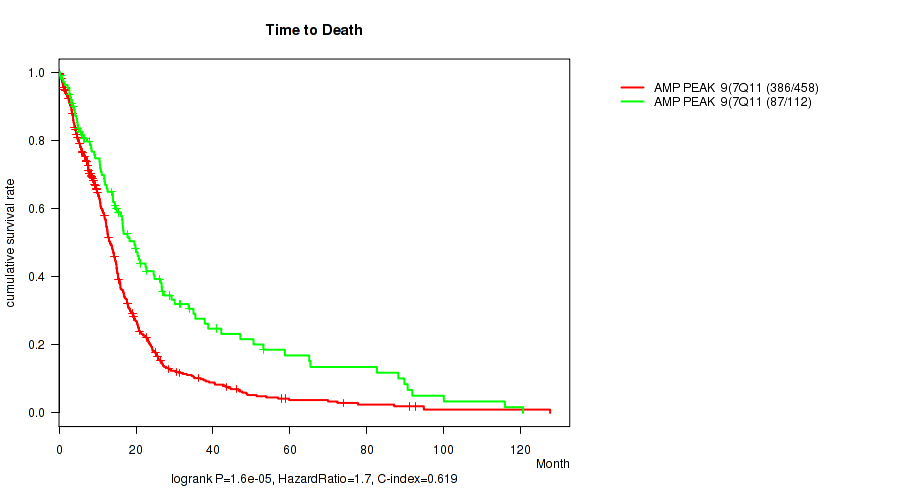
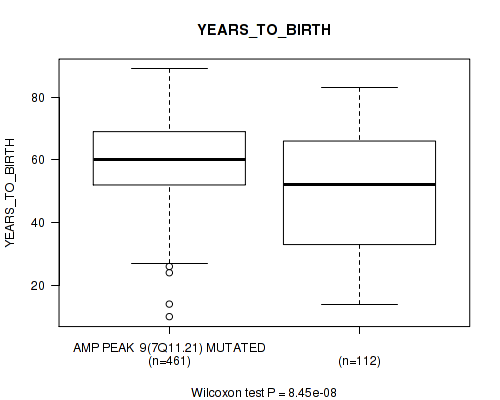
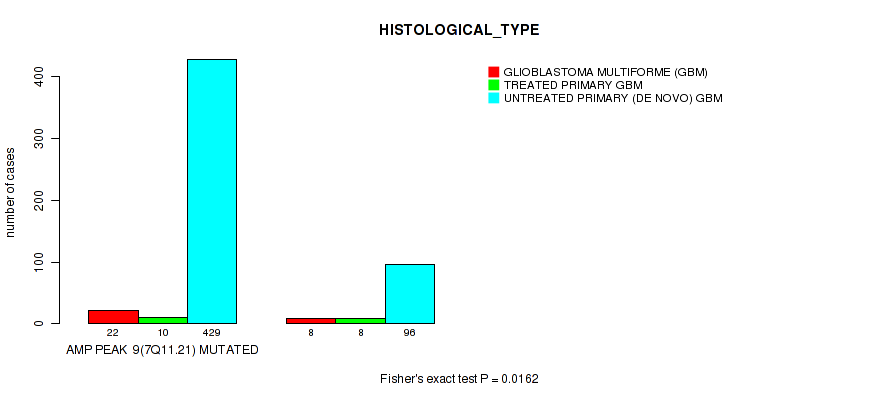
amp_7q11.21 cnv correlated to 'Time to Death', 'YEARS_TO_BIRTH', and 'HISTOLOGICAL_TYPE'.
-
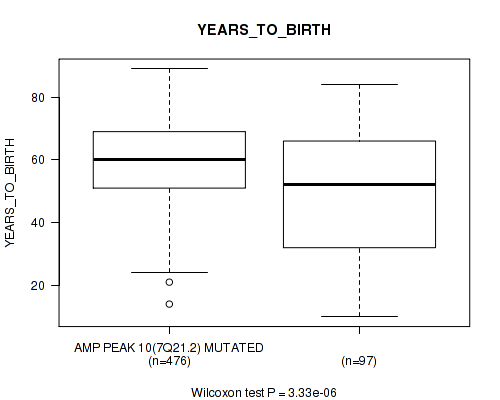
amp_7q21.2 cnv correlated to 'Time to Death' and 'YEARS_TO_BIRTH'.
-
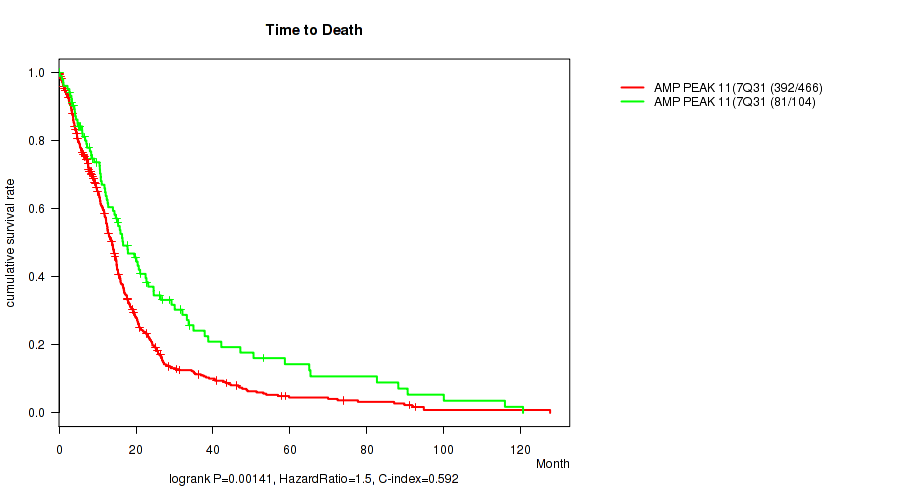
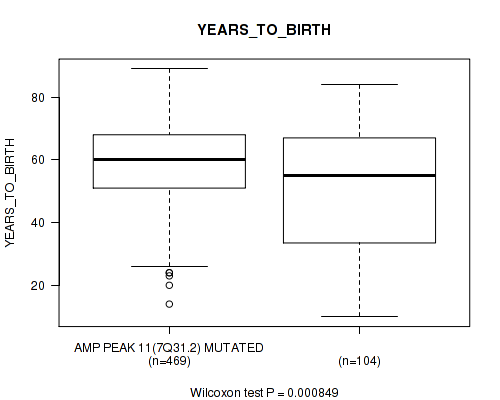
amp_7q31.2 cnv correlated to 'Time to Death' and 'YEARS_TO_BIRTH'.
-
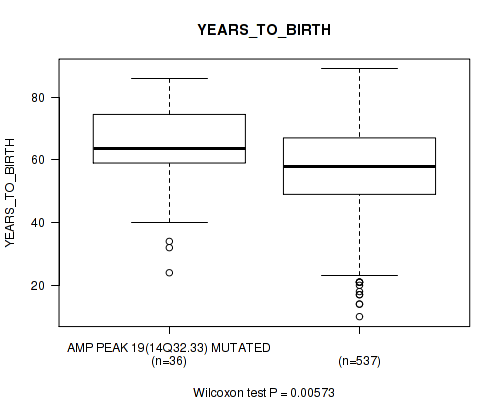
amp_14q32.33 cnv correlated to 'YEARS_TO_BIRTH'.
-
amp_17q25.1 cnv correlated to 'YEARS_TO_BIRTH'.
-
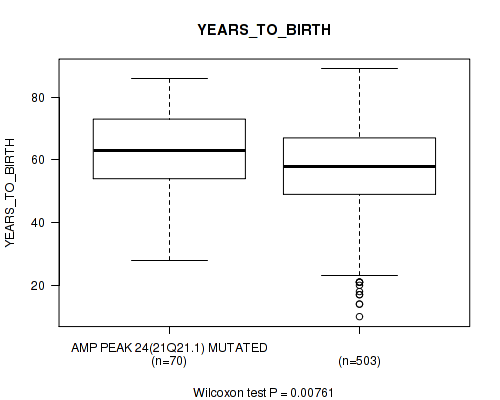
amp_21q21.1 cnv correlated to 'YEARS_TO_BIRTH'.
-
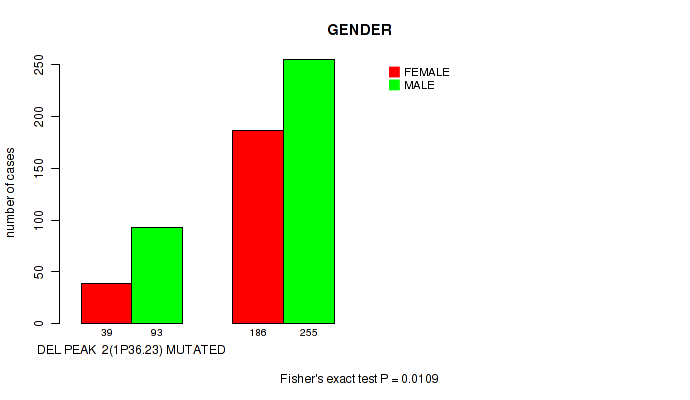
del_1p36.23 cnv correlated to 'GENDER'.
-
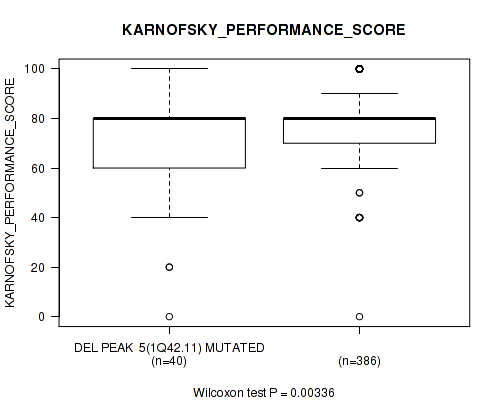
del_1q42.11 cnv correlated to 'KARNOFSKY_PERFORMANCE_SCORE'.
-
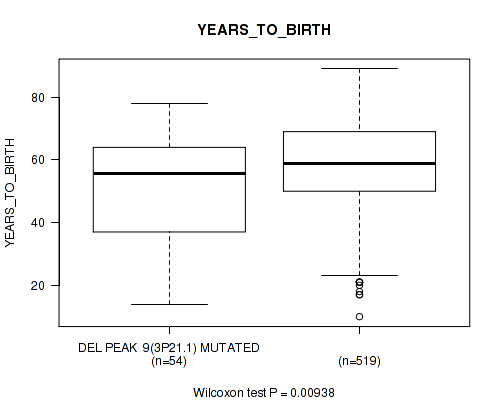
del_3p21.1 cnv correlated to 'YEARS_TO_BIRTH'.
-
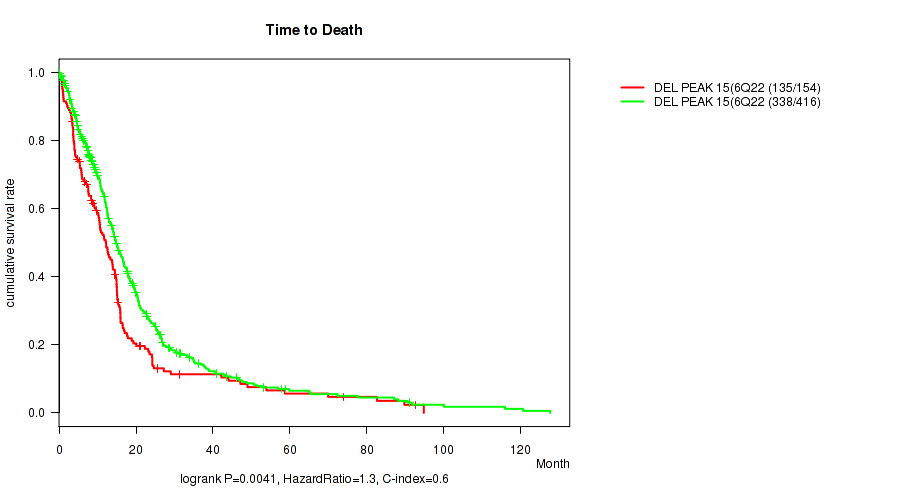
del_6q22.1 cnv correlated to 'Time to Death'.
-
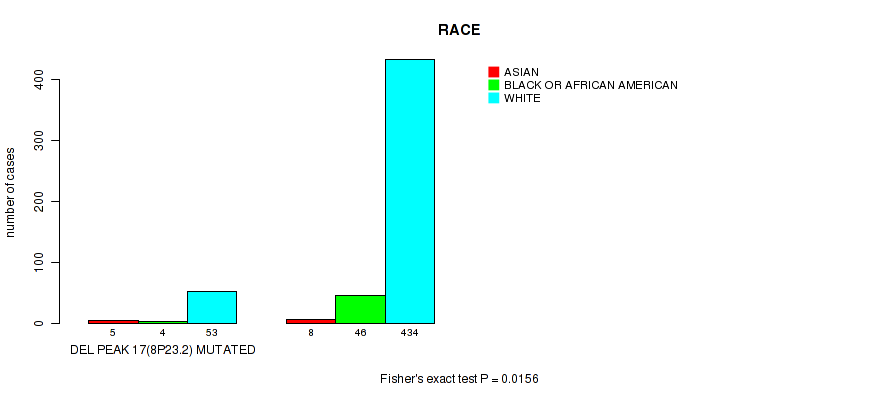
del_8p23.2 cnv correlated to 'RACE'.
-
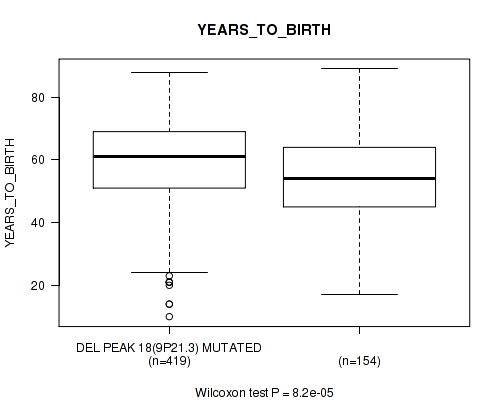
del_9p21.3 cnv correlated to 'YEARS_TO_BIRTH'.
-
del_10p15.3 cnv correlated to 'Time to Death' and 'YEARS_TO_BIRTH'.
-
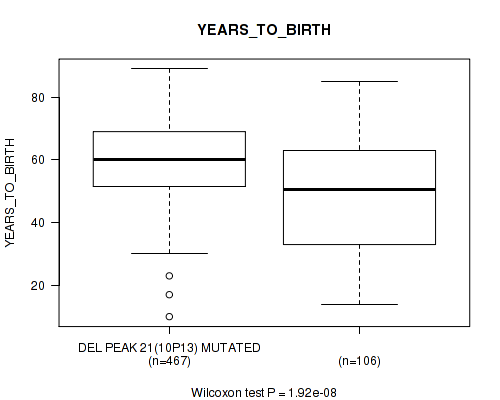
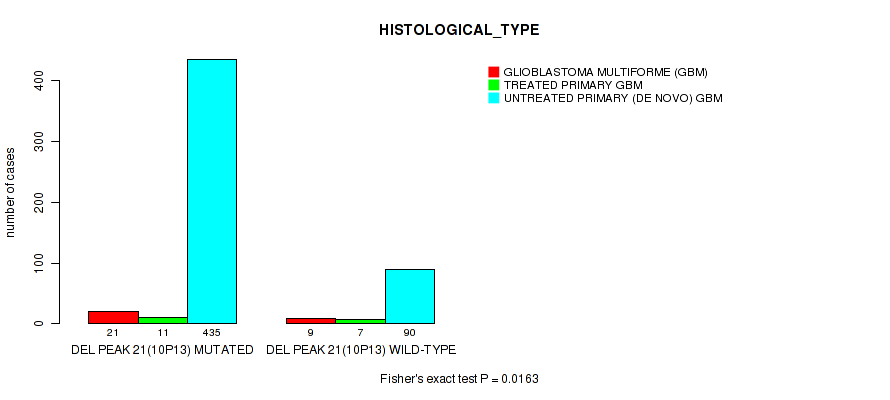
del_10p13 cnv correlated to 'Time to Death', 'YEARS_TO_BIRTH', and 'HISTOLOGICAL_TYPE'.
-
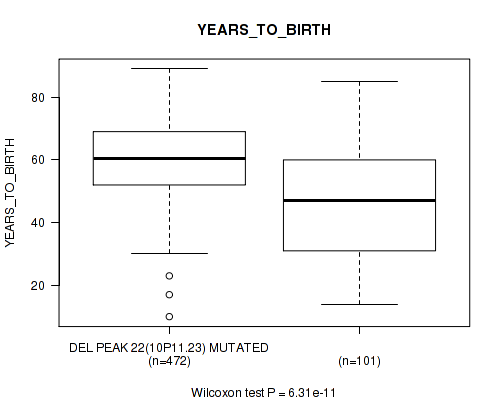
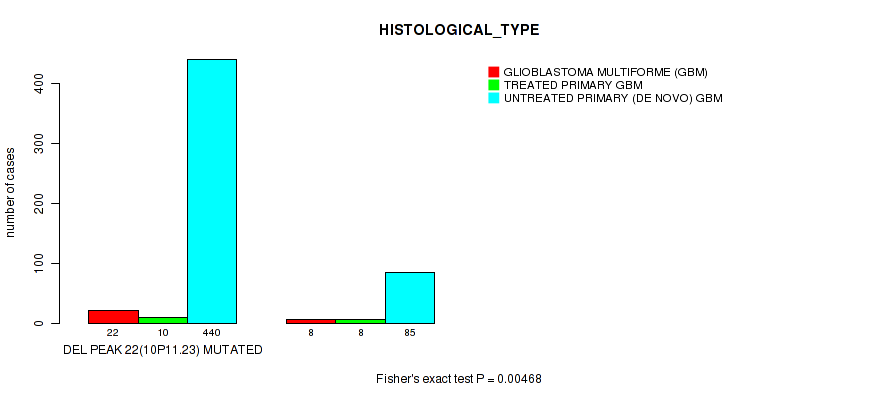
del_10p11.23 cnv correlated to 'Time to Death', 'YEARS_TO_BIRTH', and 'HISTOLOGICAL_TYPE'.
-
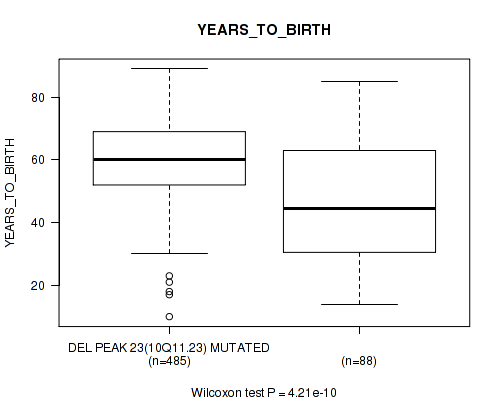
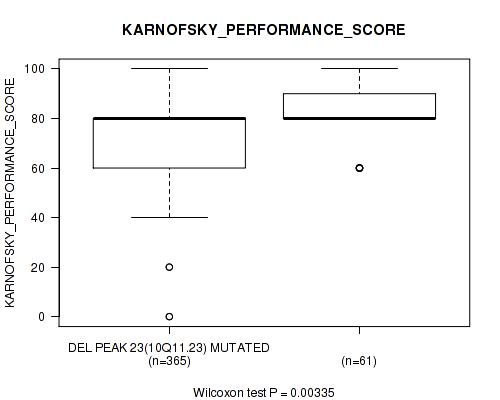
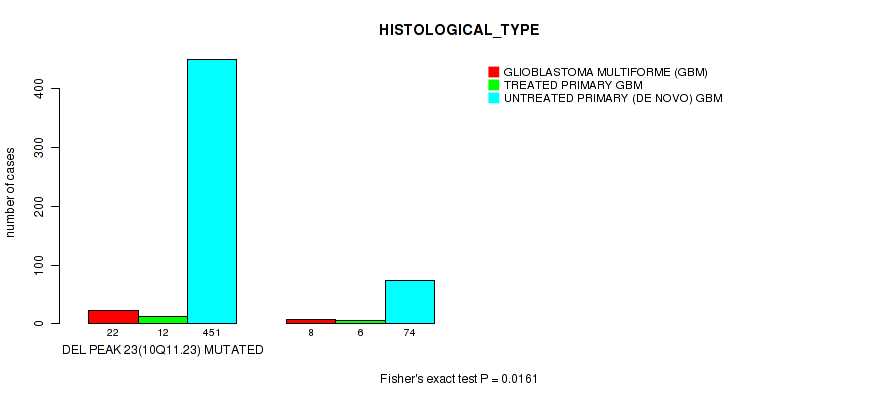
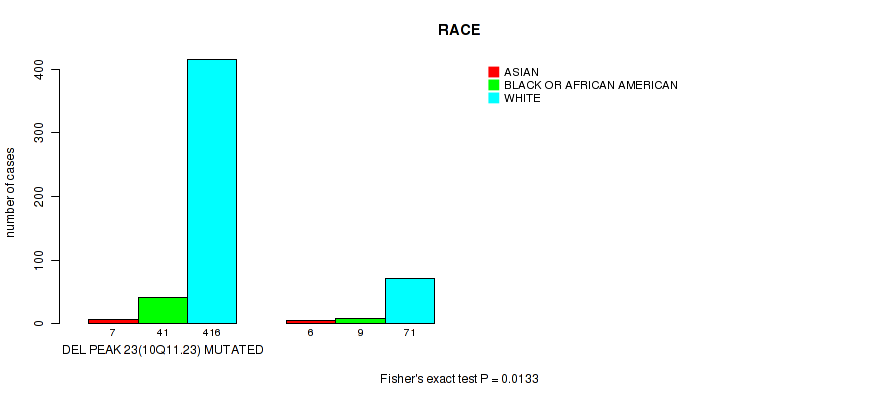
del_10q11.23 cnv correlated to 'Time to Death', 'YEARS_TO_BIRTH', 'KARNOFSKY_PERFORMANCE_SCORE', 'HISTOLOGICAL_TYPE', and 'RACE'.
-
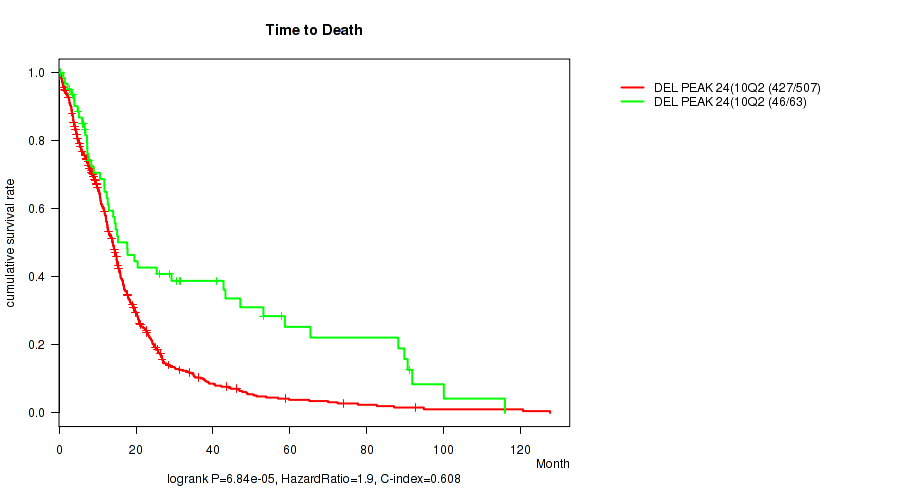
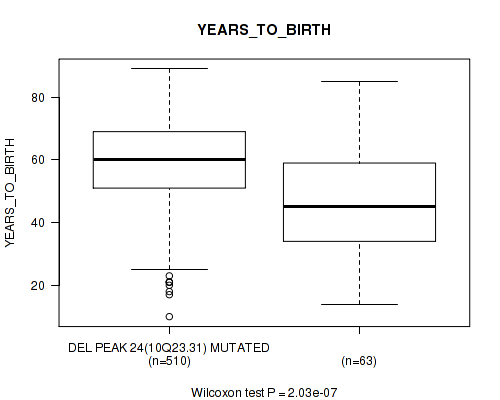
del_10q23.31 cnv correlated to 'Time to Death' and 'YEARS_TO_BIRTH'.
-
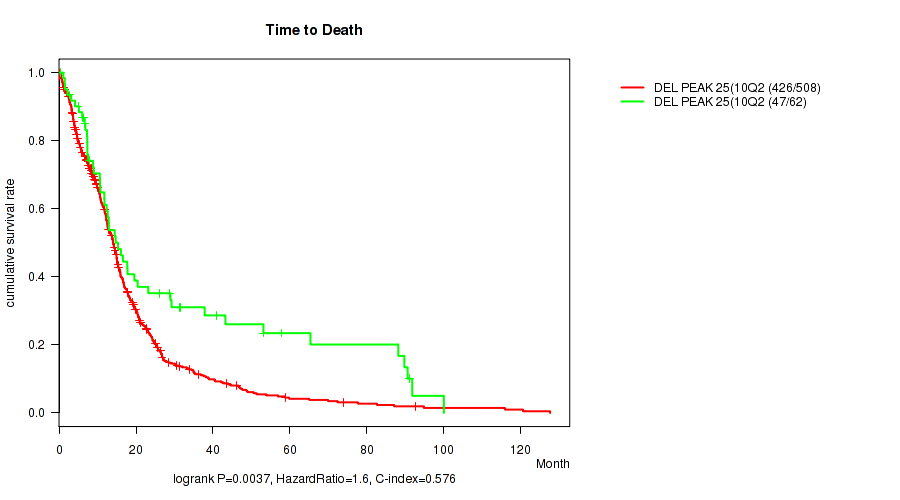
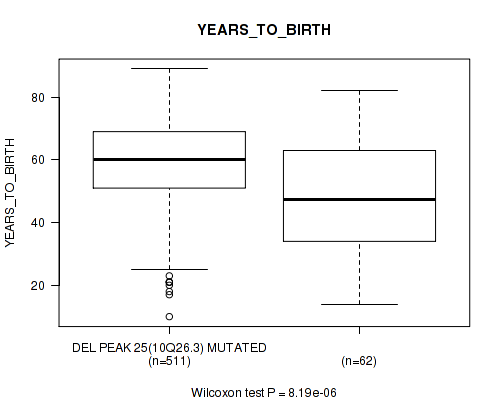
del_10q26.3 cnv correlated to 'Time to Death' and 'YEARS_TO_BIRTH'.
-
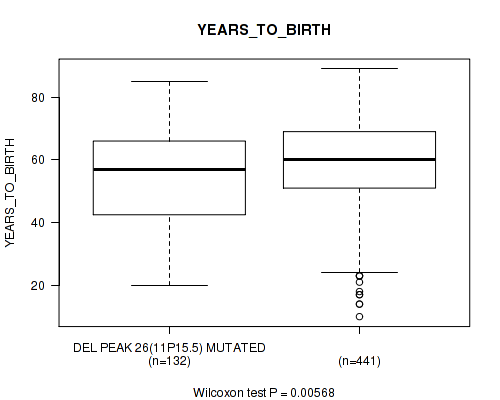
del_11p15.5 cnv correlated to 'YEARS_TO_BIRTH'.
-
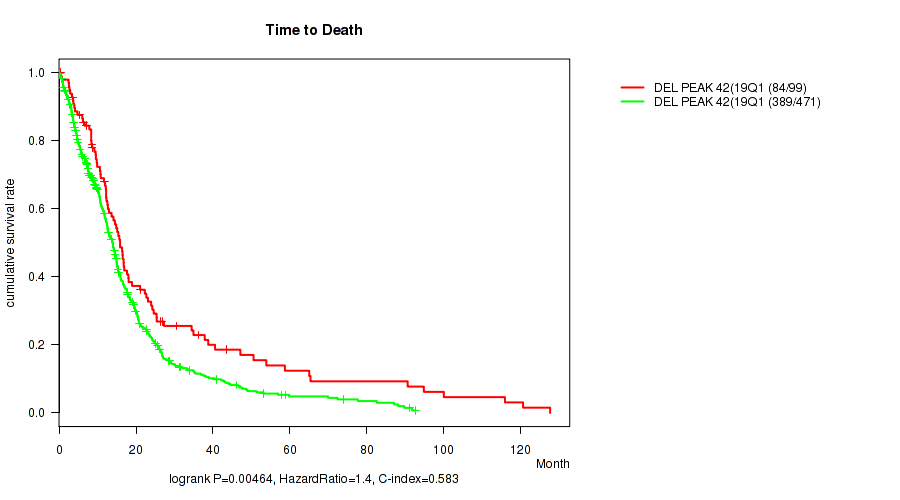
del_19q13.41 cnv correlated to 'Time to Death'.
Table 1. Get Full Table Overview of the association between significant copy number variation of 68 focal events and 8 clinical features. Shown in the table are P values (Q values). Thresholded by Q value < 0.25, 39 significant findings detected.
|
Clinical Features |
Time to Death |
YEARS TO BIRTH |
GENDER |
RADIATION THERAPY |
KARNOFSKY PERFORMANCE SCORE |
HISTOLOGICAL TYPE |
RACE | ETHNICITY | ||
| nCNV (%) | nWild-Type | logrank test | Wilcoxon-test | Fisher's exact test | Fisher's exact test | Wilcoxon-test | Fisher's exact test | Fisher's exact test | Fisher's exact test | |
| del 10q11 23 | 485 (85%) | 88 |
6.35e-07 (3.47e-05) |
4.21e-10 (7.64e-08) |
0.343 (0.836) |
0.3 (0.798) |
0.00335 (0.0794) |
0.0161 (0.227) |
0.0133 (0.213) |
0.422 (0.871) |
| amp 7p11 2 | 503 (88%) | 70 |
6.38e-07 (3.47e-05) |
8.46e-13 (4.6e-10) |
0.243 (0.76) |
0.179 (0.722) |
0.0162 (0.227) |
0.076 (0.574) |
0.436 (0.875) |
0.0594 (0.492) |
| amp 7q11 21 | 461 (80%) | 112 |
1.6e-05 (0.000622) |
8.45e-08 (7.66e-06) |
0.197 (0.736) |
0.276 (0.777) |
0.407 (0.871) |
0.0162 (0.227) |
0.256 (0.771) |
0.0802 (0.586) |
| del 10p13 | 467 (82%) | 106 |
6.1e-06 (0.000277) |
1.92e-08 (2.09e-06) |
0.0471 (0.45) |
1 (1.00) |
0.424 (0.871) |
0.0163 (0.227) |
0.125 (0.638) |
0.268 (0.777) |
| del 10p11 23 | 472 (82%) | 101 |
4.7e-07 (3.19e-05) |
6.31e-11 (1.72e-08) |
0.116 (0.638) |
0.87 (1.00) |
0.0379 (0.42) |
0.00468 (0.0943) |
0.171 (0.722) |
0.25 (0.76) |
| amp 7q21 2 | 476 (83%) | 97 |
7.44e-05 (0.00238) |
3.33e-06 (0.000165) |
0.425 (0.871) |
0.505 (0.916) |
0.324 (0.822) |
0.139 (0.672) |
0.0331 (0.4) |
0.0434 (0.443) |
| amp 7q31 2 | 469 (82%) | 104 |
0.00141 (0.0384) |
0.000849 (0.0243) |
0.268 (0.777) |
0.194 (0.735) |
0.854 (1.00) |
0.312 (0.798) |
0.0431 (0.443) |
0.0541 (0.476) |
| del 10p15 3 | 466 (81%) | 107 |
2.4e-05 (0.000871) |
9.02e-09 (1.23e-06) |
0.153 (0.701) |
0.633 (0.955) |
0.213 (0.76) |
0.0377 (0.42) |
0.187 (0.722) |
0.272 (0.777) |
| del 10q23 31 | 510 (89%) | 63 |
6.84e-05 (0.00232) |
2.03e-07 (1.58e-05) |
0.785 (0.993) |
0.842 (1.00) |
0.073 (0.56) |
0.0343 (0.406) |
0.332 (0.833) |
0.634 (0.955) |
| del 10q26 3 | 511 (89%) | 62 |
0.0037 (0.0838) |
8.19e-06 (0.000343) |
0.681 (0.955) |
0.313 (0.798) |
0.0512 (0.464) |
0.117 (0.638) |
0.083 (0.586) |
0.632 (0.955) |
| amp 3q26 33 | 109 (19%) | 464 |
0.125 (0.638) |
0.0268 (0.331) |
0.587 (0.955) |
0.0814 (0.586) |
0.472 (0.895) |
0.00272 (0.0705) |
0.16 (0.711) |
0.701 (0.955) |
| amp 14q32 33 | 36 (6%) | 537 |
0.378 (0.858) |
0.00573 (0.108) |
0.486 (0.905) |
1 (1.00) |
0.269 (0.777) |
0.474 (0.895) |
0.728 (0.975) |
1 (1.00) |
| amp 17q25 1 | 84 (15%) | 489 |
0.0207 (0.275) |
0.00652 (0.118) |
0.183 (0.722) |
0.155 (0.702) |
0.407 (0.871) |
0.672 (0.955) |
0.184 (0.722) |
0.694 (0.955) |
| amp 21q21 1 | 70 (12%) | 503 |
0.993 (1.00) |
0.00761 (0.134) |
0.897 (1.00) |
0.7 (0.955) |
0.981 (1.00) |
0.151 (0.697) |
0.0897 (0.6) |
0.378 (0.858) |
| del 1p36 23 | 132 (23%) | 441 |
0.961 (1.00) |
0.114 (0.638) |
0.0109 (0.18) |
0.883 (1.00) |
0.209 (0.76) |
0.669 (0.955) |
0.417 (0.871) |
0.312 (0.798) |
| del 1q42 11 | 50 (9%) | 523 |
0.0938 (0.6) |
0.233 (0.76) |
0.881 (1.00) |
0.375 (0.858) |
0.00336 (0.0794) |
0.638 (0.955) |
0.412 (0.871) |
0.258 (0.771) |
| del 3p21 1 | 54 (9%) | 519 |
0.0461 (0.448) |
0.00938 (0.16) |
0.884 (1.00) |
0.284 (0.785) |
0.414 (0.871) |
0.473 (0.895) |
0.542 (0.941) |
0.344 (0.836) |
| del 6q22 1 | 155 (27%) | 418 |
0.0041 (0.0892) |
0.141 (0.672) |
0.249 (0.76) |
0.121 (0.638) |
0.784 (0.993) |
0.487 (0.905) |
0.465 (0.895) |
0.195 (0.735) |
| del 8p23 2 | 66 (12%) | 507 |
0.349 (0.844) |
0.0447 (0.443) |
0.286 (0.786) |
0.696 (0.955) |
0.305 (0.798) |
0.871 (1.00) |
0.0156 (0.227) |
0.376 (0.858) |
| del 9p21 3 | 419 (73%) | 154 |
0.0363 (0.42) |
8.2e-05 (0.00248) |
0.563 (0.941) |
0.205 (0.752) |
0.0443 (0.443) |
0.677 (0.955) |
0.493 (0.906) |
0.745 (0.982) |
| del 11p15 5 | 132 (23%) | 441 |
0.0543 (0.476) |
0.00568 (0.108) |
0.224 (0.76) |
1 (1.00) |
0.0554 (0.478) |
0.554 (0.941) |
0.964 (1.00) |
1 (1.00) |
| del 19q13 41 | 100 (17%) | 473 |
0.00464 (0.0943) |
0.335 (0.833) |
0.91 (1.00) |
0.137 (0.672) |
0.613 (0.955) |
0.526 (0.931) |
0.608 (0.955) |
1 (1.00) |
| amp 1p36 21 | 92 (16%) | 481 |
0.0501 (0.462) |
0.24 (0.76) |
0.415 (0.871) |
0.0924 (0.6) |
0.0946 (0.6) |
0.0593 (0.492) |
0.0729 (0.56) |
0.402 (0.871) |
| amp 1q32 1 | 159 (28%) | 414 |
0.307 (0.798) |
0.168 (0.722) |
0.924 (1.00) |
0.127 (0.638) |
0.249 (0.76) |
1 (1.00) |
0.877 (1.00) |
0.526 (0.931) |
| amp 1q44 | 99 (17%) | 474 |
0.571 (0.942) |
0.888 (1.00) |
0.176 (0.722) |
0.186 (0.722) |
0.363 (0.848) |
0.301 (0.798) |
0.954 (1.00) |
0.426 (0.871) |
| amp 2p24 3 | 49 (9%) | 524 |
0.187 (0.722) |
0.265 (0.777) |
0.445 (0.881) |
1 (1.00) |
0.75 (0.982) |
1 (1.00) |
0.605 (0.955) |
0.612 (0.955) |
| amp 4p16 3 | 48 (8%) | 525 |
0.532 (0.932) |
0.827 (1.00) |
0.356 (0.846) |
0.821 (1.00) |
0.149 (0.691) |
0.752 (0.982) |
0.777 (0.991) |
1 (1.00) |
| amp 4q12 | 108 (19%) | 465 |
0.233 (0.76) |
0.156 (0.702) |
0.382 (0.858) |
0.0778 (0.58) |
0.881 (1.00) |
0.629 (0.955) |
0.552 (0.941) |
1 (1.00) |
| amp 8q24 21 | 69 (12%) | 504 |
0.0704 (0.555) |
0.335 (0.833) |
0.694 (0.955) |
0.553 (0.941) |
0.866 (1.00) |
0.767 (0.991) |
0.49 (0.906) |
1 (1.00) |
| amp 11p13 | 30 (5%) | 543 |
0.672 (0.955) |
0.273 (0.777) |
1 (1.00) |
0.406 (0.871) |
0.598 (0.955) |
0.749 (0.982) |
0.767 (0.991) |
0.513 (0.926) |
| amp 12p13 32 | 84 (15%) | 489 |
0.948 (1.00) |
0.161 (0.711) |
1 (1.00) |
0.217 (0.76) |
0.876 (1.00) |
0.846 (1.00) |
0.555 (0.941) |
0.686 (0.955) |
| amp 12q14 1 | 134 (23%) | 439 |
0.284 (0.785) |
0.662 (0.955) |
0.419 (0.871) |
0.303 (0.798) |
0.472 (0.895) |
0.622 (0.955) |
0.719 (0.967) |
0.31 (0.798) |
| amp 12q15 | 93 (16%) | 480 |
0.464 (0.895) |
0.644 (0.955) |
0.353 (0.846) |
1 (1.00) |
0.916 (1.00) |
0.855 (1.00) |
0.527 (0.931) |
0.23 (0.76) |
| amp 13q34 | 32 (6%) | 541 |
0.792 (0.995) |
0.674 (0.955) |
0.457 (0.89) |
0.593 (0.955) |
0.611 (0.955) |
0.497 (0.909) |
1 (1.00) |
1 (1.00) |
| amp 13q34 | 30 (5%) | 543 |
0.655 (0.955) |
0.403 (0.871) |
0.568 (0.941) |
1 (1.00) |
0.462 (0.894) |
0.75 (0.982) |
0.492 (0.906) |
1 (1.00) |
| amp 17p13 2 | 51 (9%) | 522 |
0.608 (0.955) |
0.514 (0.926) |
0.293 (0.797) |
0.184 (0.722) |
0.892 (1.00) |
0.641 (0.955) |
0.714 (0.964) |
1 (1.00) |
| amp 19p13 3 | 244 (43%) | 329 |
0.0954 (0.6) |
0.663 (0.955) |
0.931 (1.00) |
0.312 (0.798) |
0.24 (0.76) |
0.532 (0.932) |
0.426 (0.871) |
0.769 (0.991) |
| amp 19q12 | 215 (38%) | 358 |
0.671 (0.955) |
0.482 (0.905) |
0.66 (0.955) |
0.12 (0.638) |
0.747 (0.982) |
0.442 (0.878) |
0.72 (0.967) |
0.388 (0.868) |
| del 1p36 32 | 97 (17%) | 476 |
0.661 (0.955) |
0.561 (0.941) |
0.0226 (0.286) |
0.619 (0.955) |
0.752 (0.982) |
0.234 (0.76) |
0.0841 (0.586) |
0.7 (0.955) |
| del 1p32 3 | 61 (11%) | 512 |
0.422 (0.871) |
0.0429 (0.443) |
0.127 (0.638) |
0.42 (0.871) |
0.576 (0.945) |
0.862 (1.00) |
0.275 (0.777) |
1 (1.00) |
| del 1p22 1 | 48 (8%) | 525 |
0.628 (0.955) |
0.292 (0.797) |
0.878 (1.00) |
1 (1.00) |
0.69 (0.955) |
0.103 (0.611) |
1 (1.00) |
1 (1.00) |
| del 1q44 | 35 (6%) | 538 |
0.303 (0.798) |
0.243 (0.76) |
0.86 (1.00) |
0.428 (0.871) |
0.0947 (0.6) |
0.597 (0.955) |
1 (1.00) |
0.486 (0.905) |
| del 2q22 1 | 47 (8%) | 526 |
0.28 (0.781) |
0.0959 (0.6) |
0.439 (0.875) |
0.106 (0.615) |
0.66 (0.955) |
0.139 (0.672) |
0.227 (0.76) |
0.611 (0.955) |
| del 2q37 1 | 55 (10%) | 518 |
0.949 (1.00) |
0.756 (0.984) |
0.245 (0.76) |
0.202 (0.749) |
0.811 (1.00) |
1 (1.00) |
0.695 (0.955) |
1 (1.00) |
| del 3q13 31 | 56 (10%) | 517 |
0.956 (1.00) |
0.381 (0.858) |
0.567 (0.941) |
0.832 (1.00) |
0.218 (0.76) |
0.854 (1.00) |
0.487 (0.905) |
0.344 (0.836) |
| del 3q29 | 65 (11%) | 508 |
0.228 (0.76) |
0.548 (0.941) |
1 (1.00) |
1 (1.00) |
0.596 (0.955) |
1 (1.00) |
1 (1.00) |
1 (1.00) |
| del 4p16 3 | 78 (14%) | 495 |
0.109 (0.622) |
0.122 (0.638) |
0.264 (0.777) |
0.855 (1.00) |
0.37 (0.856) |
0.657 (0.955) |
0.535 (0.933) |
0.663 (0.955) |
| del 4q34 3 | 93 (16%) | 480 |
0.0615 (0.5) |
0.143 (0.678) |
0.0494 (0.462) |
0.177 (0.722) |
0.665 (0.955) |
0.771 (0.991) |
0.185 (0.722) |
1 (1.00) |
| del 5q34 | 69 (12%) | 504 |
0.0185 (0.252) |
0.277 (0.777) |
0.237 (0.76) |
0.568 (0.941) |
0.43 (0.871) |
0.342 (0.836) |
0.0416 (0.443) |
0.168 (0.722) |
| del 6q26 | 179 (31%) | 394 |
0.0597 (0.492) |
0.861 (1.00) |
0.231 (0.76) |
0.59 (0.955) |
0.802 (0.998) |
0.217 (0.76) |
0.97 (1.00) |
0.355 (0.846) |
| del 9q34 2 | 79 (14%) | 494 |
0.798 (0.996) |
0.994 (1.00) |
0.901 (1.00) |
0.584 (0.954) |
0.778 (0.991) |
0.0841 (0.586) |
0.25 (0.76) |
0.23 (0.76) |
| del 11p11 2 | 105 (18%) | 468 |
0.181 (0.722) |
0.643 (0.955) |
0.224 (0.76) |
1 (1.00) |
0.297 (0.798) |
0.272 (0.777) |
0.775 (0.991) |
1 (1.00) |
| del 11q14 1 | 96 (17%) | 477 |
0.831 (1.00) |
0.563 (0.941) |
0.36 (0.848) |
0.619 (0.955) |
0.734 (0.979) |
0.249 (0.76) |
0.909 (1.00) |
0.7 (0.955) |
| del 12p13 1 | 72 (13%) | 501 |
0.145 (0.682) |
0.903 (1.00) |
0.367 (0.853) |
0.569 (0.941) |
0.639 (0.955) |
0.519 (0.931) |
0.102 (0.611) |
1 (1.00) |
| del 12q12 | 77 (13%) | 496 |
0.654 (0.955) |
0.577 (0.945) |
0.707 (0.957) |
0.196 (0.736) |
0.668 (0.955) |
1 (1.00) |
0.431 (0.871) |
0.66 (0.955) |
| del 12q15 | 79 (14%) | 494 |
0.782 (0.993) |
0.569 (0.941) |
0.46 (0.893) |
0.14 (0.672) |
0.566 (0.941) |
0.701 (0.955) |
0.34 (0.836) |
0.214 (0.76) |
| del 13q14 2 | 240 (42%) | 333 |
0.707 (0.957) |
0.763 (0.991) |
0.603 (0.955) |
0.0995 (0.608) |
0.847 (1.00) |
0.5 (0.911) |
0.435 (0.875) |
1 (1.00) |
| del 13q22 1 | 228 (40%) | 345 |
0.622 (0.955) |
0.974 (1.00) |
0.931 (1.00) |
0.127 (0.638) |
0.296 (0.798) |
0.455 (0.89) |
0.806 (1.00) |
0.378 (0.858) |
| del 14q13 1 | 176 (31%) | 397 |
0.567 (0.941) |
0.599 (0.955) |
0.115 (0.638) |
0.501 (0.911) |
0.732 (0.978) |
0.438 (0.875) |
0.261 (0.775) |
0.119 (0.638) |
| del 14q24 2 | 171 (30%) | 402 |
0.827 (1.00) |
0.474 (0.895) |
0.224 (0.76) |
0.103 (0.611) |
0.792 (0.995) |
0.179 (0.722) |
0.689 (0.955) |
1 (1.00) |
| del 15q14 | 154 (27%) | 419 |
0.236 (0.76) |
0.0223 (0.286) |
0.7 (0.955) |
0.257 (0.771) |
0.857 (1.00) |
0.628 (0.955) |
0.447 (0.881) |
0.332 (0.833) |
| del 16p12 2 | 92 (16%) | 481 |
0.0986 (0.608) |
0.221 (0.76) |
0.354 (0.846) |
0.17 (0.722) |
0.186 (0.722) |
0.402 (0.871) |
0.907 (1.00) |
1 (1.00) |
| del 16q23 1 | 100 (17%) | 473 |
0.106 (0.615) |
0.818 (1.00) |
0.91 (1.00) |
0.0939 (0.6) |
0.525 (0.931) |
0.745 (0.982) |
0.67 (0.955) |
0.703 (0.956) |
| del 17p13 1 | 98 (17%) | 475 |
0.629 (0.955) |
0.065 (0.52) |
0.0899 (0.6) |
0.868 (1.00) |
0.744 (0.982) |
0.864 (1.00) |
0.91 (1.00) |
1 (1.00) |
| del 17q11 2 | 72 (13%) | 501 |
0.397 (0.871) |
0.39 (0.87) |
0.797 (0.996) |
0.453 (0.889) |
0.423 (0.871) |
0.681 (0.955) |
0.79 (0.995) |
1 (1.00) |
| del 18q22 3 | 82 (14%) | 491 |
0.861 (1.00) |
0.533 (0.932) |
0.808 (1.00) |
0.213 (0.76) |
0.129 (0.644) |
0.892 (1.00) |
0.361 (0.848) |
0.399 (0.871) |
| del 21q21 1 | 56 (10%) | 517 |
0.523 (0.931) |
0.393 (0.871) |
0.775 (0.991) |
1 (1.00) |
0.331 (0.833) |
1 (1.00) |
0.927 (1.00) |
0.363 (0.848) |
| del 22q13 32 | 212 (37%) | 361 |
0.555 (0.941) |
0.179 (0.722) |
0.929 (1.00) |
0.796 (0.996) |
0.618 (0.955) |
0.861 (1.00) |
0.193 (0.735) |
1 (1.00) |
P value = 0.00272 (Fisher's exact test), Q value = 0.07
Table S1. Gene #5: 'amp_3q26.33' versus Clinical Feature #6: 'HISTOLOGICAL_TYPE'
| nPatients | GLIOBLASTOMA MULTIFORME (GBM) | TREATED PRIMARY GBM | UNTREATED PRIMARY (DE NOVO) GBM |
|---|---|---|---|
| ALL | 30 | 18 | 525 |
| AMP PEAK 5(3Q26.33) MUTATED | 1 | 0 | 108 |
| AMP PEAK 5(3Q26.33) WILD-TYPE | 29 | 18 | 417 |
Figure S1. Get High-res Image Gene #5: 'amp_3q26.33' versus Clinical Feature #6: 'HISTOLOGICAL_TYPE'
P value = 6.38e-07 (logrank test), Q value = 3.5e-05
Table S2. Gene #8: 'amp_7p11.2' versus Clinical Feature #1: 'Time to Death'
| nPatients | nDeath | Duration Range (Median), Month | |
|---|---|---|---|
| ALL | 570 | 473 | 0.1 - 127.6 (12.2) |
| AMP PEAK 8(7P11.2) MUTATED | 500 | 424 | 0.1 - 127.6 (11.8) |
| AMP PEAK 8(7P11.2) WILD-TYPE | 70 | 49 | 0.2 - 115.9 (17.2) |
Figure S2. Get High-res Image Gene #8: 'amp_7p11.2' versus Clinical Feature #1: 'Time to Death'
P value = 8.46e-13 (Wilcoxon-test), Q value = 4.6e-10
Table S3. Gene #8: 'amp_7p11.2' versus Clinical Feature #2: 'YEARS_TO_BIRTH'
| nPatients | Mean (Std.Dev) | |
|---|---|---|
| ALL | 573 | 57.8 (14.5) |
| AMP PEAK 8(7P11.2) MUTATED | 503 | 59.8 (12.5) |
| AMP PEAK 8(7P11.2) WILD-TYPE | 70 | 43.1 (18.8) |
Figure S3. Get High-res Image Gene #8: 'amp_7p11.2' versus Clinical Feature #2: 'YEARS_TO_BIRTH'
P value = 0.0162 (Wilcoxon-test), Q value = 0.23
Table S4. Gene #8: 'amp_7p11.2' versus Clinical Feature #5: 'KARNOFSKY_PERFORMANCE_SCORE'
| nPatients | Mean (Std.Dev) | |
|---|---|---|
| ALL | 426 | 77.1 (15.8) |
| AMP PEAK 8(7P11.2) MUTATED | 374 | 76.4 (16.2) |
| AMP PEAK 8(7P11.2) WILD-TYPE | 52 | 81.9 (11.7) |
Figure S4. Get High-res Image Gene #8: 'amp_7p11.2' versus Clinical Feature #5: 'KARNOFSKY_PERFORMANCE_SCORE'
P value = 1.6e-05 (logrank test), Q value = 0.00062
Table S5. Gene #9: 'amp_7q11.21' versus Clinical Feature #1: 'Time to Death'
| nPatients | nDeath | Duration Range (Median), Month | |
|---|---|---|---|
| ALL | 570 | 473 | 0.1 - 127.6 (12.2) |
| AMP PEAK 9(7Q11.21) MUTATED | 458 | 386 | 0.1 - 127.6 (11.8) |
| AMP PEAK 9(7Q11.21) WILD-TYPE | 112 | 87 | 0.2 - 120.6 (15.7) |
Figure S5. Get High-res Image Gene #9: 'amp_7q11.21' versus Clinical Feature #1: 'Time to Death'
P value = 8.45e-08 (Wilcoxon-test), Q value = 7.7e-06
Table S6. Gene #9: 'amp_7q11.21' versus Clinical Feature #2: 'YEARS_TO_BIRTH'
| nPatients | Mean (Std.Dev) | |
|---|---|---|
| ALL | 573 | 57.8 (14.5) |
| AMP PEAK 9(7Q11.21) MUTATED | 461 | 59.9 (12.4) |
| AMP PEAK 9(7Q11.21) WILD-TYPE | 112 | 49.1 (18.7) |
Figure S6. Get High-res Image Gene #9: 'amp_7q11.21' versus Clinical Feature #2: 'YEARS_TO_BIRTH'
P value = 0.0162 (Fisher's exact test), Q value = 0.23
Table S7. Gene #9: 'amp_7q11.21' versus Clinical Feature #6: 'HISTOLOGICAL_TYPE'
| nPatients | GLIOBLASTOMA MULTIFORME (GBM) | TREATED PRIMARY GBM | UNTREATED PRIMARY (DE NOVO) GBM |
|---|---|---|---|
| ALL | 30 | 18 | 525 |
| AMP PEAK 9(7Q11.21) MUTATED | 22 | 10 | 429 |
| AMP PEAK 9(7Q11.21) WILD-TYPE | 8 | 8 | 96 |
Figure S7. Get High-res Image Gene #9: 'amp_7q11.21' versus Clinical Feature #6: 'HISTOLOGICAL_TYPE'
P value = 7.44e-05 (logrank test), Q value = 0.0024
Table S8. Gene #10: 'amp_7q21.2' versus Clinical Feature #1: 'Time to Death'
| nPatients | nDeath | Duration Range (Median), Month | |
|---|---|---|---|
| ALL | 570 | 473 | 0.1 - 127.6 (12.2) |
| AMP PEAK 10(7Q21.2) MUTATED | 473 | 401 | 0.1 - 127.6 (11.9) |
| AMP PEAK 10(7Q21.2) WILD-TYPE | 97 | 72 | 0.1 - 120.6 (15.1) |
Figure S8. Get High-res Image Gene #10: 'amp_7q21.2' versus Clinical Feature #1: 'Time to Death'

P value = 3.33e-06 (Wilcoxon-test), Q value = 0.00016
Table S9. Gene #10: 'amp_7q21.2' versus Clinical Feature #2: 'YEARS_TO_BIRTH'
| nPatients | Mean (Std.Dev) | |
|---|---|---|
| ALL | 573 | 57.8 (14.5) |
| AMP PEAK 10(7Q21.2) MUTATED | 476 | 59.5 (12.5) |
| AMP PEAK 10(7Q21.2) WILD-TYPE | 97 | 49.2 (19.9) |
Figure S9. Get High-res Image Gene #10: 'amp_7q21.2' versus Clinical Feature #2: 'YEARS_TO_BIRTH'
P value = 0.00141 (logrank test), Q value = 0.038
Table S10. Gene #11: 'amp_7q31.2' versus Clinical Feature #1: 'Time to Death'
| nPatients | nDeath | Duration Range (Median), Month | |
|---|---|---|---|
| ALL | 570 | 473 | 0.1 - 127.6 (12.2) |
| AMP PEAK 11(7Q31.2) MUTATED | 466 | 392 | 0.1 - 127.6 (12.0) |
| AMP PEAK 11(7Q31.2) WILD-TYPE | 104 | 81 | 0.1 - 120.6 (14.8) |
Figure S10. Get High-res Image Gene #11: 'amp_7q31.2' versus Clinical Feature #1: 'Time to Death'
P value = 0.000849 (Wilcoxon-test), Q value = 0.024
Table S11. Gene #11: 'amp_7q31.2' versus Clinical Feature #2: 'YEARS_TO_BIRTH'
| nPatients | Mean (Std.Dev) | |
|---|---|---|
| ALL | 573 | 57.8 (14.5) |
| AMP PEAK 11(7Q31.2) MUTATED | 469 | 59.2 (12.7) |
| AMP PEAK 11(7Q31.2) WILD-TYPE | 104 | 51.4 (19.7) |
Figure S11. Get High-res Image Gene #11: 'amp_7q31.2' versus Clinical Feature #2: 'YEARS_TO_BIRTH'
P value = 0.00573 (Wilcoxon-test), Q value = 0.11
Table S12. Gene #19: 'amp_14q32.33' versus Clinical Feature #2: 'YEARS_TO_BIRTH'
| nPatients | Mean (Std.Dev) | |
|---|---|---|
| ALL | 573 | 57.8 (14.5) |
| AMP PEAK 19(14Q32.33) MUTATED | 36 | 63.4 (14.4) |
| AMP PEAK 19(14Q32.33) WILD-TYPE | 537 | 57.4 (14.4) |
Figure S12. Get High-res Image Gene #19: 'amp_14q32.33' versus Clinical Feature #2: 'YEARS_TO_BIRTH'
P value = 0.00652 (Wilcoxon-test), Q value = 0.12
Table S13. Gene #21: 'amp_17q25.1' versus Clinical Feature #2: 'YEARS_TO_BIRTH'
| nPatients | Mean (Std.Dev) | |
|---|---|---|
| ALL | 573 | 57.8 (14.5) |
| AMP PEAK 21(17Q25.1) MUTATED | 84 | 61.3 (13.6) |
| AMP PEAK 21(17Q25.1) WILD-TYPE | 489 | 57.2 (14.6) |
Figure S13. Get High-res Image Gene #21: 'amp_17q25.1' versus Clinical Feature #2: 'YEARS_TO_BIRTH'

P value = 0.00761 (Wilcoxon-test), Q value = 0.13
Table S14. Gene #24: 'amp_21q21.1' versus Clinical Feature #2: 'YEARS_TO_BIRTH'
| nPatients | Mean (Std.Dev) | |
|---|---|---|
| ALL | 573 | 57.8 (14.5) |
| AMP PEAK 24(21Q21.1) MUTATED | 70 | 62.1 (13.3) |
| AMP PEAK 24(21Q21.1) WILD-TYPE | 503 | 57.2 (14.6) |
Figure S14. Get High-res Image Gene #24: 'amp_21q21.1' versus Clinical Feature #2: 'YEARS_TO_BIRTH'
P value = 0.0109 (Fisher's exact test), Q value = 0.18
Table S15. Gene #26: 'del_1p36.23' versus Clinical Feature #3: 'GENDER'
| nPatients | FEMALE | MALE |
|---|---|---|
| ALL | 225 | 348 |
| DEL PEAK 2(1P36.23) MUTATED | 39 | 93 |
| DEL PEAK 2(1P36.23) WILD-TYPE | 186 | 255 |
Figure S15. Get High-res Image Gene #26: 'del_1p36.23' versus Clinical Feature #3: 'GENDER'
P value = 0.00336 (Wilcoxon-test), Q value = 0.079
Table S16. Gene #29: 'del_1q42.11' versus Clinical Feature #5: 'KARNOFSKY_PERFORMANCE_SCORE'
| nPatients | Mean (Std.Dev) | |
|---|---|---|
| ALL | 426 | 77.1 (15.8) |
| DEL PEAK 5(1Q42.11) MUTATED | 40 | 68.0 (21.4) |
| DEL PEAK 5(1Q42.11) WILD-TYPE | 386 | 78.0 (14.8) |
Figure S16. Get High-res Image Gene #29: 'del_1q42.11' versus Clinical Feature #5: 'KARNOFSKY_PERFORMANCE_SCORE'
P value = 0.00938 (Wilcoxon-test), Q value = 0.16
Table S17. Gene #33: 'del_3p21.1' versus Clinical Feature #2: 'YEARS_TO_BIRTH'
| nPatients | Mean (Std.Dev) | |
|---|---|---|
| ALL | 573 | 57.8 (14.5) |
| DEL PEAK 9(3P21.1) MUTATED | 54 | 51.7 (16.6) |
| DEL PEAK 9(3P21.1) WILD-TYPE | 519 | 58.4 (14.1) |
Figure S17. Get High-res Image Gene #33: 'del_3p21.1' versus Clinical Feature #2: 'YEARS_TO_BIRTH'
P value = 0.0041 (logrank test), Q value = 0.089
Table S18. Gene #39: 'del_6q22.1' versus Clinical Feature #1: 'Time to Death'
| nPatients | nDeath | Duration Range (Median), Month | |
|---|---|---|---|
| ALL | 570 | 473 | 0.1 - 127.6 (12.2) |
| DEL PEAK 15(6Q22.1) MUTATED | 154 | 135 | 0.2 - 94.8 (10.5) |
| DEL PEAK 15(6Q22.1) WILD-TYPE | 416 | 338 | 0.1 - 127.6 (12.6) |
Figure S18. Get High-res Image Gene #39: 'del_6q22.1' versus Clinical Feature #1: 'Time to Death'
P value = 0.0156 (Fisher's exact test), Q value = 0.23
Table S19. Gene #41: 'del_8p23.2' versus Clinical Feature #7: 'RACE'
| nPatients | ASIAN | BLACK OR AFRICAN AMERICAN | WHITE |
|---|---|---|---|
| ALL | 13 | 50 | 487 |
| DEL PEAK 17(8P23.2) MUTATED | 5 | 4 | 53 |
| DEL PEAK 17(8P23.2) WILD-TYPE | 8 | 46 | 434 |
Figure S19. Get High-res Image Gene #41: 'del_8p23.2' versus Clinical Feature #7: 'RACE'
P value = 8.2e-05 (Wilcoxon-test), Q value = 0.0025
Table S20. Gene #42: 'del_9p21.3' versus Clinical Feature #2: 'YEARS_TO_BIRTH'
| nPatients | Mean (Std.Dev) | |
|---|---|---|
| ALL | 573 | 57.8 (14.5) |
| DEL PEAK 18(9P21.3) MUTATED | 419 | 59.2 (13.8) |
| DEL PEAK 18(9P21.3) WILD-TYPE | 154 | 54.0 (15.7) |
Figure S20. Get High-res Image Gene #42: 'del_9p21.3' versus Clinical Feature #2: 'YEARS_TO_BIRTH'
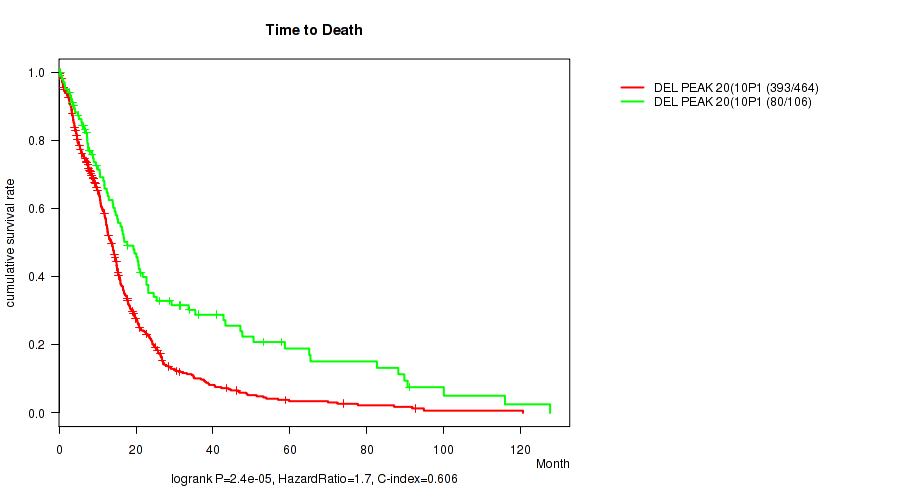
P value = 2.4e-05 (logrank test), Q value = 0.00087
Table S21. Gene #44: 'del_10p15.3' versus Clinical Feature #1: 'Time to Death'
| nPatients | nDeath | Duration Range (Median), Month | |
|---|---|---|---|
| ALL | 570 | 473 | 0.1 - 127.6 (12.2) |
| DEL PEAK 20(10P15.3) MUTATED | 464 | 393 | 0.1 - 120.6 (12.1) |
| DEL PEAK 20(10P15.3) WILD-TYPE | 106 | 80 | 0.1 - 127.6 (14.6) |
Figure S21. Get High-res Image Gene #44: 'del_10p15.3' versus Clinical Feature #1: 'Time to Death'
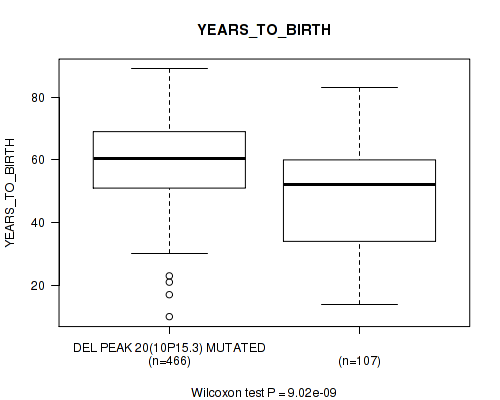
P value = 9.02e-09 (Wilcoxon-test), Q value = 1.2e-06
Table S22. Gene #44: 'del_10p15.3' versus Clinical Feature #2: 'YEARS_TO_BIRTH'
| nPatients | Mean (Std.Dev) | |
|---|---|---|
| ALL | 573 | 57.8 (14.5) |
| DEL PEAK 20(10P15.3) MUTATED | 466 | 59.8 (12.6) |
| DEL PEAK 20(10P15.3) WILD-TYPE | 107 | 48.8 (18.5) |
Figure S22. Get High-res Image Gene #44: 'del_10p15.3' versus Clinical Feature #2: 'YEARS_TO_BIRTH'
P value = 6.1e-06 (logrank test), Q value = 0.00028
Table S23. Gene #45: 'del_10p13' versus Clinical Feature #1: 'Time to Death'
| nPatients | nDeath | Duration Range (Median), Month | |
|---|---|---|---|
| ALL | 570 | 473 | 0.1 - 127.6 (12.2) |
| DEL PEAK 21(10P13) MUTATED | 465 | 395 | 0.1 - 120.6 (12.2) |
| DEL PEAK 21(10P13) WILD-TYPE | 105 | 78 | 0.1 - 127.6 (14.5) |
Figure S23. Get High-res Image Gene #45: 'del_10p13' versus Clinical Feature #1: 'Time to Death'

P value = 1.92e-08 (Wilcoxon-test), Q value = 2.1e-06
Table S24. Gene #45: 'del_10p13' versus Clinical Feature #2: 'YEARS_TO_BIRTH'
| nPatients | Mean (Std.Dev) | |
|---|---|---|
| ALL | 573 | 57.8 (14.5) |
| DEL PEAK 21(10P13) MUTATED | 467 | 59.8 (12.4) |
| DEL PEAK 21(10P13) WILD-TYPE | 106 | 48.8 (19.1) |
Figure S24. Get High-res Image Gene #45: 'del_10p13' versus Clinical Feature #2: 'YEARS_TO_BIRTH'
P value = 0.0163 (Fisher's exact test), Q value = 0.23
Table S25. Gene #45: 'del_10p13' versus Clinical Feature #6: 'HISTOLOGICAL_TYPE'
| nPatients | GLIOBLASTOMA MULTIFORME (GBM) | TREATED PRIMARY GBM | UNTREATED PRIMARY (DE NOVO) GBM |
|---|---|---|---|
| ALL | 30 | 18 | 525 |
| DEL PEAK 21(10P13) MUTATED | 21 | 11 | 435 |
| DEL PEAK 21(10P13) WILD-TYPE | 9 | 7 | 90 |
Figure S25. Get High-res Image Gene #45: 'del_10p13' versus Clinical Feature #6: 'HISTOLOGICAL_TYPE'
P value = 4.7e-07 (logrank test), Q value = 3.2e-05
Table S26. Gene #46: 'del_10p11.23' versus Clinical Feature #1: 'Time to Death'
| nPatients | nDeath | Duration Range (Median), Month | |
|---|---|---|---|
| ALL | 570 | 473 | 0.1 - 127.6 (12.2) |
| DEL PEAK 22(10P11.23) MUTATED | 470 | 399 | 0.1 - 120.6 (12.0) |
| DEL PEAK 22(10P11.23) WILD-TYPE | 100 | 74 | 0.1 - 127.6 (16.2) |
Figure S26. Get High-res Image Gene #46: 'del_10p11.23' versus Clinical Feature #1: 'Time to Death'

P value = 6.31e-11 (Wilcoxon-test), Q value = 1.7e-08
Table S27. Gene #46: 'del_10p11.23' versus Clinical Feature #2: 'YEARS_TO_BIRTH'
| nPatients | Mean (Std.Dev) | |
|---|---|---|
| ALL | 573 | 57.8 (14.5) |
| DEL PEAK 22(10P11.23) MUTATED | 472 | 60.0 (12.3) |
| DEL PEAK 22(10P11.23) WILD-TYPE | 101 | 47.3 (18.8) |
Figure S27. Get High-res Image Gene #46: 'del_10p11.23' versus Clinical Feature #2: 'YEARS_TO_BIRTH'
P value = 0.00468 (Fisher's exact test), Q value = 0.094
Table S28. Gene #46: 'del_10p11.23' versus Clinical Feature #6: 'HISTOLOGICAL_TYPE'
| nPatients | GLIOBLASTOMA MULTIFORME (GBM) | TREATED PRIMARY GBM | UNTREATED PRIMARY (DE NOVO) GBM |
|---|---|---|---|
| ALL | 30 | 18 | 525 |
| DEL PEAK 22(10P11.23) MUTATED | 22 | 10 | 440 |
| DEL PEAK 22(10P11.23) WILD-TYPE | 8 | 8 | 85 |
Figure S28. Get High-res Image Gene #46: 'del_10p11.23' versus Clinical Feature #6: 'HISTOLOGICAL_TYPE'
P value = 6.35e-07 (logrank test), Q value = 3.5e-05
Table S29. Gene #47: 'del_10q11.23' versus Clinical Feature #1: 'Time to Death'
| nPatients | nDeath | Duration Range (Median), Month | |
|---|---|---|---|
| ALL | 570 | 473 | 0.1 - 127.6 (12.2) |
| DEL PEAK 23(10Q11.23) MUTATED | 483 | 409 | 0.1 - 120.6 (12.1) |
| DEL PEAK 23(10Q11.23) WILD-TYPE | 87 | 64 | 0.4 - 127.6 (14.7) |
Figure S29. Get High-res Image Gene #47: 'del_10q11.23' versus Clinical Feature #1: 'Time to Death'

P value = 4.21e-10 (Wilcoxon-test), Q value = 7.6e-08
Table S30. Gene #47: 'del_10q11.23' versus Clinical Feature #2: 'YEARS_TO_BIRTH'
| nPatients | Mean (Std.Dev) | |
|---|---|---|
| ALL | 573 | 57.8 (14.5) |
| DEL PEAK 23(10Q11.23) MUTATED | 485 | 59.8 (12.6) |
| DEL PEAK 23(10Q11.23) WILD-TYPE | 88 | 46.6 (18.8) |
Figure S30. Get High-res Image Gene #47: 'del_10q11.23' versus Clinical Feature #2: 'YEARS_TO_BIRTH'
P value = 0.00335 (Wilcoxon-test), Q value = 0.079
Table S31. Gene #47: 'del_10q11.23' versus Clinical Feature #5: 'KARNOFSKY_PERFORMANCE_SCORE'
| nPatients | Mean (Std.Dev) | |
|---|---|---|
| ALL | 426 | 77.1 (15.8) |
| DEL PEAK 23(10Q11.23) MUTATED | 365 | 76.2 (16.3) |
| DEL PEAK 23(10Q11.23) WILD-TYPE | 61 | 82.3 (11.2) |
Figure S31. Get High-res Image Gene #47: 'del_10q11.23' versus Clinical Feature #5: 'KARNOFSKY_PERFORMANCE_SCORE'
P value = 0.0161 (Fisher's exact test), Q value = 0.23
Table S32. Gene #47: 'del_10q11.23' versus Clinical Feature #6: 'HISTOLOGICAL_TYPE'
| nPatients | GLIOBLASTOMA MULTIFORME (GBM) | TREATED PRIMARY GBM | UNTREATED PRIMARY (DE NOVO) GBM |
|---|---|---|---|
| ALL | 30 | 18 | 525 |
| DEL PEAK 23(10Q11.23) MUTATED | 22 | 12 | 451 |
| DEL PEAK 23(10Q11.23) WILD-TYPE | 8 | 6 | 74 |
Figure S32. Get High-res Image Gene #47: 'del_10q11.23' versus Clinical Feature #6: 'HISTOLOGICAL_TYPE'
P value = 0.0133 (Fisher's exact test), Q value = 0.21
Table S33. Gene #47: 'del_10q11.23' versus Clinical Feature #7: 'RACE'
| nPatients | ASIAN | BLACK OR AFRICAN AMERICAN | WHITE |
|---|---|---|---|
| ALL | 13 | 50 | 487 |
| DEL PEAK 23(10Q11.23) MUTATED | 7 | 41 | 416 |
| DEL PEAK 23(10Q11.23) WILD-TYPE | 6 | 9 | 71 |
Figure S33. Get High-res Image Gene #47: 'del_10q11.23' versus Clinical Feature #7: 'RACE'
P value = 6.84e-05 (logrank test), Q value = 0.0023
Table S34. Gene #48: 'del_10q23.31' versus Clinical Feature #1: 'Time to Death'
| nPatients | nDeath | Duration Range (Median), Month | |
|---|---|---|---|
| ALL | 570 | 473 | 0.1 - 127.6 (12.2) |
| DEL PEAK 24(10Q23.31) MUTATED | 507 | 427 | 0.1 - 127.6 (12.2) |
| DEL PEAK 24(10Q23.31) WILD-TYPE | 63 | 46 | 0.4 - 115.9 (14.1) |
Figure S34. Get High-res Image Gene #48: 'del_10q23.31' versus Clinical Feature #1: 'Time to Death'
P value = 2.03e-07 (Wilcoxon-test), Q value = 1.6e-05
Table S35. Gene #48: 'del_10q23.31' versus Clinical Feature #2: 'YEARS_TO_BIRTH'
| nPatients | Mean (Std.Dev) | |
|---|---|---|
| ALL | 573 | 57.8 (14.5) |
| DEL PEAK 24(10Q23.31) MUTATED | 510 | 59.1 (13.4) |
| DEL PEAK 24(10Q23.31) WILD-TYPE | 63 | 47.2 (18.6) |
Figure S35. Get High-res Image Gene #48: 'del_10q23.31' versus Clinical Feature #2: 'YEARS_TO_BIRTH'
P value = 0.0037 (logrank test), Q value = 0.084
Table S36. Gene #49: 'del_10q26.3' versus Clinical Feature #1: 'Time to Death'
| nPatients | nDeath | Duration Range (Median), Month | |
|---|---|---|---|
| ALL | 570 | 473 | 0.1 - 127.6 (12.2) |
| DEL PEAK 25(10Q26.3) MUTATED | 508 | 426 | 0.1 - 127.6 (12.2) |
| DEL PEAK 25(10Q26.3) WILD-TYPE | 62 | 47 | 0.4 - 100.0 (12.8) |
Figure S36. Get High-res Image Gene #49: 'del_10q26.3' versus Clinical Feature #1: 'Time to Death'
P value = 8.19e-06 (Wilcoxon-test), Q value = 0.00034
Table S37. Gene #49: 'del_10q26.3' versus Clinical Feature #2: 'YEARS_TO_BIRTH'
| nPatients | Mean (Std.Dev) | |
|---|---|---|
| ALL | 573 | 57.8 (14.5) |
| DEL PEAK 25(10Q26.3) MUTATED | 511 | 58.9 (13.5) |
| DEL PEAK 25(10Q26.3) WILD-TYPE | 62 | 48.3 (18.7) |
Figure S37. Get High-res Image Gene #49: 'del_10q26.3' versus Clinical Feature #2: 'YEARS_TO_BIRTH'
P value = 0.00568 (Wilcoxon-test), Q value = 0.11
Table S38. Gene #50: 'del_11p15.5' versus Clinical Feature #2: 'YEARS_TO_BIRTH'
| nPatients | Mean (Std.Dev) | |
|---|---|---|
| ALL | 573 | 57.8 (14.5) |
| DEL PEAK 26(11P15.5) MUTATED | 132 | 54.0 (16.4) |
| DEL PEAK 26(11P15.5) WILD-TYPE | 441 | 58.9 (13.7) |
Figure S38. Get High-res Image Gene #50: 'del_11p15.5' versus Clinical Feature #2: 'YEARS_TO_BIRTH'
P value = 0.00464 (logrank test), Q value = 0.094
Table S39. Gene #66: 'del_19q13.41' versus Clinical Feature #1: 'Time to Death'
| nPatients | nDeath | Duration Range (Median), Month | |
|---|---|---|---|
| ALL | 570 | 473 | 0.1 - 127.6 (12.2) |
| DEL PEAK 42(19Q13.41) MUTATED | 99 | 84 | 0.2 - 127.6 (14.5) |
| DEL PEAK 42(19Q13.41) WILD-TYPE | 471 | 389 | 0.1 - 92.7 (11.8) |
Figure S39. Get High-res Image Gene #66: 'del_19q13.41' versus Clinical Feature #1: 'Time to Death'
-
Copy number data file = all_lesions.txt from GISTIC pipeline
-
Processed Copy number data file = /xchip/cga/gdac-prod/tcga-gdac/jobResults/GDAC_Correlate_Genomic_Events_Preprocess/GBM-TP/22538153/transformed.cor.cli.txt
-
Clinical data file = /xchip/cga/gdac-prod/tcga-gdac/jobResults/Append_Data/GBM-TP/22506586/GBM-TP.merged_data.txt
-
Number of patients = 573
-
Number of significantly focal cnvs = 68
-
Number of selected clinical features = 8
-
Exclude genes that fewer than K tumors have mutations, K = 3
For survival clinical features, the Kaplan-Meier survival curves of tumors with and without gene mutations were plotted and the statistical significance P values were estimated by logrank test (Bland and Altman 2004) using the 'survdiff' function in R
For binary or multi-class clinical features (nominal or ordinal), two-tailed Fisher's exact tests (Fisher 1922) were used to estimate the P values using the 'fisher.test' function in R
For multiple hypothesis correction, Q value is the False Discovery Rate (FDR) analogue of the P value (Benjamini and Hochberg 1995), defined as the minimum FDR at which the test may be called significant. We used the 'Benjamini and Hochberg' method of 'p.adjust' function in R to convert P values into Q values.
In addition to the links below, the full results of the analysis summarized in this report can also be downloaded programmatically using firehose_get, or interactively from either the Broad GDAC website or TCGA Data Coordination Center Portal.