This pipeline computes the correlation between cancer subtypes identified by different molecular patterns and selected clinical features.
Testing the association between subtypes identified by 10 different clustering approaches and 8 clinical features across 595 patients, 15 significant findings detected with P value < 0.05 and Q value < 0.25.
-
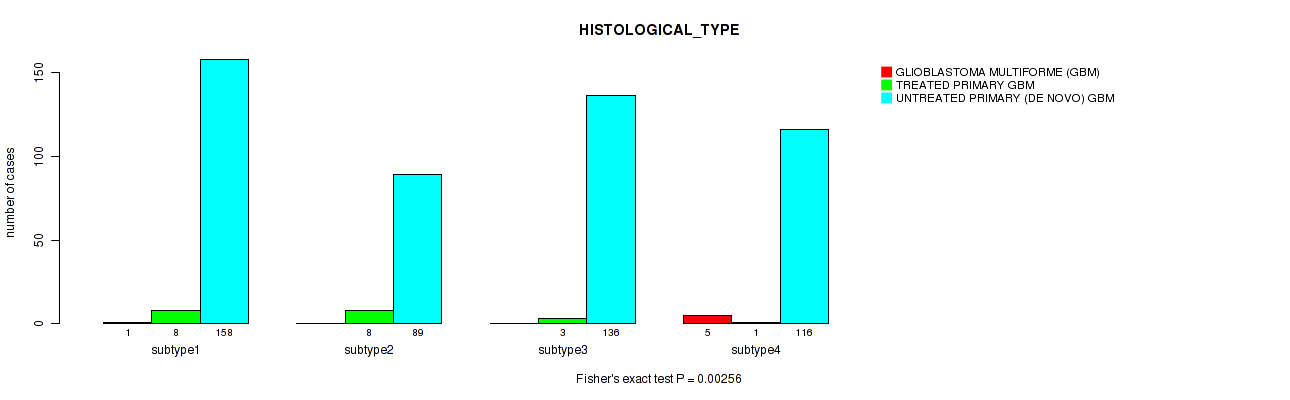
CNMF clustering analysis on array-based mRNA expression data identified 4 subtypes that correlate to 'HISTOLOGICAL_TYPE'.
-
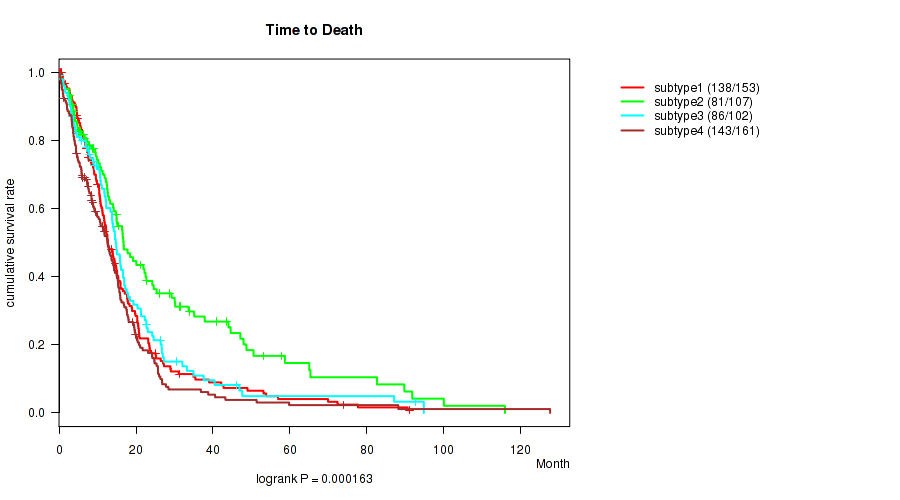
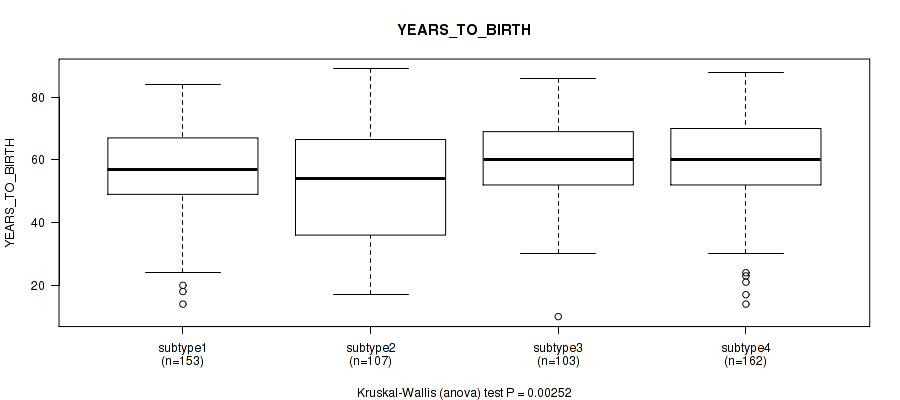
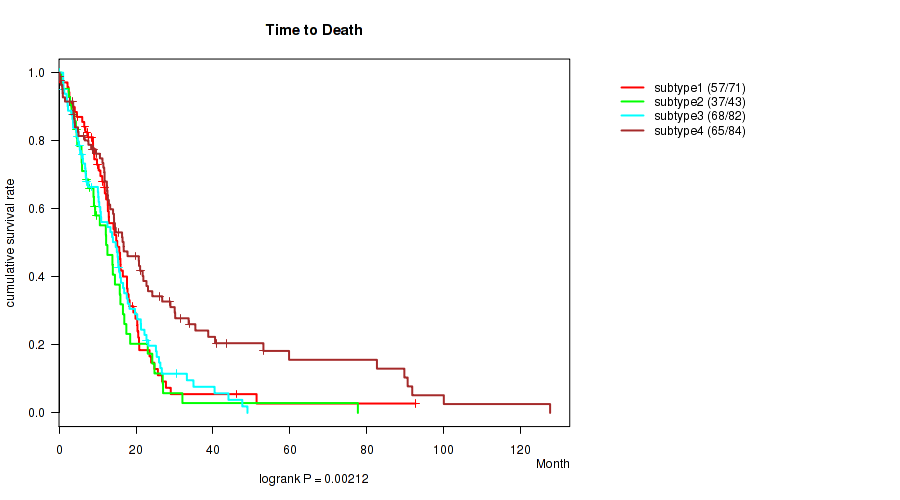
Consensus hierarchical clustering analysis on array-based mRNA expression data identified 4 subtypes that correlate to 'Time to Death', 'YEARS_TO_BIRTH', and 'HISTOLOGICAL_TYPE'.
-
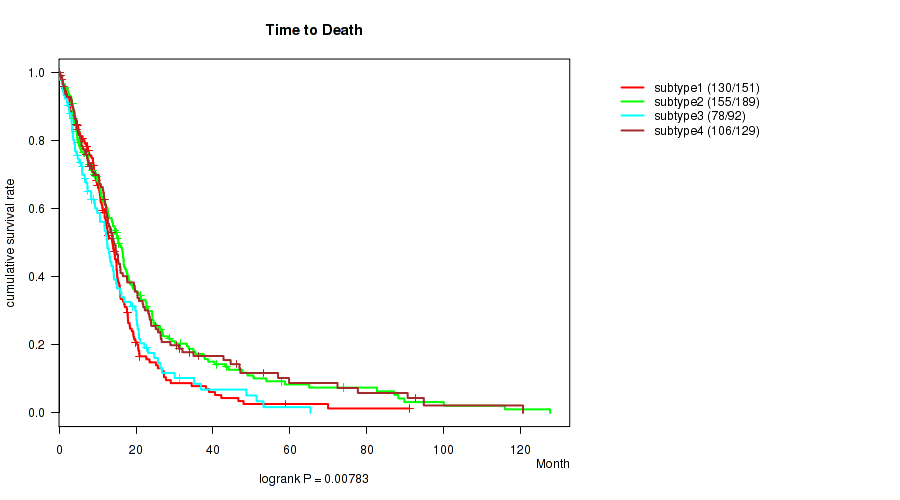
CNMF clustering analysis on array-based miR expression data identified 4 subtypes that correlate to 'Time to Death'.
-
Consensus hierarchical clustering analysis on array-based miR expression data identified 3 subtypes that do not correlate to any clinical features.
-
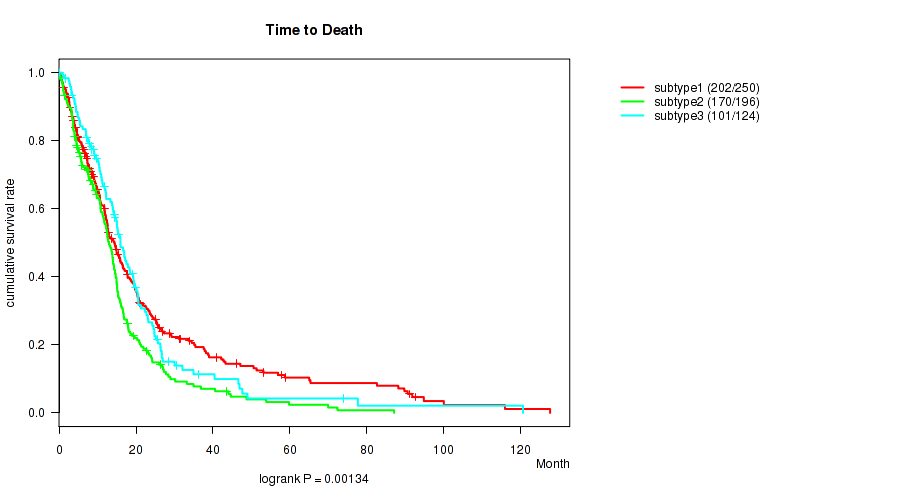
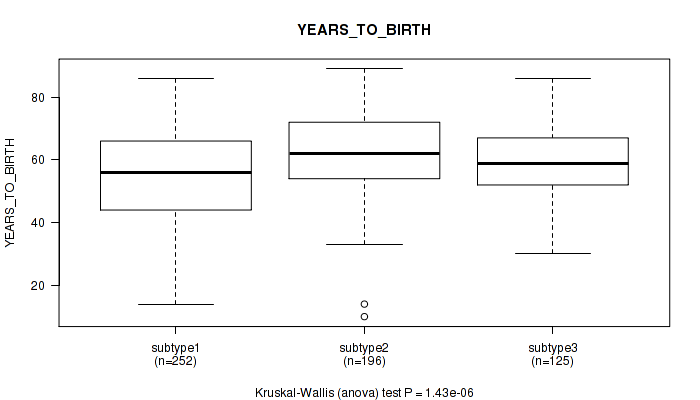
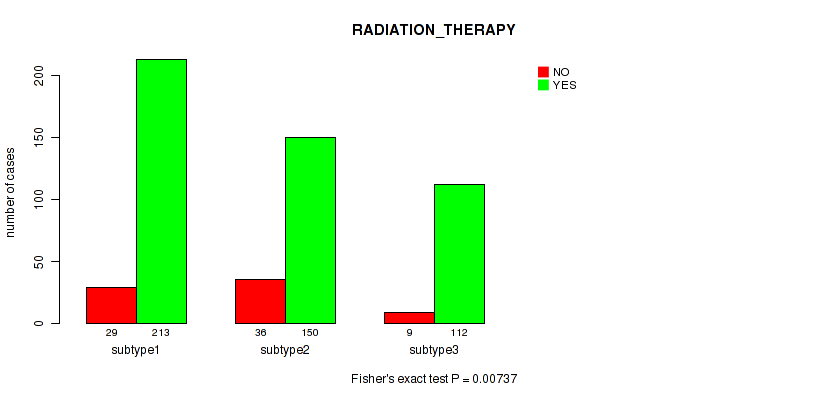
3 subtypes identified in current cancer cohort by 'Copy Number Ratio CNMF subtypes'. These subtypes correlate to 'Time to Death', 'YEARS_TO_BIRTH', and 'RADIATION_THERAPY'.
-
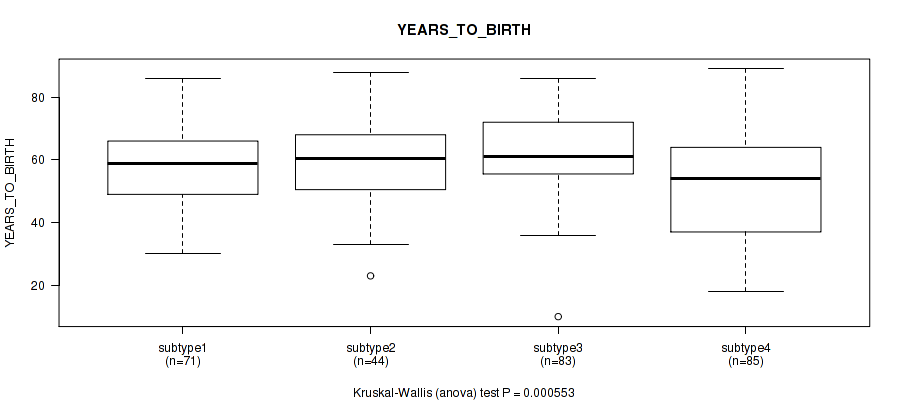
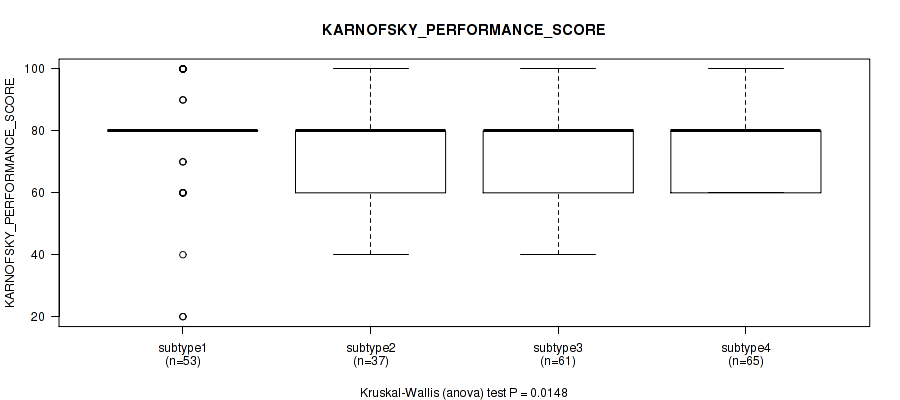
4 subtypes identified in current cancer cohort by 'METHLYATION CNMF'. These subtypes correlate to 'Time to Death', 'YEARS_TO_BIRTH', and 'KARNOFSKY_PERFORMANCE_SCORE'.
-
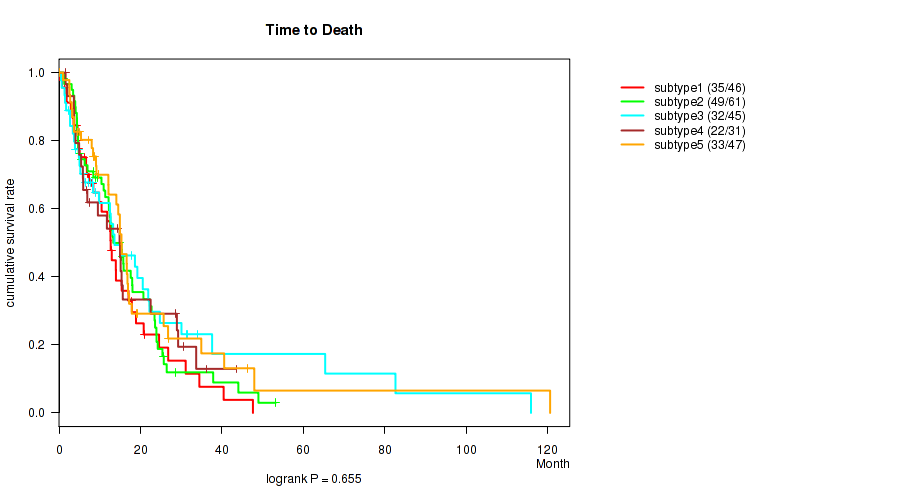
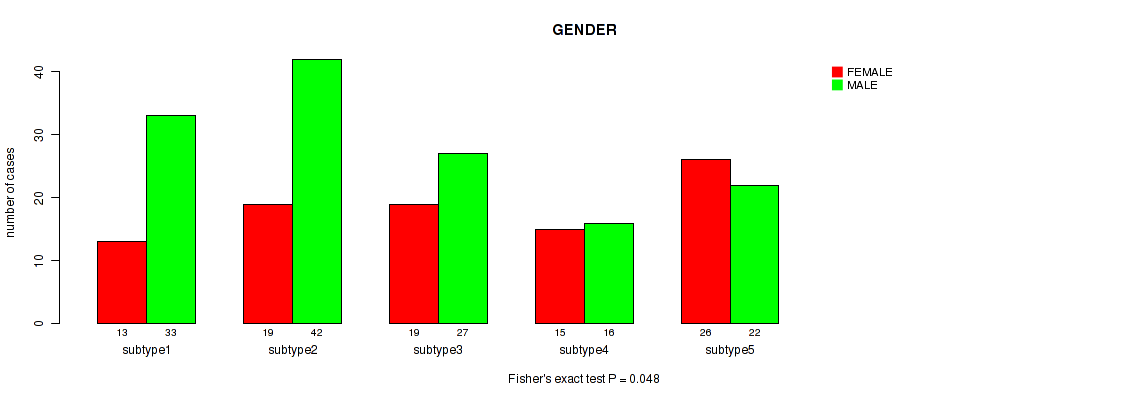
CNMF clustering analysis on RPPA data identified 5 subtypes that correlate to 'GENDER'.
-
Consensus hierarchical clustering analysis on RPPA data identified 3 subtypes that correlate to 'Time to Death'.
-
CNMF clustering analysis on sequencing-based mRNA expression data identified 3 subtypes that correlate to 'GENDER'.
-
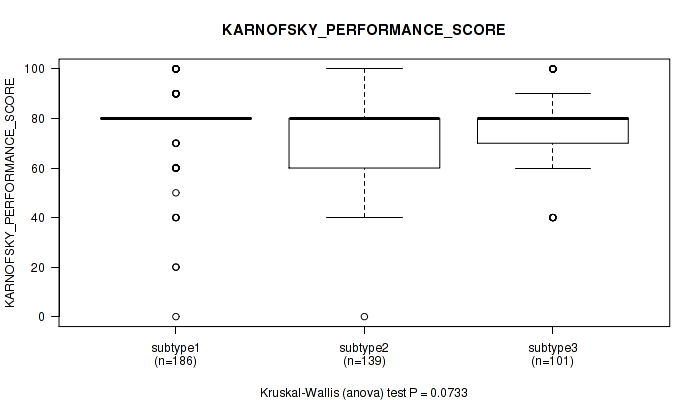
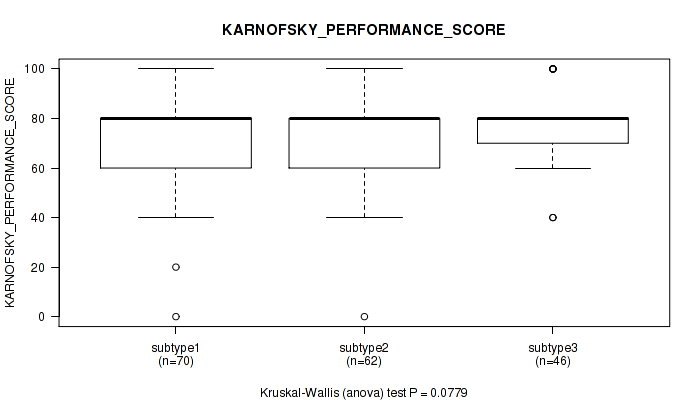
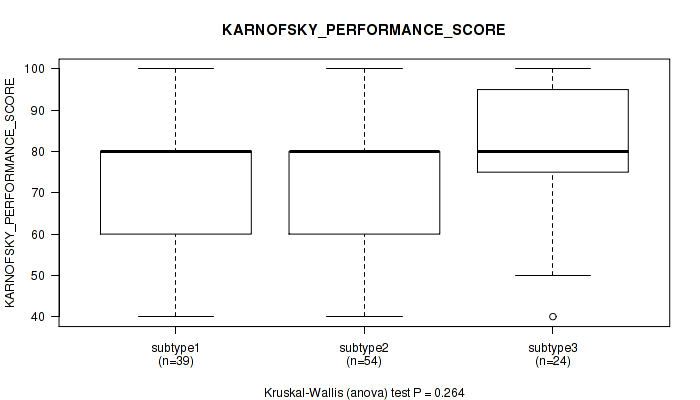
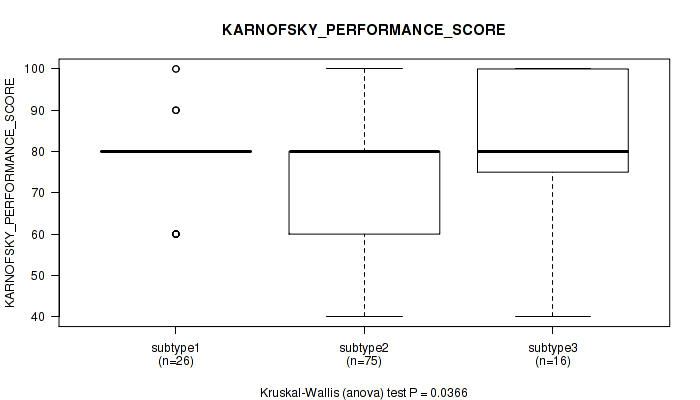
Consensus hierarchical clustering analysis on sequencing-based mRNA expression data identified 3 subtypes that correlate to 'KARNOFSKY_PERFORMANCE_SCORE'.
Table 1. Get Full Table Overview of the association between subtypes identified by 10 different clustering approaches and 8 clinical features. Shown in the table are P values (Q values). Thresholded by P value < 0.05 and Q value < 0.25, 15 significant findings detected.
|
Clinical Features |
Time to Death |
YEARS TO BIRTH |
GENDER |
RADIATION THERAPY |
KARNOFSKY PERFORMANCE SCORE |
HISTOLOGICAL TYPE |
RACE | ETHNICITY |
| Statistical Tests | logrank test | Kruskal-Wallis (anova) | Fisher's exact test | Fisher's exact test | Kruskal-Wallis (anova) | Fisher's exact test | Fisher's exact test | Fisher's exact test |
| mRNA CNMF subtypes |
0.0968 (0.31) |
0.123 (0.339) |
0.111 (0.33) |
0.413 (0.751) |
0.606 (0.865) |
0.00256 (0.0293) |
0.943 (0.979) |
0.163 (0.399) |
| mRNA cHierClus subtypes |
0.000163 (0.00653) |
0.00252 (0.0293) |
0.0935 (0.31) |
0.223 (0.469) |
0.515 (0.842) |
0.0308 (0.205) |
0.588 (0.865) |
0.685 (0.87) |
| miR CNMF subtypes |
0.00783 (0.0696) |
0.71 (0.888) |
0.507 (0.842) |
0.291 (0.553) |
0.839 (0.924) |
0.55 (0.862) |
0.134 (0.358) |
1 (1.00) |
| miR cHierClus subtypes |
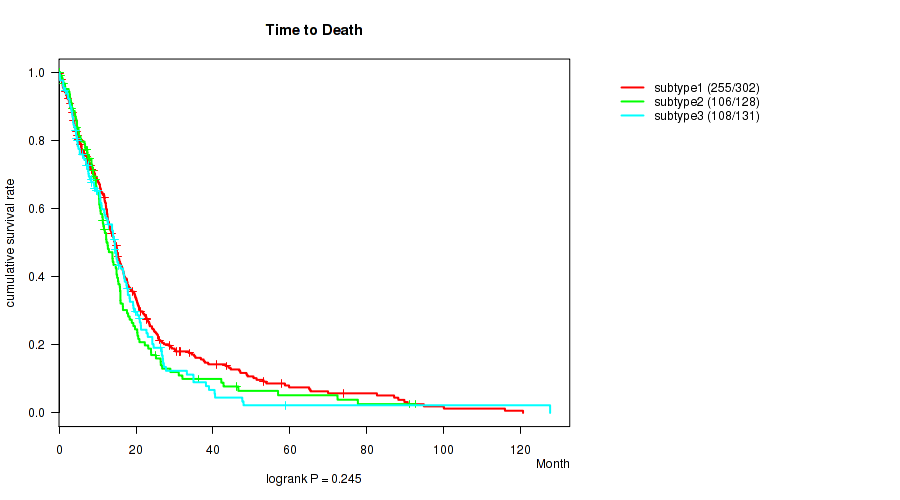
0.245 (0.502) |
0.12 (0.339) |
0.182 (0.429) |
0.476 (0.815) |
0.261 (0.515) |
0.542 (0.862) |
0.193 (0.429) |
0.676 (0.87) |
| Copy Number Ratio CNMF subtypes |
0.00134 (0.0268) |
1.43e-06 (0.000114) |
0.0548 (0.236) |
0.00737 (0.0696) |
0.0733 (0.285) |
0.0547 (0.236) |
0.111 (0.33) |
0.165 (0.399) |
| METHLYATION CNMF |
0.00212 (0.0293) |
0.000553 (0.0147) |
0.479 (0.815) |
0.213 (0.461) |
0.0148 (0.118) |
0.322 (0.599) |
0.879 (0.95) |
0.661 (0.867) |
| RPPA CNMF subtypes |
0.655 (0.867) |
0.844 (0.924) |
0.048 (0.236) |
0.785 (0.894) |
0.954 (0.979) |
0.935 (0.979) |
0.989 (1.00) |
0.627 (0.867) |
| RPPA cHierClus subtypes |
0.0196 (0.143) |
0.0518 (0.236) |
0.192 (0.429) |
0.646 (0.867) |
0.0779 (0.285) |
0.638 (0.867) |
0.424 (0.754) |
0.78 (0.894) |
| RNAseq CNMF subtypes |
0.595 (0.865) |
0.056 (0.236) |
0.0379 (0.217) |
0.763 (0.894) |
0.264 (0.515) |
0.783 (0.894) |
0.764 (0.894) |
0.793 (0.894) |
| RNAseq cHierClus subtypes |
0.086 (0.299) |
0.0784 (0.285) |
0.143 (0.369) |
0.898 (0.958) |
0.0366 (0.217) |
0.601 (0.865) |
0.577 (0.865) |
0.737 (0.894) |
Table S1. Description of clustering approach #1: 'mRNA CNMF subtypes'
| Cluster Labels | 1 | 2 | 3 | 4 |
|---|---|---|---|---|
| Number of samples | 167 | 97 | 139 | 122 |
P value = 0.0968 (logrank test), Q value = 0.31
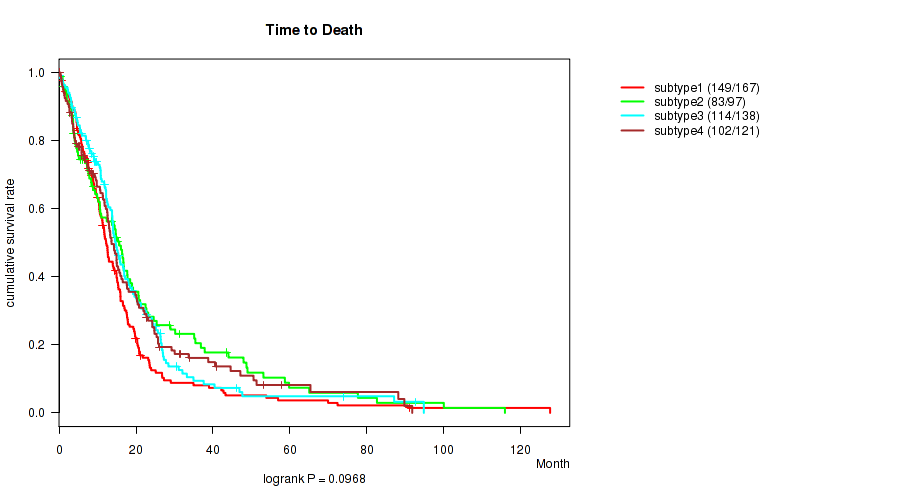
Table S2. Clustering Approach #1: 'mRNA CNMF subtypes' versus Clinical Feature #1: 'Time to Death'
| nPatients | nDeath | Duration Range (Median), Month | |
|---|---|---|---|
| ALL | 523 | 448 | 0.1 - 127.6 (12.4) |
| subtype1 | 167 | 149 | 0.1 - 127.6 (11.3) |
| subtype2 | 97 | 83 | 0.2 - 115.9 (13.6) |
| subtype3 | 138 | 114 | 0.1 - 94.8 (13.8) |
| subtype4 | 121 | 102 | 0.2 - 91.8 (12.7) |
Figure S1. Get High-res Image Clustering Approach #1: 'mRNA CNMF subtypes' versus Clinical Feature #1: 'Time to Death'
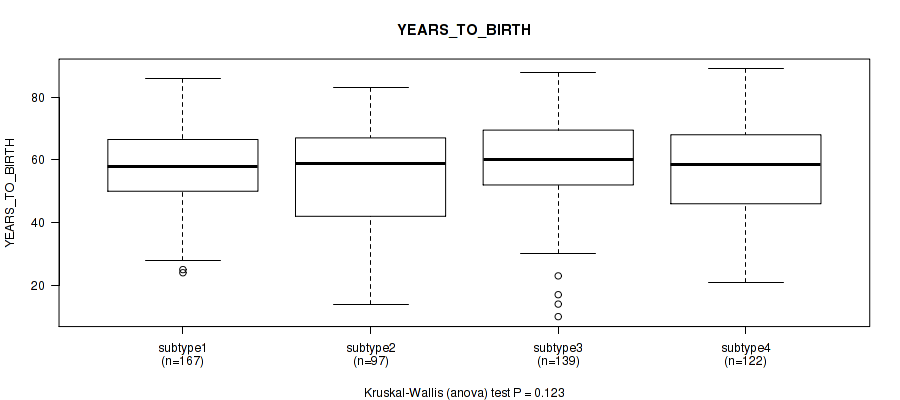
P value = 0.123 (Kruskal-Wallis (anova)), Q value = 0.34
Table S3. Clustering Approach #1: 'mRNA CNMF subtypes' versus Clinical Feature #2: 'YEARS_TO_BIRTH'
| nPatients | Mean (Std.Dev) | |
|---|---|---|
| ALL | 525 | 57.7 (14.6) |
| subtype1 | 167 | 58.4 (12.1) |
| subtype2 | 97 | 54.3 (17.3) |
| subtype3 | 139 | 60.0 (13.8) |
| subtype4 | 122 | 56.7 (15.7) |
Figure S2. Get High-res Image Clustering Approach #1: 'mRNA CNMF subtypes' versus Clinical Feature #2: 'YEARS_TO_BIRTH'
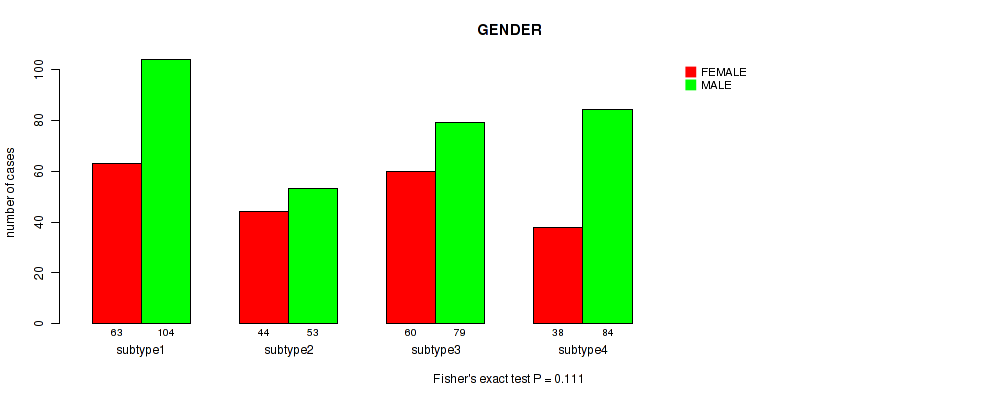
P value = 0.111 (Fisher's exact test), Q value = 0.33
Table S4. Clustering Approach #1: 'mRNA CNMF subtypes' versus Clinical Feature #3: 'GENDER'
| nPatients | FEMALE | MALE |
|---|---|---|
| ALL | 205 | 320 |
| subtype1 | 63 | 104 |
| subtype2 | 44 | 53 |
| subtype3 | 60 | 79 |
| subtype4 | 38 | 84 |
Figure S3. Get High-res Image Clustering Approach #1: 'mRNA CNMF subtypes' versus Clinical Feature #3: 'GENDER'
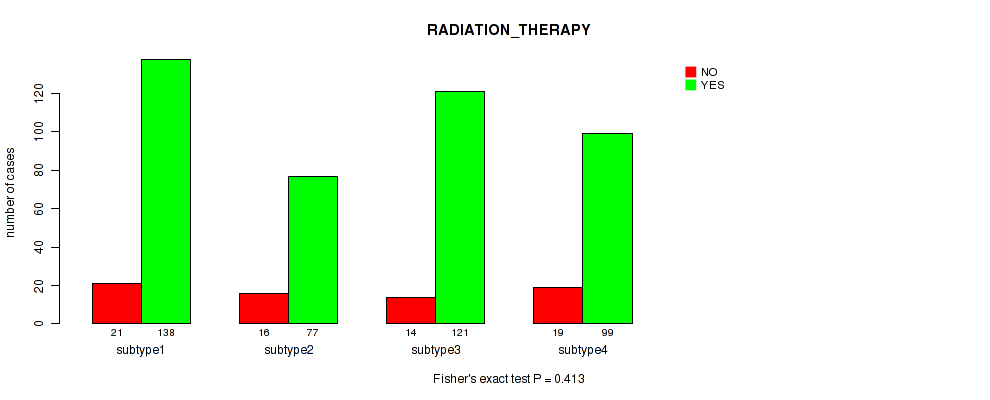
P value = 0.413 (Fisher's exact test), Q value = 0.75
Table S5. Clustering Approach #1: 'mRNA CNMF subtypes' versus Clinical Feature #4: 'RADIATION_THERAPY'
| nPatients | NO | YES |
|---|---|---|
| ALL | 70 | 435 |
| subtype1 | 21 | 138 |
| subtype2 | 16 | 77 |
| subtype3 | 14 | 121 |
| subtype4 | 19 | 99 |
Figure S4. Get High-res Image Clustering Approach #1: 'mRNA CNMF subtypes' versus Clinical Feature #4: 'RADIATION_THERAPY'
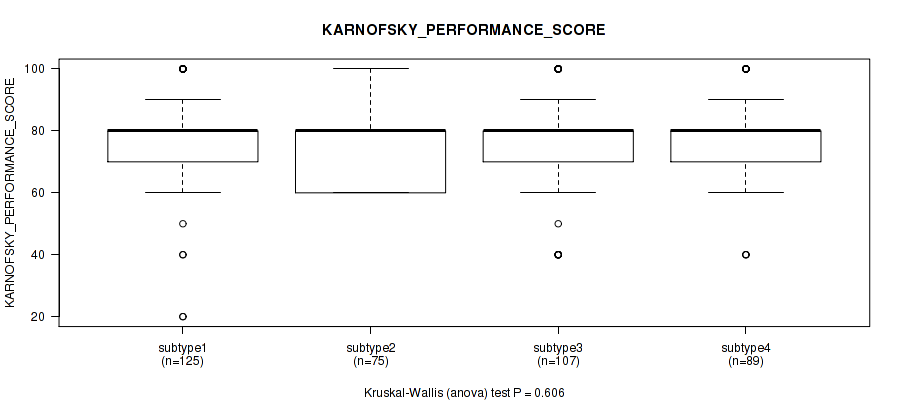
P value = 0.606 (Kruskal-Wallis (anova)), Q value = 0.87
Table S6. Clustering Approach #1: 'mRNA CNMF subtypes' versus Clinical Feature #5: 'KARNOFSKY_PERFORMANCE_SCORE'
| nPatients | Mean (Std.Dev) | |
|---|---|---|
| ALL | 396 | 77.1 (14.6) |
| subtype1 | 125 | 77.6 (15.4) |
| subtype2 | 75 | 76.3 (11.4) |
| subtype3 | 107 | 76.4 (15.7) |
| subtype4 | 89 | 78.2 (14.6) |
Figure S5. Get High-res Image Clustering Approach #1: 'mRNA CNMF subtypes' versus Clinical Feature #5: 'KARNOFSKY_PERFORMANCE_SCORE'
P value = 0.00256 (Fisher's exact test), Q value = 0.029
Table S7. Clustering Approach #1: 'mRNA CNMF subtypes' versus Clinical Feature #6: 'HISTOLOGICAL_TYPE'
| nPatients | GLIOBLASTOMA MULTIFORME (GBM) | TREATED PRIMARY GBM | UNTREATED PRIMARY (DE NOVO) GBM |
|---|---|---|---|
| ALL | 6 | 20 | 499 |
| subtype1 | 1 | 8 | 158 |
| subtype2 | 0 | 8 | 89 |
| subtype3 | 0 | 3 | 136 |
| subtype4 | 5 | 1 | 116 |
Figure S6. Get High-res Image Clustering Approach #1: 'mRNA CNMF subtypes' versus Clinical Feature #6: 'HISTOLOGICAL_TYPE'
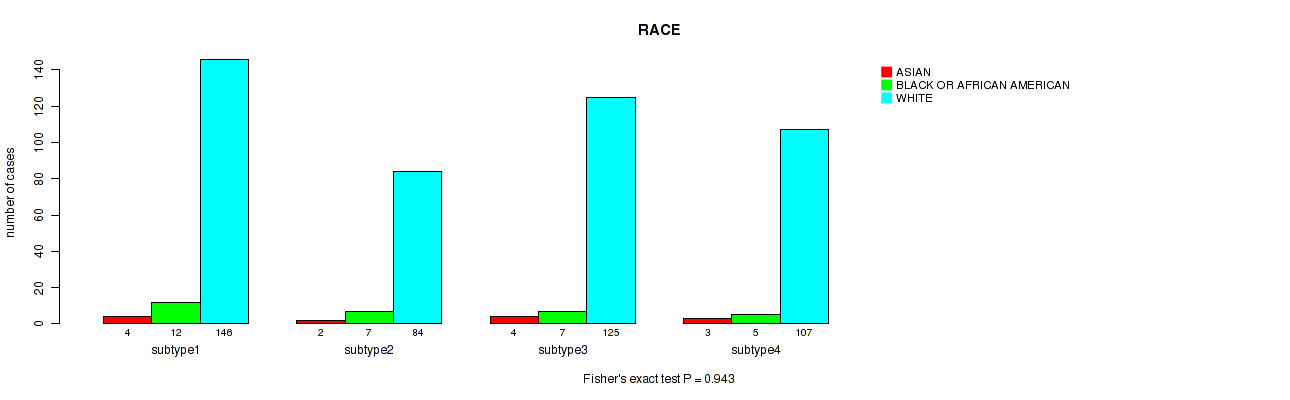
P value = 0.943 (Fisher's exact test), Q value = 0.98
Table S8. Clustering Approach #1: 'mRNA CNMF subtypes' versus Clinical Feature #7: 'RACE'
| nPatients | ASIAN | BLACK OR AFRICAN AMERICAN | WHITE |
|---|---|---|---|
| ALL | 13 | 31 | 462 |
| subtype1 | 4 | 12 | 146 |
| subtype2 | 2 | 7 | 84 |
| subtype3 | 4 | 7 | 125 |
| subtype4 | 3 | 5 | 107 |
Figure S7. Get High-res Image Clustering Approach #1: 'mRNA CNMF subtypes' versus Clinical Feature #7: 'RACE'
P value = 0.163 (Fisher's exact test), Q value = 0.4
Table S9. Clustering Approach #1: 'mRNA CNMF subtypes' versus Clinical Feature #8: 'ETHNICITY'
| nPatients | HISPANIC OR LATINO | NOT HISPANIC OR LATINO |
|---|---|---|
| ALL | 12 | 438 |
| subtype1 | 3 | 139 |
| subtype2 | 5 | 72 |
| subtype3 | 3 | 121 |
| subtype4 | 1 | 106 |
Figure S8. Get High-res Image Clustering Approach #1: 'mRNA CNMF subtypes' versus Clinical Feature #8: 'ETHNICITY'
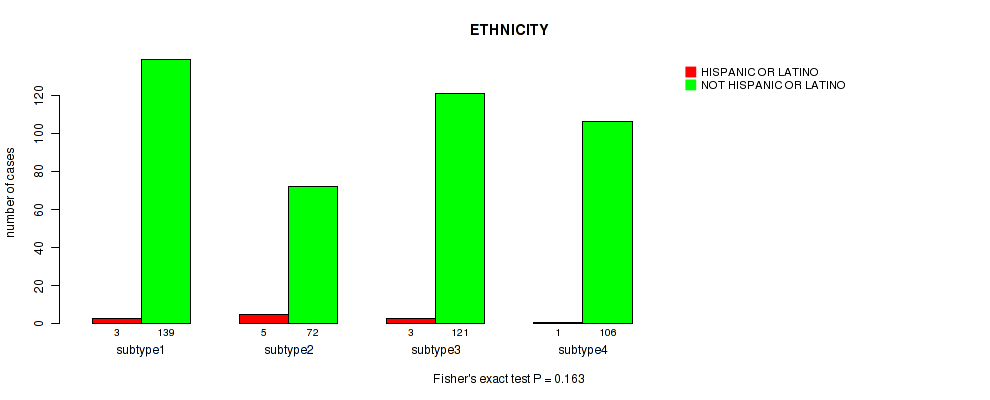
Table S10. Description of clustering approach #2: 'mRNA cHierClus subtypes'
| Cluster Labels | 1 | 2 | 3 | 4 |
|---|---|---|---|---|
| Number of samples | 153 | 107 | 103 | 162 |
P value = 0.000163 (logrank test), Q value = 0.0065
Table S11. Clustering Approach #2: 'mRNA cHierClus subtypes' versus Clinical Feature #1: 'Time to Death'
| nPatients | nDeath | Duration Range (Median), Month | |
|---|---|---|---|
| ALL | 523 | 448 | 0.1 - 127.6 (12.4) |
| subtype1 | 153 | 138 | 0.1 - 91.0 (12.2) |
| subtype2 | 107 | 81 | 0.2 - 115.9 (14.9) |
| subtype3 | 102 | 86 | 0.1 - 94.8 (13.8) |
| subtype4 | 161 | 143 | 0.1 - 127.6 (10.6) |
Figure S9. Get High-res Image Clustering Approach #2: 'mRNA cHierClus subtypes' versus Clinical Feature #1: 'Time to Death'
P value = 0.00252 (Kruskal-Wallis (anova)), Q value = 0.029
Table S12. Clustering Approach #2: 'mRNA cHierClus subtypes' versus Clinical Feature #2: 'YEARS_TO_BIRTH'
| nPatients | Mean (Std.Dev) | |
|---|---|---|
| ALL | 525 | 57.7 (14.6) |
| subtype1 | 153 | 56.9 (13.6) |
| subtype2 | 107 | 52.9 (17.9) |
| subtype3 | 103 | 60.6 (12.1) |
| subtype4 | 162 | 59.8 (13.7) |
Figure S10. Get High-res Image Clustering Approach #2: 'mRNA cHierClus subtypes' versus Clinical Feature #2: 'YEARS_TO_BIRTH'
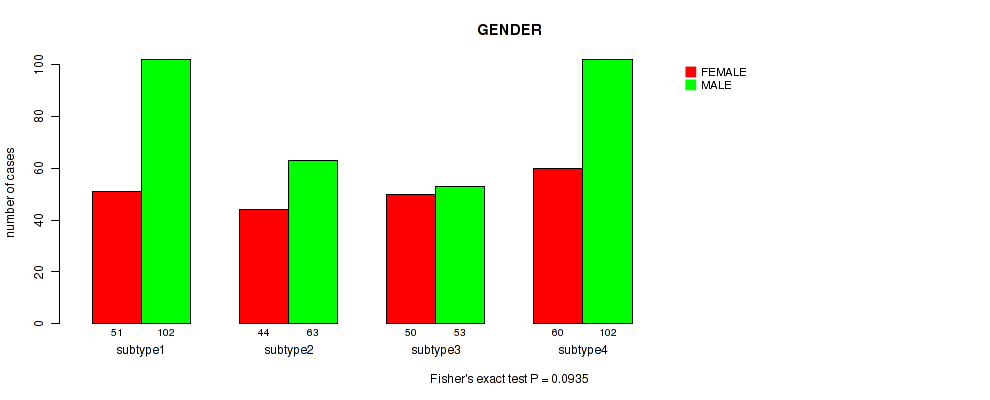
P value = 0.0935 (Fisher's exact test), Q value = 0.31
Table S13. Clustering Approach #2: 'mRNA cHierClus subtypes' versus Clinical Feature #3: 'GENDER'
| nPatients | FEMALE | MALE |
|---|---|---|
| ALL | 205 | 320 |
| subtype1 | 51 | 102 |
| subtype2 | 44 | 63 |
| subtype3 | 50 | 53 |
| subtype4 | 60 | 102 |
Figure S11. Get High-res Image Clustering Approach #2: 'mRNA cHierClus subtypes' versus Clinical Feature #3: 'GENDER'
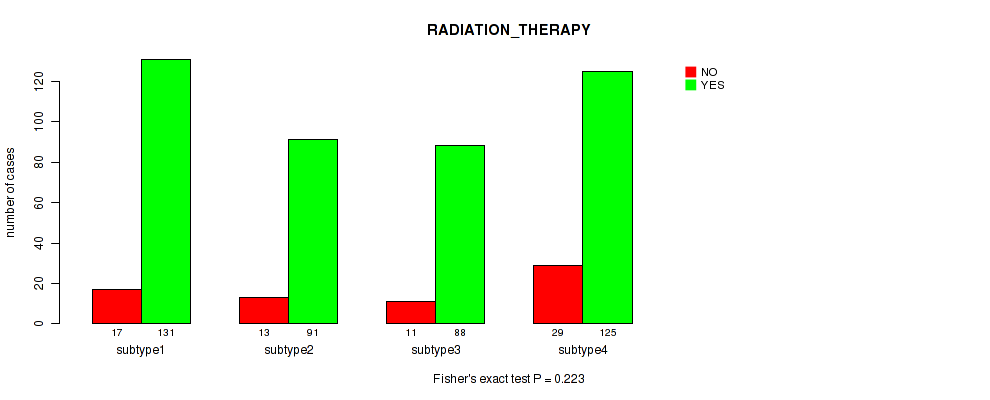
P value = 0.223 (Fisher's exact test), Q value = 0.47
Table S14. Clustering Approach #2: 'mRNA cHierClus subtypes' versus Clinical Feature #4: 'RADIATION_THERAPY'
| nPatients | NO | YES |
|---|---|---|
| ALL | 70 | 435 |
| subtype1 | 17 | 131 |
| subtype2 | 13 | 91 |
| subtype3 | 11 | 88 |
| subtype4 | 29 | 125 |
Figure S12. Get High-res Image Clustering Approach #2: 'mRNA cHierClus subtypes' versus Clinical Feature #4: 'RADIATION_THERAPY'
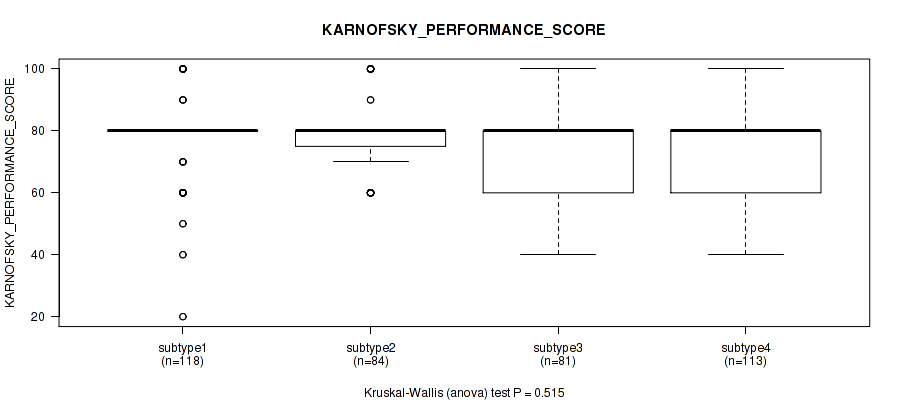
P value = 0.515 (Kruskal-Wallis (anova)), Q value = 0.84
Table S15. Clustering Approach #2: 'mRNA cHierClus subtypes' versus Clinical Feature #5: 'KARNOFSKY_PERFORMANCE_SCORE'
| nPatients | Mean (Std.Dev) | |
|---|---|---|
| ALL | 396 | 77.1 (14.6) |
| subtype1 | 118 | 78.1 (15.4) |
| subtype2 | 84 | 77.6 (11.6) |
| subtype3 | 81 | 75.2 (15.6) |
| subtype4 | 113 | 77.3 (15.1) |
Figure S13. Get High-res Image Clustering Approach #2: 'mRNA cHierClus subtypes' versus Clinical Feature #5: 'KARNOFSKY_PERFORMANCE_SCORE'
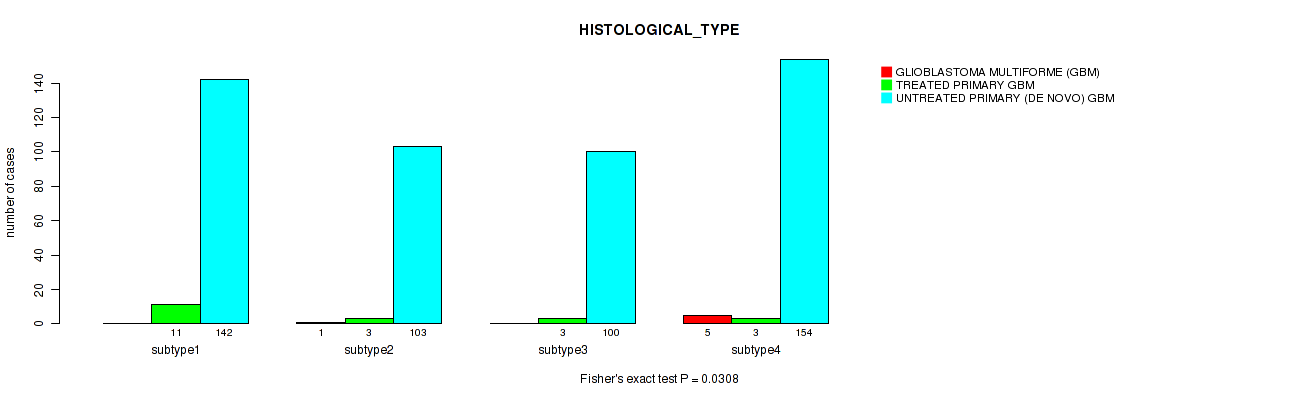
P value = 0.0308 (Fisher's exact test), Q value = 0.21
Table S16. Clustering Approach #2: 'mRNA cHierClus subtypes' versus Clinical Feature #6: 'HISTOLOGICAL_TYPE'
| nPatients | GLIOBLASTOMA MULTIFORME (GBM) | TREATED PRIMARY GBM | UNTREATED PRIMARY (DE NOVO) GBM |
|---|---|---|---|
| ALL | 6 | 20 | 499 |
| subtype1 | 0 | 11 | 142 |
| subtype2 | 1 | 3 | 103 |
| subtype3 | 0 | 3 | 100 |
| subtype4 | 5 | 3 | 154 |
Figure S14. Get High-res Image Clustering Approach #2: 'mRNA cHierClus subtypes' versus Clinical Feature #6: 'HISTOLOGICAL_TYPE'
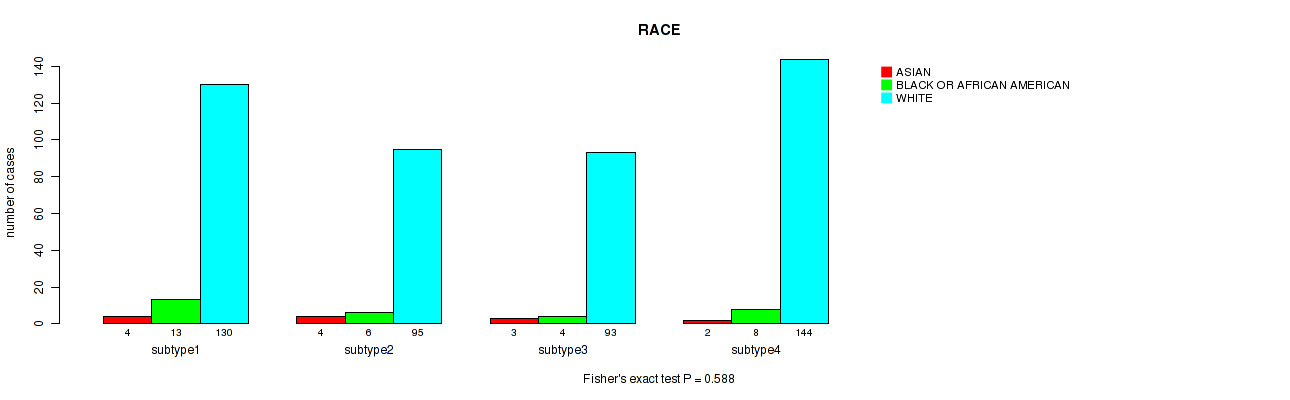
P value = 0.588 (Fisher's exact test), Q value = 0.87
Table S17. Clustering Approach #2: 'mRNA cHierClus subtypes' versus Clinical Feature #7: 'RACE'
| nPatients | ASIAN | BLACK OR AFRICAN AMERICAN | WHITE |
|---|---|---|---|
| ALL | 13 | 31 | 462 |
| subtype1 | 4 | 13 | 130 |
| subtype2 | 4 | 6 | 95 |
| subtype3 | 3 | 4 | 93 |
| subtype4 | 2 | 8 | 144 |
Figure S15. Get High-res Image Clustering Approach #2: 'mRNA cHierClus subtypes' versus Clinical Feature #7: 'RACE'
P value = 0.685 (Fisher's exact test), Q value = 0.87
Table S18. Clustering Approach #2: 'mRNA cHierClus subtypes' versus Clinical Feature #8: 'ETHNICITY'
| nPatients | HISPANIC OR LATINO | NOT HISPANIC OR LATINO |
|---|---|---|
| ALL | 12 | 438 |
| subtype1 | 5 | 124 |
| subtype2 | 1 | 91 |
| subtype3 | 2 | 90 |
| subtype4 | 4 | 133 |
Figure S16. Get High-res Image Clustering Approach #2: 'mRNA cHierClus subtypes' versus Clinical Feature #8: 'ETHNICITY'
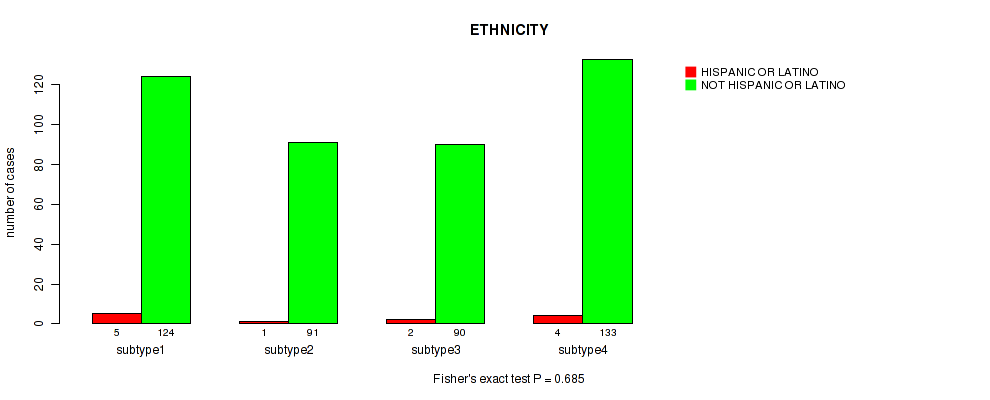
Table S19. Description of clustering approach #3: 'miR CNMF subtypes'
| Cluster Labels | 1 | 2 | 3 | 4 |
|---|---|---|---|---|
| Number of samples | 151 | 189 | 93 | 130 |
P value = 0.00783 (logrank test), Q value = 0.07
Table S20. Clustering Approach #3: 'miR CNMF subtypes' versus Clinical Feature #1: 'Time to Death'
| nPatients | nDeath | Duration Range (Median), Month | |
|---|---|---|---|
| ALL | 561 | 469 | 0.1 - 127.6 (12.2) |
| subtype1 | 151 | 130 | 0.1 - 91.0 (12.1) |
| subtype2 | 189 | 155 | 0.1 - 127.6 (13.0) |
| subtype3 | 92 | 78 | 0.4 - 65.3 (9.6) |
| subtype4 | 129 | 106 | 0.1 - 120.6 (12.5) |
Figure S17. Get High-res Image Clustering Approach #3: 'miR CNMF subtypes' versus Clinical Feature #1: 'Time to Death'
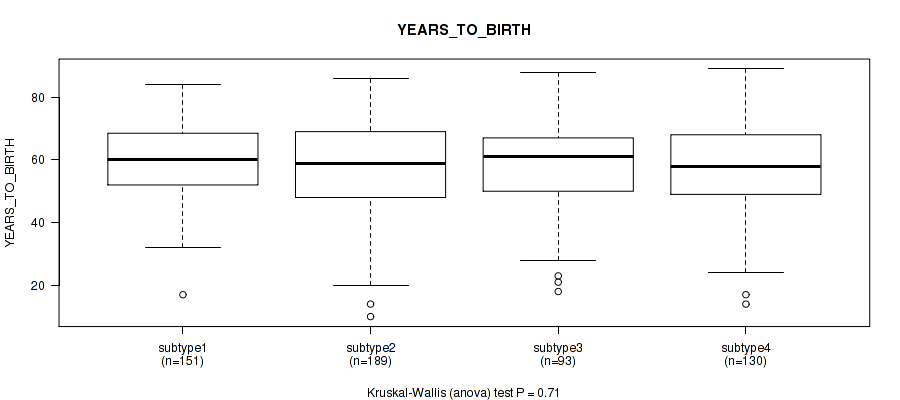
P value = 0.71 (Kruskal-Wallis (anova)), Q value = 0.89
Table S21. Clustering Approach #3: 'miR CNMF subtypes' versus Clinical Feature #2: 'YEARS_TO_BIRTH'
| nPatients | Mean (Std.Dev) | |
|---|---|---|
| ALL | 563 | 57.9 (14.3) |
| subtype1 | 151 | 59.7 (11.8) |
| subtype2 | 189 | 56.5 (16.0) |
| subtype3 | 93 | 57.8 (15.3) |
| subtype4 | 130 | 58.1 (13.7) |
Figure S18. Get High-res Image Clustering Approach #3: 'miR CNMF subtypes' versus Clinical Feature #2: 'YEARS_TO_BIRTH'
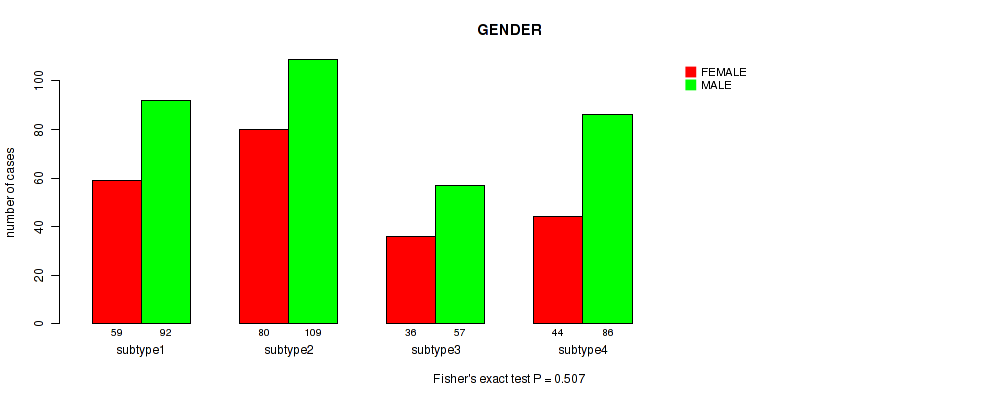
P value = 0.507 (Fisher's exact test), Q value = 0.84
Table S22. Clustering Approach #3: 'miR CNMF subtypes' versus Clinical Feature #3: 'GENDER'
| nPatients | FEMALE | MALE |
|---|---|---|
| ALL | 219 | 344 |
| subtype1 | 59 | 92 |
| subtype2 | 80 | 109 |
| subtype3 | 36 | 57 |
| subtype4 | 44 | 86 |
Figure S19. Get High-res Image Clustering Approach #3: 'miR CNMF subtypes' versus Clinical Feature #3: 'GENDER'
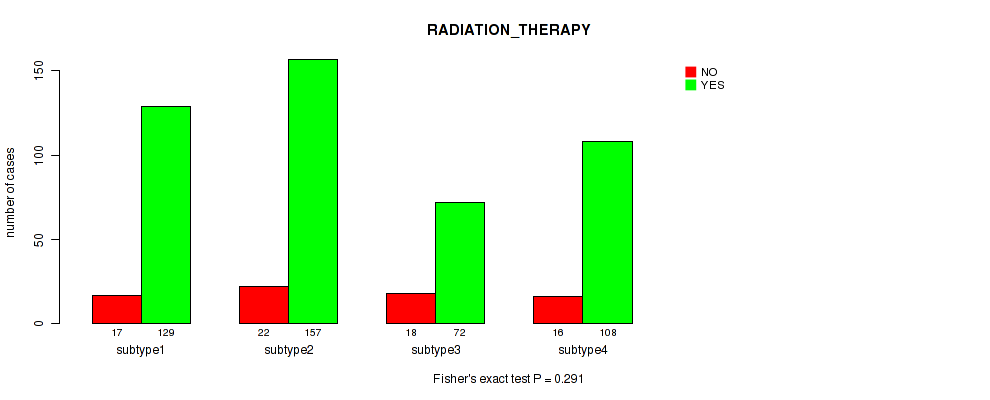
P value = 0.291 (Fisher's exact test), Q value = 0.55
Table S23. Clustering Approach #3: 'miR CNMF subtypes' versus Clinical Feature #4: 'RADIATION_THERAPY'
| nPatients | NO | YES |
|---|---|---|
| ALL | 73 | 466 |
| subtype1 | 17 | 129 |
| subtype2 | 22 | 157 |
| subtype3 | 18 | 72 |
| subtype4 | 16 | 108 |
Figure S20. Get High-res Image Clustering Approach #3: 'miR CNMF subtypes' versus Clinical Feature #4: 'RADIATION_THERAPY'
P value = 0.839 (Kruskal-Wallis (anova)), Q value = 0.92
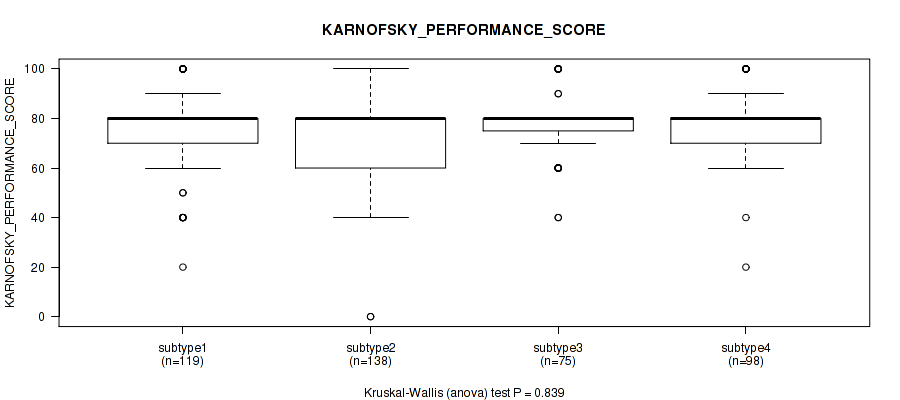
Table S24. Clustering Approach #3: 'miR CNMF subtypes' versus Clinical Feature #5: 'KARNOFSKY_PERFORMANCE_SCORE'
| nPatients | Mean (Std.Dev) | |
|---|---|---|
| ALL | 430 | 77.0 (15.6) |
| subtype1 | 119 | 76.0 (16.1) |
| subtype2 | 138 | 76.4 (17.2) |
| subtype3 | 75 | 78.0 (13.5) |
| subtype4 | 98 | 78.4 (14.3) |
Figure S21. Get High-res Image Clustering Approach #3: 'miR CNMF subtypes' versus Clinical Feature #5: 'KARNOFSKY_PERFORMANCE_SCORE'
P value = 0.55 (Fisher's exact test), Q value = 0.86
Table S25. Clustering Approach #3: 'miR CNMF subtypes' versus Clinical Feature #6: 'HISTOLOGICAL_TYPE'
| nPatients | GLIOBLASTOMA MULTIFORME (GBM) | TREATED PRIMARY GBM | UNTREATED PRIMARY (DE NOVO) GBM |
|---|---|---|---|
| ALL | 11 | 20 | 532 |
| subtype1 | 2 | 3 | 146 |
| subtype2 | 3 | 9 | 177 |
| subtype3 | 3 | 5 | 85 |
| subtype4 | 3 | 3 | 124 |
Figure S22. Get High-res Image Clustering Approach #3: 'miR CNMF subtypes' versus Clinical Feature #6: 'HISTOLOGICAL_TYPE'
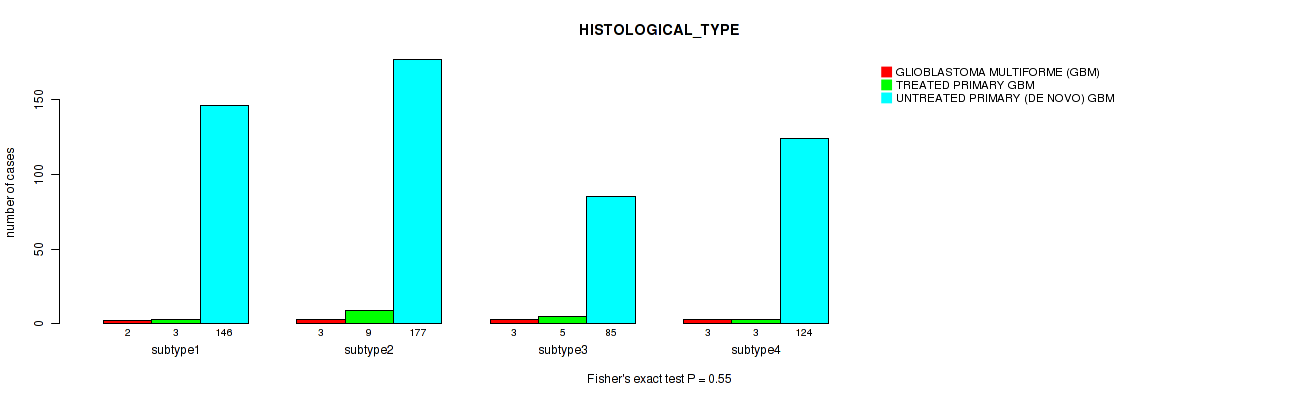
P value = 0.134 (Fisher's exact test), Q value = 0.36
Table S26. Clustering Approach #3: 'miR CNMF subtypes' versus Clinical Feature #7: 'RACE'
| nPatients | ASIAN | BLACK OR AFRICAN AMERICAN | WHITE |
|---|---|---|---|
| ALL | 13 | 30 | 495 |
| subtype1 | 3 | 13 | 127 |
| subtype2 | 7 | 9 | 162 |
| subtype3 | 1 | 1 | 89 |
| subtype4 | 2 | 7 | 117 |
Figure S23. Get High-res Image Clustering Approach #3: 'miR CNMF subtypes' versus Clinical Feature #7: 'RACE'
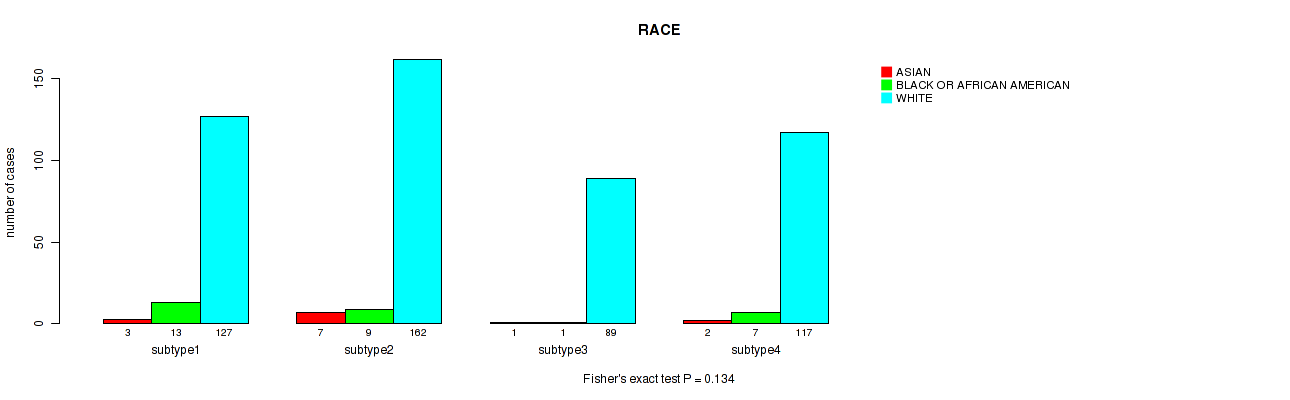
P value = 1 (Fisher's exact test), Q value = 1
Table S27. Clustering Approach #3: 'miR CNMF subtypes' versus Clinical Feature #8: 'ETHNICITY'
| nPatients | HISPANIC OR LATINO | NOT HISPANIC OR LATINO |
|---|---|---|
| ALL | 12 | 461 |
| subtype1 | 3 | 124 |
| subtype2 | 4 | 158 |
| subtype3 | 2 | 74 |
| subtype4 | 3 | 105 |
Figure S24. Get High-res Image Clustering Approach #3: 'miR CNMF subtypes' versus Clinical Feature #8: 'ETHNICITY'
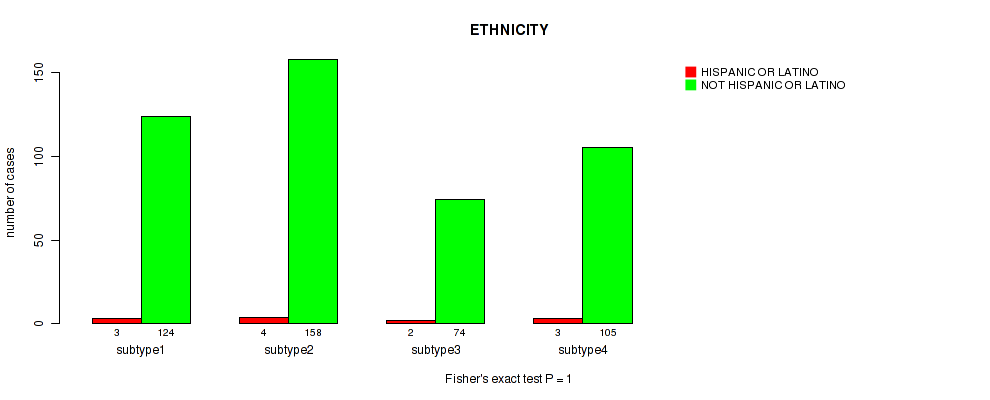
Table S28. Description of clustering approach #4: 'miR cHierClus subtypes'
| Cluster Labels | 1 | 2 | 3 |
|---|---|---|---|
| Number of samples | 303 | 129 | 131 |
P value = 0.245 (logrank test), Q value = 0.5
Table S29. Clustering Approach #4: 'miR cHierClus subtypes' versus Clinical Feature #1: 'Time to Death'
| nPatients | nDeath | Duration Range (Median), Month | |
|---|---|---|---|
| ALL | 561 | 469 | 0.1 - 127.6 (12.2) |
| subtype1 | 302 | 255 | 0.1 - 120.6 (12.7) |
| subtype2 | 128 | 106 | 0.1 - 92.7 (11.0) |
| subtype3 | 131 | 108 | 0.1 - 127.6 (11.8) |
Figure S25. Get High-res Image Clustering Approach #4: 'miR cHierClus subtypes' versus Clinical Feature #1: 'Time to Death'
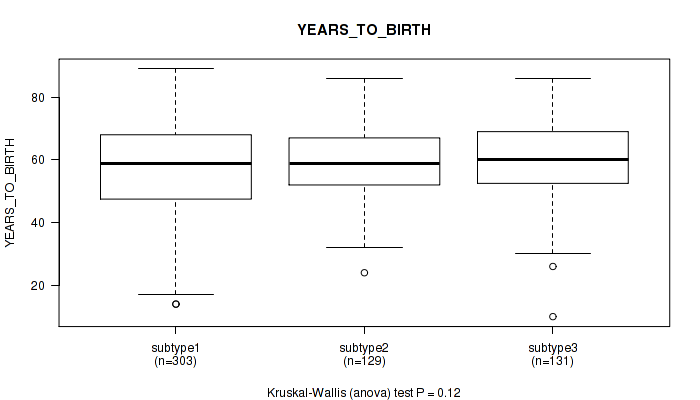
P value = 0.12 (Kruskal-Wallis (anova)), Q value = 0.34
Table S30. Clustering Approach #4: 'miR cHierClus subtypes' versus Clinical Feature #2: 'YEARS_TO_BIRTH'
| nPatients | Mean (Std.Dev) | |
|---|---|---|
| ALL | 563 | 57.9 (14.3) |
| subtype1 | 303 | 56.6 (15.9) |
| subtype2 | 129 | 59.0 (11.5) |
| subtype3 | 131 | 60.1 (12.5) |
Figure S26. Get High-res Image Clustering Approach #4: 'miR cHierClus subtypes' versus Clinical Feature #2: 'YEARS_TO_BIRTH'
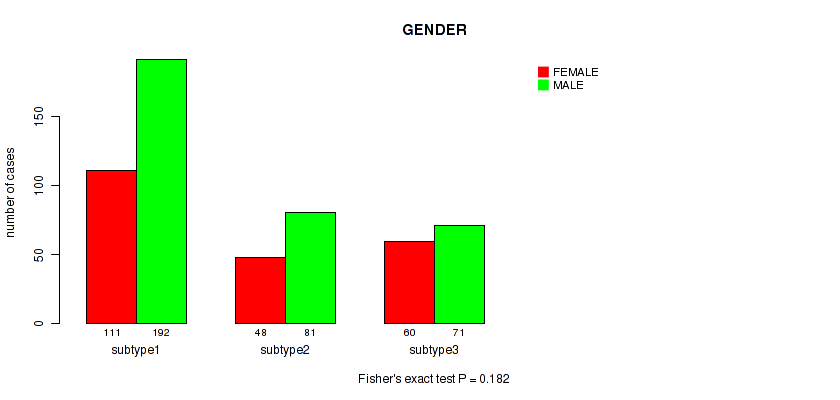
P value = 0.182 (Fisher's exact test), Q value = 0.43
Table S31. Clustering Approach #4: 'miR cHierClus subtypes' versus Clinical Feature #3: 'GENDER'
| nPatients | FEMALE | MALE |
|---|---|---|
| ALL | 219 | 344 |
| subtype1 | 111 | 192 |
| subtype2 | 48 | 81 |
| subtype3 | 60 | 71 |
Figure S27. Get High-res Image Clustering Approach #4: 'miR cHierClus subtypes' versus Clinical Feature #3: 'GENDER'
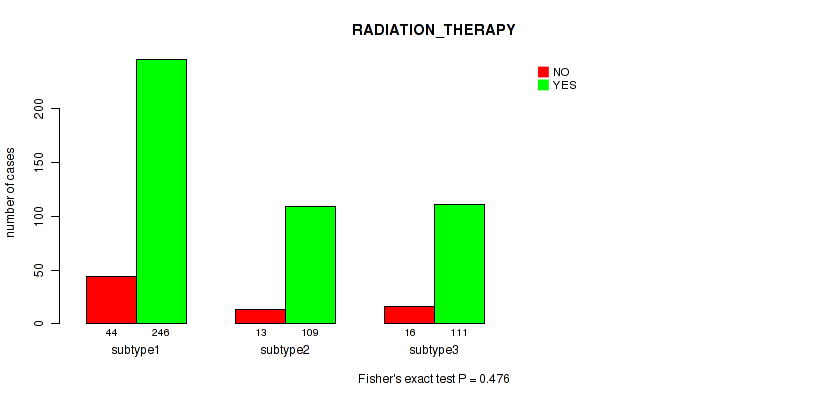
P value = 0.476 (Fisher's exact test), Q value = 0.81
Table S32. Clustering Approach #4: 'miR cHierClus subtypes' versus Clinical Feature #4: 'RADIATION_THERAPY'
| nPatients | NO | YES |
|---|---|---|
| ALL | 73 | 466 |
| subtype1 | 44 | 246 |
| subtype2 | 13 | 109 |
| subtype3 | 16 | 111 |
Figure S28. Get High-res Image Clustering Approach #4: 'miR cHierClus subtypes' versus Clinical Feature #4: 'RADIATION_THERAPY'
P value = 0.261 (Kruskal-Wallis (anova)), Q value = 0.52
Table S33. Clustering Approach #4: 'miR cHierClus subtypes' versus Clinical Feature #5: 'KARNOFSKY_PERFORMANCE_SCORE'
| nPatients | Mean (Std.Dev) | |
|---|---|---|
| ALL | 430 | 77.0 (15.6) |
| subtype1 | 228 | 78.2 (14.9) |
| subtype2 | 101 | 76.5 (15.6) |
| subtype3 | 101 | 74.8 (17.1) |
Figure S29. Get High-res Image Clustering Approach #4: 'miR cHierClus subtypes' versus Clinical Feature #5: 'KARNOFSKY_PERFORMANCE_SCORE'
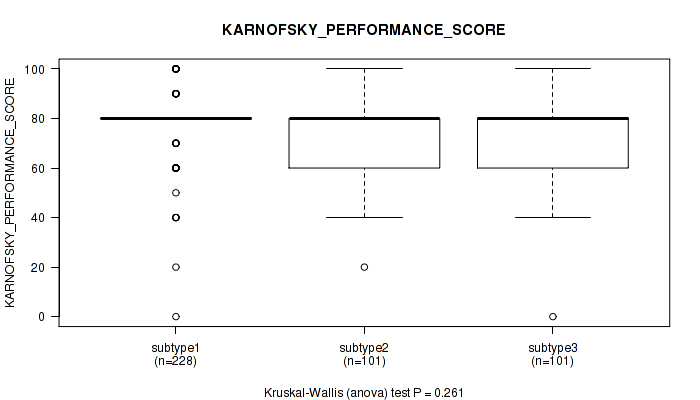
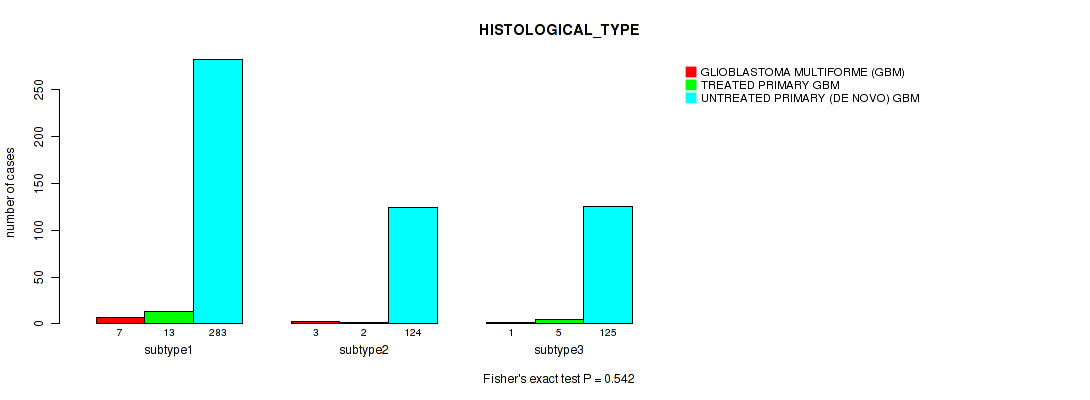
P value = 0.542 (Fisher's exact test), Q value = 0.86
Table S34. Clustering Approach #4: 'miR cHierClus subtypes' versus Clinical Feature #6: 'HISTOLOGICAL_TYPE'
| nPatients | GLIOBLASTOMA MULTIFORME (GBM) | TREATED PRIMARY GBM | UNTREATED PRIMARY (DE NOVO) GBM |
|---|---|---|---|
| ALL | 11 | 20 | 532 |
| subtype1 | 7 | 13 | 283 |
| subtype2 | 3 | 2 | 124 |
| subtype3 | 1 | 5 | 125 |
Figure S30. Get High-res Image Clustering Approach #4: 'miR cHierClus subtypes' versus Clinical Feature #6: 'HISTOLOGICAL_TYPE'
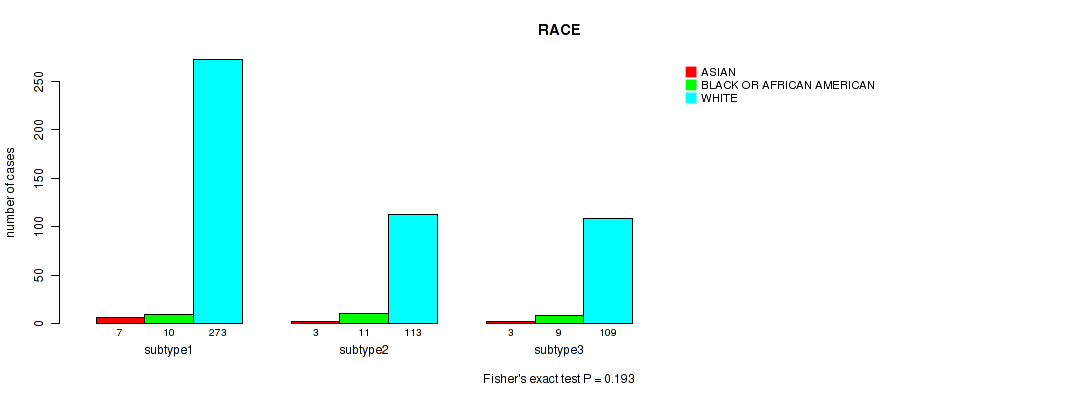
P value = 0.193 (Fisher's exact test), Q value = 0.43
Table S35. Clustering Approach #4: 'miR cHierClus subtypes' versus Clinical Feature #7: 'RACE'
| nPatients | ASIAN | BLACK OR AFRICAN AMERICAN | WHITE |
|---|---|---|---|
| ALL | 13 | 30 | 495 |
| subtype1 | 7 | 10 | 273 |
| subtype2 | 3 | 11 | 113 |
| subtype3 | 3 | 9 | 109 |
Figure S31. Get High-res Image Clustering Approach #4: 'miR cHierClus subtypes' versus Clinical Feature #7: 'RACE'
P value = 0.676 (Fisher's exact test), Q value = 0.87
Table S36. Clustering Approach #4: 'miR cHierClus subtypes' versus Clinical Feature #8: 'ETHNICITY'
| nPatients | HISPANIC OR LATINO | NOT HISPANIC OR LATINO |
|---|---|---|
| ALL | 12 | 461 |
| subtype1 | 6 | 250 |
| subtype2 | 2 | 109 |
| subtype3 | 4 | 102 |
Figure S32. Get High-res Image Clustering Approach #4: 'miR cHierClus subtypes' versus Clinical Feature #8: 'ETHNICITY'
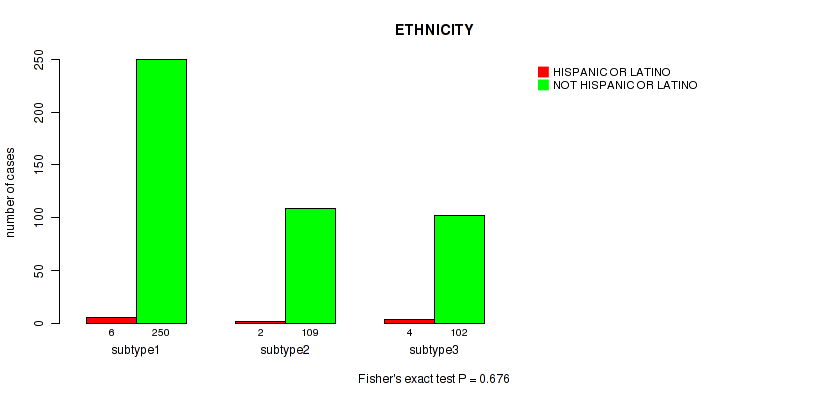
Table S37. Description of clustering approach #5: 'Copy Number Ratio CNMF subtypes'
| Cluster Labels | 1 | 2 | 3 |
|---|---|---|---|
| Number of samples | 252 | 196 | 125 |
P value = 0.00134 (logrank test), Q value = 0.027
Table S38. Clustering Approach #5: 'Copy Number Ratio CNMF subtypes' versus Clinical Feature #1: 'Time to Death'
| nPatients | nDeath | Duration Range (Median), Month | |
|---|---|---|---|
| ALL | 570 | 473 | 0.1 - 127.6 (12.2) |
| subtype1 | 250 | 202 | 0.2 - 127.6 (12.1) |
| subtype2 | 196 | 170 | 0.1 - 87.1 (11.6) |
| subtype3 | 124 | 101 | 0.1 - 120.6 (14.4) |
Figure S33. Get High-res Image Clustering Approach #5: 'Copy Number Ratio CNMF subtypes' versus Clinical Feature #1: 'Time to Death'
P value = 1.43e-06 (Kruskal-Wallis (anova)), Q value = 0.00011
Table S39. Clustering Approach #5: 'Copy Number Ratio CNMF subtypes' versus Clinical Feature #2: 'YEARS_TO_BIRTH'
| nPatients | Mean (Std.Dev) | |
|---|---|---|
| ALL | 573 | 57.8 (14.5) |
| subtype1 | 252 | 54.0 (16.2) |
| subtype2 | 196 | 61.7 (12.9) |
| subtype3 | 125 | 59.2 (11.2) |
Figure S34. Get High-res Image Clustering Approach #5: 'Copy Number Ratio CNMF subtypes' versus Clinical Feature #2: 'YEARS_TO_BIRTH'
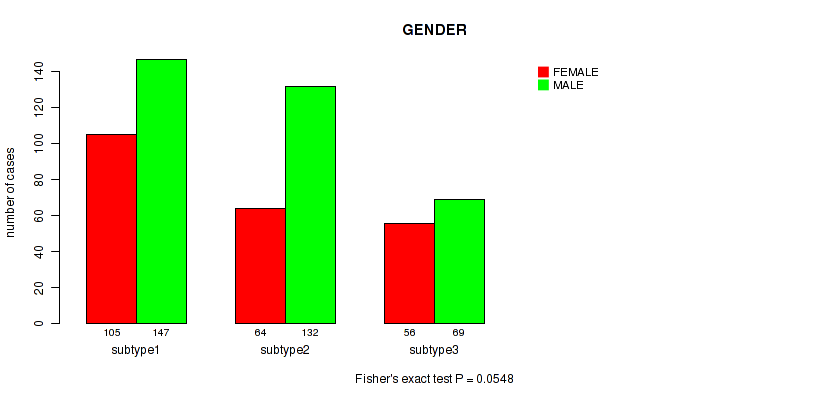
P value = 0.0548 (Fisher's exact test), Q value = 0.24
Table S40. Clustering Approach #5: 'Copy Number Ratio CNMF subtypes' versus Clinical Feature #3: 'GENDER'
| nPatients | FEMALE | MALE |
|---|---|---|
| ALL | 225 | 348 |
| subtype1 | 105 | 147 |
| subtype2 | 64 | 132 |
| subtype3 | 56 | 69 |
Figure S35. Get High-res Image Clustering Approach #5: 'Copy Number Ratio CNMF subtypes' versus Clinical Feature #3: 'GENDER'
P value = 0.00737 (Fisher's exact test), Q value = 0.07
Table S41. Clustering Approach #5: 'Copy Number Ratio CNMF subtypes' versus Clinical Feature #4: 'RADIATION_THERAPY'
| nPatients | NO | YES |
|---|---|---|
| ALL | 74 | 475 |
| subtype1 | 29 | 213 |
| subtype2 | 36 | 150 |
| subtype3 | 9 | 112 |
Figure S36. Get High-res Image Clustering Approach #5: 'Copy Number Ratio CNMF subtypes' versus Clinical Feature #4: 'RADIATION_THERAPY'
P value = 0.0733 (Kruskal-Wallis (anova)), Q value = 0.29
Table S42. Clustering Approach #5: 'Copy Number Ratio CNMF subtypes' versus Clinical Feature #5: 'KARNOFSKY_PERFORMANCE_SCORE'
| nPatients | Mean (Std.Dev) | |
|---|---|---|
| ALL | 426 | 77.1 (15.8) |
| subtype1 | 186 | 78.4 (15.4) |
| subtype2 | 139 | 75.3 (16.4) |
| subtype3 | 101 | 76.9 (15.5) |
Figure S37. Get High-res Image Clustering Approach #5: 'Copy Number Ratio CNMF subtypes' versus Clinical Feature #5: 'KARNOFSKY_PERFORMANCE_SCORE'
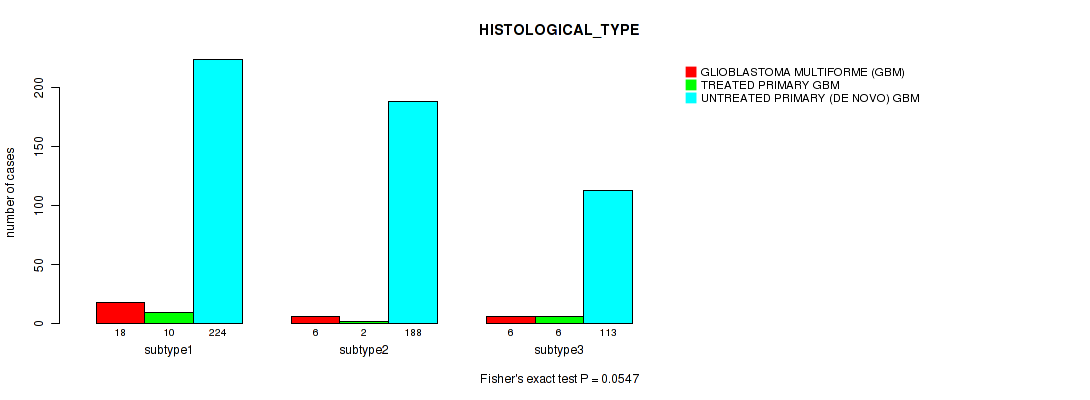
P value = 0.0547 (Fisher's exact test), Q value = 0.24
Table S43. Clustering Approach #5: 'Copy Number Ratio CNMF subtypes' versus Clinical Feature #6: 'HISTOLOGICAL_TYPE'
| nPatients | GLIOBLASTOMA MULTIFORME (GBM) | TREATED PRIMARY GBM | UNTREATED PRIMARY (DE NOVO) GBM |
|---|---|---|---|
| ALL | 30 | 18 | 525 |
| subtype1 | 18 | 10 | 224 |
| subtype2 | 6 | 2 | 188 |
| subtype3 | 6 | 6 | 113 |
Figure S38. Get High-res Image Clustering Approach #5: 'Copy Number Ratio CNMF subtypes' versus Clinical Feature #6: 'HISTOLOGICAL_TYPE'
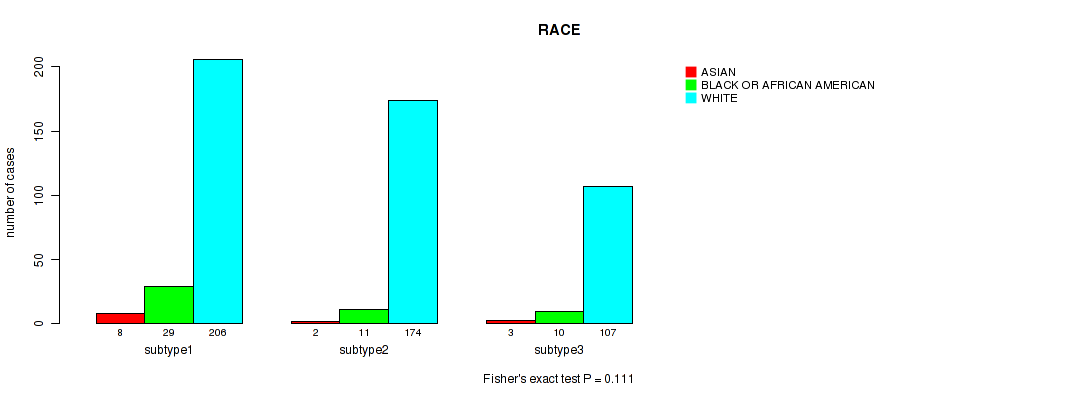
P value = 0.111 (Fisher's exact test), Q value = 0.33
Table S44. Clustering Approach #5: 'Copy Number Ratio CNMF subtypes' versus Clinical Feature #7: 'RACE'
| nPatients | ASIAN | BLACK OR AFRICAN AMERICAN | WHITE |
|---|---|---|---|
| ALL | 13 | 50 | 487 |
| subtype1 | 8 | 29 | 206 |
| subtype2 | 2 | 11 | 174 |
| subtype3 | 3 | 10 | 107 |
Figure S39. Get High-res Image Clustering Approach #5: 'Copy Number Ratio CNMF subtypes' versus Clinical Feature #7: 'RACE'
P value = 0.165 (Fisher's exact test), Q value = 0.4
Table S45. Clustering Approach #5: 'Copy Number Ratio CNMF subtypes' versus Clinical Feature #8: 'ETHNICITY'
| nPatients | HISPANIC OR LATINO | NOT HISPANIC OR LATINO |
|---|---|---|
| ALL | 12 | 475 |
| subtype1 | 7 | 210 |
| subtype2 | 1 | 161 |
| subtype3 | 4 | 104 |
Figure S40. Get High-res Image Clustering Approach #5: 'Copy Number Ratio CNMF subtypes' versus Clinical Feature #8: 'ETHNICITY'
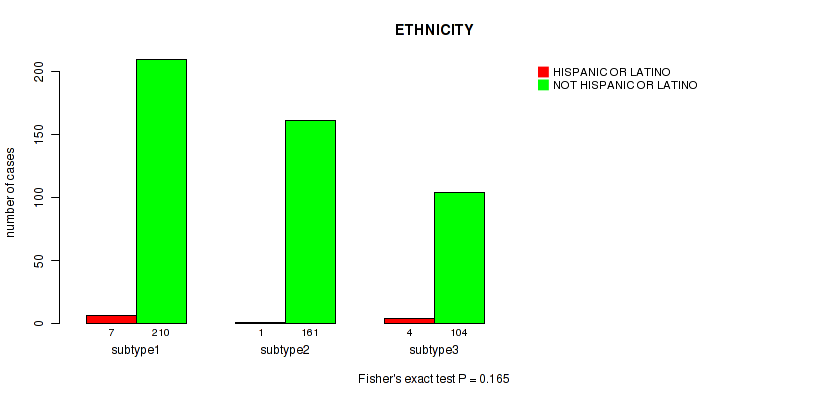
Table S46. Description of clustering approach #6: 'METHLYATION CNMF'
| Cluster Labels | 1 | 2 | 3 | 4 |
|---|---|---|---|---|
| Number of samples | 71 | 44 | 83 | 85 |
P value = 0.00212 (logrank test), Q value = 0.029
Table S47. Clustering Approach #6: 'METHLYATION CNMF' versus Clinical Feature #1: 'Time to Death'
| nPatients | nDeath | Duration Range (Median), Month | |
|---|---|---|---|
| ALL | 280 | 227 | 0.1 - 127.6 (12.5) |
| subtype1 | 71 | 57 | 0.1 - 92.7 (12.7) |
| subtype2 | 43 | 37 | 0.1 - 77.7 (9.4) |
| subtype3 | 82 | 68 | 0.1 - 49.0 (10.6) |
| subtype4 | 84 | 65 | 0.2 - 127.6 (14.3) |
Figure S41. Get High-res Image Clustering Approach #6: 'METHLYATION CNMF' versus Clinical Feature #1: 'Time to Death'
P value = 0.000553 (Kruskal-Wallis (anova)), Q value = 0.015
Table S48. Clustering Approach #6: 'METHLYATION CNMF' versus Clinical Feature #2: 'YEARS_TO_BIRTH'
| nPatients | Mean (Std.Dev) | |
|---|---|---|
| ALL | 283 | 57.8 (15.0) |
| subtype1 | 71 | 58.5 (12.4) |
| subtype2 | 44 | 58.9 (13.7) |
| subtype3 | 83 | 62.6 (12.8) |
| subtype4 | 85 | 52.0 (17.8) |
Figure S42. Get High-res Image Clustering Approach #6: 'METHLYATION CNMF' versus Clinical Feature #2: 'YEARS_TO_BIRTH'
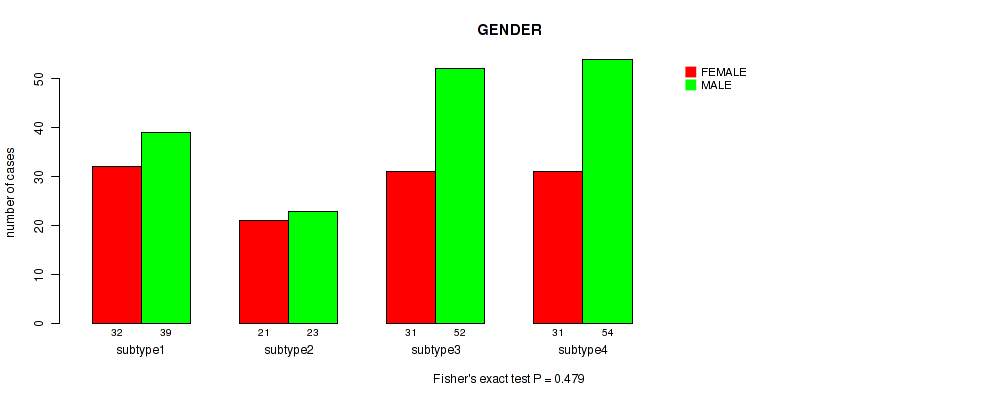
P value = 0.479 (Fisher's exact test), Q value = 0.81
Table S49. Clustering Approach #6: 'METHLYATION CNMF' versus Clinical Feature #3: 'GENDER'
| nPatients | FEMALE | MALE |
|---|---|---|
| ALL | 115 | 168 |
| subtype1 | 32 | 39 |
| subtype2 | 21 | 23 |
| subtype3 | 31 | 52 |
| subtype4 | 31 | 54 |
Figure S43. Get High-res Image Clustering Approach #6: 'METHLYATION CNMF' versus Clinical Feature #3: 'GENDER'
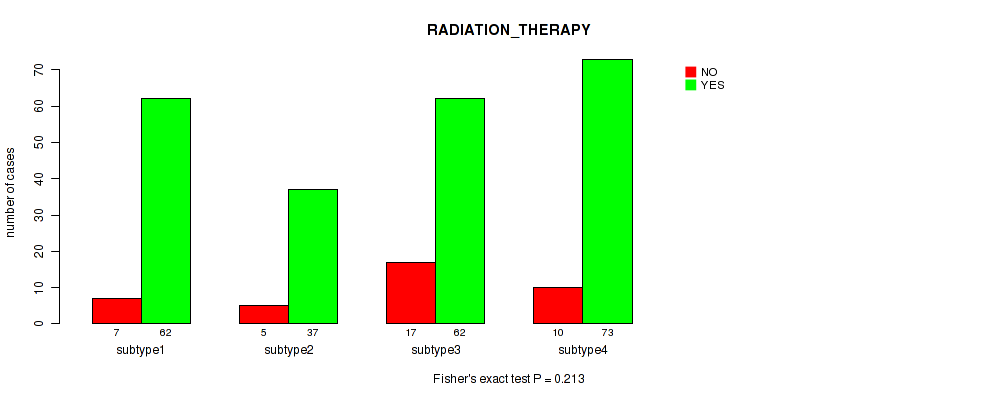
P value = 0.213 (Fisher's exact test), Q value = 0.46
Table S50. Clustering Approach #6: 'METHLYATION CNMF' versus Clinical Feature #4: 'RADIATION_THERAPY'
| nPatients | NO | YES |
|---|---|---|
| ALL | 39 | 234 |
| subtype1 | 7 | 62 |
| subtype2 | 5 | 37 |
| subtype3 | 17 | 62 |
| subtype4 | 10 | 73 |
Figure S44. Get High-res Image Clustering Approach #6: 'METHLYATION CNMF' versus Clinical Feature #4: 'RADIATION_THERAPY'
P value = 0.0148 (Kruskal-Wallis (anova)), Q value = 0.12
Table S51. Clustering Approach #6: 'METHLYATION CNMF' versus Clinical Feature #5: 'KARNOFSKY_PERFORMANCE_SCORE'
| nPatients | Mean (Std.Dev) | |
|---|---|---|
| ALL | 216 | 75.4 (15.3) |
| subtype1 | 53 | 78.5 (16.8) |
| subtype2 | 37 | 75.4 (17.4) |
| subtype3 | 61 | 71.1 (14.3) |
| subtype4 | 65 | 76.9 (13.1) |
Figure S45. Get High-res Image Clustering Approach #6: 'METHLYATION CNMF' versus Clinical Feature #5: 'KARNOFSKY_PERFORMANCE_SCORE'
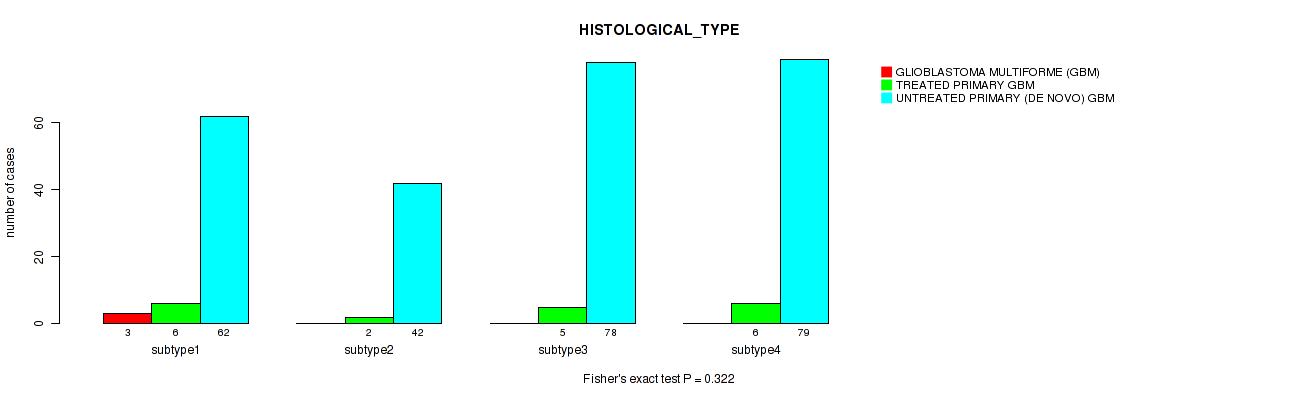
P value = 0.322 (Fisher's exact test), Q value = 0.6
Table S52. Clustering Approach #6: 'METHLYATION CNMF' versus Clinical Feature #6: 'HISTOLOGICAL_TYPE'
| nPatients | GLIOBLASTOMA MULTIFORME (GBM) | TREATED PRIMARY GBM | UNTREATED PRIMARY (DE NOVO) GBM |
|---|---|---|---|
| ALL | 3 | 19 | 261 |
| subtype1 | 3 | 6 | 62 |
| subtype2 | 0 | 2 | 42 |
| subtype3 | 0 | 5 | 78 |
| subtype4 | 0 | 6 | 79 |
Figure S46. Get High-res Image Clustering Approach #6: 'METHLYATION CNMF' versus Clinical Feature #6: 'HISTOLOGICAL_TYPE'
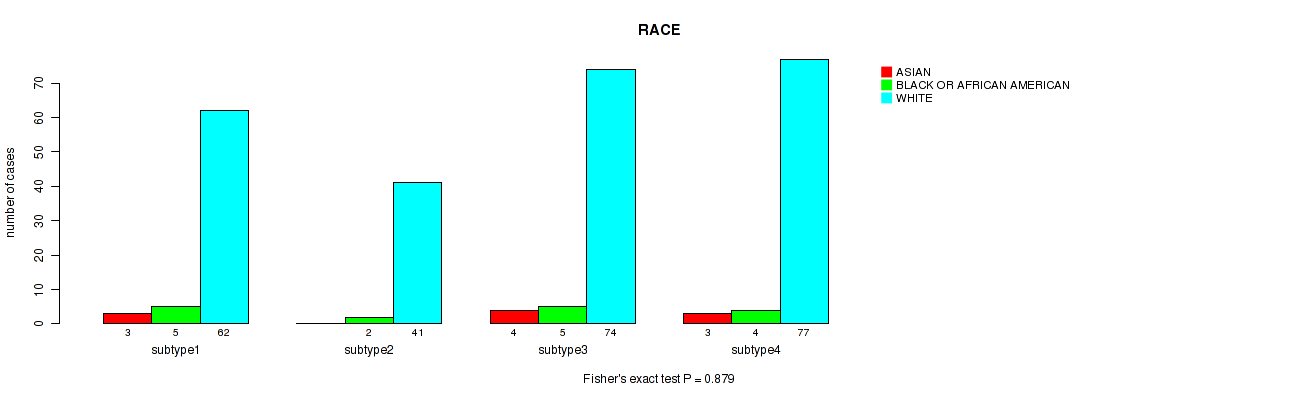
P value = 0.879 (Fisher's exact test), Q value = 0.95
Table S53. Clustering Approach #6: 'METHLYATION CNMF' versus Clinical Feature #7: 'RACE'
| nPatients | ASIAN | BLACK OR AFRICAN AMERICAN | WHITE |
|---|---|---|---|
| ALL | 10 | 16 | 254 |
| subtype1 | 3 | 5 | 62 |
| subtype2 | 0 | 2 | 41 |
| subtype3 | 4 | 5 | 74 |
| subtype4 | 3 | 4 | 77 |
Figure S47. Get High-res Image Clustering Approach #6: 'METHLYATION CNMF' versus Clinical Feature #7: 'RACE'
P value = 0.661 (Fisher's exact test), Q value = 0.87
Table S54. Clustering Approach #6: 'METHLYATION CNMF' versus Clinical Feature #8: 'ETHNICITY'
| nPatients | HISPANIC OR LATINO | NOT HISPANIC OR LATINO |
|---|---|---|
| ALL | 7 | 232 |
| subtype1 | 3 | 62 |
| subtype2 | 0 | 38 |
| subtype3 | 2 | 66 |
| subtype4 | 2 | 66 |
Figure S48. Get High-res Image Clustering Approach #6: 'METHLYATION CNMF' versus Clinical Feature #8: 'ETHNICITY'
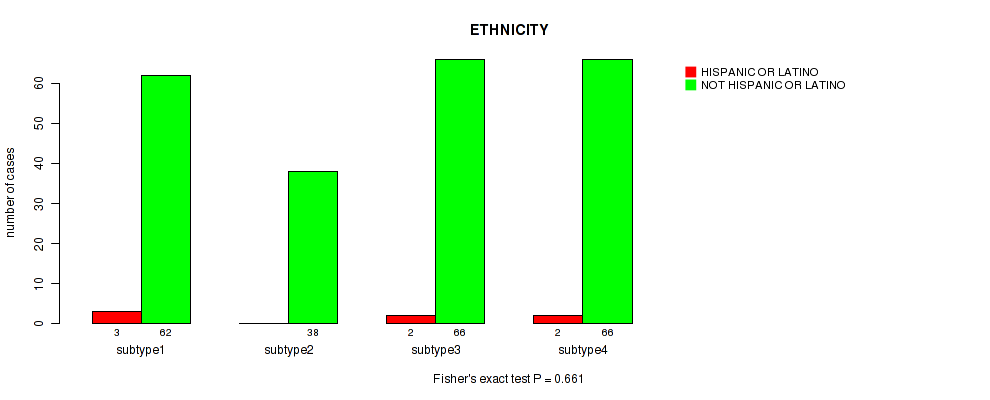
Table S55. Description of clustering approach #7: 'RPPA CNMF subtypes'
| Cluster Labels | 1 | 2 | 3 | 4 | 5 |
|---|---|---|---|---|---|
| Number of samples | 46 | 61 | 46 | 31 | 48 |
P value = 0.655 (logrank test), Q value = 0.87
Table S56. Clustering Approach #7: 'RPPA CNMF subtypes' versus Clinical Feature #1: 'Time to Death'
| nPatients | nDeath | Duration Range (Median), Month | |
|---|---|---|---|
| ALL | 230 | 171 | 0.1 - 120.6 (10.7) |
| subtype1 | 46 | 35 | 0.2 - 47.6 (9.1) |
| subtype2 | 61 | 49 | 0.1 - 53.2 (12.5) |
| subtype3 | 45 | 32 | 0.5 - 115.9 (8.3) |
| subtype4 | 31 | 22 | 0.2 - 43.5 (9.5) |
| subtype5 | 47 | 33 | 0.1 - 120.6 (12.1) |
Figure S49. Get High-res Image Clustering Approach #7: 'RPPA CNMF subtypes' versus Clinical Feature #1: 'Time to Death'
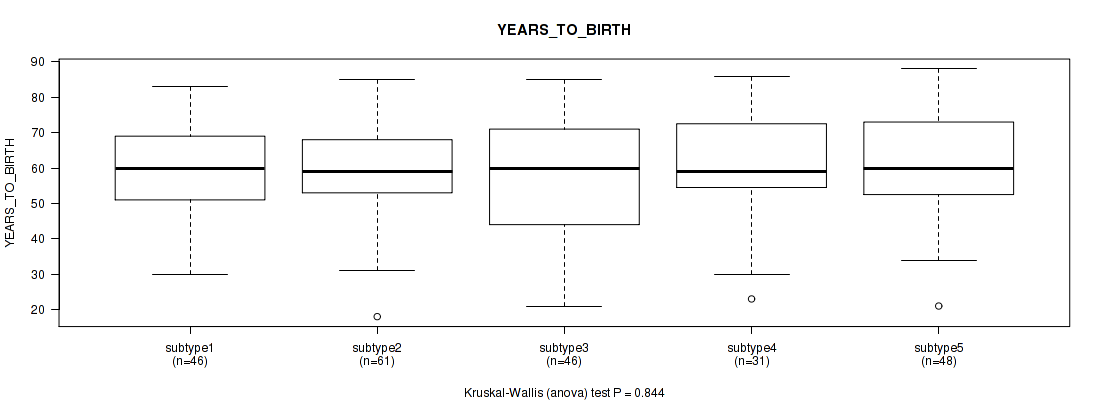
P value = 0.844 (Kruskal-Wallis (anova)), Q value = 0.92
Table S57. Clustering Approach #7: 'RPPA CNMF subtypes' versus Clinical Feature #2: 'YEARS_TO_BIRTH'
| nPatients | Mean (Std.Dev) | |
|---|---|---|
| ALL | 232 | 59.5 (14.3) |
| subtype1 | 46 | 59.4 (12.9) |
| subtype2 | 61 | 59.7 (13.0) |
| subtype3 | 46 | 56.9 (17.3) |
| subtype4 | 31 | 60.5 (15.1) |
| subtype5 | 48 | 61.4 (13.5) |
Figure S50. Get High-res Image Clustering Approach #7: 'RPPA CNMF subtypes' versus Clinical Feature #2: 'YEARS_TO_BIRTH'
P value = 0.048 (Fisher's exact test), Q value = 0.24
Table S58. Clustering Approach #7: 'RPPA CNMF subtypes' versus Clinical Feature #3: 'GENDER'
| nPatients | FEMALE | MALE |
|---|---|---|
| ALL | 92 | 140 |
| subtype1 | 13 | 33 |
| subtype2 | 19 | 42 |
| subtype3 | 19 | 27 |
| subtype4 | 15 | 16 |
| subtype5 | 26 | 22 |
Figure S51. Get High-res Image Clustering Approach #7: 'RPPA CNMF subtypes' versus Clinical Feature #3: 'GENDER'
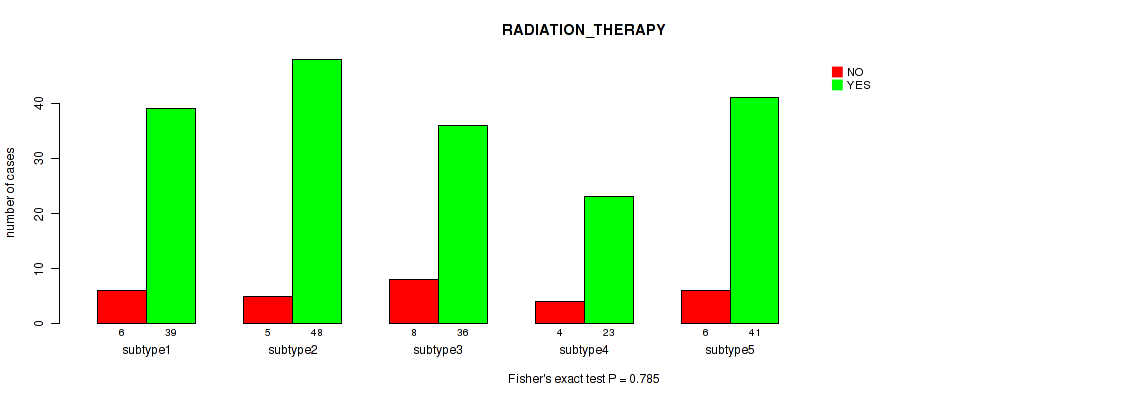
P value = 0.785 (Fisher's exact test), Q value = 0.89
Table S59. Clustering Approach #7: 'RPPA CNMF subtypes' versus Clinical Feature #4: 'RADIATION_THERAPY'
| nPatients | NO | YES |
|---|---|---|
| ALL | 29 | 187 |
| subtype1 | 6 | 39 |
| subtype2 | 5 | 48 |
| subtype3 | 8 | 36 |
| subtype4 | 4 | 23 |
| subtype5 | 6 | 41 |
Figure S52. Get High-res Image Clustering Approach #7: 'RPPA CNMF subtypes' versus Clinical Feature #4: 'RADIATION_THERAPY'
P value = 0.954 (Kruskal-Wallis (anova)), Q value = 0.98
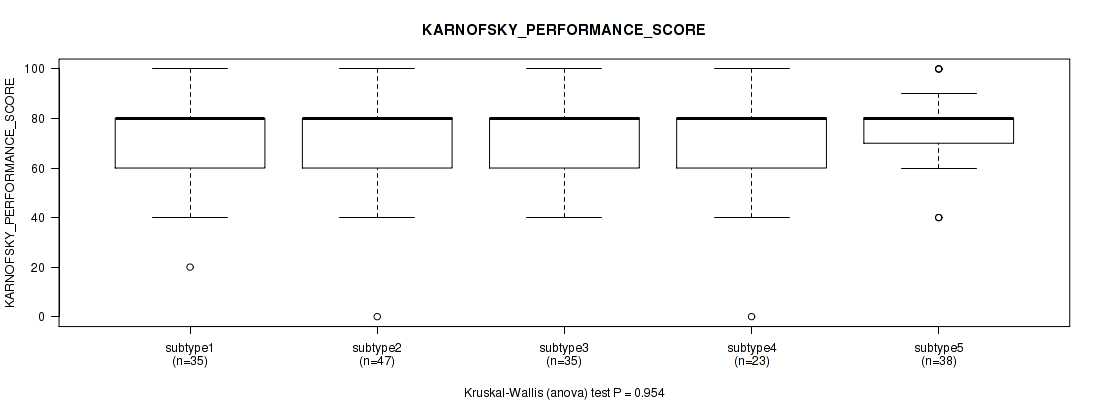
Table S60. Clustering Approach #7: 'RPPA CNMF subtypes' versus Clinical Feature #5: 'KARNOFSKY_PERFORMANCE_SCORE'
| nPatients | Mean (Std.Dev) | |
|---|---|---|
| ALL | 178 | 74.6 (17.6) |
| subtype1 | 35 | 74.0 (20.3) |
| subtype2 | 47 | 73.8 (16.5) |
| subtype3 | 35 | 75.7 (17.7) |
| subtype4 | 23 | 72.6 (22.2) |
| subtype5 | 38 | 76.3 (13.4) |
Figure S53. Get High-res Image Clustering Approach #7: 'RPPA CNMF subtypes' versus Clinical Feature #5: 'KARNOFSKY_PERFORMANCE_SCORE'
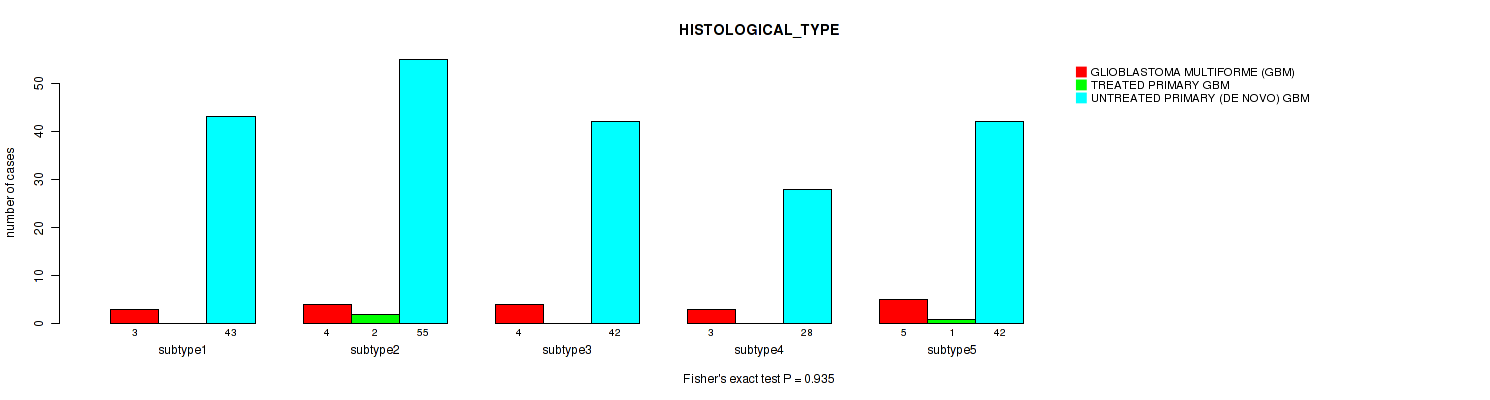
P value = 0.935 (Fisher's exact test), Q value = 0.98
Table S61. Clustering Approach #7: 'RPPA CNMF subtypes' versus Clinical Feature #6: 'HISTOLOGICAL_TYPE'
| nPatients | GLIOBLASTOMA MULTIFORME (GBM) | TREATED PRIMARY GBM | UNTREATED PRIMARY (DE NOVO) GBM |
|---|---|---|---|
| ALL | 19 | 3 | 210 |
| subtype1 | 3 | 0 | 43 |
| subtype2 | 4 | 2 | 55 |
| subtype3 | 4 | 0 | 42 |
| subtype4 | 3 | 0 | 28 |
| subtype5 | 5 | 1 | 42 |
Figure S54. Get High-res Image Clustering Approach #7: 'RPPA CNMF subtypes' versus Clinical Feature #6: 'HISTOLOGICAL_TYPE'
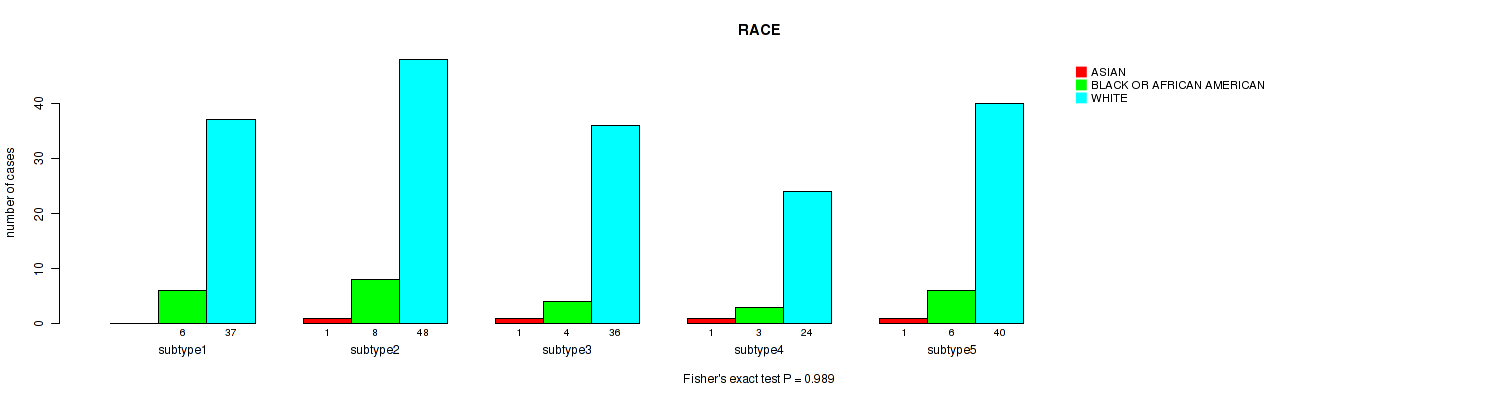
P value = 0.989 (Fisher's exact test), Q value = 1
Table S62. Clustering Approach #7: 'RPPA CNMF subtypes' versus Clinical Feature #7: 'RACE'
| nPatients | ASIAN | BLACK OR AFRICAN AMERICAN | WHITE |
|---|---|---|---|
| ALL | 4 | 27 | 185 |
| subtype1 | 0 | 6 | 37 |
| subtype2 | 1 | 8 | 48 |
| subtype3 | 1 | 4 | 36 |
| subtype4 | 1 | 3 | 24 |
| subtype5 | 1 | 6 | 40 |
Figure S55. Get High-res Image Clustering Approach #7: 'RPPA CNMF subtypes' versus Clinical Feature #7: 'RACE'
P value = 0.627 (Fisher's exact test), Q value = 0.87
Table S63. Clustering Approach #7: 'RPPA CNMF subtypes' versus Clinical Feature #8: 'ETHNICITY'
| nPatients | HISPANIC OR LATINO | NOT HISPANIC OR LATINO |
|---|---|---|
| ALL | 3 | 196 |
| subtype1 | 1 | 40 |
| subtype2 | 2 | 49 |
| subtype3 | 0 | 40 |
| subtype4 | 0 | 26 |
| subtype5 | 0 | 41 |
Figure S56. Get High-res Image Clustering Approach #7: 'RPPA CNMF subtypes' versus Clinical Feature #8: 'ETHNICITY'
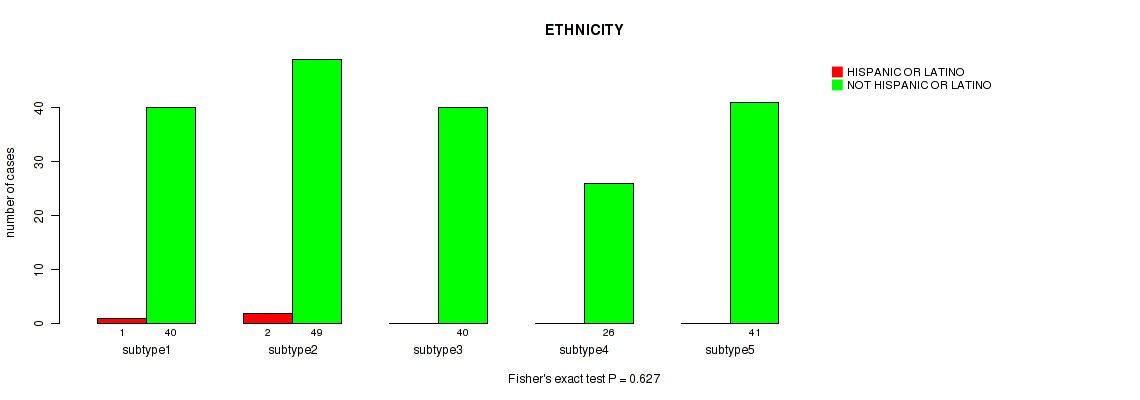
Table S64. Description of clustering approach #8: 'RPPA cHierClus subtypes'
| Cluster Labels | 1 | 2 | 3 |
|---|---|---|---|
| Number of samples | 94 | 77 | 61 |
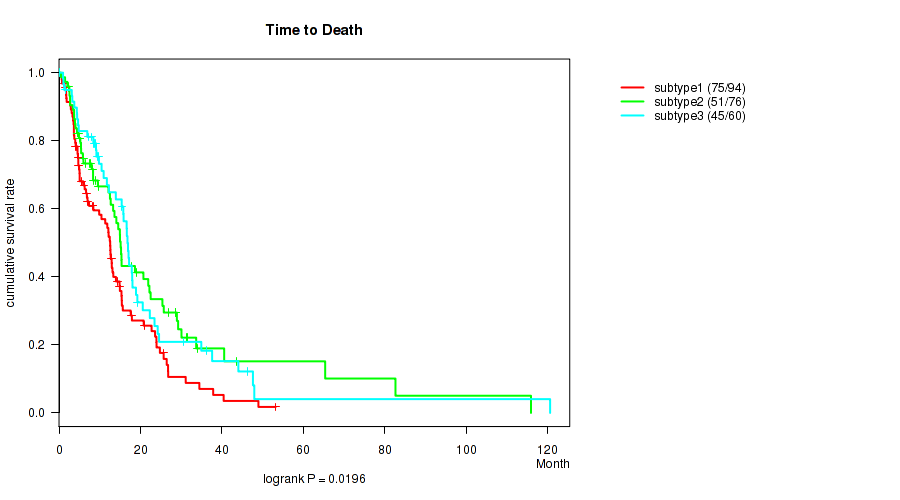
P value = 0.0196 (logrank test), Q value = 0.14
Table S65. Clustering Approach #8: 'RPPA cHierClus subtypes' versus Clinical Feature #1: 'Time to Death'
| nPatients | nDeath | Duration Range (Median), Month | |
|---|---|---|---|
| ALL | 230 | 171 | 0.1 - 120.6 (10.7) |
| subtype1 | 94 | 75 | 0.2 - 53.2 (8.4) |
| subtype2 | 76 | 51 | 0.1 - 115.9 (9.6) |
| subtype3 | 60 | 45 | 0.1 - 120.6 (14.7) |
Figure S57. Get High-res Image Clustering Approach #8: 'RPPA cHierClus subtypes' versus Clinical Feature #1: 'Time to Death'
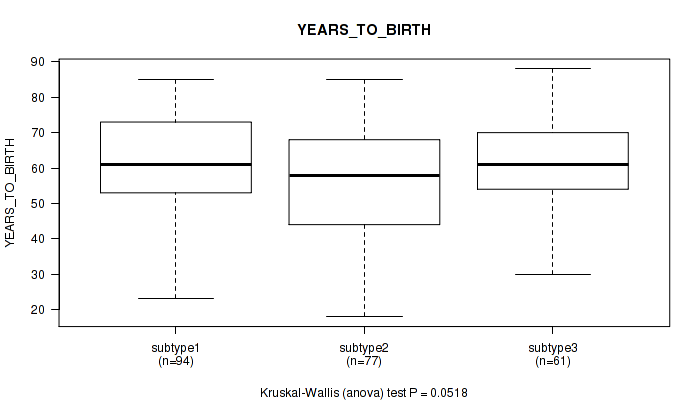
P value = 0.0518 (Kruskal-Wallis (anova)), Q value = 0.24
Table S66. Clustering Approach #8: 'RPPA cHierClus subtypes' versus Clinical Feature #2: 'YEARS_TO_BIRTH'
| nPatients | Mean (Std.Dev) | |
|---|---|---|
| ALL | 232 | 59.5 (14.3) |
| subtype1 | 94 | 61.3 (13.2) |
| subtype2 | 77 | 55.4 (16.7) |
| subtype3 | 61 | 62.1 (11.2) |
Figure S58. Get High-res Image Clustering Approach #8: 'RPPA cHierClus subtypes' versus Clinical Feature #2: 'YEARS_TO_BIRTH'
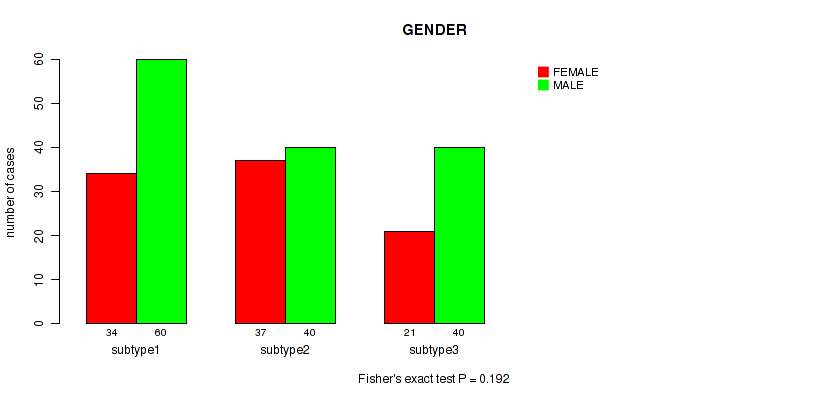
P value = 0.192 (Fisher's exact test), Q value = 0.43
Table S67. Clustering Approach #8: 'RPPA cHierClus subtypes' versus Clinical Feature #3: 'GENDER'
| nPatients | FEMALE | MALE |
|---|---|---|
| ALL | 92 | 140 |
| subtype1 | 34 | 60 |
| subtype2 | 37 | 40 |
| subtype3 | 21 | 40 |
Figure S59. Get High-res Image Clustering Approach #8: 'RPPA cHierClus subtypes' versus Clinical Feature #3: 'GENDER'
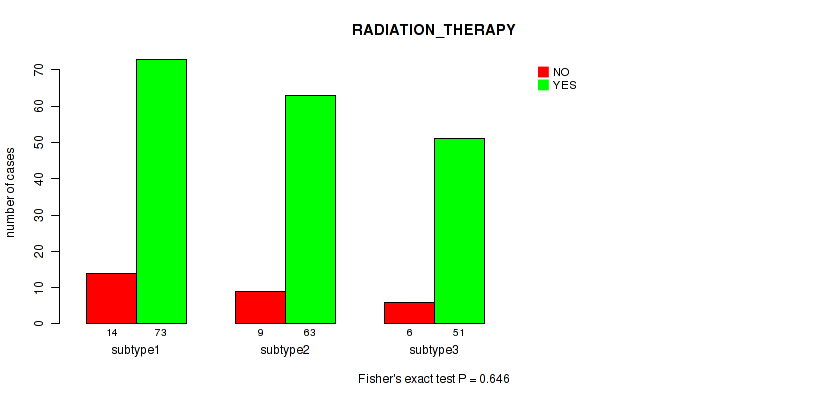
P value = 0.646 (Fisher's exact test), Q value = 0.87
Table S68. Clustering Approach #8: 'RPPA cHierClus subtypes' versus Clinical Feature #4: 'RADIATION_THERAPY'
| nPatients | NO | YES |
|---|---|---|
| ALL | 29 | 187 |
| subtype1 | 14 | 73 |
| subtype2 | 9 | 63 |
| subtype3 | 6 | 51 |
Figure S60. Get High-res Image Clustering Approach #8: 'RPPA cHierClus subtypes' versus Clinical Feature #4: 'RADIATION_THERAPY'
P value = 0.0779 (Kruskal-Wallis (anova)), Q value = 0.29
Table S69. Clustering Approach #8: 'RPPA cHierClus subtypes' versus Clinical Feature #5: 'KARNOFSKY_PERFORMANCE_SCORE'
| nPatients | Mean (Std.Dev) | |
|---|---|---|
| ALL | 178 | 74.6 (17.6) |
| subtype1 | 70 | 71.3 (19.0) |
| subtype2 | 62 | 77.3 (18.4) |
| subtype3 | 46 | 76.1 (13.4) |
Figure S61. Get High-res Image Clustering Approach #8: 'RPPA cHierClus subtypes' versus Clinical Feature #5: 'KARNOFSKY_PERFORMANCE_SCORE'
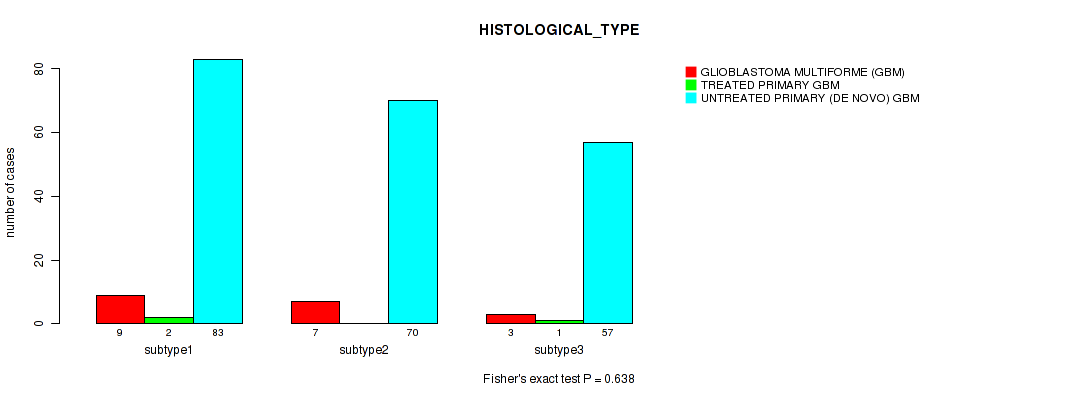
P value = 0.638 (Fisher's exact test), Q value = 0.87
Table S70. Clustering Approach #8: 'RPPA cHierClus subtypes' versus Clinical Feature #6: 'HISTOLOGICAL_TYPE'
| nPatients | GLIOBLASTOMA MULTIFORME (GBM) | TREATED PRIMARY GBM | UNTREATED PRIMARY (DE NOVO) GBM |
|---|---|---|---|
| ALL | 19 | 3 | 210 |
| subtype1 | 9 | 2 | 83 |
| subtype2 | 7 | 0 | 70 |
| subtype3 | 3 | 1 | 57 |
Figure S62. Get High-res Image Clustering Approach #8: 'RPPA cHierClus subtypes' versus Clinical Feature #6: 'HISTOLOGICAL_TYPE'
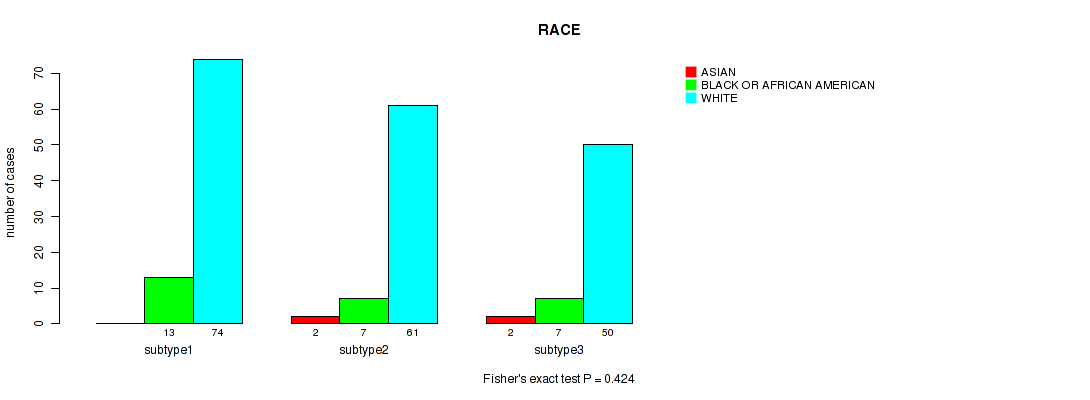
P value = 0.424 (Fisher's exact test), Q value = 0.75
Table S71. Clustering Approach #8: 'RPPA cHierClus subtypes' versus Clinical Feature #7: 'RACE'
| nPatients | ASIAN | BLACK OR AFRICAN AMERICAN | WHITE |
|---|---|---|---|
| ALL | 4 | 27 | 185 |
| subtype1 | 0 | 13 | 74 |
| subtype2 | 2 | 7 | 61 |
| subtype3 | 2 | 7 | 50 |
Figure S63. Get High-res Image Clustering Approach #8: 'RPPA cHierClus subtypes' versus Clinical Feature #7: 'RACE'
P value = 0.78 (Fisher's exact test), Q value = 0.89
Table S72. Clustering Approach #8: 'RPPA cHierClus subtypes' versus Clinical Feature #8: 'ETHNICITY'
| nPatients | HISPANIC OR LATINO | NOT HISPANIC OR LATINO |
|---|---|---|
| ALL | 3 | 196 |
| subtype1 | 2 | 76 |
| subtype2 | 1 | 66 |
| subtype3 | 0 | 54 |
Figure S64. Get High-res Image Clustering Approach #8: 'RPPA cHierClus subtypes' versus Clinical Feature #8: 'ETHNICITY'
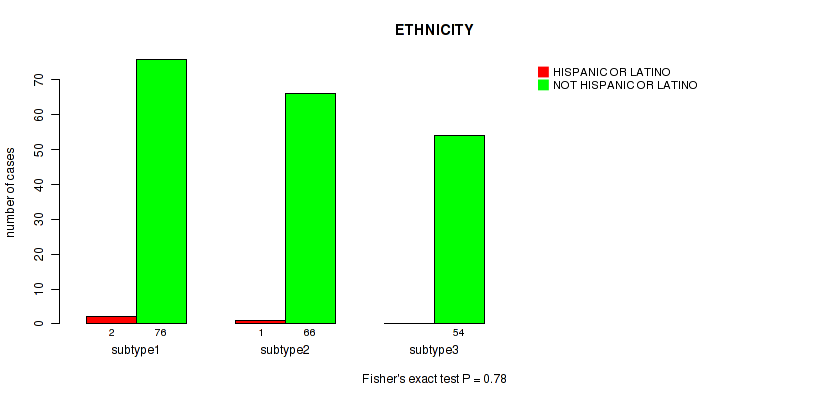
Table S73. Description of clustering approach #9: 'RNAseq CNMF subtypes'
| Cluster Labels | 1 | 2 | 3 |
|---|---|---|---|
| Number of samples | 48 | 71 | 33 |
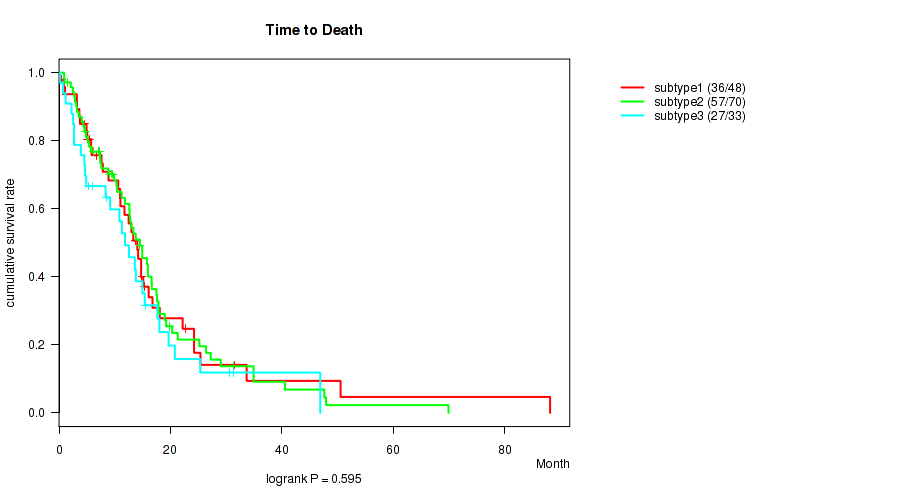
P value = 0.595 (logrank test), Q value = 0.87
Table S74. Clustering Approach #9: 'RNAseq CNMF subtypes' versus Clinical Feature #1: 'Time to Death'
| nPatients | nDeath | Duration Range (Median), Month | |
|---|---|---|---|
| ALL | 151 | 120 | 0.2 - 88.1 (11.3) |
| subtype1 | 48 | 36 | 0.2 - 88.1 (11.4) |
| subtype2 | 70 | 57 | 0.9 - 69.9 (12.2) |
| subtype3 | 33 | 27 | 0.2 - 46.9 (10.8) |
Figure S65. Get High-res Image Clustering Approach #9: 'RNAseq CNMF subtypes' versus Clinical Feature #1: 'Time to Death'
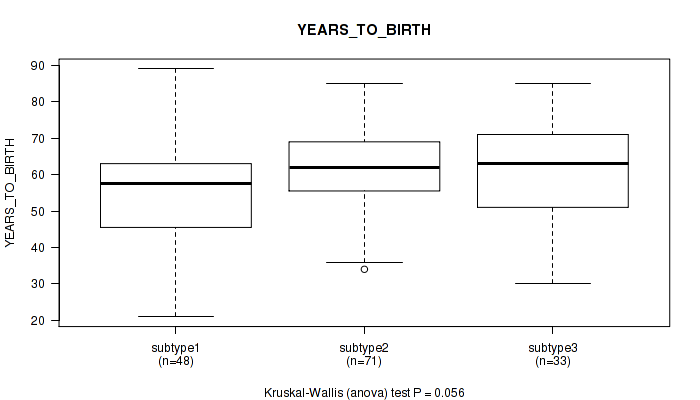
P value = 0.056 (Kruskal-Wallis (anova)), Q value = 0.24
Table S75. Clustering Approach #9: 'RNAseq CNMF subtypes' versus Clinical Feature #2: 'YEARS_TO_BIRTH'
| nPatients | Mean (Std.Dev) | |
|---|---|---|
| ALL | 152 | 59.7 (13.5) |
| subtype1 | 48 | 55.2 (16.7) |
| subtype2 | 71 | 62.1 (10.6) |
| subtype3 | 33 | 61.4 (12.9) |
Figure S66. Get High-res Image Clustering Approach #9: 'RNAseq CNMF subtypes' versus Clinical Feature #2: 'YEARS_TO_BIRTH'
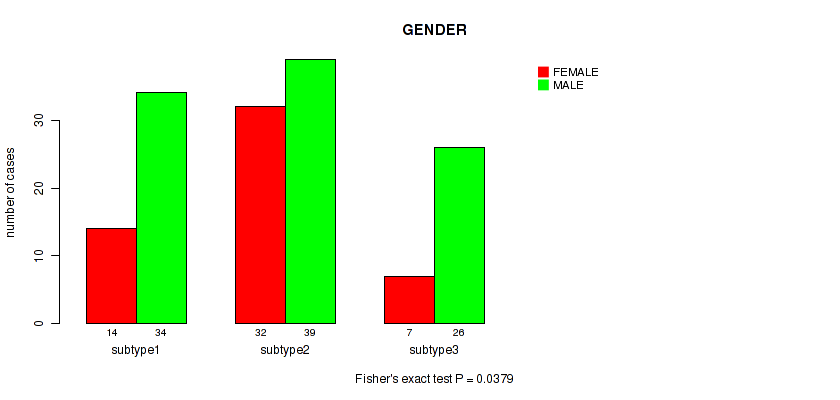
P value = 0.0379 (Fisher's exact test), Q value = 0.22
Table S76. Clustering Approach #9: 'RNAseq CNMF subtypes' versus Clinical Feature #3: 'GENDER'
| nPatients | FEMALE | MALE |
|---|---|---|
| ALL | 53 | 99 |
| subtype1 | 14 | 34 |
| subtype2 | 32 | 39 |
| subtype3 | 7 | 26 |
Figure S67. Get High-res Image Clustering Approach #9: 'RNAseq CNMF subtypes' versus Clinical Feature #3: 'GENDER'
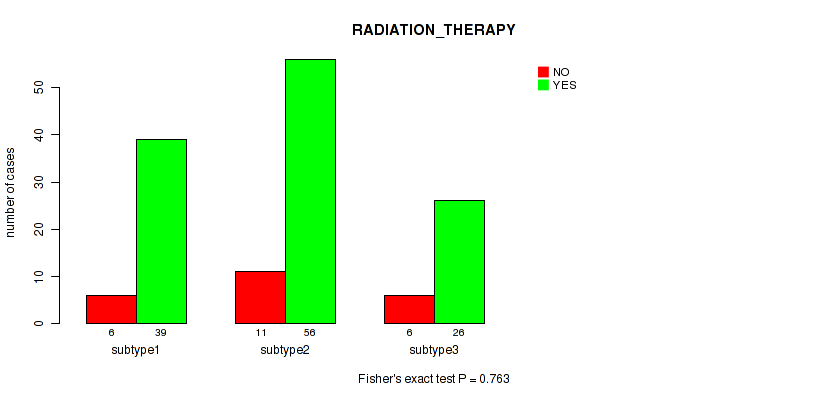
P value = 0.763 (Fisher's exact test), Q value = 0.89
Table S77. Clustering Approach #9: 'RNAseq CNMF subtypes' versus Clinical Feature #4: 'RADIATION_THERAPY'
| nPatients | NO | YES |
|---|---|---|
| ALL | 23 | 121 |
| subtype1 | 6 | 39 |
| subtype2 | 11 | 56 |
| subtype3 | 6 | 26 |
Figure S68. Get High-res Image Clustering Approach #9: 'RNAseq CNMF subtypes' versus Clinical Feature #4: 'RADIATION_THERAPY'
P value = 0.264 (Kruskal-Wallis (anova)), Q value = 0.52
Table S78. Clustering Approach #9: 'RNAseq CNMF subtypes' versus Clinical Feature #5: 'KARNOFSKY_PERFORMANCE_SCORE'
| nPatients | Mean (Std.Dev) | |
|---|---|---|
| ALL | 117 | 75.7 (14.8) |
| subtype1 | 39 | 75.1 (15.0) |
| subtype2 | 54 | 74.3 (13.8) |
| subtype3 | 24 | 80.0 (16.2) |
Figure S69. Get High-res Image Clustering Approach #9: 'RNAseq CNMF subtypes' versus Clinical Feature #5: 'KARNOFSKY_PERFORMANCE_SCORE'
P value = 0.783 (Fisher's exact test), Q value = 0.89
Table S79. Clustering Approach #9: 'RNAseq CNMF subtypes' versus Clinical Feature #6: 'HISTOLOGICAL_TYPE'
| nPatients | GLIOBLASTOMA MULTIFORME (GBM) | TREATED PRIMARY GBM | UNTREATED PRIMARY (DE NOVO) GBM |
|---|---|---|---|
| ALL | 1 | 1 | 150 |
| subtype1 | 1 | 0 | 47 |
| subtype2 | 0 | 1 | 70 |
| subtype3 | 0 | 0 | 33 |
Figure S70. Get High-res Image Clustering Approach #9: 'RNAseq CNMF subtypes' versus Clinical Feature #6: 'HISTOLOGICAL_TYPE'
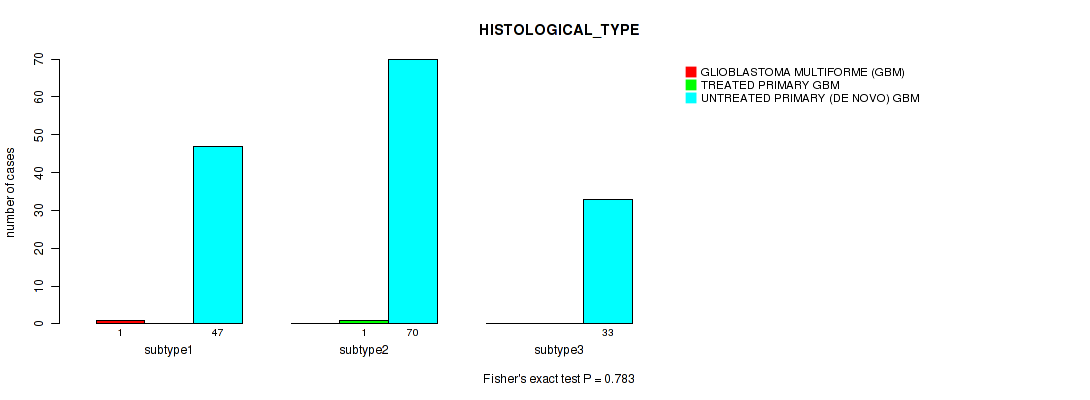
P value = 0.764 (Fisher's exact test), Q value = 0.89
Table S80. Clustering Approach #9: 'RNAseq CNMF subtypes' versus Clinical Feature #7: 'RACE'
| nPatients | ASIAN | BLACK OR AFRICAN AMERICAN | WHITE |
|---|---|---|---|
| ALL | 5 | 10 | 136 |
| subtype1 | 2 | 3 | 43 |
| subtype2 | 1 | 5 | 64 |
| subtype3 | 2 | 2 | 29 |
Figure S71. Get High-res Image Clustering Approach #9: 'RNAseq CNMF subtypes' versus Clinical Feature #7: 'RACE'
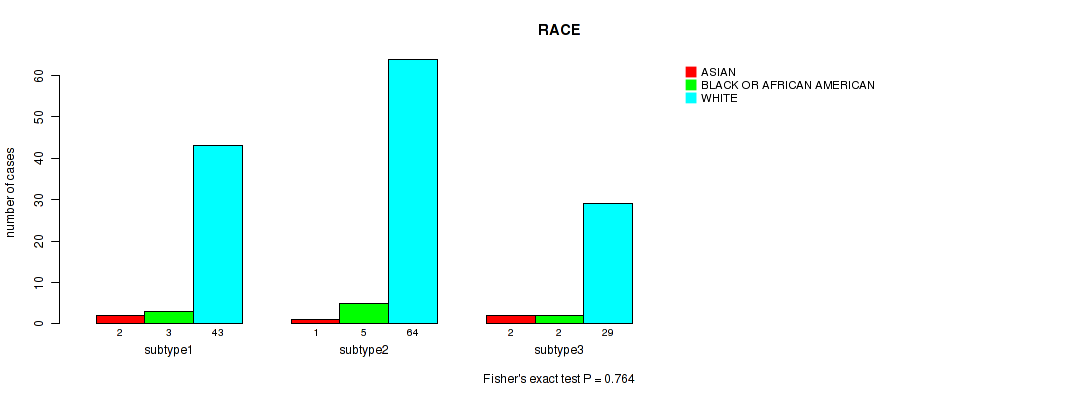
P value = 0.793 (Fisher's exact test), Q value = 0.89
Table S81. Clustering Approach #9: 'RNAseq CNMF subtypes' versus Clinical Feature #8: 'ETHNICITY'
| nPatients | HISPANIC OR LATINO | NOT HISPANIC OR LATINO |
|---|---|---|
| ALL | 3 | 125 |
| subtype1 | 1 | 45 |
| subtype2 | 2 | 51 |
| subtype3 | 0 | 29 |
Figure S72. Get High-res Image Clustering Approach #9: 'RNAseq CNMF subtypes' versus Clinical Feature #8: 'ETHNICITY'
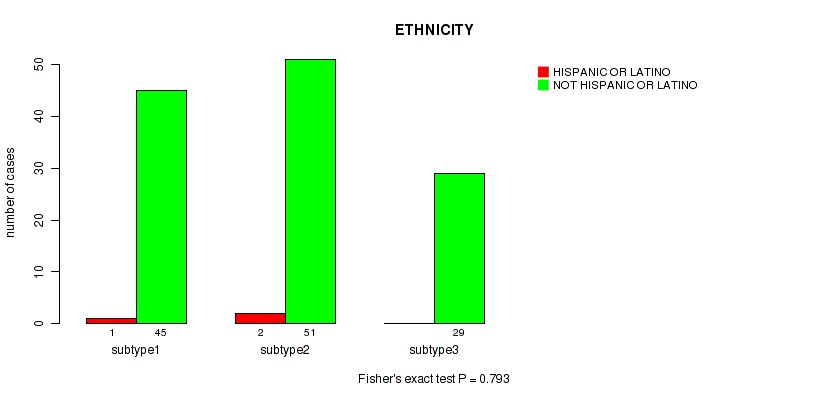
Table S82. Description of clustering approach #10: 'RNAseq cHierClus subtypes'
| Cluster Labels | 1 | 2 | 3 |
|---|---|---|---|
| Number of samples | 32 | 96 | 24 |
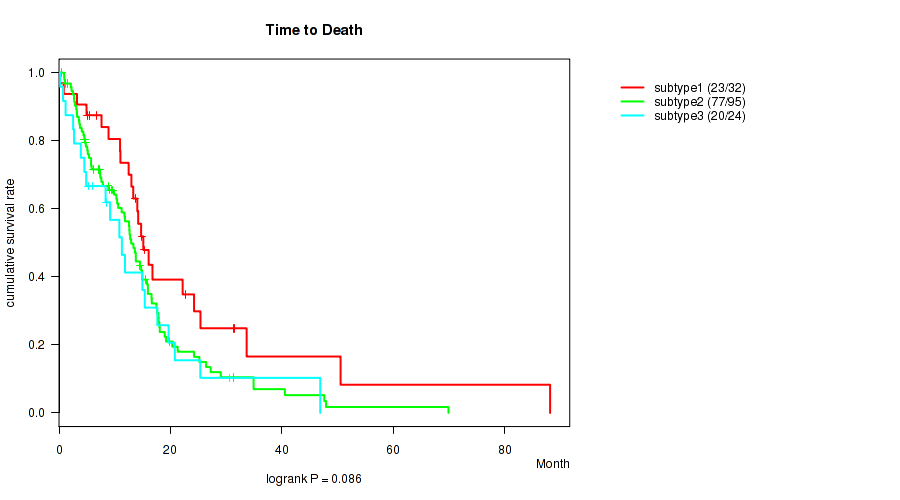
P value = 0.086 (logrank test), Q value = 0.3
Table S83. Clustering Approach #10: 'RNAseq cHierClus subtypes' versus Clinical Feature #1: 'Time to Death'
| nPatients | nDeath | Duration Range (Median), Month | |
|---|---|---|---|
| ALL | 151 | 120 | 0.2 - 88.1 (11.3) |
| subtype1 | 32 | 23 | 0.2 - 88.1 (14.1) |
| subtype2 | 95 | 77 | 0.4 - 69.9 (10.4) |
| subtype3 | 24 | 20 | 0.2 - 46.9 (8.9) |
Figure S73. Get High-res Image Clustering Approach #10: 'RNAseq cHierClus subtypes' versus Clinical Feature #1: 'Time to Death'
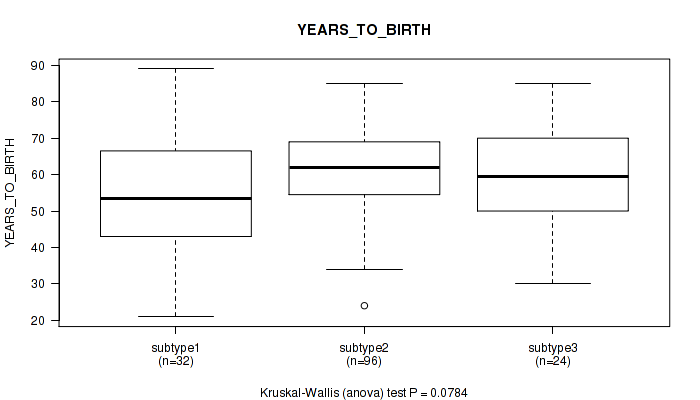
P value = 0.0784 (Kruskal-Wallis (anova)), Q value = 0.29
Table S84. Clustering Approach #10: 'RNAseq cHierClus subtypes' versus Clinical Feature #2: 'YEARS_TO_BIRTH'
| nPatients | Mean (Std.Dev) | |
|---|---|---|
| ALL | 152 | 59.7 (13.5) |
| subtype1 | 32 | 54.2 (18.3) |
| subtype2 | 96 | 61.6 (11.4) |
| subtype3 | 24 | 59.6 (12.5) |
Figure S74. Get High-res Image Clustering Approach #10: 'RNAseq cHierClus subtypes' versus Clinical Feature #2: 'YEARS_TO_BIRTH'
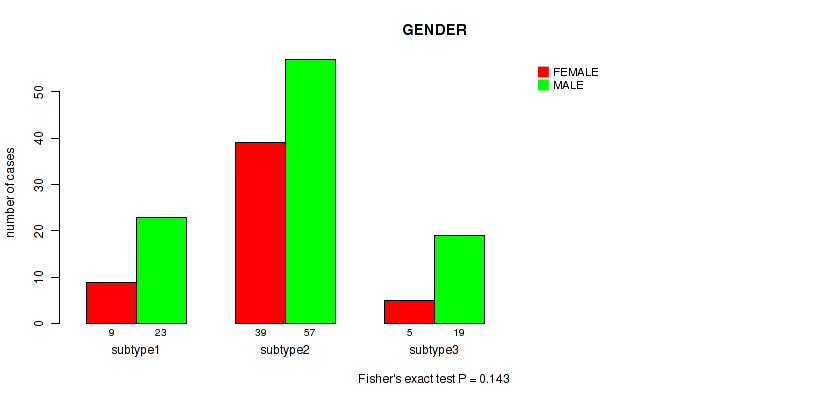
P value = 0.143 (Fisher's exact test), Q value = 0.37
Table S85. Clustering Approach #10: 'RNAseq cHierClus subtypes' versus Clinical Feature #3: 'GENDER'
| nPatients | FEMALE | MALE |
|---|---|---|
| ALL | 53 | 99 |
| subtype1 | 9 | 23 |
| subtype2 | 39 | 57 |
| subtype3 | 5 | 19 |
Figure S75. Get High-res Image Clustering Approach #10: 'RNAseq cHierClus subtypes' versus Clinical Feature #3: 'GENDER'
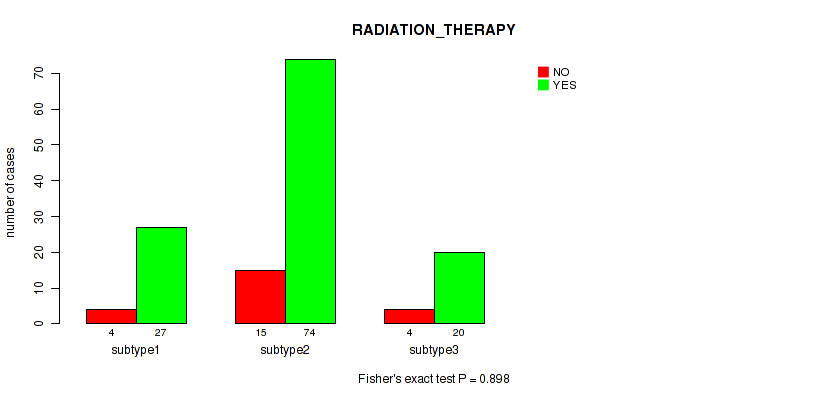
P value = 0.898 (Fisher's exact test), Q value = 0.96
Table S86. Clustering Approach #10: 'RNAseq cHierClus subtypes' versus Clinical Feature #4: 'RADIATION_THERAPY'
| nPatients | NO | YES |
|---|---|---|
| ALL | 23 | 121 |
| subtype1 | 4 | 27 |
| subtype2 | 15 | 74 |
| subtype3 | 4 | 20 |
Figure S76. Get High-res Image Clustering Approach #10: 'RNAseq cHierClus subtypes' versus Clinical Feature #4: 'RADIATION_THERAPY'
P value = 0.0366 (Kruskal-Wallis (anova)), Q value = 0.22
Table S87. Clustering Approach #10: 'RNAseq cHierClus subtypes' versus Clinical Feature #5: 'KARNOFSKY_PERFORMANCE_SCORE'
| nPatients | Mean (Std.Dev) | |
|---|---|---|
| ALL | 117 | 75.7 (14.8) |
| subtype1 | 26 | 78.1 (11.7) |
| subtype2 | 75 | 73.3 (14.6) |
| subtype3 | 16 | 83.1 (17.4) |
Figure S77. Get High-res Image Clustering Approach #10: 'RNAseq cHierClus subtypes' versus Clinical Feature #5: 'KARNOFSKY_PERFORMANCE_SCORE'
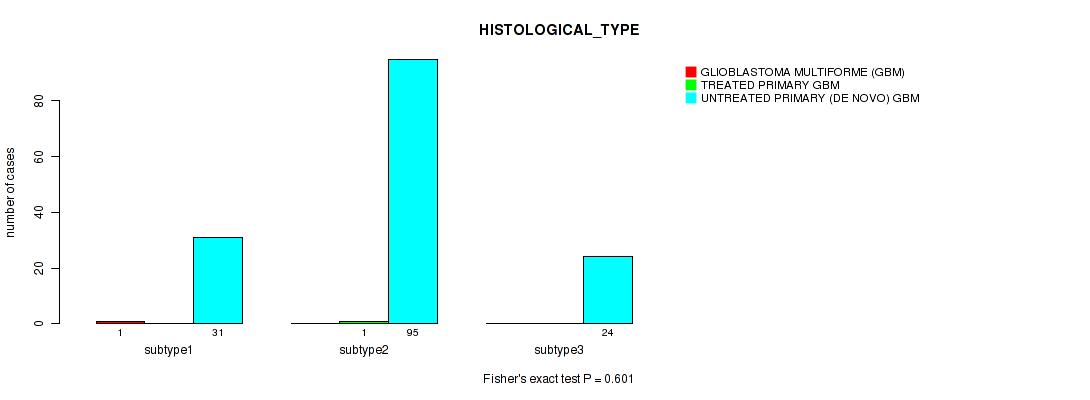
P value = 0.601 (Fisher's exact test), Q value = 0.87
Table S88. Clustering Approach #10: 'RNAseq cHierClus subtypes' versus Clinical Feature #6: 'HISTOLOGICAL_TYPE'
| nPatients | GLIOBLASTOMA MULTIFORME (GBM) | TREATED PRIMARY GBM | UNTREATED PRIMARY (DE NOVO) GBM |
|---|---|---|---|
| ALL | 1 | 1 | 150 |
| subtype1 | 1 | 0 | 31 |
| subtype2 | 0 | 1 | 95 |
| subtype3 | 0 | 0 | 24 |
Figure S78. Get High-res Image Clustering Approach #10: 'RNAseq cHierClus subtypes' versus Clinical Feature #6: 'HISTOLOGICAL_TYPE'
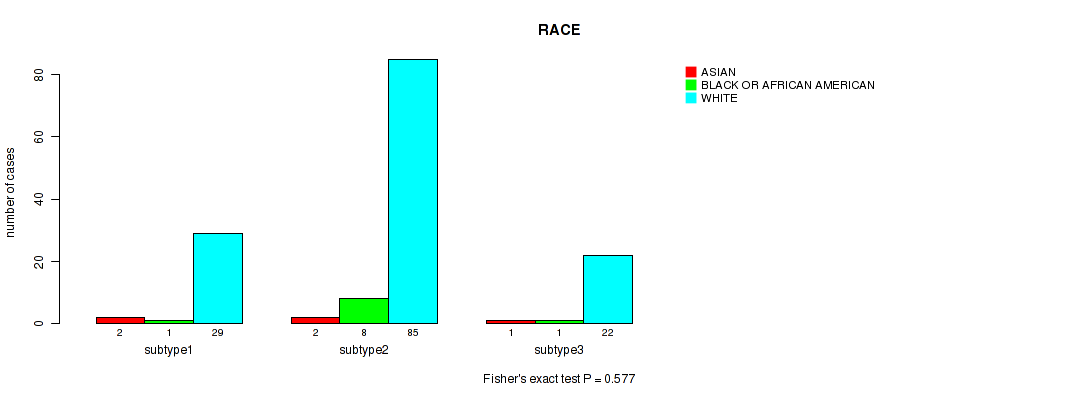
P value = 0.577 (Fisher's exact test), Q value = 0.87
Table S89. Clustering Approach #10: 'RNAseq cHierClus subtypes' versus Clinical Feature #7: 'RACE'
| nPatients | ASIAN | BLACK OR AFRICAN AMERICAN | WHITE |
|---|---|---|---|
| ALL | 5 | 10 | 136 |
| subtype1 | 2 | 1 | 29 |
| subtype2 | 2 | 8 | 85 |
| subtype3 | 1 | 1 | 22 |
Figure S79. Get High-res Image Clustering Approach #10: 'RNAseq cHierClus subtypes' versus Clinical Feature #7: 'RACE'
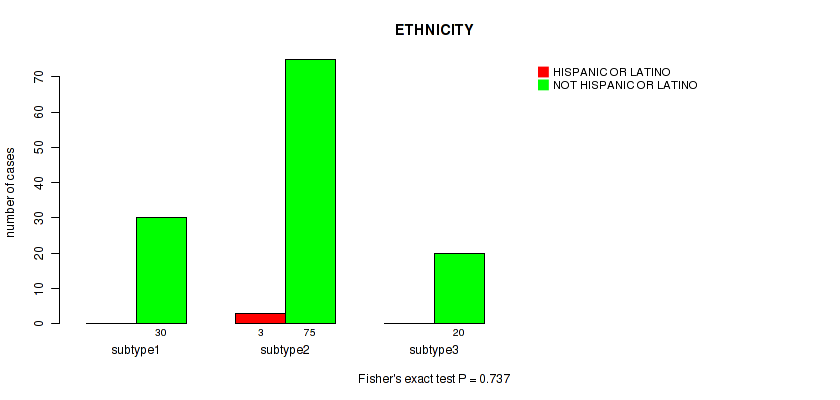
P value = 0.737 (Fisher's exact test), Q value = 0.89
Table S90. Clustering Approach #10: 'RNAseq cHierClus subtypes' versus Clinical Feature #8: 'ETHNICITY'
| nPatients | HISPANIC OR LATINO | NOT HISPANIC OR LATINO |
|---|---|---|
| ALL | 3 | 125 |
| subtype1 | 0 | 30 |
| subtype2 | 3 | 75 |
| subtype3 | 0 | 20 |
Figure S80. Get High-res Image Clustering Approach #10: 'RNAseq cHierClus subtypes' versus Clinical Feature #8: 'ETHNICITY'
-
Cluster data file = /xchip/cga/gdac-prod/tcga-gdac/jobResults/GDAC_mergedClustering/GBM-TP/22555065/GBM-TP.mergedcluster.txt
-
Clinical data file = /xchip/cga/gdac-prod/tcga-gdac/jobResults/Append_Data/GBM-TP/22506586/GBM-TP.merged_data.txt
-
Number of patients = 595
-
Number of clustering approaches = 10
-
Number of selected clinical features = 8
-
Exclude small clusters that include fewer than K patients, K = 3
consensus non-negative matrix factorization clustering approach (Brunet et al. 2004)
Resampling-based clustering method (Monti et al. 2003)
For survival clinical features, the Kaplan-Meier survival curves of tumors with and without gene mutations were plotted and the statistical significance P values were estimated by logrank test (Bland and Altman 2004) using the 'survdiff' function in R
For binary clinical features, two-tailed Fisher's exact tests (Fisher 1922) were used to estimate the P values using the 'fisher.test' function in R
For multiple hypothesis correction, Q value is the False Discovery Rate (FDR) analogue of the P value (Benjamini and Hochberg 1995), defined as the minimum FDR at which the test may be called significant. We used the 'Benjamini and Hochberg' method of 'p.adjust' function in R to convert P values into Q values.
In addition to the links below, the full results of the analysis summarized in this report can also be downloaded programmatically using firehose_get, or interactively from either the Broad GDAC website or TCGA Data Coordination Center Portal.