This pipeline computes the correlation between significantly recurrent gene mutations and selected clinical features.
Testing the association between mutation status of 36 genes and 8 clinical features across 280 patients, 5 significant findings detected with Q value < 0.25.
-
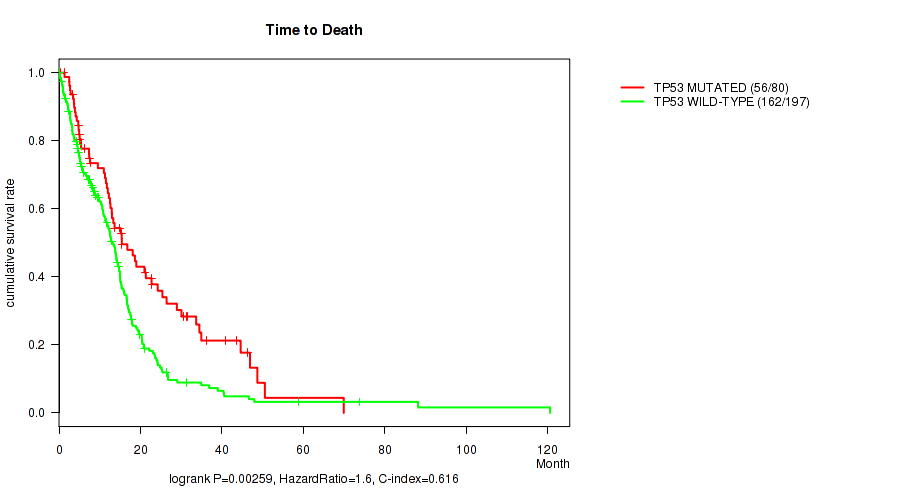
TP53 mutation correlated to 'Time to Death'.
-
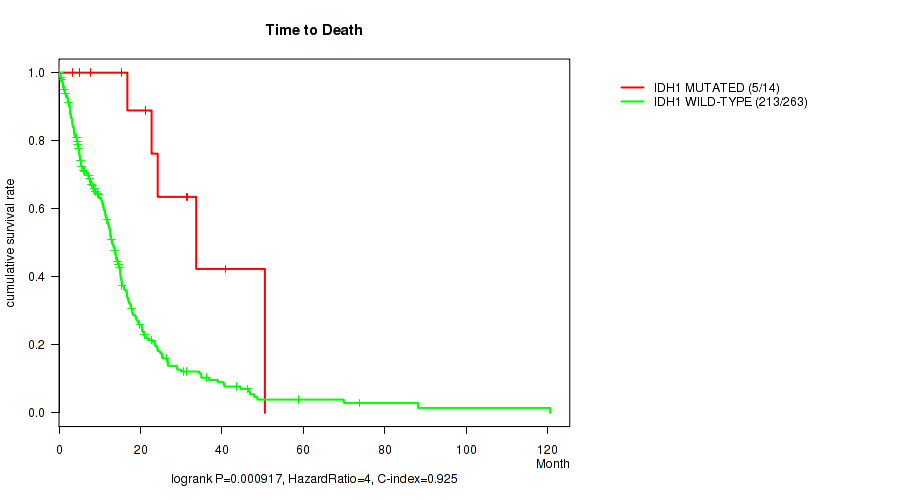
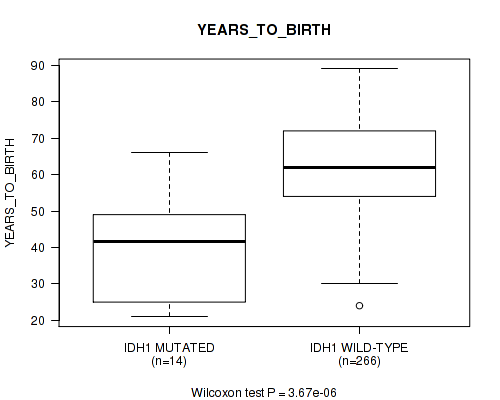
IDH1 mutation correlated to 'Time to Death' and 'YEARS_TO_BIRTH'.
-
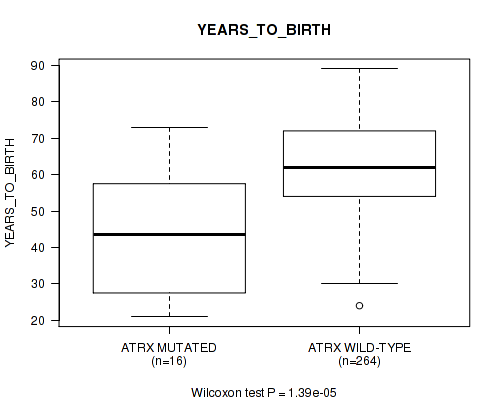
ATRX mutation correlated to 'YEARS_TO_BIRTH'.
-
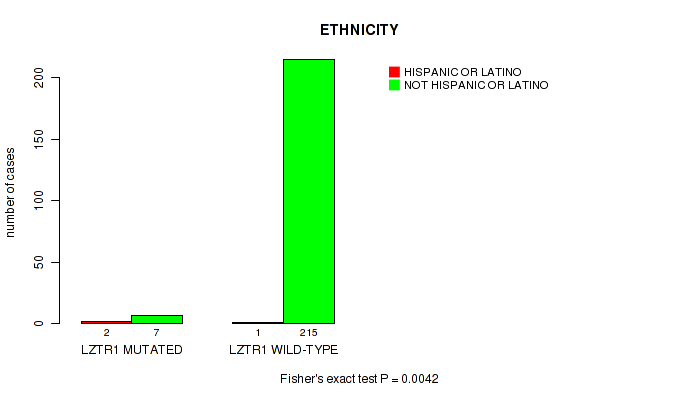
LZTR1 mutation correlated to 'ETHNICITY'.
Table 1. Get Full Table Overview of the association between mutation status of 36 genes and 8 clinical features. Shown in the table are P values (Q values). Thresholded by Q value < 0.25, 5 significant findings detected.
|
Clinical Features |
Time to Death |
YEARS TO BIRTH |
GENDER |
RADIATION THERAPY |
KARNOFSKY PERFORMANCE SCORE |
HISTOLOGICAL TYPE |
RACE | ETHNICITY | ||
| nMutated (%) | nWild-Type | logrank test | Wilcoxon-test | Fisher's exact test | Fisher's exact test | Wilcoxon-test | Fisher's exact test | Fisher's exact test | Fisher's exact test | |
| IDH1 | 14 (5%) | 266 |
0.000917 (0.088) |
3.67e-06 (0.00106) |
0.392 (1.00) |
0.139 (1.00) |
0.12 (1.00) |
0.547 (1.00) |
0.0268 (0.614) |
1 (1.00) |
| TP53 | 80 (29%) | 200 |
0.00259 (0.186) |
0.351 (1.00) |
0.41 (1.00) |
0.103 (1.00) |
0.2 (1.00) |
0.463 (1.00) |
0.603 (1.00) |
1 (1.00) |
| ATRX | 16 (6%) | 264 |
0.012 (0.43) |
1.39e-05 (0.00201) |
0.594 (1.00) |
0.746 (1.00) |
0.216 (1.00) |
0.596 (1.00) |
0.0334 (0.686) |
1 (1.00) |
| LZTR1 | 10 (4%) | 270 |
0.707 (1.00) |
0.244 (1.00) |
0.101 (1.00) |
0.148 (1.00) |
0.323 (1.00) |
0.182 (1.00) |
1 (1.00) |
0.0042 (0.242) |
| PIK3R1 | 32 (11%) | 248 |
0.783 (1.00) |
0.52 (1.00) |
0.434 (1.00) |
1 (1.00) |
0.693 (1.00) |
1 (1.00) |
0.572 (1.00) |
1 (1.00) |
| RB1 | 24 (9%) | 256 |
0.35 (1.00) |
0.831 (1.00) |
0.828 (1.00) |
1 (1.00) |
0.0943 (1.00) |
0.473 (1.00) |
0.611 (1.00) |
1 (1.00) |
| NF1 | 29 (10%) | 251 |
0.303 (1.00) |
0.145 (1.00) |
0.84 (1.00) |
0.591 (1.00) |
0.0747 (1.00) |
1 (1.00) |
1 (1.00) |
1 (1.00) |
| PTEN | 86 (31%) | 194 |
0.851 (1.00) |
0.308 (1.00) |
0.422 (1.00) |
0.0811 (1.00) |
0.895 (1.00) |
0.194 (1.00) |
1 (1.00) |
0.229 (1.00) |
| PIK3CA | 26 (9%) | 254 |
0.227 (1.00) |
0.987 (1.00) |
0.832 (1.00) |
0.586 (1.00) |
0.666 (1.00) |
1 (1.00) |
0.375 (1.00) |
1 (1.00) |
| STAG2 | 12 (4%) | 268 |
0.0101 (0.417) |
0.827 (1.00) |
0.761 (1.00) |
0.233 (1.00) |
0.123 (1.00) |
1 (1.00) |
0.608 (1.00) |
1 (1.00) |
| SLC26A3 | 7 (2%) | 273 |
0.997 (1.00) |
0.528 (1.00) |
0.428 (1.00) |
0.594 (1.00) |
0.459 (1.00) |
0.324 (1.00) |
1 (1.00) |
1 (1.00) |
| SEMG1 | 8 (3%) | 272 |
0.357 (1.00) |
0.181 (1.00) |
0.715 (1.00) |
1 (1.00) |
0.525 (1.00) |
1 (1.00) |
0.492 (1.00) |
1 (1.00) |
| KDR | 8 (3%) | 272 |
0.645 (1.00) |
0.518 (1.00) |
0.266 (1.00) |
0.632 (1.00) |
0.604 (1.00) |
0.358 (1.00) |
1 (1.00) |
1 (1.00) |
| RPL5 | 7 (2%) | 273 |
0.835 (1.00) |
0.822 (1.00) |
0.257 (1.00) |
0.61 (1.00) |
0.479 (1.00) |
1 (1.00) |
0.446 (1.00) |
1 (1.00) |
| MAP3K1 | 6 (2%) | 274 |
0.677 (1.00) |
0.308 (1.00) |
0.424 (1.00) |
1 (1.00) |
0.736 (1.00) |
1 (1.00) |
1 (1.00) |
1 (1.00) |
| BRAF | 6 (2%) | 274 |
0.24 (1.00) |
0.925 (1.00) |
1 (1.00) |
0.594 (1.00) |
0.711 (1.00) |
0.0359 (0.689) |
0.397 (1.00) |
1 (1.00) |
| EGFR | 73 (26%) | 207 |
0.865 (1.00) |
0.64 (1.00) |
0.258 (1.00) |
1 (1.00) |
0.434 (1.00) |
0.281 (1.00) |
0.31 (1.00) |
1 (1.00) |
| TMPRSS6 | 6 (2%) | 274 |
0.975 (1.00) |
0.282 (1.00) |
0.671 (1.00) |
1 (1.00) |
0.28 (1.00) |
1 (1.00) |
1 (1.00) |
1 (1.00) |
| PRKCD | 3 (1%) | 277 |
0.973 (1.00) |
0.121 (1.00) |
1 (1.00) |
0.44 (1.00) |
1 (1.00) |
0.223 (1.00) |
1 (1.00) |
|
| TP63 | 6 (2%) | 274 |
0.328 (1.00) |
0.992 (1.00) |
0.671 (1.00) |
1 (1.00) |
0.671 (1.00) |
1 (1.00) |
1 (1.00) |
0.0526 (0.937) |
| PDGFRA | 11 (4%) | 269 |
0.681 (1.00) |
0.0572 (0.937) |
1 (1.00) |
0.413 (1.00) |
0.14 (1.00) |
1 (1.00) |
1 (1.00) |
1 (1.00) |
| CHD8 | 8 (3%) | 272 |
0.904 (1.00) |
0.0231 (0.606) |
0.142 (1.00) |
0.354 (1.00) |
0.288 (1.00) |
1 (1.00) |
1 (1.00) |
1 (1.00) |
| IL4R | 8 (3%) | 272 |
0.153 (1.00) |
0.112 (1.00) |
0.0277 (0.614) |
0.354 (1.00) |
0.423 (1.00) |
1 (1.00) |
0.492 (1.00) |
1 (1.00) |
| REN | 5 (2%) | 275 |
0.778 (1.00) |
0.608 (1.00) |
0.657 (1.00) |
1 (1.00) |
0.347 (1.00) |
0.0833 (1.00) |
1 (1.00) |
1 (1.00) |
| CD209 | 5 (2%) | 275 |
0.686 (1.00) |
0.732 (1.00) |
0.0585 (0.937) |
1 (1.00) |
0.651 (1.00) |
1 (1.00) |
1 (1.00) |
1 (1.00) |
| FBN3 | 11 (4%) | 269 |
0.0915 (1.00) |
0.964 (1.00) |
0.533 (1.00) |
1 (1.00) |
0.915 (1.00) |
0.205 (1.00) |
0.605 (1.00) |
1 (1.00) |
| MMP13 | 5 (2%) | 275 |
0.674 (1.00) |
0.121 (1.00) |
0.657 (1.00) |
0.59 (1.00) |
0.0703 (1.00) |
1 (1.00) |
1 (1.00) |
1 (1.00) |
| TCF12 | 4 (1%) | 276 |
0.697 (1.00) |
0.739 (1.00) |
1 (1.00) |
1 (1.00) |
0.189 (1.00) |
0.2 (1.00) |
1 (1.00) |
1 (1.00) |
| ZDHHC4 | 3 (1%) | 277 |
0.758 (1.00) |
0.813 (1.00) |
0.296 (1.00) |
1 (1.00) |
0.153 (1.00) |
0.221 (1.00) |
1 (1.00) |
|
| IL18RAP | 6 (2%) | 274 |
0.727 (1.00) |
0.164 (1.00) |
0.671 (1.00) |
0.594 (1.00) |
0.205 (1.00) |
1 (1.00) |
0.396 (1.00) |
1 (1.00) |
| ODF4 | 3 (1%) | 277 |
0.34 (1.00) |
0.576 (1.00) |
1 (1.00) |
0.44 (1.00) |
1 (1.00) |
1 (1.00) |
1 (1.00) |
|
| KEL | 15 (5%) | 265 |
0.805 (1.00) |
0.562 (1.00) |
0.414 (1.00) |
0.476 (1.00) |
0.258 (1.00) |
1 (1.00) |
0.707 (1.00) |
1 (1.00) |
| TESK1 | 3 (1%) | 277 |
0.068 (1.00) |
1 (1.00) |
0.44 (1.00) |
1 (1.00) |
1 (1.00) |
1 (1.00) |
||
| MUC17 | 22 (8%) | 258 |
0.213 (1.00) |
0.391 (1.00) |
1 (1.00) |
0.76 (1.00) |
0.387 (1.00) |
0.717 (1.00) |
1 (1.00) |
1 (1.00) |
| FAM126B | 4 (1%) | 276 |
0.905 (1.00) |
0.693 (1.00) |
1 (1.00) |
1 (1.00) |
0.251 (1.00) |
1 (1.00) |
1 (1.00) |
1 (1.00) |
| DDX5 | 4 (1%) | 276 |
0.00657 (0.315) |
0.0215 (0.606) |
0.3 (1.00) |
0.44 (1.00) |
0.242 (1.00) |
0.0145 (0.464) |
1 (1.00) |
1 (1.00) |
P value = 0.00259 (logrank test), Q value = 0.19
Table S1. Gene #1: 'TP53 MUTATION STATUS' versus Clinical Feature #1: 'Time to Death'
| nPatients | nDeath | Duration Range (Median), Month | |
|---|---|---|---|
| ALL | 277 | 218 | 0.1 - 120.6 (11.5) |
| TP53 MUTATED | 80 | 56 | 0.4 - 69.9 (13.0) |
| TP53 WILD-TYPE | 197 | 162 | 0.1 - 120.6 (10.7) |
Figure S1. Get High-res Image Gene #1: 'TP53 MUTATION STATUS' versus Clinical Feature #1: 'Time to Death'
P value = 0.000917 (logrank test), Q value = 0.088
Table S2. Gene #6: 'IDH1 MUTATION STATUS' versus Clinical Feature #1: 'Time to Death'
| nPatients | nDeath | Duration Range (Median), Month | |
|---|---|---|---|
| ALL | 277 | 218 | 0.1 - 120.6 (11.5) |
| IDH1 MUTATED | 14 | 5 | 3.4 - 50.5 (21.9) |
| IDH1 WILD-TYPE | 263 | 213 | 0.1 - 120.6 (11.3) |
Figure S2. Get High-res Image Gene #6: 'IDH1 MUTATION STATUS' versus Clinical Feature #1: 'Time to Death'
P value = 3.67e-06 (Wilcoxon-test), Q value = 0.0011
Table S3. Gene #6: 'IDH1 MUTATION STATUS' versus Clinical Feature #2: 'YEARS_TO_BIRTH'
| nPatients | Mean (Std.Dev) | |
|---|---|---|
| ALL | 280 | 61.1 (13.0) |
| IDH1 MUTATED | 14 | 40.0 (15.1) |
| IDH1 WILD-TYPE | 266 | 62.2 (11.9) |
Figure S3. Get High-res Image Gene #6: 'IDH1 MUTATION STATUS' versus Clinical Feature #2: 'YEARS_TO_BIRTH'
P value = 1.39e-05 (Wilcoxon-test), Q value = 0.002
Table S4. Gene #13: 'ATRX MUTATION STATUS' versus Clinical Feature #2: 'YEARS_TO_BIRTH'
| nPatients | Mean (Std.Dev) | |
|---|---|---|
| ALL | 280 | 61.1 (13.0) |
| ATRX MUTATED | 16 | 42.7 (16.4) |
| ATRX WILD-TYPE | 264 | 62.2 (11.9) |
Figure S4. Get High-res Image Gene #13: 'ATRX MUTATION STATUS' versus Clinical Feature #2: 'YEARS_TO_BIRTH'
P value = 0.0042 (Fisher's exact test), Q value = 0.24
Table S5. Gene #28: 'LZTR1 MUTATION STATUS' versus Clinical Feature #8: 'ETHNICITY'
| nPatients | HISPANIC OR LATINO | NOT HISPANIC OR LATINO |
|---|---|---|
| ALL | 3 | 222 |
| LZTR1 MUTATED | 2 | 7 |
| LZTR1 WILD-TYPE | 1 | 215 |
Figure S5. Get High-res Image Gene #28: 'LZTR1 MUTATION STATUS' versus Clinical Feature #8: 'ETHNICITY'
-
Mutation data file = sample_sig_gene_table.txt from Mutsig_2CV pipeline
-
Processed Mutation data file = /xchip/cga/gdac-prod/tcga-gdac/jobResults/GDAC_Correlate_Genomic_Events_Preprocess/GBM-TP/22811914/transformed.cor.cli.txt
-
Clinical data file = /xchip/cga/gdac-prod/tcga-gdac/jobResults/Append_Data/GBM-TP/22506586/GBM-TP.merged_data.txt
-
Number of patients = 280
-
Number of significantly mutated genes = 36
-
Number of selected clinical features = 8
-
Exclude genes that fewer than K tumors have mutations, K = 3
For survival clinical features, the Kaplan-Meier survival curves of tumors with and without gene mutations were plotted and the statistical significance P values were estimated by logrank test (Bland and Altman 2004) using the 'survdiff' function in R
For binary or multi-class clinical features (nominal or ordinal), two-tailed Fisher's exact tests (Fisher 1922) were used to estimate the P values using the 'fisher.test' function in R
For multiple hypothesis correction, Q value is the False Discovery Rate (FDR) analogue of the P value (Benjamini and Hochberg 1995), defined as the minimum FDR at which the test may be called significant. We used the 'Benjamini and Hochberg' method of 'p.adjust' function in R to convert P values into Q values.
In addition to the links below, the full results of the analysis summarized in this report can also be downloaded programmatically using firehose_get, or interactively from either the Broad GDAC website or TCGA Data Coordination Center Portal.