This report serves to describe the mutational landscape and properties of a given individual set, as well as rank genes and genesets according to mutational significance. MutSig v2.0 was used to generate the results found in this report.
-
Working with individual set: GBM-TP
-
Number of patients in set: 283
The input for this pipeline is a set of individuals with the following files associated for each:
-
An annotated .maf file describing the mutations called for the respective individual, and their properties.
-
A .wig file that contains information about the coverage of the sample.
-
MAF used for this analysis:GBM-TP.final_analysis_set.maf
-
Blacklist used for this analysis: pancan_mutation_blacklist.v14.hg19.txt
-
Significantly mutated genes (q ≤ 0.1): 71
-
Mutations seen in COSMIC: 458
-
Significantly mutated genes in COSMIC territory: 70
-
Significantly mutated genesets: 122
-
Significantly mutated genesets: (excluding sig. mutated genes):0
-
Read 283 MAFs of type "maf1"
-
Total number of mutations in input MAFs: 21510
-
After removing 892 blacklisted mutations: 20618
-
After removing 536 noncoding mutations: 20082
-
Number of mutations before filtering: 20082
-
After removing 958 mutations outside gene set: 19124
-
After removing 11 mutations outside category set: 19113
Table 1. Get Full Table Table representing breakdown of mutations by type.
| type | count |
|---|---|
| De_novo_Start_InFrame | 9 |
| De_novo_Start_OutOfFrame | 22 |
| Frame_Shift_Del | 431 |
| Frame_Shift_Ins | 136 |
| In_Frame_Del | 125 |
| In_Frame_Ins | 19 |
| Missense_Mutation | 12215 |
| Nonsense_Mutation | 748 |
| Nonstop_Mutation | 10 |
| Silent | 4717 |
| Splice_Site | 672 |
| Start_Codon_SNP | 9 |
| Total | 19113 |
Table 2. Get Full Table A breakdown of mutation rates per category discovered for this individual set.
| category | n | N | rate | rate_per_mb | relative_rate | exp_ns_s_ratio |
|---|---|---|---|---|---|---|
| *CpG->T | 5042 | 471456280 | 0.000011 | 11 | 6.3 | 2.1 |
| *Cp(A/C/T)->T | 2178 | 3846173156 | 5.7e-07 | 0.57 | 0.33 | 1.7 |
| A->G | 1503 | 4141354039 | 3.6e-07 | 0.36 | 0.21 | 2.3 |
| transver | 3501 | 8458983475 | 4.1e-07 | 0.41 | 0.24 | 5 |
| indel+null | 2161 | 8458983475 | 2.6e-07 | 0.26 | 0.15 | NaN |
| double_null | 11 | 8458983475 | 1.3e-09 | 0.0013 | 0.00076 | NaN |
| Total | 14396 | 8458983475 | 1.7e-06 | 1.7 | 1 | 3.5 |
The x axis represents the samples. The y axis represents the exons, one row per exon, and they are sorted by average coverage across samples. For exons with exactly the same average coverage, they are sorted next by the %GC of the exon. (The secondary sort is especially useful for the zero-coverage exons at the bottom). If the figure is unpopulated, then full coverage is assumed (e.g. MutSig CV doesn't use WIGs and assumes full coverage).
Figure 1.
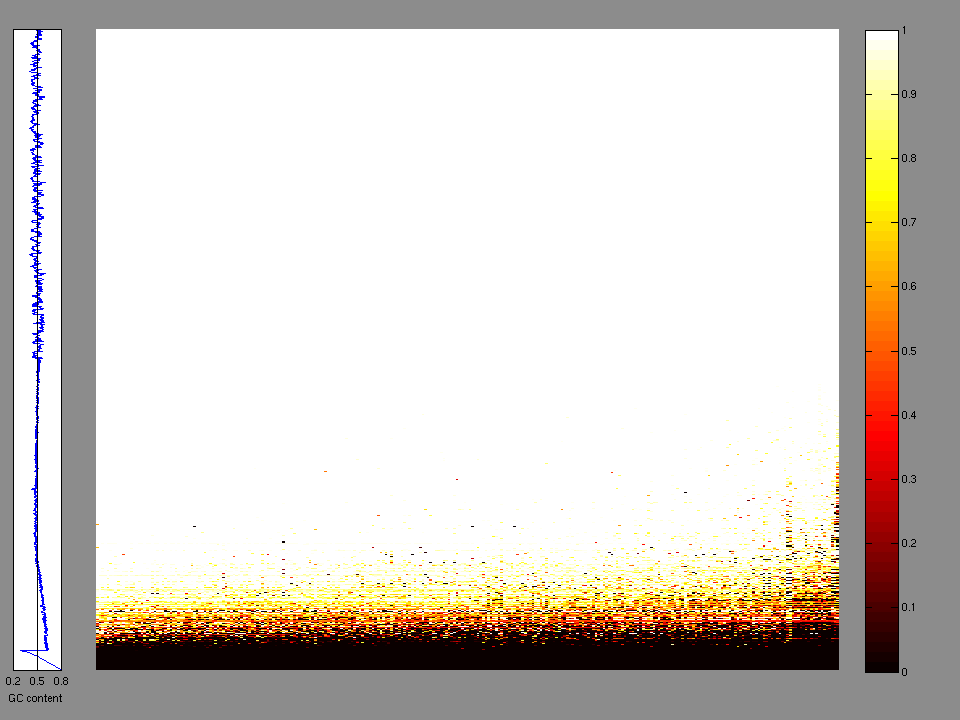
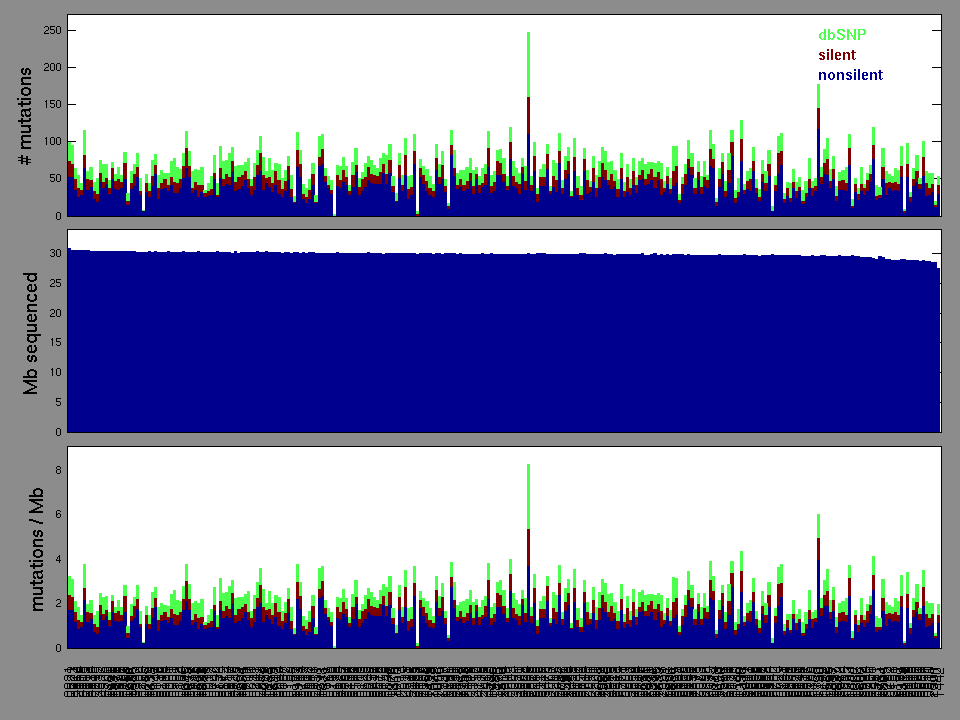
Figure 2. Patients counts and rates file used to generate this plot: GBM-TP.patients.counts_and_rates.txt
The mutation spectrum is depicted in the lego plots below in which the 96 possible mutation types are subdivided into six large blocks, color-coded to reflect the base substitution type. Each large block is further subdivided into the 16 possible pairs of 5' and 3' neighbors, as listed in the 4x4 trinucleotide context legend. The height of each block corresponds to the mutation frequency for that kind of mutation (counts of mutations normalized by the base coverage in a given bin). The shape of the spectrum is a signature for dominant mutational mechanisms in different tumor types.
Figure 3. Get High-res Image SNV Mutation rate lego plot for entire set. Each bin is normalized by base coverage for that bin. Colors represent the six SNV types on the upper right. The three-base context for each mutation is labeled in the 4x4 legend on the lower right. The fractional breakdown of SNV counts is shown in the pie chart on the upper left. If this figure is blank, not enough information was provided in the MAF to generate it.
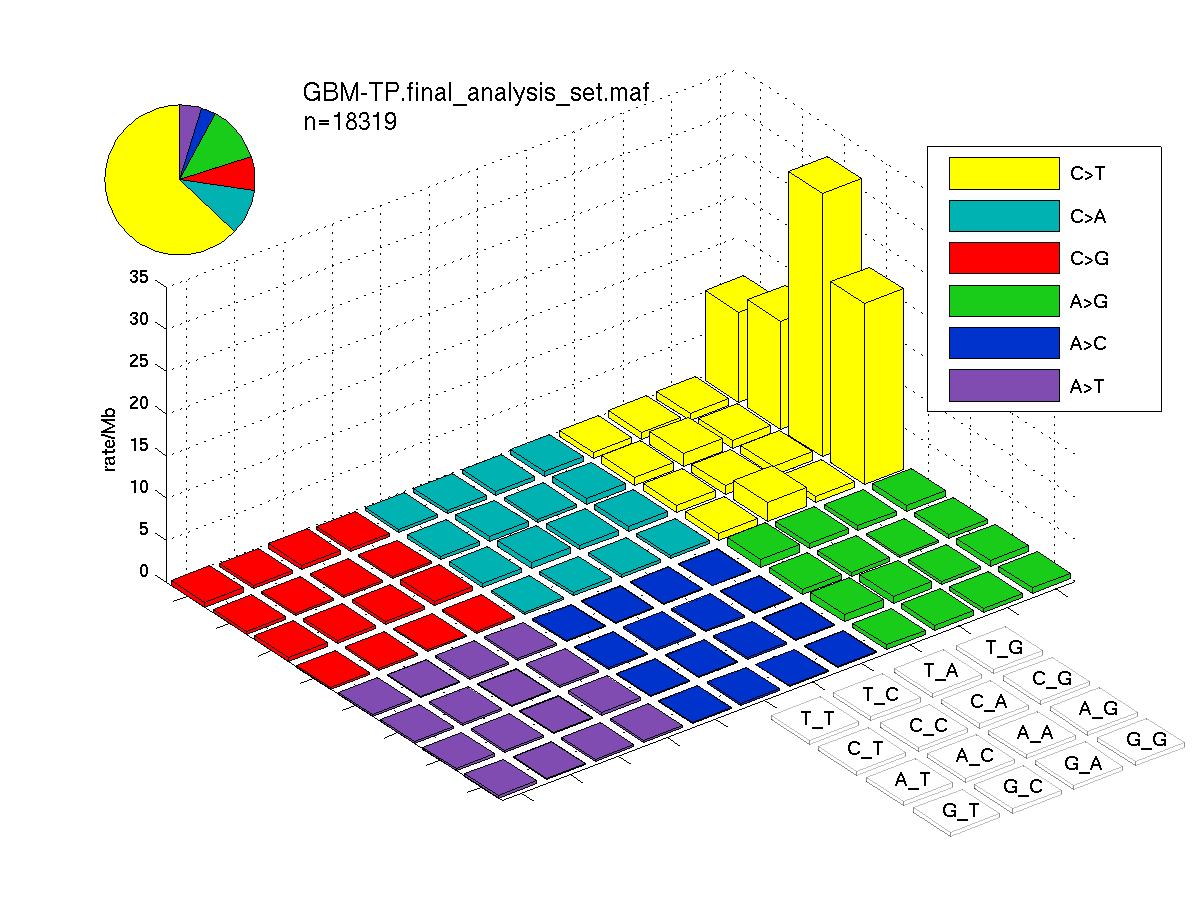
Figure 4. Get High-res Image SNV Mutation rate lego plots for 4 slices of mutation allele fraction (0<=AF<0.1, 0.1<=AF<0.25, 0.25<=AF<0.5, & 0.5<=AF) . The color code and three-base context legends are the same as the previous figure. If this figure is blank, not enough information was provided in the MAF to generate it.

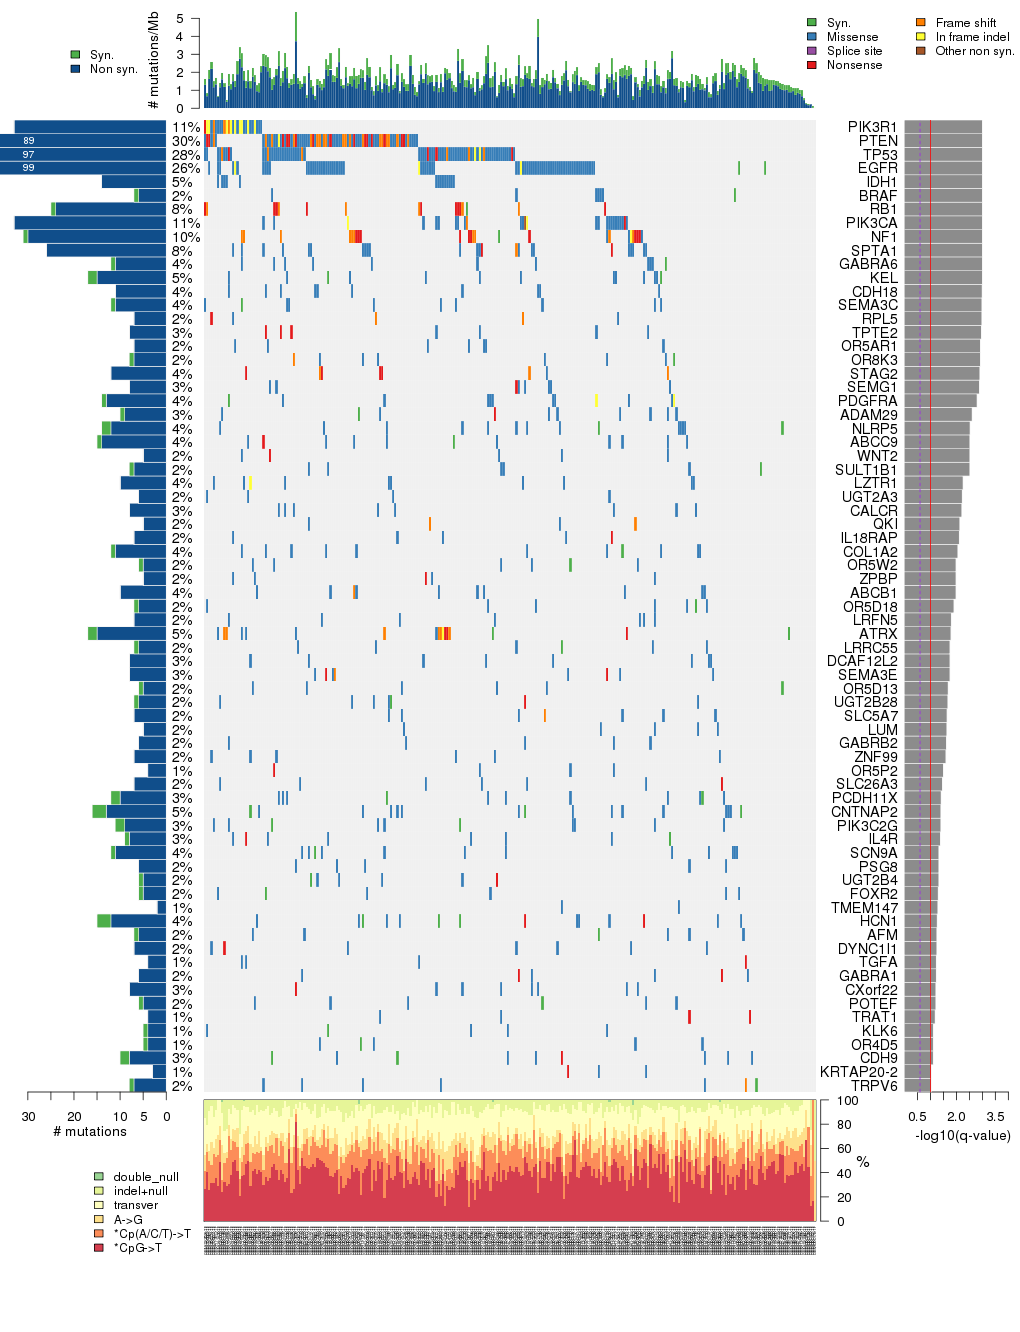
Figure 5. Get High-res Image The matrix in the center of the figure represents individual mutations in patient samples, color-coded by type of mutation, for the significantly mutated genes. The rate of synonymous and non-synonymous mutations is displayed at the top of the matrix. The barplot on the left of the matrix shows the number of mutations in each gene. The percentages represent the fraction of tumors with at least one mutation in the specified gene. The barplot to the right of the matrix displays the q-values for the most significantly mutated genes. The purple boxplots below the matrix (only displayed if required columns are present in the provided MAF) represent the distributions of allelic fractions observed in each sample. The plot at the bottom represents the base substitution distribution of individual samples, using the same categories that were used to calculate significance.
Column Descriptions:
-
N = number of sequenced bases in this gene across the individual set
-
n = number of (nonsilent) mutations in this gene across the individual set
-
npat = number of patients (individuals) with at least one nonsilent mutation
-
nsite = number of unique sites having a non-silent mutation
-
nsil = number of silent mutations in this gene across the individual set
-
n1 = number of nonsilent mutations of type: *CpG->T
-
n2 = number of nonsilent mutations of type: *Cp(A/C/T)->T
-
n3 = number of nonsilent mutations of type: A->G
-
n4 = number of nonsilent mutations of type: transver
-
n5 = number of nonsilent mutations of type: indel+null
-
n6 = number of nonsilent mutations of type: double_null
-
p_classic = p-value for the observed amount of nonsilent mutations being elevated in this gene
-
p_ns_s = p-value for the observed nonsilent/silent ratio being elevated in this gene
-
p_cons = p-value for enrichment of mutations at evolutionarily most-conserved sites in gene
-
p_joint = p-value for clustering + conservation
-
p = p-value (overall)
-
q = q-value, False Discovery Rate (Benjamini-Hochberg procedure)
Table 3. Get Full Table A Ranked List of Significantly Mutated Genes. Number of significant genes found: 71. Number of genes displayed: 35. Click on a gene name to display its stick figure depicting the distribution of mutations and mutation types across the chosen gene (this feature may not be available for all significant genes).
| rank | gene | description | N | n | npat | nsite | nsil | n1 | n2 | n3 | n4 | n5 | n6 | p_classic | p_ns_s | p_clust | p_cons | p_joint | p | q |
|---|---|---|---|---|---|---|---|---|---|---|---|---|---|---|---|---|---|---|---|---|
| 1 | PIK3R1 | phosphoinositide-3-kinase, regulatory subunit 1 (alpha) | 668244 | 33 | 32 | 27 | 0 | 0 | 3 | 4 | 7 | 19 | 0 | <1.00e-15 | 0.0059 | 4e-06 | 0.12 | 5.4e-06 | <0.000 | <0.000 |
| 2 | PTEN | phosphatase and tensin homolog (mutated in multiple advanced cancers 1) | 337830 | 89 | 86 | 72 | 0 | 5 | 20 | 10 | 11 | 43 | 0 | <1.00e-15 | 1.9e-09 | 0.0045 | 0.4 | 0.015 | <5.55e-16 | <3.02e-12 |
| 3 | TP53 | tumor protein p53 | 358092 | 97 | 80 | 60 | 0 | 29 | 15 | 11 | 23 | 19 | 0 | <1.00e-15 | 8.1e-13 | 0 | 0 | 0 | <1.00e-15 | <3.02e-12 |
| 4 | EGFR | epidermal growth factor receptor (erythroblastic leukemia viral (v-erb-b) oncogene homolog, avian) | 1131442 | 92 | 74 | 44 | 7 | 10 | 43 | 2 | 32 | 5 | 0 | 4.55e-15 | 1.1e-08 | 0 | 0 | 0 | <1.00e-15 | <3.02e-12 |
| 5 | IDH1 | isocitrate dehydrogenase 1 (NADP+), soluble | 361231 | 14 | 14 | 2 | 0 | 13 | 0 | 0 | 1 | 0 | 0 | 2.01e-14 | 0.0076 | 0 | 0.83 | 0 | <1.00e-15 | <3.02e-12 |
| 6 | BRAF | v-raf murine sarcoma viral oncogene homolog B1 | 631073 | 6 | 6 | 2 | 1 | 0 | 1 | 0 | 5 | 0 | 0 | 0.000183 | 0.62 | 0 | 0.08 | 0 | <1.00e-15 | <3.02e-12 |
| 7 | RB1 | retinoblastoma 1 (including osteosarcoma) | 752003 | 24 | 24 | 22 | 1 | 0 | 0 | 0 | 0 | 23 | 1 | 1.44e-15 | 0.097 | 0.057 | 0.05 | 0.031 | 1.78e-15 | 4.53e-12 |
| 8 | PIK3CA | phosphoinositide-3-kinase, catalytic, alpha polypeptide | 924699 | 33 | 30 | 28 | 0 | 5 | 7 | 7 | 6 | 8 | 0 | 4.44e-15 | 0.00033 | 0.012 | 0.11 | 0.012 | 2.00e-15 | 4.53e-12 |
| 9 | NF1 | neurofibromin 1 (neurofibromatosis, von Recklinghausen disease, Watson disease) | 2457594 | 30 | 29 | 30 | 1 | 0 | 2 | 1 | 1 | 21 | 5 | 7.77e-15 | 0.011 | 0.16 | 0.95 | 0.26 | 6.94e-14 | 1.40e-10 |
| 10 | SPTA1 | spectrin, alpha, erythrocytic 1 (elliptocytosis 2) | 2111845 | 26 | 24 | 26 | 0 | 11 | 2 | 1 | 9 | 3 | 0 | 2.89e-14 | 0.0044 | 0.36 | 0.26 | 0.4 | 3.79e-13 | 6.87e-10 |
| 11 | GABRA6 | gamma-aminobutyric acid (GABA) A receptor, alpha 6 | 395438 | 11 | 11 | 10 | 1 | 4 | 1 | 1 | 4 | 1 | 0 | 9.16e-12 | 0.11 | 0.74 | 0.38 | 0.71 | 1.73e-10 | 2.86e-07 |
| 12 | KEL | Kell blood group, metallo-endopeptidase | 639794 | 15 | 15 | 12 | 2 | 8 | 0 | 0 | 3 | 4 | 0 | 6.66e-11 | 0.19 | 0.45 | 0.92 | 0.62 | 1.03e-09 | 1.55e-06 |
| 13 | CDH18 | cadherin 18, type 2 | 682827 | 11 | 11 | 10 | 0 | 3 | 3 | 0 | 4 | 1 | 0 | 5.88e-09 | 0.048 | 0.073 | 0.71 | 0.14 | 1.81e-08 | 2.53e-05 |
| 14 | SEMA3C | sema domain, immunoglobulin domain (Ig), short basic domain, secreted, (semaphorin) 3C | 654951 | 11 | 11 | 11 | 1 | 3 | 0 | 2 | 4 | 2 | 0 | 3.30e-09 | 0.22 | 0.44 | 0.55 | 0.61 | 4.24e-08 | 5.49e-05 |
| 15 | RPL5 | ribosomal protein L5 | 261806 | 7 | 7 | 7 | 0 | 0 | 1 | 1 | 0 | 5 | 0 | 1.59e-08 | 0.28 | 0.44 | 0.072 | 0.19 | 6.17e-08 | 7.45e-05 |
| 16 | TPTE2 | transmembrane phosphoinositide 3-phosphatase and tensin homolog 2 | 464692 | 8 | 8 | 6 | 0 | 2 | 0 | 0 | 2 | 4 | 0 | 1.86e-07 | 0.1 | 0.026 | 0.032 | 0.022 | 8.46e-08 | 9.59e-05 |
| 17 | OR5AR1 | olfactory receptor, family 5, subfamily AR, member 1 | 264117 | 7 | 7 | 7 | 0 | 3 | 0 | 2 | 2 | 0 | 0 | 4.88e-08 | 0.18 | 0.38 | 0.077 | 0.18 | 1.73e-07 | 0.000185 |
| 18 | OR8K3 | olfactory receptor, family 8, subfamily K, member 3 | 265683 | 7 | 7 | 7 | 1 | 2 | 2 | 0 | 2 | 1 | 0 | 1.44e-08 | 0.32 | 0.48 | 0.93 | 0.66 | 1.87e-07 | 0.000188 |
| 19 | STAG2 | stromal antigen 2 | 1110411 | 12 | 12 | 12 | 0 | 0 | 0 | 0 | 1 | 11 | 0 | 3.02e-08 | 0.19 | 0.29 | 0.62 | 0.48 | 2.79e-07 | 0.000266 |
| 20 | SEMG1 | semenogelin I | 395351 | 8 | 8 | 7 | 0 | 5 | 0 | 2 | 0 | 1 | 0 | 3.49e-08 | 0.11 | 0.27 | 0.42 | 0.5 | 3.31e-07 | 0.000300 |
| 21 | PDGFRA | platelet-derived growth factor receptor, alpha polypeptide | 950298 | 13 | 11 | 12 | 1 | 0 | 5 | 2 | 4 | 2 | 0 | 2.84e-07 | 0.096 | 0.086 | 0.25 | 0.14 | 7.05e-07 | 0.000608 |
| 22 | ADAM29 | ADAM metallopeptidase domain 29 | 698127 | 9 | 9 | 8 | 1 | 6 | 0 | 0 | 2 | 1 | 0 | 2.08e-07 | 0.34 | 0.35 | 0.58 | 0.51 | 1.81e-06 | 0.00149 |
| 23 | NLRP5 | NLR family, pyrin domain containing 5 | 962338 | 12 | 12 | 11 | 2 | 9 | 0 | 1 | 2 | 0 | 0 | 1.69e-06 | 0.11 | 0.35 | 0.035 | 0.089 | 2.51e-06 | 0.00198 |
| 24 | ABCC9 | ATP-binding cassette, sub-family C (CFTR/MRP), member 9 | 1396433 | 14 | 11 | 14 | 1 | 4 | 0 | 3 | 5 | 2 | 0 | 4.15e-06 | 0.1 | 0.02 | 0.36 | 0.041 | 2.79e-06 | 0.00210 |
| 25 | WNT2 | wingless-type MMTV integration site family member 2 | 311956 | 5 | 5 | 5 | 0 | 3 | 0 | 0 | 1 | 1 | 0 | 0.000264 | 0.2 | 0.003 | 0.03 | 0.00066 | 2.90e-06 | 0.00210 |
| 26 | SULT1B1 | sulfotransferase family, cytosolic, 1B, member 1 | 257699 | 7 | 6 | 7 | 1 | 0 | 2 | 1 | 3 | 1 | 0 | 6.69e-07 | 0.36 | 0.16 | 0.86 | 0.27 | 3.02e-06 | 0.00211 |
| 27 | LZTR1 | leucine-zipper-like transcription regulator 1 | 647961 | 10 | 10 | 10 | 0 | 4 | 0 | 1 | 4 | 1 | 0 | 1.78e-06 | 0.08 | 0.29 | 0.18 | 0.24 | 6.78e-06 | 0.00455 |
| 28 | UGT2A3 | UDP glucuronosyltransferase 2 family, polypeptide A3 | 450901 | 6 | 6 | 6 | 0 | 1 | 0 | 2 | 1 | 2 | 0 | 1.05e-05 | 0.15 | 0.23 | 0.015 | 0.047 | 7.69e-06 | 0.00498 |
| 29 | CALCR | calcitonin receptor | 424651 | 8 | 8 | 8 | 0 | 6 | 1 | 1 | 0 | 0 | 0 | 5.51e-07 | 0.051 | 0.84 | 0.78 | 1 | 8.49e-06 | 0.00531 |
| 30 | QKI | quaking homolog, KH domain RNA binding (mouse) | 327911 | 5 | 5 | 5 | 0 | 0 | 0 | 0 | 2 | 3 | 0 | 2.54e-05 | 0.69 | 0.4 | 0.0052 | 0.028 | 1.08e-05 | 0.00653 |
| 31 | IL18RAP | interleukin 18 receptor accessory protein | 520719 | 7 | 7 | 7 | 0 | 1 | 2 | 0 | 1 | 3 | 0 | 2.41e-06 | 0.095 | 0.84 | 0.078 | 0.32 | 1.15e-05 | 0.00675 |
| 32 | COL1A2 | collagen, type I, alpha 2 | 1162327 | 11 | 11 | 11 | 1 | 2 | 3 | 0 | 5 | 1 | 0 | 3.10e-06 | 0.2 | 0.31 | 0.26 | 0.31 | 1.42e-05 | 0.00803 |
| 33 | OR5W2 | olfactory receptor, family 5, subfamily W, member 2 | 264214 | 5 | 5 | 5 | 1 | 1 | 0 | 2 | 2 | 0 | 0 | 4.70e-06 | 0.62 | 0.19 | 0.4 | 0.25 | 1.75e-05 | 0.00943 |
| 34 | ZPBP | zona pellucida binding protein | 282197 | 5 | 5 | 4 | 0 | 3 | 0 | 1 | 0 | 1 | 0 | 6.47e-05 | 0.28 | 0.0081 | 0.37 | 0.019 | 1.78e-05 | 0.00943 |
| 35 | ABCB1 | ATP-binding cassette, sub-family B (MDR/TAP), member 1 | 1117814 | 10 | 10 | 10 | 0 | 5 | 1 | 0 | 3 | 1 | 0 | 2.63e-06 | 0.12 | 0.88 | 0.14 | 0.47 | 1.82e-05 | 0.00943 |
Figure S1. This figure depicts the distribution of mutations and mutation types across the PIK3R1 significant gene.
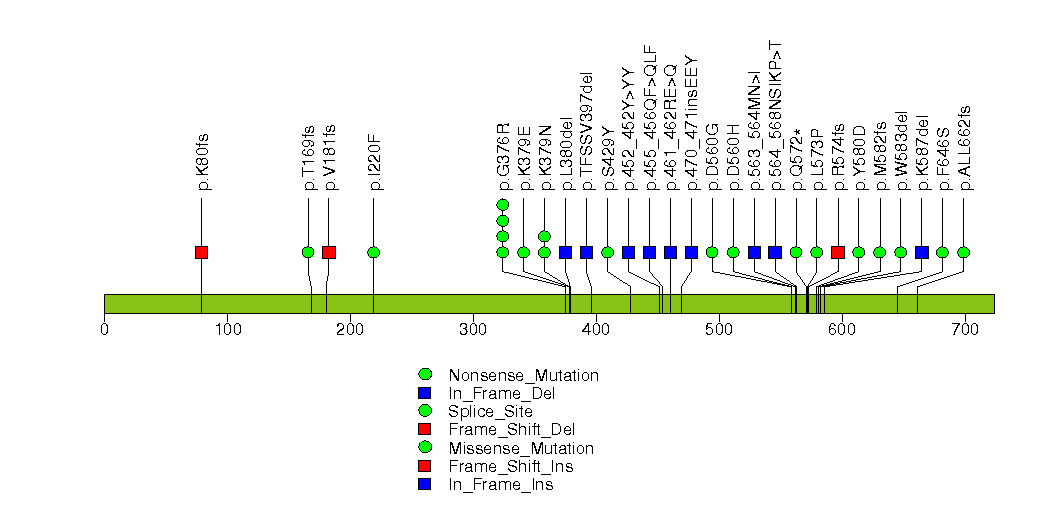
Figure S2. This figure depicts the distribution of mutations and mutation types across the PTEN significant gene.
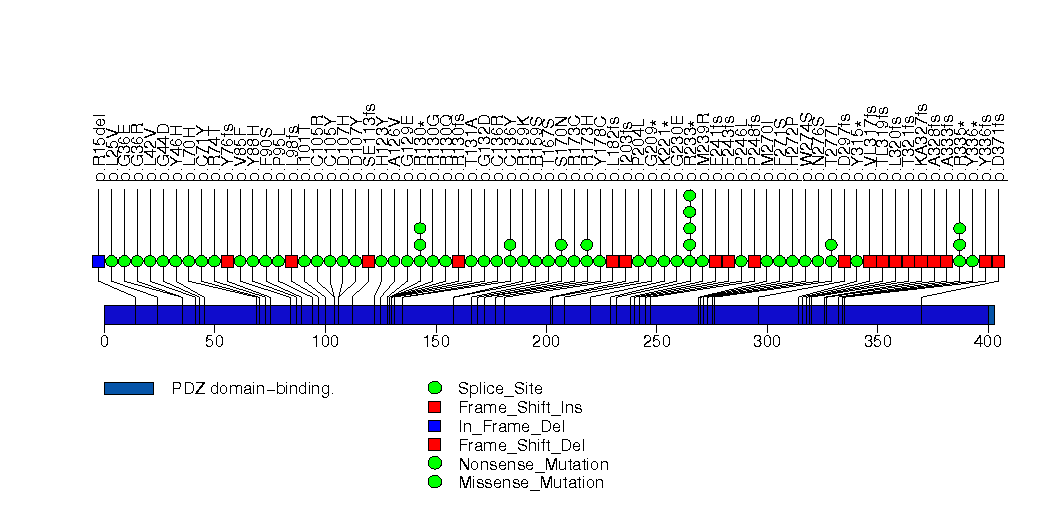
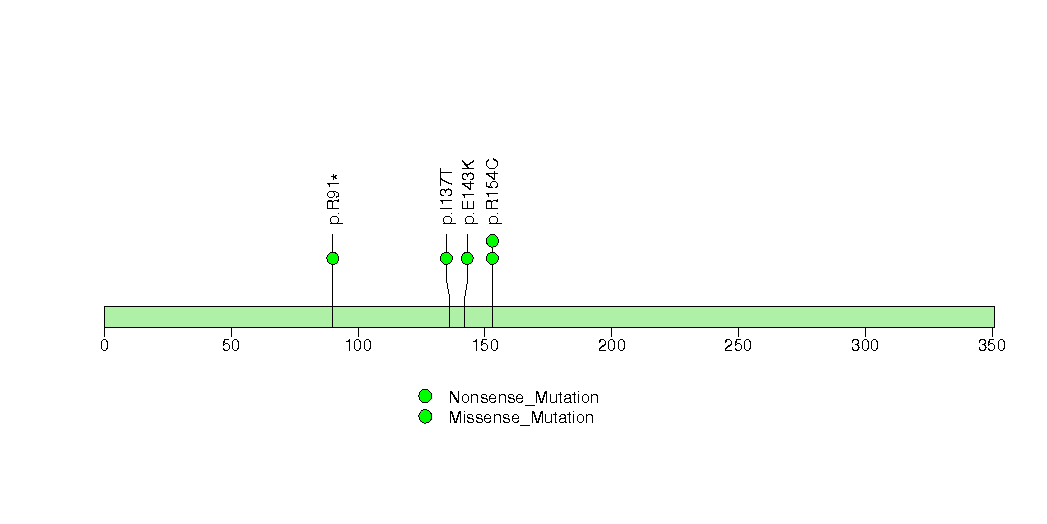
Figure S3. This figure depicts the distribution of mutations and mutation types across the TP53 significant gene.
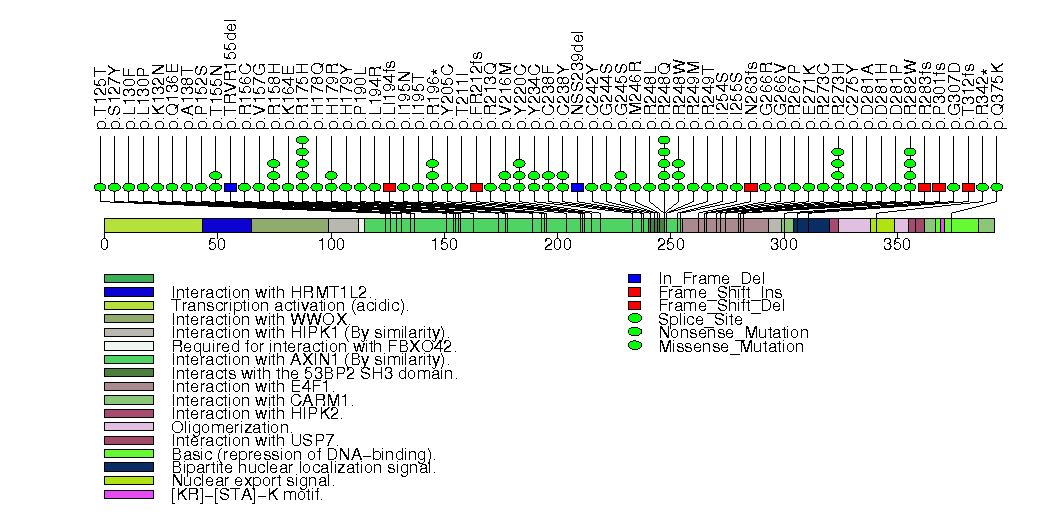
Figure S4. This figure depicts the distribution of mutations and mutation types across the EGFR significant gene.
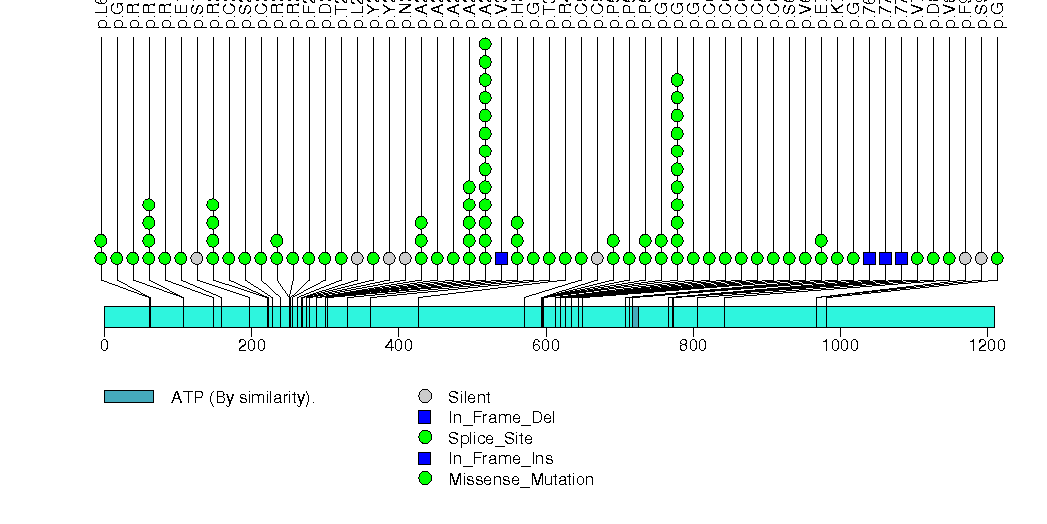
Figure S5. This figure depicts the distribution of mutations and mutation types across the IDH1 significant gene.
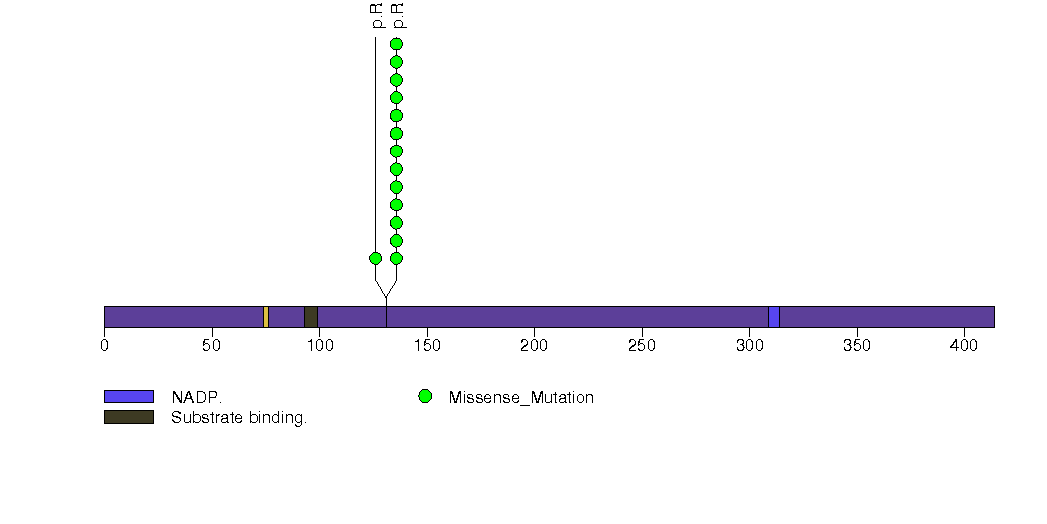
Figure S6. This figure depicts the distribution of mutations and mutation types across the BRAF significant gene.
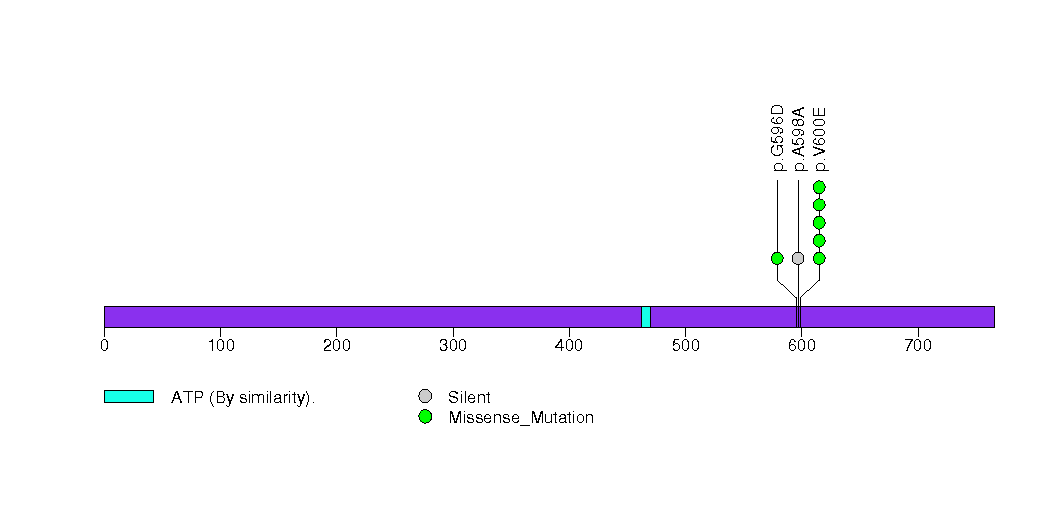
Figure S7. This figure depicts the distribution of mutations and mutation types across the RB1 significant gene.
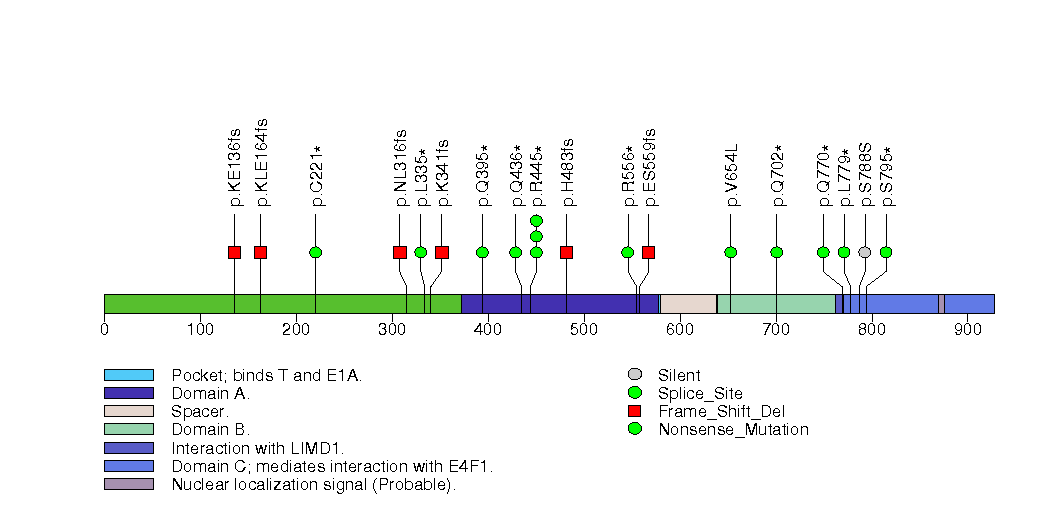
Figure S8. This figure depicts the distribution of mutations and mutation types across the PIK3CA significant gene.
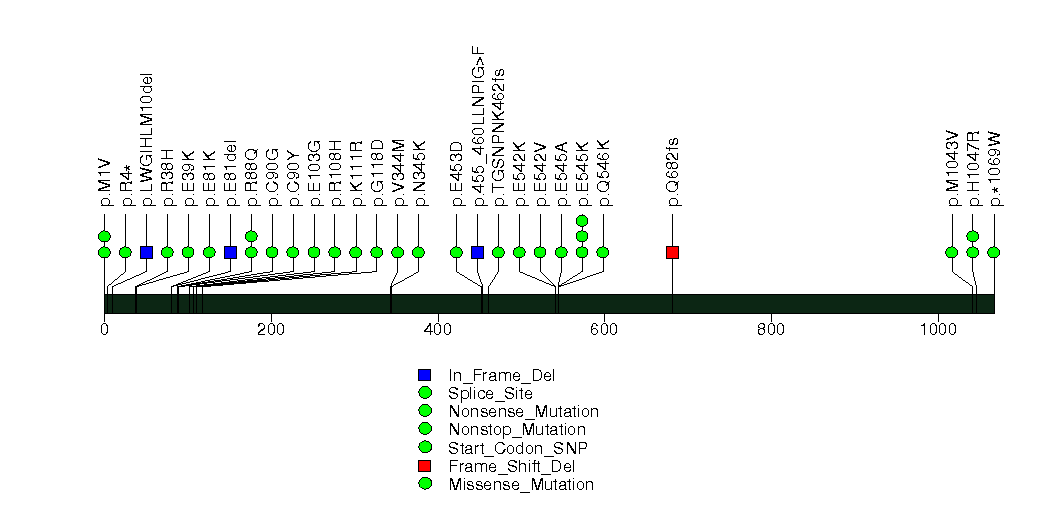
Figure S9. This figure depicts the distribution of mutations and mutation types across the NF1 significant gene.
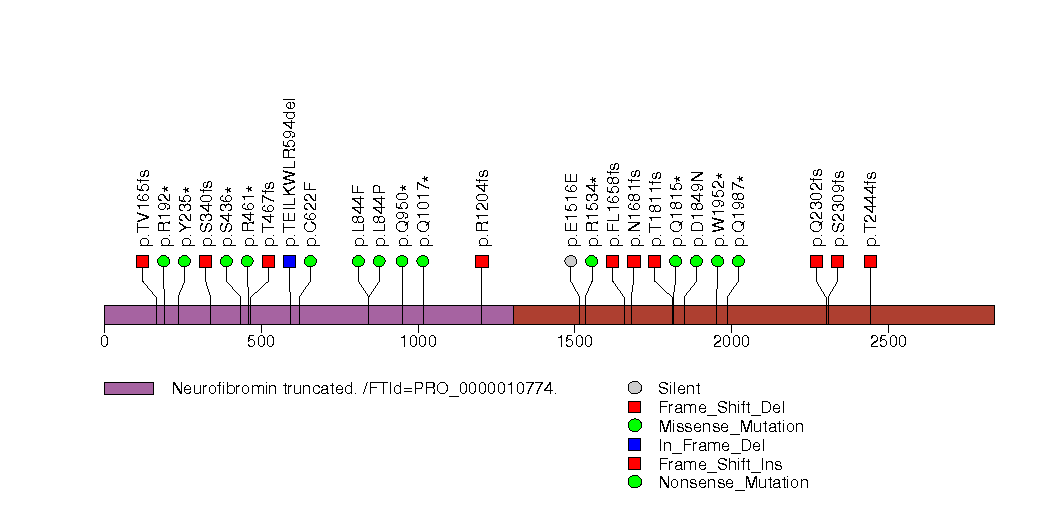
Figure S10. This figure depicts the distribution of mutations and mutation types across the SPTA1 significant gene.
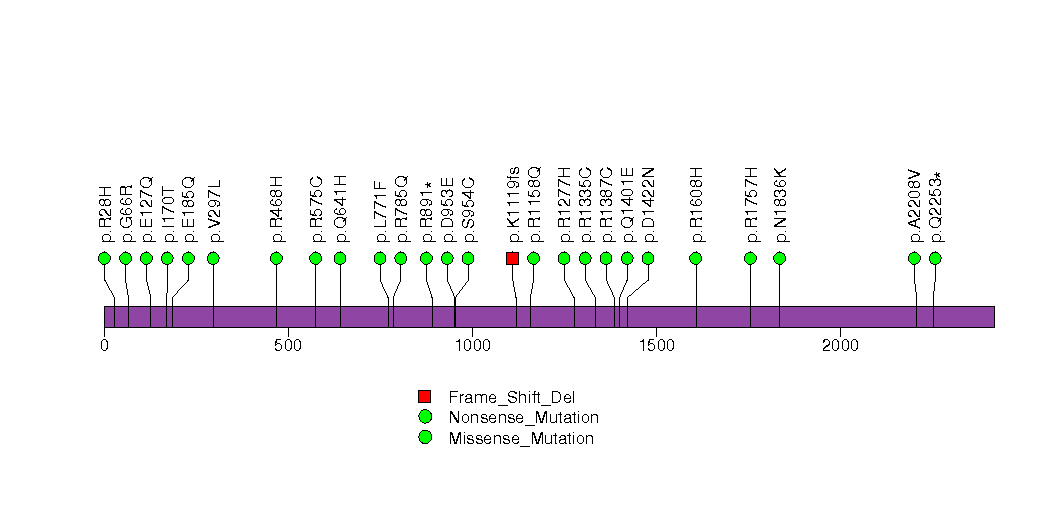
Figure S11. This figure depicts the distribution of mutations and mutation types across the GABRA6 significant gene.
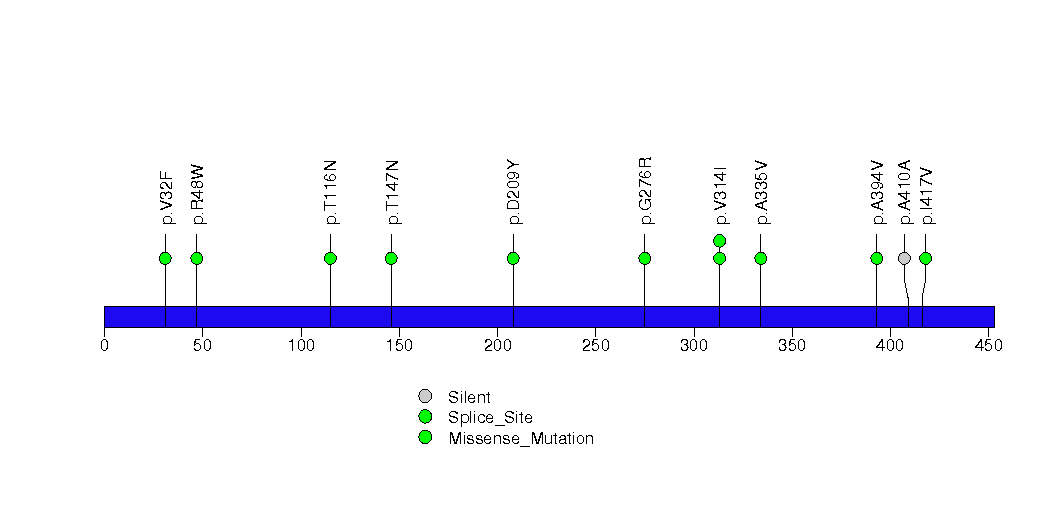
Figure S12. This figure depicts the distribution of mutations and mutation types across the KEL significant gene.
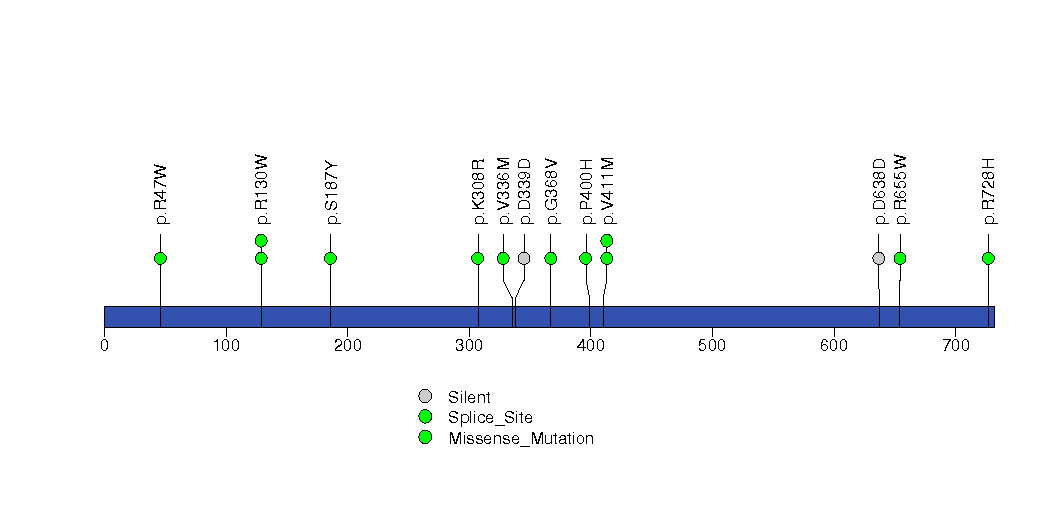
Figure S13. This figure depicts the distribution of mutations and mutation types across the CDH18 significant gene.
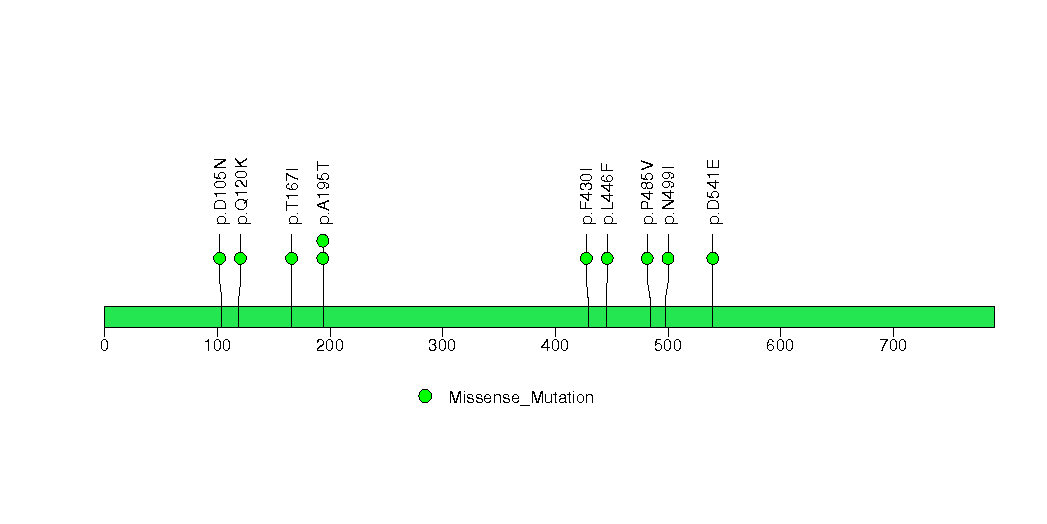
Figure S14. This figure depicts the distribution of mutations and mutation types across the SEMA3C significant gene.
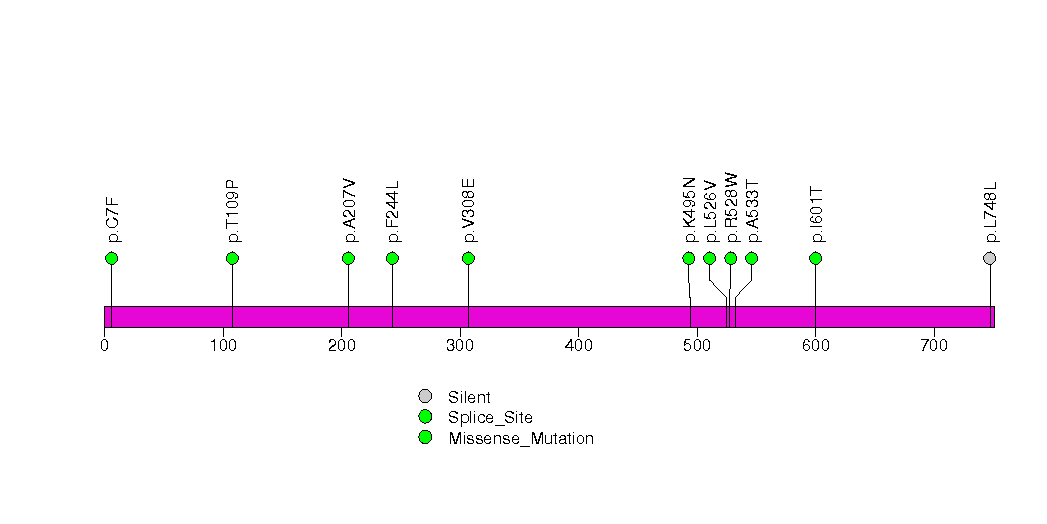
Figure S15. This figure depicts the distribution of mutations and mutation types across the RPL5 significant gene.
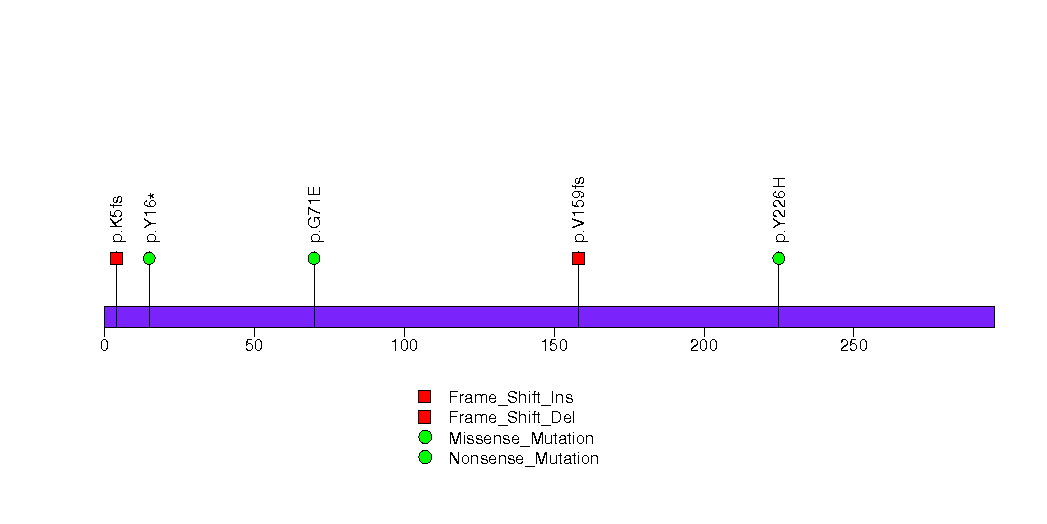
Figure S16. This figure depicts the distribution of mutations and mutation types across the TPTE2 significant gene.
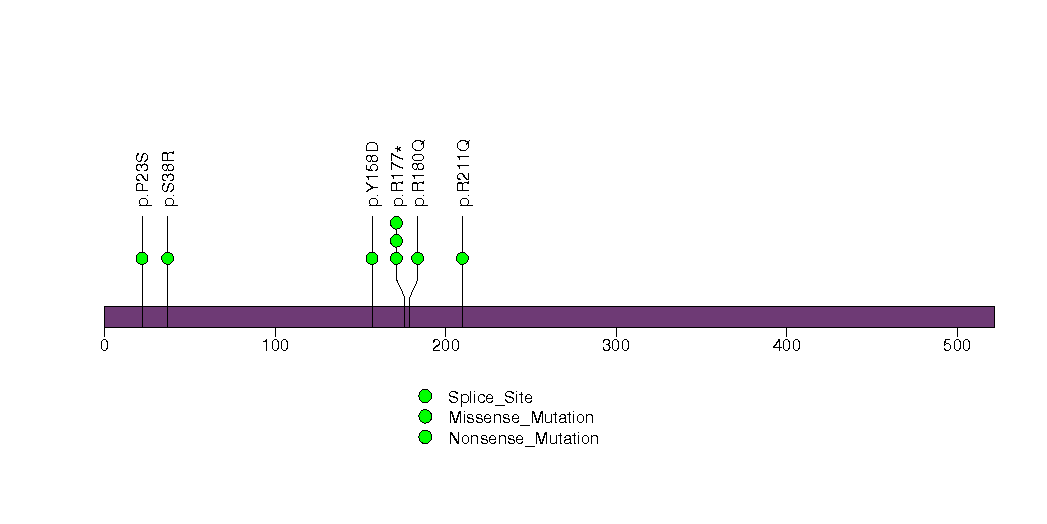
Figure S17. This figure depicts the distribution of mutations and mutation types across the OR5AR1 significant gene.
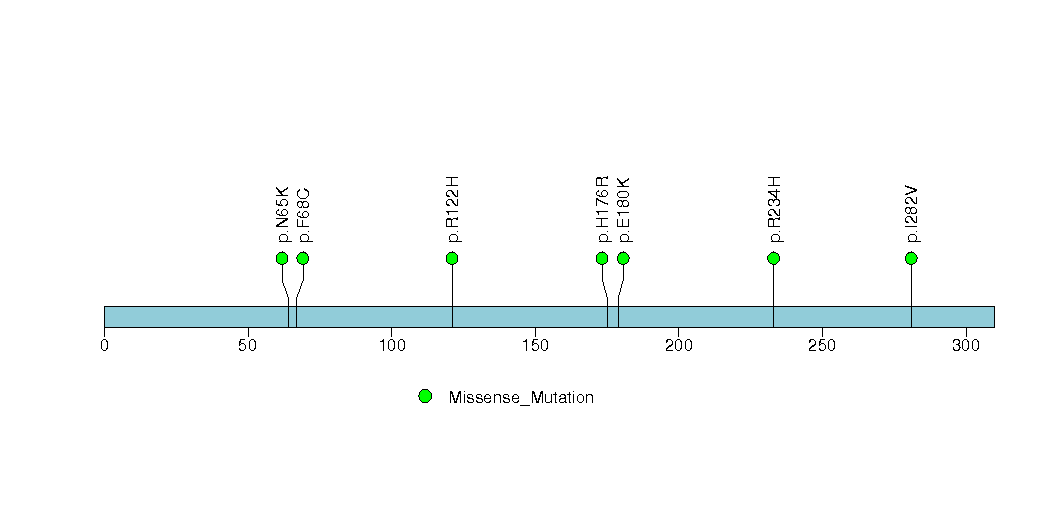
Figure S18. This figure depicts the distribution of mutations and mutation types across the OR8K3 significant gene.
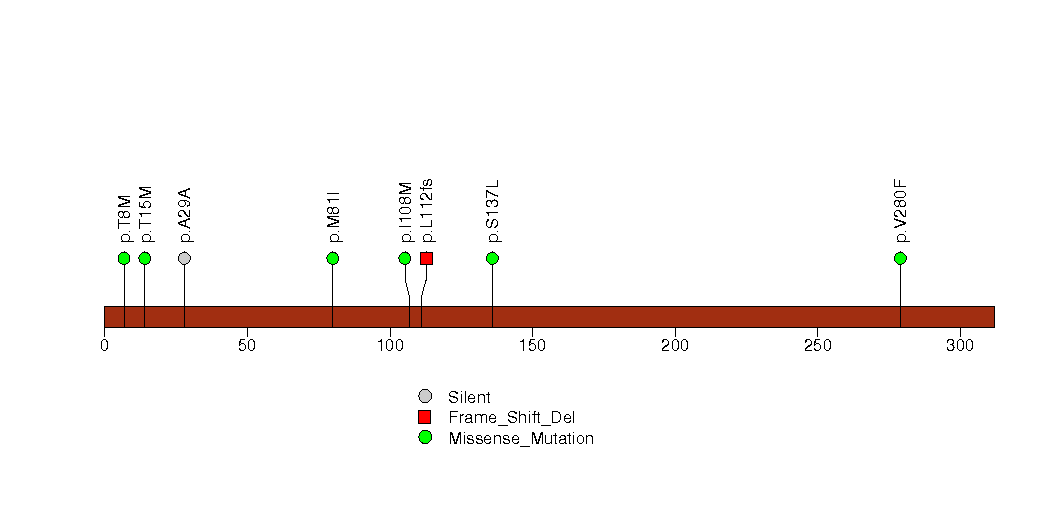
Figure S19. This figure depicts the distribution of mutations and mutation types across the STAG2 significant gene.
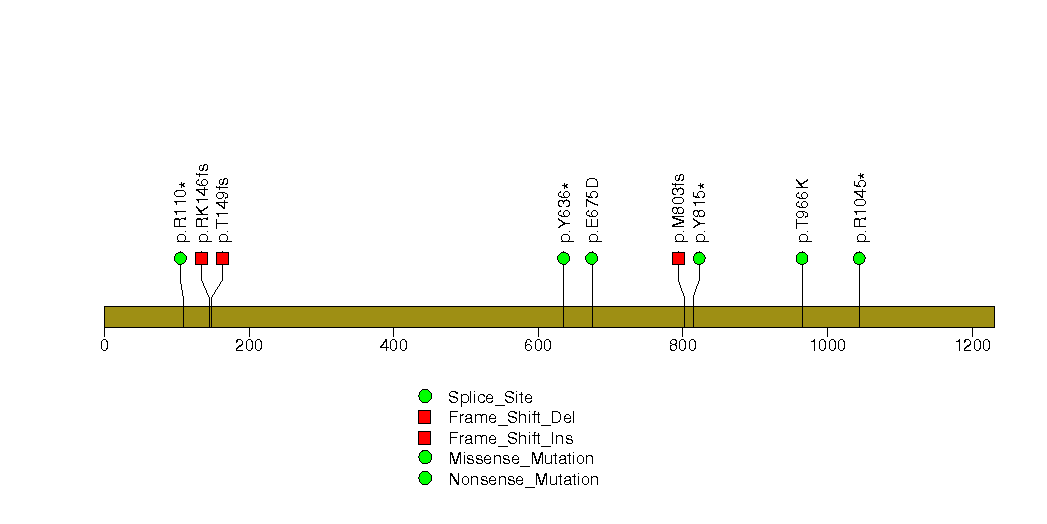
Figure S20. This figure depicts the distribution of mutations and mutation types across the SEMG1 significant gene.
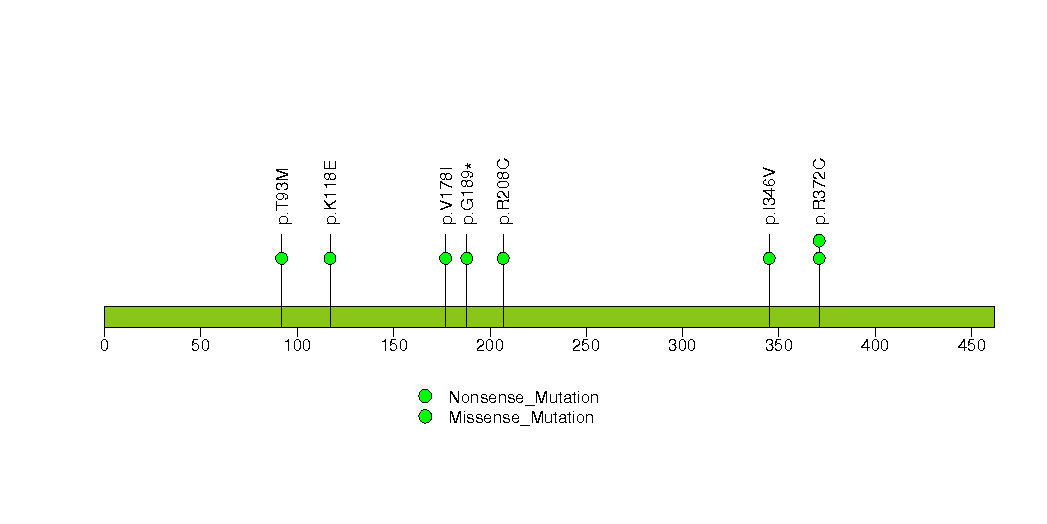
Figure S21. This figure depicts the distribution of mutations and mutation types across the PDGFRA significant gene.
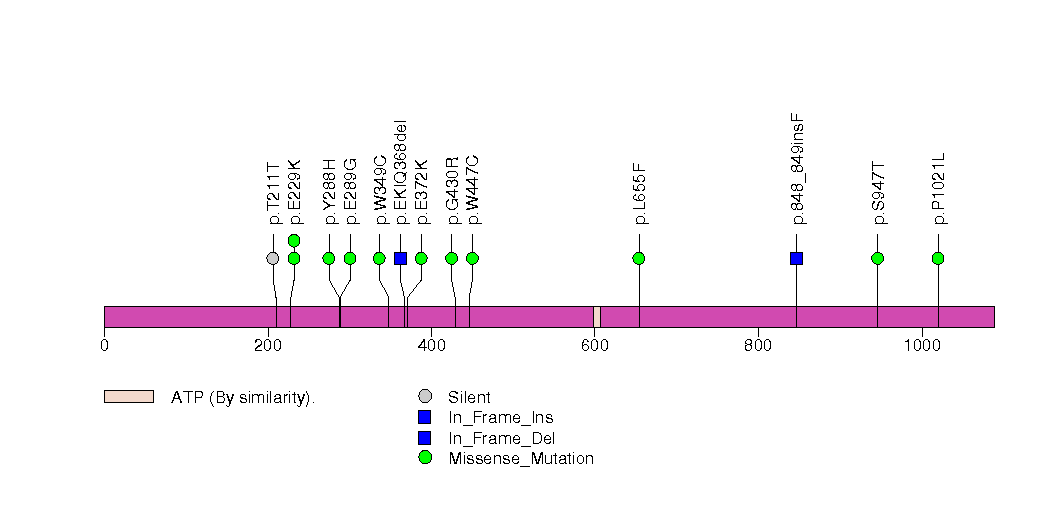
Figure S22. This figure depicts the distribution of mutations and mutation types across the ADAM29 significant gene.
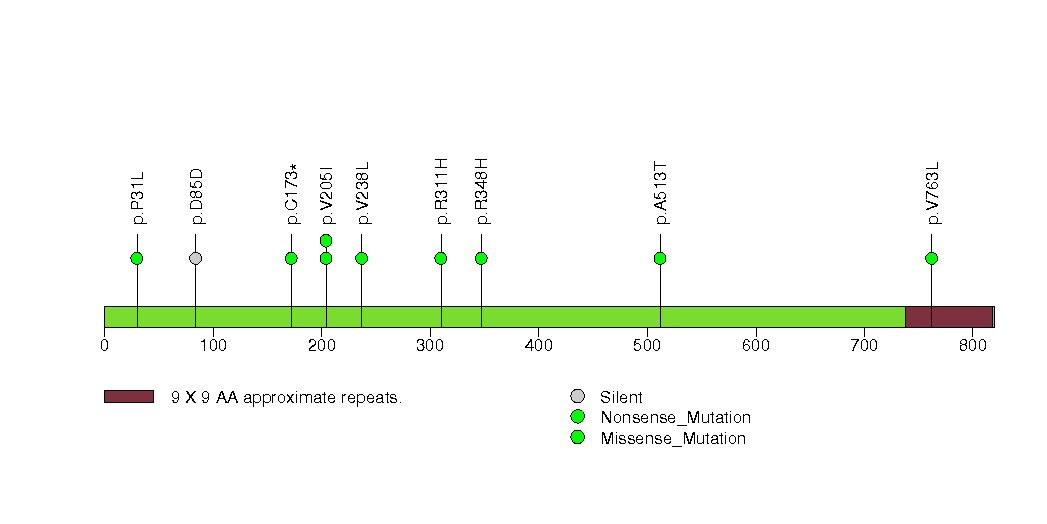
Figure S23. This figure depicts the distribution of mutations and mutation types across the NLRP5 significant gene.
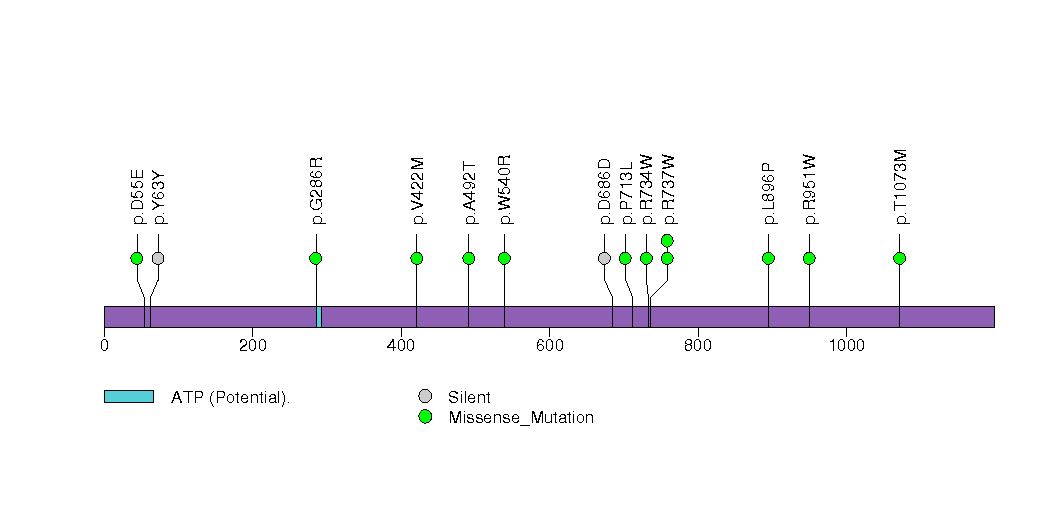
Figure S24. This figure depicts the distribution of mutations and mutation types across the ABCC9 significant gene.
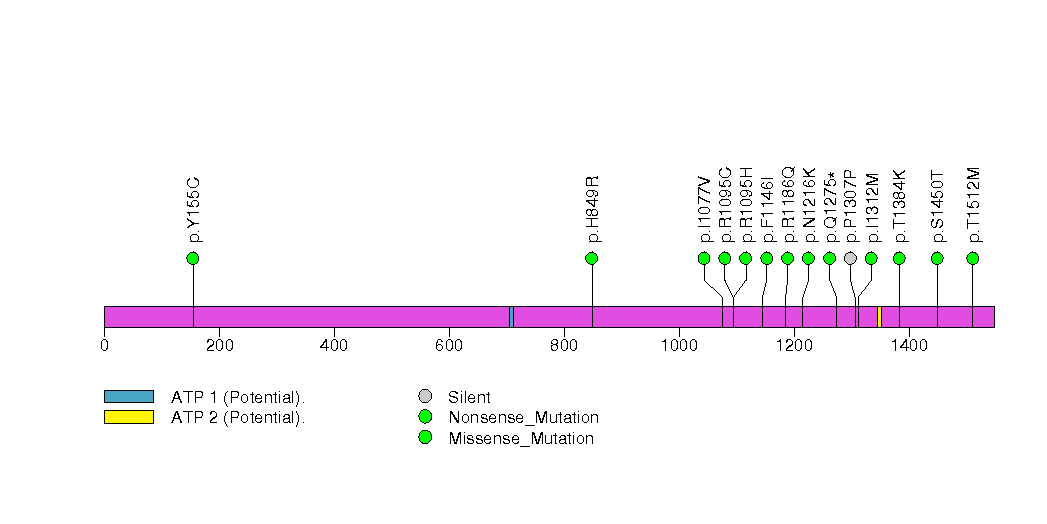
Figure S25. This figure depicts the distribution of mutations and mutation types across the WNT2 significant gene.
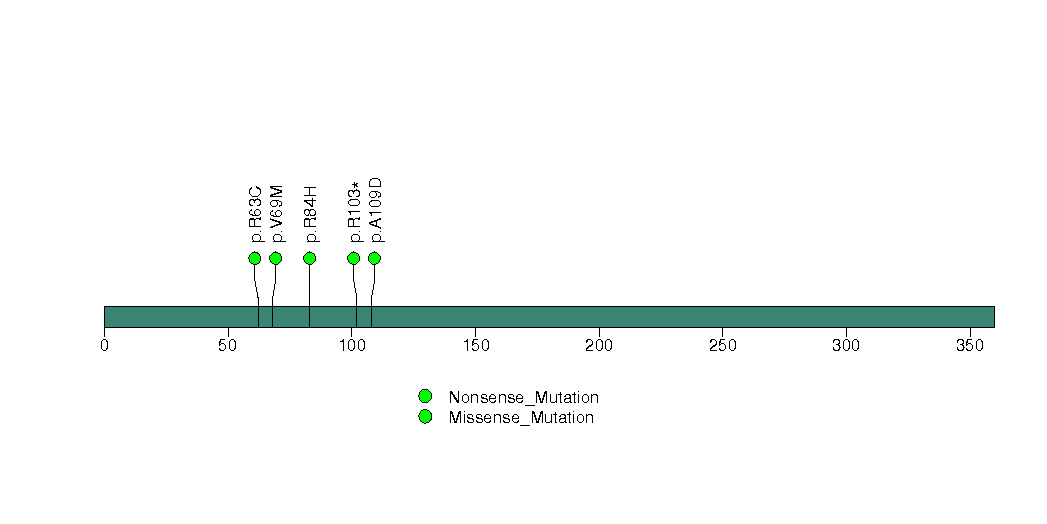
Figure S26. This figure depicts the distribution of mutations and mutation types across the SULT1B1 significant gene.
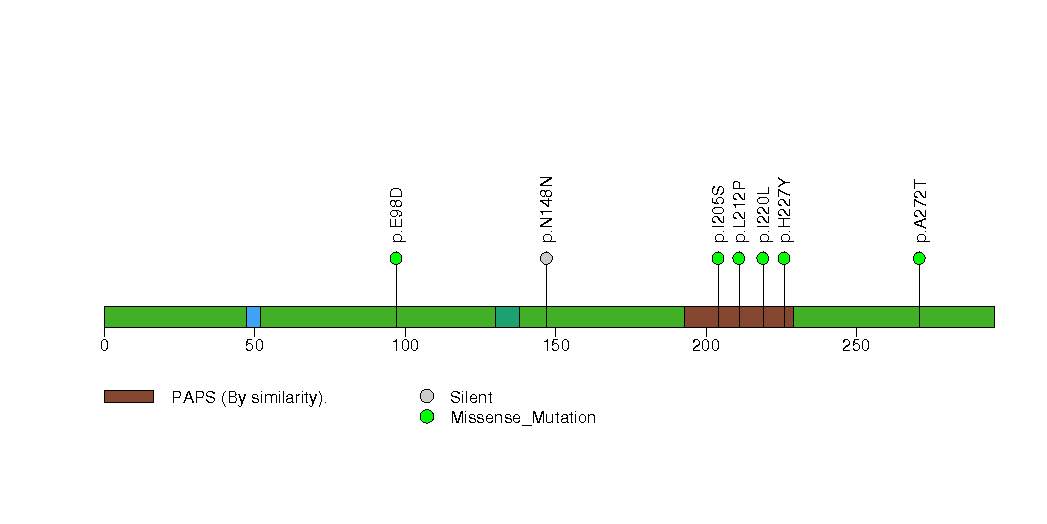
Figure S27. This figure depicts the distribution of mutations and mutation types across the LZTR1 significant gene.
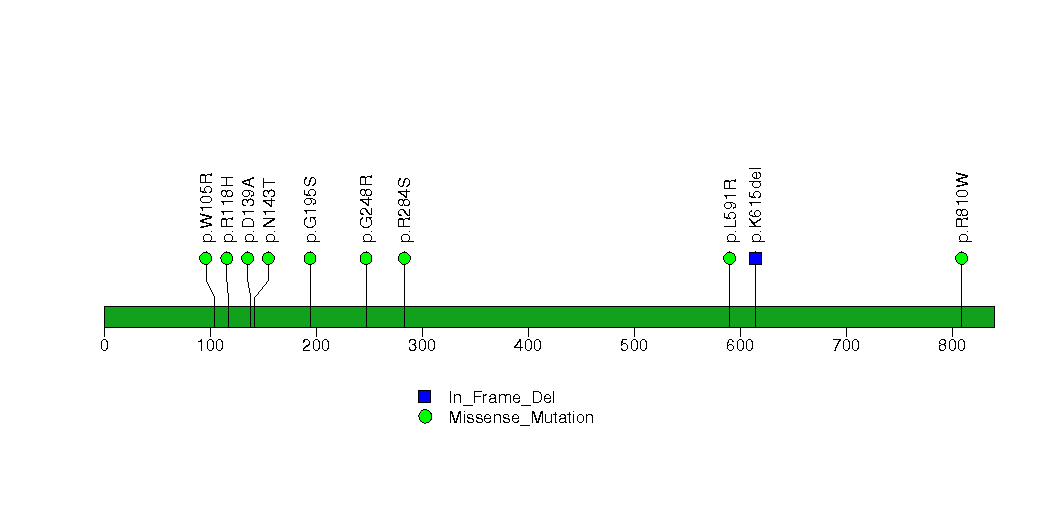
Figure S28. This figure depicts the distribution of mutations and mutation types across the UGT2A3 significant gene.
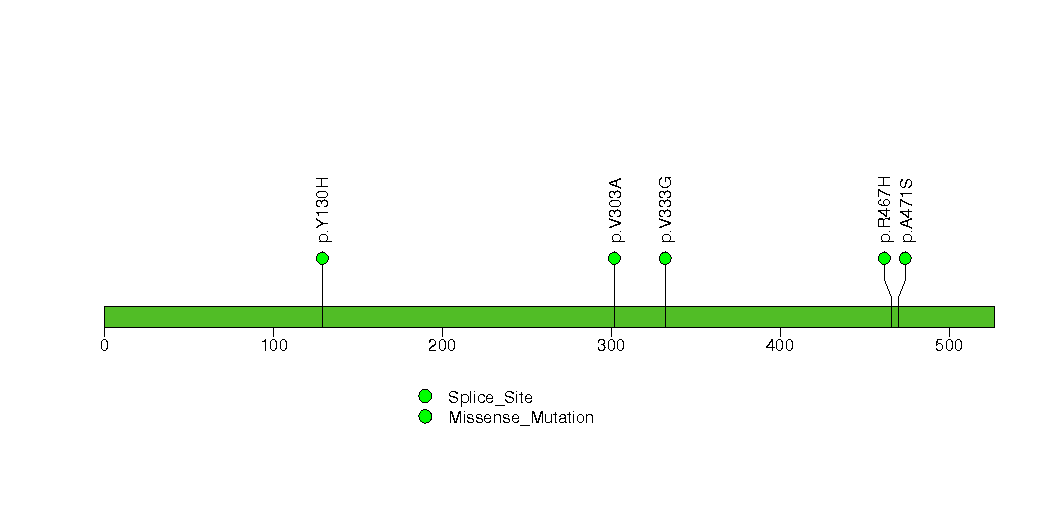
Figure S29. This figure depicts the distribution of mutations and mutation types across the CALCR significant gene.
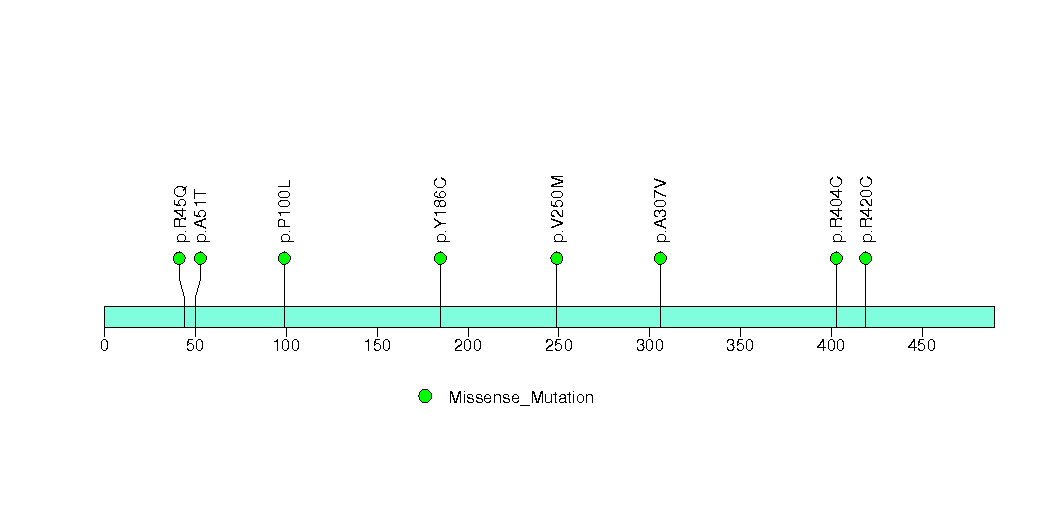
Figure S30. This figure depicts the distribution of mutations and mutation types across the QKI significant gene.
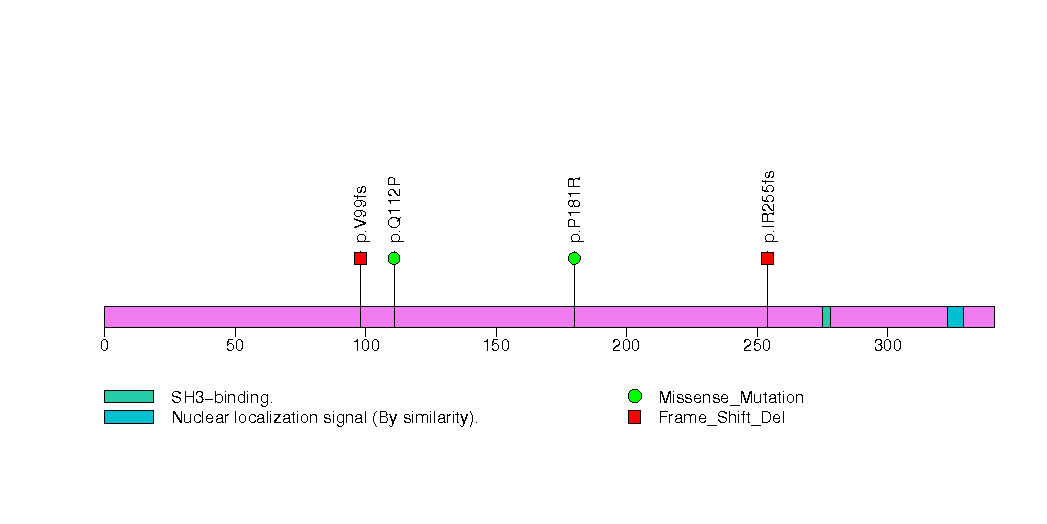
Figure S31. This figure depicts the distribution of mutations and mutation types across the IL18RAP significant gene.
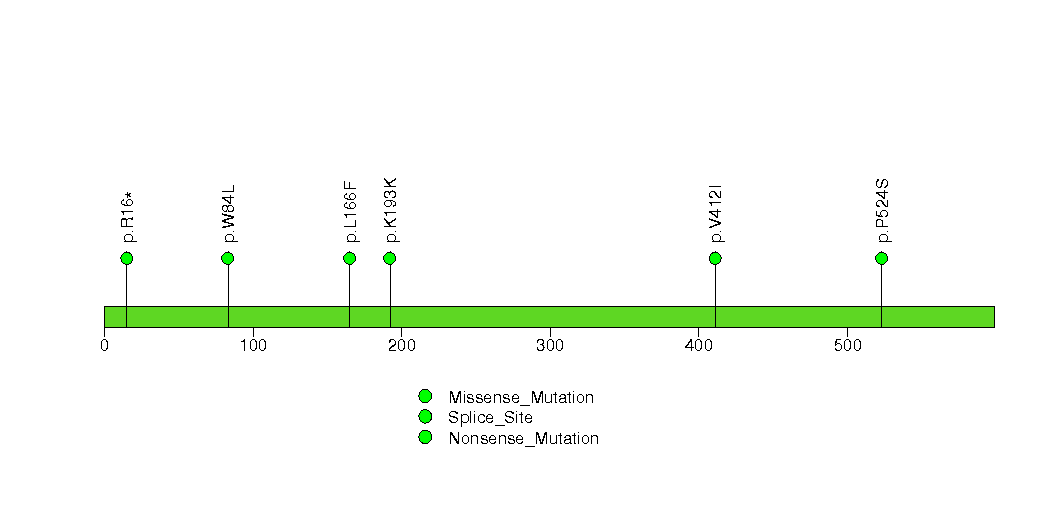
Figure S32. This figure depicts the distribution of mutations and mutation types across the COL1A2 significant gene.
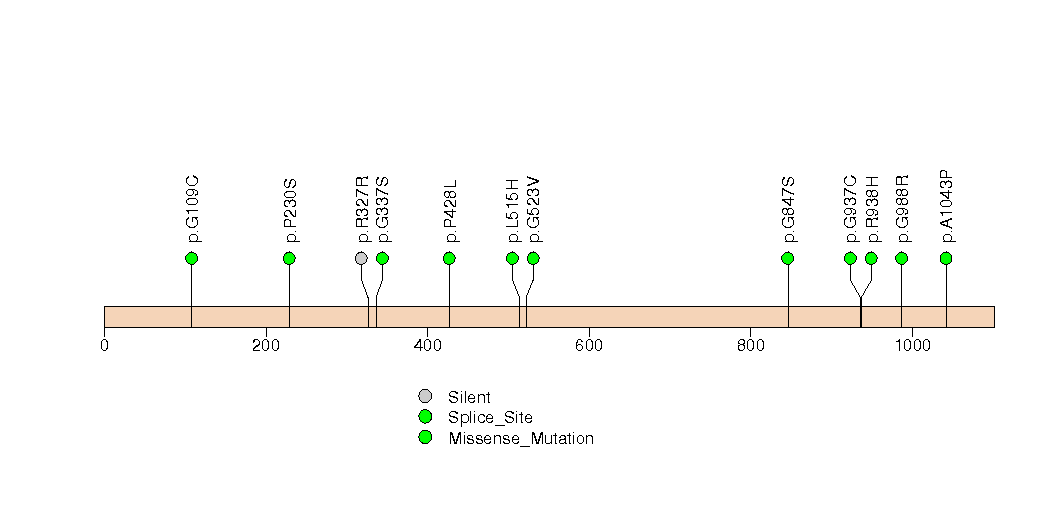
Figure S33. This figure depicts the distribution of mutations and mutation types across the OR5W2 significant gene.
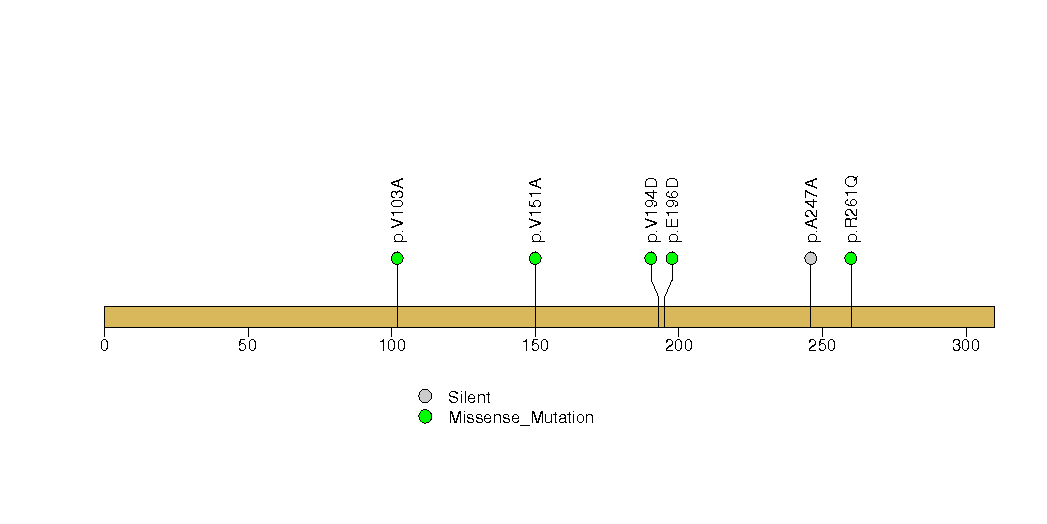
Figure S34. This figure depicts the distribution of mutations and mutation types across the ZPBP significant gene.
In this analysis, COSMIC is used as a filter to increase power by restricting the territory of each gene. Cosmic version: v48.
Table 4. Get Full Table Significantly mutated genes (COSMIC territory only). To access the database please go to: COSMIC. Number of significant genes found: 70. Number of genes displayed: 10
| rank | gene | description | n | cos | n_cos | N_cos | cos_ev | p | q |
|---|---|---|---|---|---|---|---|---|---|
| 1 | TP53 | tumor protein p53 | 97 | 356 | 93 | 100748 | 26307 | 0 | 0 |
| 2 | PTEN | phosphatase and tensin homolog (mutated in multiple advanced cancers 1) | 89 | 767 | 87 | 217061 | 3053 | 0 | 0 |
| 3 | IDH1 | isocitrate dehydrogenase 1 (NADP+), soluble | 14 | 5 | 14 | 1415 | 20888 | 1.6e-14 | 2.5e-11 |
| 4 | PIK3R1 | phosphoinositide-3-kinase, regulatory subunit 1 (alpha) | 33 | 33 | 13 | 9339 | 25 | 1.1e-13 | 1.2e-10 |
| 5 | PIK3CA | phosphoinositide-3-kinase, catalytic, alpha polypeptide | 33 | 220 | 25 | 62260 | 5654 | 6.5e-13 | 4.8e-10 |
| 6 | RB1 | retinoblastoma 1 (including osteosarcoma) | 24 | 267 | 15 | 75561 | 41 | 7.8e-13 | 4.8e-10 |
| 7 | NF1 | neurofibromin 1 (neurofibromatosis, von Recklinghausen disease, Watson disease) | 30 | 285 | 11 | 80655 | 23 | 8.2e-13 | 4.8e-10 |
| 8 | EGFR | epidermal growth factor receptor (erythroblastic leukemia viral (v-erb-b) oncogene homolog, avian) | 92 | 293 | 70 | 82919 | 1144 | 8.4e-13 | 4.8e-10 |
| 9 | BRAF | v-raf murine sarcoma viral oncogene homolog B1 | 6 | 89 | 6 | 25187 | 71896 | 8.6e-12 | 4.3e-09 |
| 10 | ADAM29 | ADAM metallopeptidase domain 29 | 9 | 5 | 3 | 1415 | 3 | 2.3e-09 | 9.5e-07 |
Note:
n - number of (nonsilent) mutations in this gene across the individual set.
cos = number of unique mutated sites in this gene in COSMIC
n_cos = overlap between n and cos.
N_cos = number of individuals times cos.
cos_ev = total evidence: number of reports in COSMIC for mutations seen in this gene.
p = p-value for seeing the observed amount of overlap in this gene)
q = q-value, False Discovery Rate (Benjamini-Hochberg procedure)
Table 5. Get Full Table A Ranked List of Significantly Mutated Genesets. (Source: MSigDB GSEA Cannonical Pathway Set).Number of significant genesets found: 122. Number of genesets displayed: 10
| rank | geneset | description | genes | N_genes | mut_tally | N | n | npat | nsite | nsil | n1 | n2 | n3 | n4 | n5 | n6 | p_ns_s | p | q |
|---|---|---|---|---|---|---|---|---|---|---|---|---|---|---|---|---|---|---|---|
| 1 | METPATHWAY | The hepatocyte growth factor receptor c-Met stimulates proliferation and alters cell motility and adhesion on binding the ligand HGF. | ACTA1, CRK, CRKL, DOCK1, ELK1, FOS, GAB1, GRB2, GRF2, HGF, HRAS, ITGA1, ITGB1, JUN, MAP2K1, MAP2K2, MAP4K1, MAPK1, MAPK3, MAPK8, MET, PAK1, PIK3CA, PIK3R1, PTEN, PTK2, PTK2B, PTPN11, PXN, RAF1, RAP1A, RAP1B, RASA1, SOS1, SRC, STAT3 | 35 | CRKL(1), DOCK1(2), ELK1(2), FOS(1), HGF(1), ITGA1(2), ITGB1(1), MAP2K1(1), MAP4K1(2), MAPK1(2), MAPK3(1), MET(3), PAK1(1), PIK3CA(33), PIK3R1(33), PTEN(89), PTK2B(3), PTPN11(4), PXN(1), RAF1(1), SOS1(3), SRC(2), STAT3(1) | 18829475 | 190 | 148 | 162 | 5 | 20 | 35 | 25 | 35 | 75 | 0 | <1.00e-15 | <1.00e-15 | <4.65e-14 |
| 2 | ATRBRCAPATHWAY | BRCA1 and 2 block cell cycle progression in response to DNA damage and promote double-stranded break repair; mutations induce breast cancer susceptibility. | ATM, ATR, BRCA1, BRCA2, CHEK1, CHEK2, FANCA, FANCC, FANCD2, FANCE, FANCF, FANCG, HUS1, MRE11A, NBS1, RAD1, RAD17, RAD50, RAD51, RAD9A, TP53, TREX1 | 21 | ATM(4), ATR(4), BRCA1(4), BRCA2(4), CHEK1(3), FANCD2(2), MRE11A(1), RAD50(1), TP53(97) | 18721101 | 120 | 99 | 83 | 4 | 34 | 19 | 17 | 29 | 21 | 0 | 1.08e-10 | <1.00e-15 | <4.65e-14 |
| 3 | TIDPATHWAY | On ligand binding, interferon gamma receptors stimulate JAK2 kinase to phosphorylate STAT transcription factors, which promote expression of interferon responsive genes. | DNAJA3, HSPA1A, IFNG, IFNGR1, IFNGR2, IKBKB, JAK2, LIN7A, NFKB1, NFKBIA, RB1, RELA, TIP-1, TNF, TNFRSF1A, TNFRSF1B, TP53, USH1C, WT1 | 18 | IFNG(2), IFNGR1(1), IFNGR2(3), IKBKB(1), JAK2(1), NFKB1(1), NFKBIA(1), RB1(24), TNFRSF1A(1), TNFRSF1B(1), TP53(97), USH1C(1), WT1(2) | 7833614 | 136 | 99 | 97 | 2 | 31 | 16 | 15 | 29 | 44 | 1 | 2.55e-15 | <1.00e-15 | <4.65e-14 |
| 4 | P53HYPOXIAPATHWAY | Hypoxia induces p53 accumulation and consequent apoptosis with p53-mediated cell cycle arrest, which is present under conditions of DNA damage. | ABCB1, AKT1, ATM, BAX, CDKN1A, CPB2, CSNK1A1, CSNK1D, FHL2, GADD45A, HIC1, HIF1A, HSPA1A, HSPCA, IGFBP3, MAPK8, MDM2, NFKBIB, NQO1, TP53 | 19 | ABCB1(10), AKT1(1), ATM(4), CDKN1A(1), CSNK1D(1), MDM2(2), TP53(97) | 8872453 | 116 | 94 | 79 | 4 | 35 | 18 | 13 | 26 | 24 | 0 | 3.56e-11 | <1.00e-15 | <4.65e-14 |
| 5 | RNAPATHWAY | dsRNA-activated protein kinase phosphorylates elF2a, which generally inhibits translation, and activates NF-kB to provoke inflammation. | CHUK, DNAJC3, EIF2S1, EIF2S2, MAP3K14, NFKB1, NFKBIA, PRKR, RELA, TP53 | 9 | CHUK(1), EIF2S2(1), NFKB1(1), NFKBIA(1), TP53(97) | 4216169 | 101 | 83 | 64 | 1 | 30 | 15 | 12 | 24 | 20 | 0 | 3.86e-12 | <1.00e-15 | <4.65e-14 |
| 6 | ERBB3PATHWAY | Neuregulins bind to the receptor tyrosine kinases ErbB3 and ErbB4, surface-localized receptors whose overexpression induces tumor formation. | EGF, EGFR, ERBB3, NRG1, UBE2D1 | 5 | EGF(3), EGFR(92), NRG1(2) | 4366865 | 97 | 79 | 49 | 11 | 10 | 43 | 2 | 36 | 6 | 0 | 1.88e-05 | <1.00e-15 | <4.65e-14 |
| 7 | TPOPATHWAY | Thrombopoietin binds to its receptor and activates cell growth through the Erk and JNK MAP kinase pathways, protein kinase C, and JAK/STAT activation. | CSNK2A1, FOS, GRB2, HRAS, JAK2, JUN, MAP2K1, MAPK3, MPL, PIK3CA, PIK3R1, PLCG1, PRKCA, PRKCB1, RAF1, RASA1, SHC1, SOS1, STAT1, STAT3, STAT5A, STAT5B, THPO | 22 | FOS(1), JAK2(1), MAP2K1(1), MAPK3(1), MPL(3), PIK3CA(33), PIK3R1(33), PLCG1(6), PRKCA(1), RAF1(1), SOS1(3), STAT1(2), STAT3(1), THPO(1) | 12700557 | 88 | 79 | 77 | 3 | 11 | 13 | 14 | 20 | 30 | 0 | 6.82e-07 | <1.00e-15 | <4.65e-14 |
| 8 | BADPATHWAY | When phosphorylated, BAD is inhibited by sequestration; when non-phosphorylated, it promotes apoptosis by inactivating pro-survival BCL-XL and BCL-2. | ADCY1, AKT1, BAD, BAX, BCL2, BCL2L1, CSF2RB, IGF1, IGF1R, IL3, IL3RA, KIT, KITLG, PIK3CA, PIK3R1, PRKACB, PRKACG, PRKAR1A, PRKAR1B, PRKAR2A, PRKAR2B, YWHAH | 22 | ADCY1(3), AKT1(1), BCL2(2), CSF2RB(4), IGF1(2), IGF1R(3), IL3(1), IL3RA(2), KIT(3), KITLG(1), PIK3CA(33), PIK3R1(33), PRKAR1B(1), PRKAR2B(1), YWHAH(1) | 9316577 | 91 | 78 | 79 | 6 | 15 | 12 | 13 | 18 | 33 | 0 | 1.23e-05 | <1.00e-15 | <4.65e-14 |
| 9 | CDC42RACPATHWAY | PI3 kinase stimulates cell migration by activating cdc42, which activates ARP2/3, which in turn promotes formation of new actin fibers. | ACTR2, ACTR3, ARHA, ARPC1A, ARPC1B, ARPC2, ARPC3, ARPC4, CDC42, PAK1, PDGFRA, PIK3CA, PIK3R1, RAC1, WASL | 14 | ARPC2(1), ARPC4(1), PAK1(1), PDGFRA(13), PIK3CA(33), PIK3R1(33) | 5669242 | 82 | 72 | 70 | 2 | 5 | 15 | 13 | 17 | 32 | 0 | 1.78e-06 | <1.00e-15 | <4.65e-14 |
| 10 | PAR1PATHWAY | Activated extracellular thrombin cleaves and activates the G-protein coupled receptors PAR1 and PAR4, which activate platelets. | ADCY1, ARHA, ARHGEF1, F2, F2R, F2RL3, GNA12, GNA13, GNAI1, GNAQ, GNB1, GNGT1, MAP3K7, PIK3CA, PIK3R1, PLCB1, PPP1R12B, PRKCA, PRKCB1, PTK2B, ROCK1 | 19 | ADCY1(3), F2(1), F2RL3(2), GNB1(1), MAP3K7(3), PIK3CA(33), PIK3R1(33), PLCB1(1), PPP1R12B(1), PRKCA(1), PTK2B(3), ROCK1(2) | 11028541 | 84 | 70 | 73 | 3 | 13 | 13 | 12 | 15 | 31 | 0 | 1.06e-06 | <1.00e-15 | <4.65e-14 |
Table 6. Get Full Table A Ranked List of Significantly Mutated Genesets (Excluding Significantly Mutated Genes). Number of significant genesets found: 0. Number of genesets displayed: 10
| rank | geneset | description | genes | N_genes | mut_tally | N | n | npat | nsite | nsil | n1 | n2 | n3 | n4 | n5 | n6 | p_ns_s | p | q |
|---|---|---|---|---|---|---|---|---|---|---|---|---|---|---|---|---|---|---|---|
| 1 | IL17PATHWAY | Activated T cells secrete IL-17, which stimulates fibroblasts and other cells to secrete inflammatory and hematopoietic cytokines. | CD2, CD34, CD3D, CD3E, CD3G, CD3Z, CD4, CD58, CD8A, CSF3, IL17, IL3, IL6, IL8, KITLG, TRA@, TRB@ | 13 | CD2(1), CD3E(2), CD3G(1), CD4(1), CD58(1), CD8A(1), IL3(1), IL6(1), KITLG(1) | 2644975 | 10 | 10 | 10 | 1 | 3 | 1 | 1 | 3 | 2 | 0 | 0.15 | 0.0047 | 0.93 |
| 2 | IL18PATHWAY | Pro-inflammatory IL-18 is activated in macrophages by caspase-1 cleavage and, in conjunction with IL-12, stimulates Th1 cell differentiation. | CASP1, IFNG, IL12A, IL12B, IL18, IL2 | 6 | CASP1(2), IFNG(2), IL12B(2) | 1269839 | 6 | 6 | 6 | 1 | 2 | 1 | 1 | 0 | 2 | 0 | 0.34 | 0.0057 | 0.93 |
| 3 | ACE_INHIBITOR_PATHWAY_PHARMGKB | ACE, AGT, AGTR1, AGTR2, BDKRB2, KNG1, NOS3, REN | 8 | ACE(5), AGT(1), AGTR1(1), AGTR2(1), KNG1(2), NOS3(3), REN(5) | 4284311 | 18 | 18 | 17 | 2 | 10 | 2 | 0 | 2 | 4 | 0 | 0.04 | 0.0063 | 0.93 | |
| 4 | TCAPOPTOSISPATHWAY | HIV infection upregulates Fas ligand in macrophages and CD4 in helper T cells, leading to widespread Fas-induced T cell apoptosis. | CCR5, CD28, CD3D, CD3E, CD3G, CD3Z, CD4, TNFRSF6, TNFSF6, TRA@, TRB@ | 6 | CCR5(1), CD28(1), CD3E(2), CD3G(1), CD4(1) | 1364210 | 6 | 6 | 6 | 1 | 3 | 0 | 1 | 1 | 1 | 0 | 0.36 | 0.012 | 0.93 |
| 5 | TH1TH2PATHWAY | Helper T subtype Th1 produces pro-inflammatory cytokines that stimulate phagocytosis, while Th2 cells promote antibody production and activate eosinophils. | CD28, CD86, HLA-DRA, HLA-DRB1, IFNG, IFNGR1, IFNGR2, IL12A, IL12B, IL12RB1, IL12RB2, IL18, IL18R1, IL2, IL2RA, IL4, IL4R, TNFRSF5, TNFSF5 | 16 | CD28(1), CD86(2), HLA-DRA(1), IFNG(2), IFNGR1(1), IFNGR2(3), IL12B(2), IL12RB1(2), IL12RB2(2), IL18R1(2) | 4681327 | 18 | 17 | 18 | 3 | 10 | 0 | 3 | 3 | 2 | 0 | 0.088 | 0.012 | 0.93 |
| 6 | FXRPATHWAY | The nuclear receptor transcription factors FXR and LXR are activated by cholesterol metabolites and regulate cholesterol homeostasis. | FABP6, LDLR, NR0B2, NR1H3, NR1H4, RXRA | 6 | FABP6(1), LDLR(3), NR0B2(1), NR1H4(3), RXRA(3) | 2319597 | 11 | 11 | 11 | 2 | 4 | 2 | 0 | 4 | 1 | 0 | 0.24 | 0.012 | 0.93 |
| 7 | HSA00472_D_ARGININE_AND_D_ORNITHINE_METABOLISM | Genes involved in D-arginine and D-ornithine metabolism | DAO | 1 | DAO(3) | 306178 | 3 | 3 | 3 | 0 | 2 | 1 | 0 | 0 | 0 | 0 | 0.3 | 0.013 | 0.93 |
| 8 | IFNGPATHWAY | IFN gamma signaling pathway | IFNG, IFNGR1, IFNGR2, JAK1, JAK2, STAT1 | 6 | IFNG(2), IFNGR1(1), IFNGR2(3), JAK1(2), JAK2(1), STAT1(2) | 3472100 | 11 | 11 | 11 | 0 | 0 | 0 | 3 | 5 | 3 | 0 | 0.067 | 0.013 | 0.93 |
| 9 | TCRMOLECULE | T Cell Receptor and CD3 Complex | CD3D, CD3E, CD3G, CD3Z, TRA@, TRB@ | 3 | CD3E(2), CD3G(1) | 483380 | 3 | 3 | 3 | 0 | 0 | 0 | 1 | 1 | 1 | 0 | 0.42 | 0.014 | 0.93 |
| 10 | EOSINOPHILSPATHWAY | Recruitment of eosinophils in the inflammatory response observed in asthma occurs via the chemoattractant eotaxin binding to the CCR3 receptor. | CCL11, CCL5, CCR3, CSF2, HLA-DRA, HLA-DRB1, IL3, IL5 | 8 | CCR3(1), CSF2(2), HLA-DRA(1), IL3(1) | 1289447 | 5 | 5 | 5 | 0 | 2 | 1 | 1 | 0 | 1 | 0 | 0.2 | 0.024 | 1 |
In brief, we tabulate the number of mutations and the number of covered bases for each gene. The counts are broken down by mutation context category: four context categories that are discovered by MutSig, and one for indel and 'null' mutations, which include indels, nonsense mutations, splice-site mutations, and non-stop (read-through) mutations. For each gene, we calculate the probability of seeing the observed constellation of mutations, i.e. the product P1 x P2 x ... x Pm, or a more extreme one, given the background mutation rates calculated across the dataset. [1]
In addition to the links below, the full results of the analysis summarized in this report can also be downloaded programmatically using firehose_get, or interactively from either the Broad GDAC website or TCGA Data Coordination Center Portal.