This pipeline computes the correlation between APOBRC groups and selected clinical features.
Testing the association between APOBEC groups identified by 2 different apobec score and 14 clinical features across 511 patients, 6 significant findings detected with Q value < 0.25.
-
3 subtypes identified in current cancer cohort by 'APOBEC MUTLOAD MINESTIMATE'. These subtypes correlate to 'YEARS_TO_BIRTH', 'PATHOLOGY_T_STAGE', and 'GENDER'.
-
3 subtypes identified in current cancer cohort by 'APOBEC ENRICH'. These subtypes correlate to 'YEARS_TO_BIRTH', 'GENDER', and 'YEAR_OF_TOBACCO_SMOKING_ONSET'.
Table 1. Get Full Table Overview of the association between APOBEC groups by 2 different APOBEC scores and 14 clinical features. Shown in the table are P values (Q values). Thresholded by Q value < 0.25, 6 significant findings detected.
|
Clinical Features |
Statistical Tests |
APOBEC MUTLOAD MINESTIMATE |
APOBEC ENRICH |
| Time to Death | logrank test |
0.267 (0.623) |
0.245 (0.623) |
| YEARS TO BIRTH | Kruskal-Wallis (anova) |
0.000556 (0.0156) |
0.0032 (0.0415) |
| PATHOLOGIC STAGE | Fisher's exact test |
0.315 (0.666) |
0.48 (0.707) |
| PATHOLOGY T STAGE | Fisher's exact test |
0.0475 (0.222) |
0.625 (0.828) |
| PATHOLOGY N STAGE | Fisher's exact test |
0.227 (0.623) |
0.464 (0.707) |
| PATHOLOGY M STAGE | Fisher's exact test |
1 (1.00) |
1 (1.00) |
| GENDER | Fisher's exact test |
0.00445 (0.0415) |
0.044 (0.222) |
| RADIATION THERAPY | Fisher's exact test |
0.648 (0.828) |
0.346 (0.666) |
| HISTOLOGICAL TYPE | Fisher's exact test |
0.783 (0.914) |
0.899 (1.00) |
| NUMBER PACK YEARS SMOKED | Kruskal-Wallis (anova) |
0.106 (0.37) |
0.214 (0.623) |
| YEAR OF TOBACCO SMOKING ONSET | Kruskal-Wallis (anova) |
0.357 (0.666) |
0.0321 (0.222) |
| NUMBER OF LYMPH NODES | Kruskal-Wallis (anova) |
0.467 (0.707) |
0.0884 (0.354) |
| RACE | Fisher's exact test |
0.462 (0.707) |
0.68 (0.828) |
| ETHNICITY | Fisher's exact test |
0.963 (1.00) |
0.665 (0.828) |
Table S1. Description of APOBEC group #1: 'APOBEC MUTLOAD MINESTIMATE'
| Cluster Labels | 0 | HIGH | LOW |
|---|---|---|---|
| Number of samples | 246 | 129 | 136 |
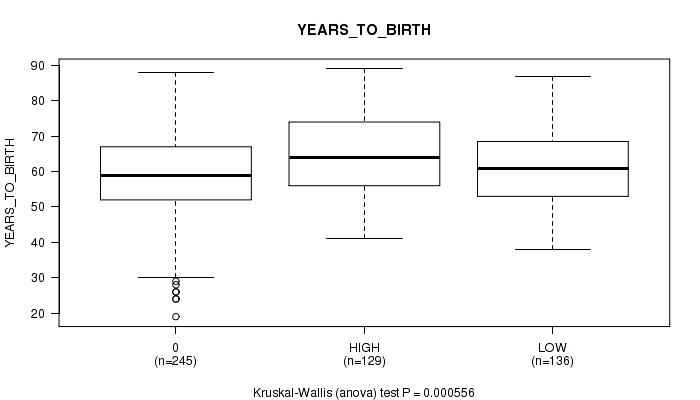
P value = 0.000556 (Kruskal-Wallis (anova)), Q value = 0.016
Table S2. Clustering Approach #1: 'APOBEC MUTLOAD MINESTIMATE' versus Clinical Feature #2: 'YEARS_TO_BIRTH'
| nPatients | Mean (Std.Dev) | |
|---|---|---|
| ALL | 510 | 61.0 (12.0) |
| 0 | 245 | 58.8 (12.2) |
| HIGH | 129 | 64.6 (11.3) |
| LOW | 136 | 61.7 (11.2) |
Figure S1. Get High-res Image Clustering Approach #1: 'APOBEC MUTLOAD MINESTIMATE' versus Clinical Feature #2: 'YEARS_TO_BIRTH'
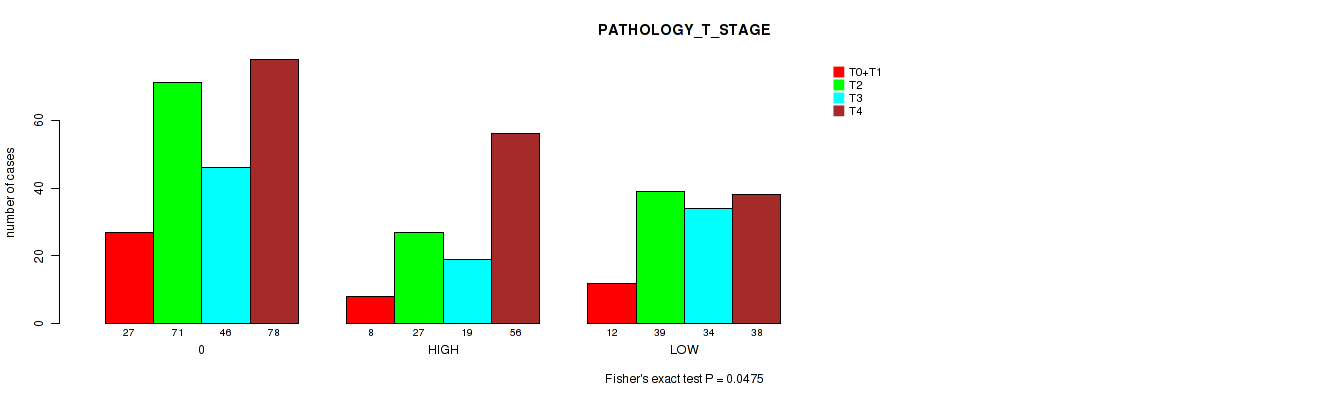
P value = 0.0475 (Fisher's exact test), Q value = 0.22
Table S3. Clustering Approach #1: 'APOBEC MUTLOAD MINESTIMATE' versus Clinical Feature #4: 'PATHOLOGY_T_STAGE'
| nPatients | T0+T1 | T2 | T3 | T4 |
|---|---|---|---|---|
| ALL | 47 | 137 | 99 | 172 |
| 0 | 27 | 71 | 46 | 78 |
| HIGH | 8 | 27 | 19 | 56 |
| LOW | 12 | 39 | 34 | 38 |
Figure S2. Get High-res Image Clustering Approach #1: 'APOBEC MUTLOAD MINESTIMATE' versus Clinical Feature #4: 'PATHOLOGY_T_STAGE'
P value = 0.00445 (Fisher's exact test), Q value = 0.042
Table S4. Clustering Approach #1: 'APOBEC MUTLOAD MINESTIMATE' versus Clinical Feature #7: 'GENDER'
| nPatients | FEMALE | MALE |
|---|---|---|
| ALL | 138 | 373 |
| 0 | 54 | 192 |
| HIGH | 49 | 80 |
| LOW | 35 | 101 |
Figure S3. Get High-res Image Clustering Approach #1: 'APOBEC MUTLOAD MINESTIMATE' versus Clinical Feature #7: 'GENDER'
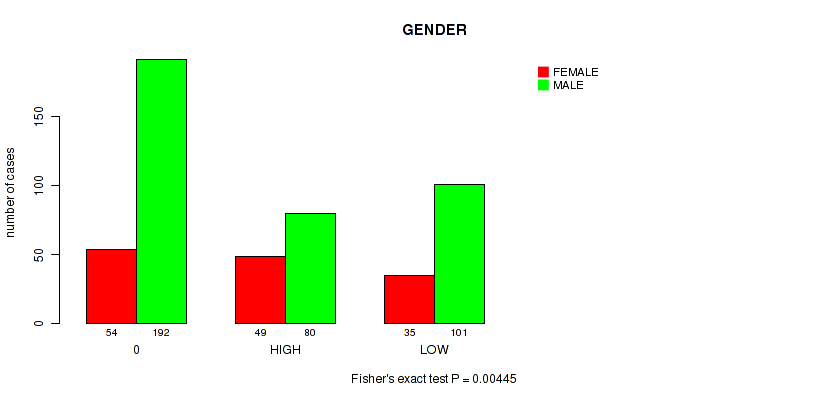
Table S5. Description of APOBEC group #2: 'APOBEC ENRICH'
| Cluster Labels | FC.HIGH.ENRICH | FC.LOW.ENRICH | FC.NO.ENRICH |
|---|---|---|---|
| Number of samples | 224 | 41 | 246 |
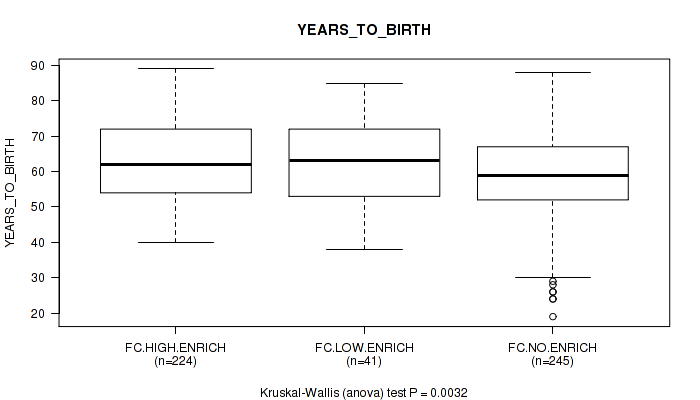
P value = 0.0032 (Kruskal-Wallis (anova)), Q value = 0.042
Table S6. Clustering Approach #2: 'APOBEC ENRICH' versus Clinical Feature #2: 'YEARS_TO_BIRTH'
| nPatients | Mean (Std.Dev) | |
|---|---|---|
| ALL | 510 | 61.0 (12.0) |
| FC.HIGH.ENRICH | 224 | 63.3 (11.2) |
| FC.LOW.ENRICH | 41 | 62.2 (12.3) |
| FC.NO.ENRICH | 245 | 58.8 (12.2) |
Figure S4. Get High-res Image Clustering Approach #2: 'APOBEC ENRICH' versus Clinical Feature #2: 'YEARS_TO_BIRTH'
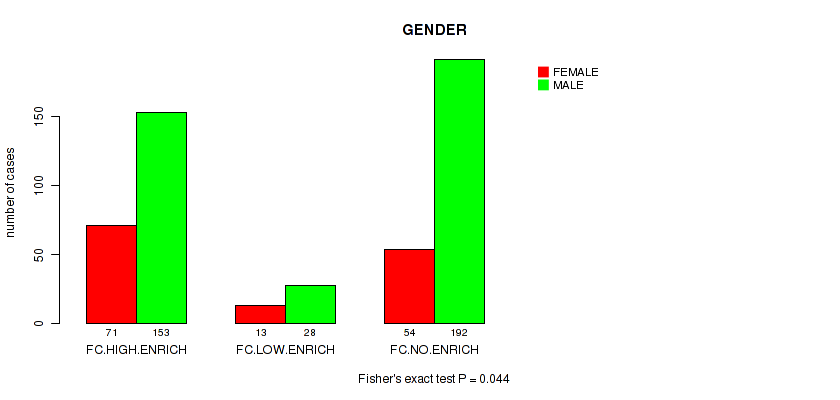
P value = 0.044 (Fisher's exact test), Q value = 0.22
Table S7. Clustering Approach #2: 'APOBEC ENRICH' versus Clinical Feature #7: 'GENDER'
| nPatients | FEMALE | MALE |
|---|---|---|
| ALL | 138 | 373 |
| FC.HIGH.ENRICH | 71 | 153 |
| FC.LOW.ENRICH | 13 | 28 |
| FC.NO.ENRICH | 54 | 192 |
Figure S5. Get High-res Image Clustering Approach #2: 'APOBEC ENRICH' versus Clinical Feature #7: 'GENDER'
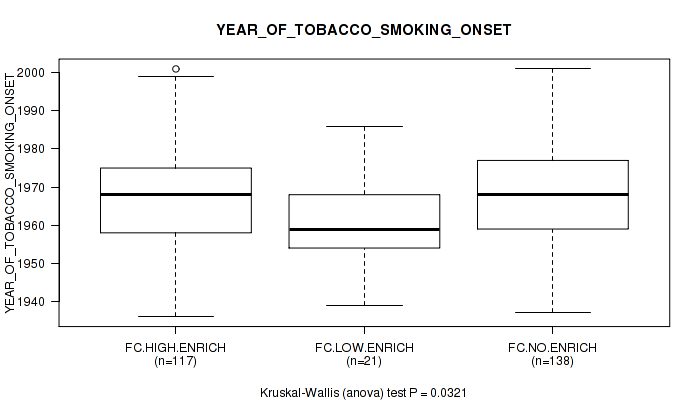
P value = 0.0321 (Kruskal-Wallis (anova)), Q value = 0.22
Table S8. Clustering Approach #2: 'APOBEC ENRICH' versus Clinical Feature #11: 'YEAR_OF_TOBACCO_SMOKING_ONSET'
| nPatients | Mean (Std.Dev) | |
|---|---|---|
| ALL | 276 | 1967.3 (12.8) |
| FC.HIGH.ENRICH | 117 | 1967.2 (13.4) |
| FC.LOW.ENRICH | 21 | 1960.5 (12.4) |
| FC.NO.ENRICH | 138 | 1968.5 (12.1) |
Figure S6. Get High-res Image Clustering Approach #2: 'APOBEC ENRICH' versus Clinical Feature #11: 'YEAR_OF_TOBACCO_SMOKING_ONSET'
-
APOBEC groups file = /xchip/cga/gdac-prod/tcga-gdac/jobResults/APOBEC_Pipelines/HNSC-TP/22536208/APOBEC_clinical_corr_input_22541982/APOBEC_for_clinical.correlaion.input.categorical.txt
-
Clinical data file = /xchip/cga/gdac-prod/tcga-gdac/jobResults/Append_Data/HNSC-TP/22506490/HNSC-TP.merged_data.txt
-
Number of patients = 511
-
Number of selected clinical features = 14
APOBEC classification based on APOBEC_MutLoad_MinEstimate : a. APOBEC non group -- samples with zero value, b. APOBEC high group -- samples above median value in non zero samples, c. APOBEC low group -- samples below median value in non zero samples.
APOBEC classification based on APOBEC_enrich : a. No Enrichmment group -- all samples with BH_Fisher_p-value_tCw > 0.05, b. Low enrichment group -- samples with BH_Fisher_p-value_tCw = < 0.05 and APOBEC_enrich=<2, c. High enrichment group -- samples with BH_Fisher_p-value_tCw =< 0.05 and APOBEC_enrich>2.
For survival clinical features, the Kaplan-Meier survival curves of tumors with and without gene mutations were plotted and the statistical significance P values were estimated by logrank test (Bland and Altman 2004) using the 'survdiff' function in R
For binary clinical features, two-tailed Fisher's exact tests (Fisher 1922) were used to estimate the P values using the 'fisher.test' function in R
For multiple hypothesis correction, Q value is the False Discovery Rate (FDR) analogue of the P value (Benjamini and Hochberg 1995), defined as the minimum FDR at which the test may be called significant. We used the 'Benjamini and Hochberg' method of 'p.adjust' function in R to convert P values into Q values.
In addition to the links below, the full results of the analysis summarized in this report can also be downloaded programmatically using firehose_get, or interactively from either the Broad GDAC website or TCGA Data Coordination Center Portal.