This pipeline computes the correlation between significant arm-level copy number variations (cnvs) and selected clinical features.
Testing the association between copy number variation 63 arm-level events and 12 clinical features across 66 patients, 6 significant findings detected with Q value < 0.25.
-
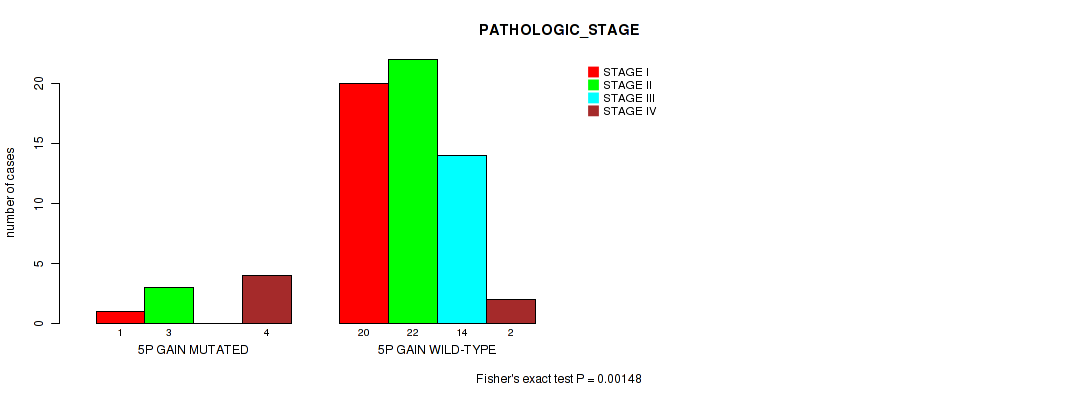
5p gain cnv correlated to 'PATHOLOGIC_STAGE'.
-
5q gain cnv correlated to 'PATHOLOGIC_STAGE'.
-
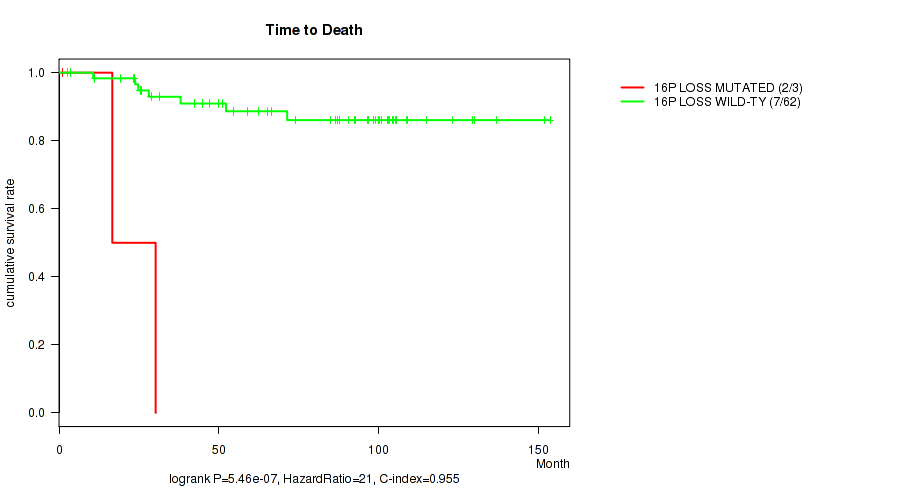
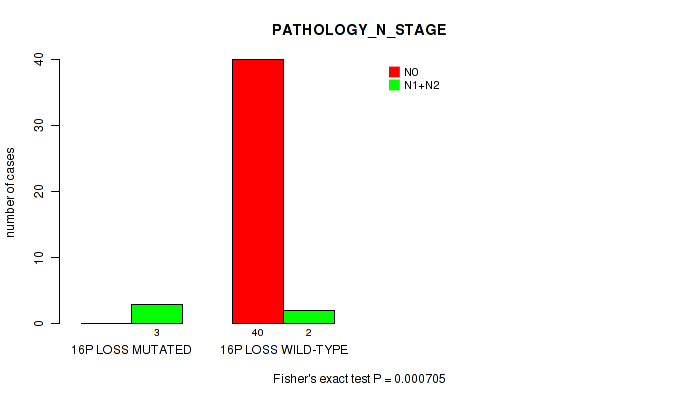
16p loss cnv correlated to 'Time to Death' and 'PATHOLOGY_N_STAGE'.
-
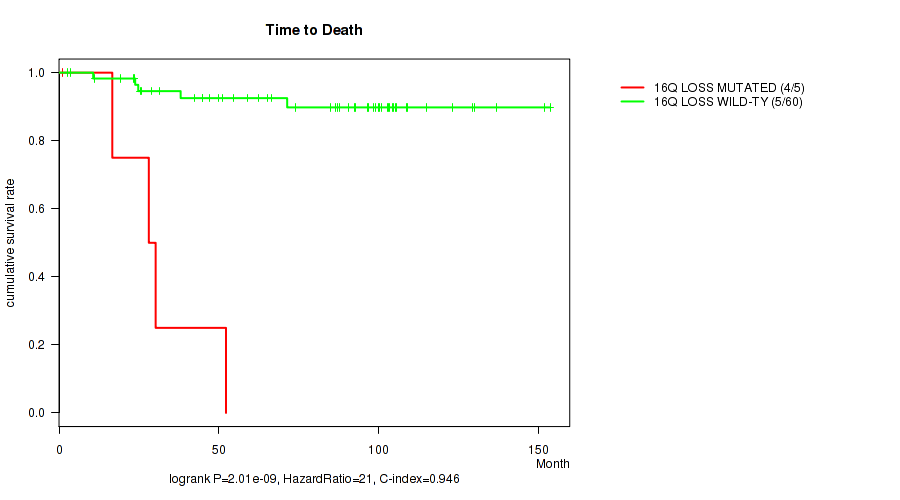
16q loss cnv correlated to 'Time to Death' and 'PATHOLOGY_N_STAGE'.
Table 1. Get Full Table Overview of the association between significant copy number variation of 63 arm-level events and 12 clinical features. Shown in the table are P values (Q values). Thresholded by Q value < 0.25, 6 significant findings detected.
|
Clinical Features |
Time to Death |
YEARS TO BIRTH |
PATHOLOGIC STAGE |
PATHOLOGY T STAGE |
PATHOLOGY N STAGE |
PATHOLOGY M STAGE |
GENDER |
KARNOFSKY PERFORMANCE SCORE |
NUMBER PACK YEARS SMOKED |
YEAR OF TOBACCO SMOKING ONSET |
RACE | ETHNICITY | ||
| nCNV (%) | nWild-Type | logrank test | Wilcoxon-test | Fisher's exact test | Fisher's exact test | Fisher's exact test | Fisher's exact test | Fisher's exact test | Fisher's exact test | Wilcoxon-test | Wilcoxon-test | Fisher's exact test | Fisher's exact test | |
| 16p loss | 3 (5%) | 63 |
5.46e-07 (0.000206) |
0.926 (1.00) |
0.00489 (0.37) |
0.0257 (0.616) |
0.000705 (0.133) |
1 (1.00) |
1 (1.00) |
1 (1.00) |
1 (1.00) |
|||
| 16q loss | 5 (8%) | 61 |
2.01e-09 (1.52e-06) |
0.221 (0.874) |
0.00476 (0.37) |
0.0476 (0.628) |
0.000165 (0.0415) |
0.11 (0.704) |
0.641 (1.00) |
1 (1.00) |
1 (1.00) |
|||
| 5p gain | 8 (12%) | 58 |
0.00702 (0.408) |
0.0661 (0.639) |
0.00148 (0.186) |
0.364 (1.00) |
0.0874 (0.642) |
0.00952 (0.424) |
0.455 (1.00) |
1 (1.00) |
1 (1.00) |
|||
| 5q gain | 8 (12%) | 58 |
0.00702 (0.408) |
0.0661 (0.639) |
0.00135 (0.186) |
0.365 (1.00) |
0.0874 (0.642) |
0.00952 (0.424) |
0.455 (1.00) |
1 (1.00) |
1 (1.00) |
|||
| 3p gain | 8 (12%) | 58 |
0.00834 (0.42) |
0.0837 (0.639) |
0.0164 (0.539) |
0.465 (1.00) |
0.0327 (0.616) |
0.213 (0.86) |
0.128 (0.706) |
1 (1.00) |
0.294 (0.947) |
1 (1.00) |
||
| 3q gain | 8 (12%) | 58 |
0.00834 (0.42) |
0.0837 (0.639) |
0.0162 (0.539) |
0.462 (1.00) |
0.0327 (0.616) |
0.213 (0.86) |
0.128 (0.706) |
1 (1.00) |
0.295 (0.947) |
1 (1.00) |
||
| 4p gain | 23 (35%) | 43 |
0.876 (1.00) |
0.22 (0.874) |
0.0375 (0.616) |
0.585 (1.00) |
1 (1.00) |
0.124 (0.704) |
1 (1.00) |
0.528 (1.00) |
0.0317 (0.616) |
1 (1.00) |
0.277 (0.947) |
|
| 4q gain | 24 (36%) | 42 |
0.885 (1.00) |
0.265 (0.945) |
0.14 (0.726) |
0.809 (1.00) |
1 (1.00) |
0.124 (0.704) |
1 (1.00) |
0.528 (1.00) |
0.0467 (0.628) |
0.0369 (0.616) |
1 (1.00) |
0.287 (0.947) |
| 7p gain | 24 (36%) | 42 |
0.0281 (0.616) |
0.172 (0.759) |
0.362 (1.00) |
0.691 (1.00) |
0.636 (1.00) |
0.124 (0.704) |
0.195 (0.832) |
0.528 (1.00) |
0.784 (1.00) |
0.0606 (0.628) |
1 (1.00) |
0.303 (0.947) |
| 7q gain | 24 (36%) | 42 |
0.0281 (0.616) |
0.172 (0.759) |
0.363 (1.00) |
0.692 (1.00) |
0.636 (1.00) |
0.124 (0.704) |
0.195 (0.832) |
0.528 (1.00) |
0.784 (1.00) |
0.0606 (0.628) |
1 (1.00) |
0.303 (0.947) |
| 8p gain | 16 (24%) | 50 |
0.957 (1.00) |
0.134 (0.721) |
0.582 (1.00) |
0.621 (1.00) |
0.639 (1.00) |
0.4 (1.00) |
0.4 (1.00) |
0.528 (1.00) |
0.394 (1.00) |
1 (1.00) |
0.57 (1.00) |
|
| 8q gain | 17 (26%) | 49 |
0.957 (1.00) |
0.142 (0.726) |
0.296 (0.947) |
0.64 (1.00) |
0.639 (1.00) |
0.0571 (0.628) |
0.391 (1.00) |
0.528 (1.00) |
0.394 (1.00) |
1 (1.00) |
0.57 (1.00) |
|
| 9p gain | 10 (15%) | 56 |
0.624 (1.00) |
0.979 (1.00) |
0.122 (0.704) |
0.196 (0.832) |
0.306 (0.947) |
1 (1.00) |
1 (1.00) |
1 (1.00) |
0.759 (1.00) |
0.377 (1.00) |
0.535 (1.00) |
|
| 9q gain | 10 (15%) | 56 |
0.624 (1.00) |
0.979 (1.00) |
0.122 (0.704) |
0.195 (0.832) |
0.306 (0.947) |
1 (1.00) |
1 (1.00) |
1 (1.00) |
0.759 (1.00) |
0.374 (1.00) |
0.535 (1.00) |
|
| 10p gain | 4 (6%) | 62 |
0.558 (1.00) |
0.34 (0.994) |
0.269 (0.947) |
0.455 (1.00) |
1 (1.00) |
1 (1.00) |
1 (1.00) |
1 (1.00) |
||||
| 11p gain | 15 (23%) | 51 |
0.956 (1.00) |
0.812 (1.00) |
0.741 (1.00) |
0.814 (1.00) |
0.617 (1.00) |
0.443 (1.00) |
1 (1.00) |
1 (1.00) |
0.0467 (0.628) |
0.0369 (0.616) |
0.558 (1.00) |
0.0756 (0.639) |
| 11q gain | 15 (23%) | 51 |
0.485 (1.00) |
0.945 (1.00) |
0.741 (1.00) |
0.81 (1.00) |
1 (1.00) |
0.443 (1.00) |
1 (1.00) |
1 (1.00) |
0.0467 (0.628) |
0.0369 (0.616) |
0.56 (1.00) |
0.0756 (0.639) |
| 12p gain | 19 (29%) | 47 |
0.661 (1.00) |
0.0137 (0.493) |
0.0766 (0.639) |
0.318 (0.962) |
1 (1.00) |
0.0873 (0.642) |
0.412 (1.00) |
0.528 (1.00) |
0.357 (1.00) |
1 (1.00) |
1 (1.00) |
|
| 12q gain | 20 (30%) | 46 |
0.209 (0.86) |
0.0696 (0.639) |
0.11 (0.704) |
0.709 (1.00) |
0.33 (0.986) |
0.0873 (0.642) |
0.593 (1.00) |
0.528 (1.00) |
0.234 (0.894) |
0.0369 (0.616) |
0.806 (1.00) |
1 (1.00) |
| 14q gain | 21 (32%) | 45 |
0.819 (1.00) |
0.144 (0.726) |
0.0971 (0.683) |
0.384 (1.00) |
1 (1.00) |
0.105 (0.704) |
0.794 (1.00) |
0.528 (1.00) |
0.234 (0.894) |
0.0369 (0.616) |
1 (1.00) |
0.609 (1.00) |
| 15q gain | 21 (32%) | 45 |
0.34 (0.994) |
0.283 (0.947) |
0.412 (1.00) |
0.477 (1.00) |
0.35 (1.00) |
0.105 (0.704) |
0.794 (1.00) |
0.528 (1.00) |
1 (1.00) |
0.233 (0.894) |
0.815 (1.00) |
0.124 (0.704) |
| 16p gain | 22 (33%) | 44 |
0.572 (1.00) |
0.791 (1.00) |
0.347 (1.00) |
0.643 (1.00) |
1 (1.00) |
0.124 (0.704) |
1 (1.00) |
0.528 (1.00) |
0.0467 (0.628) |
0.0369 (0.616) |
1 (1.00) |
0.124 (0.704) |
| 16q gain | 21 (32%) | 45 |
0.217 (0.873) |
0.995 (1.00) |
0.474 (1.00) |
0.403 (1.00) |
0.635 (1.00) |
1 (1.00) |
1 (1.00) |
0.528 (1.00) |
0.0467 (0.628) |
0.0369 (0.616) |
1 (1.00) |
0.124 (0.704) |
| 18p gain | 17 (26%) | 49 |
0.872 (1.00) |
0.278 (0.947) |
0.287 (0.947) |
0.434 (1.00) |
0.303 (0.947) |
0.4 (1.00) |
0.776 (1.00) |
1 (1.00) |
0.298 (0.947) |
1 (1.00) |
0.57 (1.00) |
|
| 18q gain | 16 (24%) | 50 |
0.355 (1.00) |
0.525 (1.00) |
0.311 (0.949) |
0.199 (0.841) |
0.303 (0.947) |
0.4 (1.00) |
1 (1.00) |
1 (1.00) |
0.298 (0.947) |
1 (1.00) |
0.305 (0.947) |
|
| 19p gain | 20 (30%) | 46 |
0.0332 (0.616) |
0.0344 (0.616) |
0.0135 (0.493) |
0.418 (1.00) |
0.00358 (0.344) |
0.0714 (0.639) |
0.593 (1.00) |
1 (1.00) |
0.784 (1.00) |
0.0606 (0.628) |
0.365 (1.00) |
0.29 (0.947) |
| 19q gain | 18 (27%) | 48 |
0.154 (0.741) |
0.0171 (0.539) |
0.227 (0.892) |
0.448 (1.00) |
0.166 (0.757) |
0.0571 (0.628) |
1 (1.00) |
1 (1.00) |
1 (1.00) |
0.233 (0.894) |
0.468 (1.00) |
0.29 (0.947) |
| 20p gain | 22 (33%) | 44 |
0.0945 (0.68) |
0.0642 (0.638) |
0.264 (0.945) |
0.896 (1.00) |
0.141 (0.726) |
0.524 (1.00) |
0.426 (1.00) |
0.528 (1.00) |
0.784 (1.00) |
0.0606 (0.628) |
0.371 (1.00) |
0.634 (1.00) |
| 20q gain | 22 (33%) | 44 |
0.0945 (0.68) |
0.0642 (0.638) |
0.266 (0.945) |
0.897 (1.00) |
0.141 (0.726) |
0.524 (1.00) |
0.426 (1.00) |
0.528 (1.00) |
0.784 (1.00) |
0.0606 (0.628) |
0.37 (1.00) |
0.634 (1.00) |
| 21q gain | 4 (6%) | 62 |
0.496 (1.00) |
0.591 (1.00) |
1 (1.00) |
1 (1.00) |
1 (1.00) |
1 (1.00) |
1 (1.00) |
1 (1.00) |
||||
| 22q gain | 19 (29%) | 47 |
0.164 (0.757) |
0.415 (1.00) |
0.494 (1.00) |
0.523 (1.00) |
0.166 (0.757) |
0.524 (1.00) |
0.412 (1.00) |
1 (1.00) |
0.784 (1.00) |
0.0606 (0.628) |
0.795 (1.00) |
0.588 (1.00) |
| xp gain | 8 (12%) | 58 |
0.34 (0.994) |
0.953 (1.00) |
0.906 (1.00) |
1 (1.00) |
1 (1.00) |
0.262 (0.943) |
1 (1.00) |
1 (1.00) |
0.57 (1.00) |
0.535 (1.00) |
||
| xq gain | 8 (12%) | 58 |
0.34 (0.994) |
0.953 (1.00) |
0.904 (1.00) |
1 (1.00) |
1 (1.00) |
0.262 (0.943) |
1 (1.00) |
1 (1.00) |
0.567 (1.00) |
0.535 (1.00) |
||
| 1p loss | 53 (80%) | 13 |
0.431 (1.00) |
0.478 (1.00) |
0.0289 (0.616) |
0.0416 (0.628) |
1 (1.00) |
0.162 (0.756) |
0.534 (1.00) |
0.51 (1.00) |
0.609 (1.00) |
1 (1.00) |
1 (1.00) |
|
| 1q loss | 51 (77%) | 15 |
0.823 (1.00) |
0.221 (0.874) |
0.0229 (0.616) |
0.0547 (0.628) |
0.529 (1.00) |
0.213 (0.86) |
0.563 (1.00) |
0.51 (1.00) |
1 (1.00) |
1 (1.00) |
||
| 2p loss | 46 (70%) | 20 |
0.941 (1.00) |
0.241 (0.906) |
0.145 (0.726) |
0.115 (0.704) |
1 (1.00) |
0.4 (1.00) |
0.284 (0.947) |
0.51 (1.00) |
1 (1.00) |
1 (1.00) |
||
| 2q loss | 46 (70%) | 20 |
0.941 (1.00) |
0.241 (0.906) |
0.144 (0.726) |
0.114 (0.704) |
1 (1.00) |
0.4 (1.00) |
0.284 (0.947) |
0.51 (1.00) |
1 (1.00) |
1 (1.00) |
||
| 3p loss | 9 (14%) | 57 |
0.193 (0.832) |
0.0465 (0.628) |
0.0757 (0.639) |
0.0235 (0.616) |
1 (1.00) |
1 (1.00) |
0.469 (1.00) |
1 (1.00) |
0.535 (1.00) |
|||
| 3q loss | 8 (12%) | 58 |
0.231 (0.894) |
0.107 (0.704) |
0.141 (0.726) |
0.0528 (0.628) |
1 (1.00) |
1 (1.00) |
0.256 (0.943) |
1 (1.00) |
0.535 (1.00) |
|||
| 5p loss | 10 (15%) | 56 |
0.771 (1.00) |
0.642 (1.00) |
0.134 (0.721) |
0.0831 (0.639) |
1 (1.00) |
1 (1.00) |
1 (1.00) |
0.423 (1.00) |
0.155 (0.741) |
0.0736 (0.639) |
0.158 (0.741) |
0.121 (0.704) |
| 5q loss | 10 (15%) | 56 |
0.771 (1.00) |
0.642 (1.00) |
0.132 (0.718) |
0.0833 (0.639) |
1 (1.00) |
1 (1.00) |
1 (1.00) |
0.423 (1.00) |
0.155 (0.741) |
0.0736 (0.639) |
0.157 (0.741) |
0.121 (0.704) |
| 6p loss | 51 (77%) | 15 |
0.579 (1.00) |
0.379 (1.00) |
0.082 (0.639) |
0.0566 (0.628) |
0.568 (1.00) |
0.356 (1.00) |
0.244 (0.909) |
0.51 (1.00) |
1 (1.00) |
1 (1.00) |
||
| 6q loss | 51 (77%) | 15 |
0.579 (1.00) |
0.379 (1.00) |
0.0831 (0.639) |
0.0554 (0.628) |
0.568 (1.00) |
0.356 (1.00) |
0.244 (0.909) |
0.51 (1.00) |
1 (1.00) |
1 (1.00) |
||
| 8p loss | 10 (15%) | 56 |
0.171 (0.759) |
0.788 (1.00) |
0.663 (1.00) |
0.324 (0.972) |
1 (1.00) |
1 (1.00) |
1 (1.00) |
1 (1.00) |
0.655 (1.00) |
0.555 (1.00) |
||
| 8q loss | 9 (14%) | 57 |
0.204 (0.858) |
0.594 (1.00) |
0.741 (1.00) |
0.438 (1.00) |
1 (1.00) |
1 (1.00) |
1 (1.00) |
1 (1.00) |
0.611 (1.00) |
0.566 (1.00) |
||
| 9p loss | 9 (14%) | 57 |
0.0505 (0.628) |
0.00653 (0.408) |
0.873 (1.00) |
0.906 (1.00) |
1 (1.00) |
1 (1.00) |
0.727 (1.00) |
1 (1.00) |
0.466 (1.00) |
|||
| 9q loss | 10 (15%) | 56 |
0.00364 (0.344) |
0.0116 (0.463) |
1 (1.00) |
1 (1.00) |
0.529 (1.00) |
1 (1.00) |
0.508 (1.00) |
1 (1.00) |
0.535 (1.00) |
|||
| 10p loss | 48 (73%) | 18 |
0.128 (0.706) |
0.762 (1.00) |
0.544 (1.00) |
0.395 (1.00) |
1 (1.00) |
0.31 (0.949) |
1 (1.00) |
0.559 (1.00) |
0.26 (0.943) |
1 (1.00) |
1 (1.00) |
|
| 10q loss | 49 (74%) | 17 |
0.146 (0.726) |
0.953 (1.00) |
0.346 (1.00) |
0.211 (0.86) |
1 (1.00) |
0.31 (0.949) |
1 (1.00) |
0.559 (1.00) |
0.26 (0.943) |
1 (1.00) |
1 (1.00) |
|
| 11p loss | 7 (11%) | 59 |
0.305 (0.947) |
0.0527 (0.628) |
0.0962 (0.683) |
0.0783 (0.639) |
0.461 (1.00) |
1 (1.00) |
0.691 (1.00) |
1 (1.00) |
1 (1.00) |
1 (1.00) |
||
| 11q loss | 7 (11%) | 59 |
0.305 (0.947) |
0.0527 (0.628) |
0.0976 (0.683) |
0.0774 (0.639) |
0.461 (1.00) |
1 (1.00) |
0.691 (1.00) |
1 (1.00) |
1 (1.00) |
1 (1.00) |
||
| 13q loss | 43 (65%) | 23 |
0.545 (1.00) |
0.0641 (0.638) |
0.447 (1.00) |
0.361 (1.00) |
0.301 (0.947) |
1 (1.00) |
0.294 (0.947) |
1 (1.00) |
0.474 (1.00) |
0.371 (1.00) |
0.817 (1.00) |
1 (1.00) |
| 17p loss | 50 (76%) | 16 |
0.788 (1.00) |
0.149 (0.729) |
0.0743 (0.639) |
0.0418 (0.628) |
0.568 (1.00) |
0.356 (1.00) |
0.158 (0.741) |
0.51 (1.00) |
1 (1.00) |
1 (1.00) |
||
| 17q loss | 50 (76%) | 16 |
0.788 (1.00) |
0.149 (0.729) |
0.0734 (0.639) |
0.0426 (0.628) |
0.568 (1.00) |
0.356 (1.00) |
0.158 (0.741) |
0.51 (1.00) |
1 (1.00) |
1 (1.00) |
||
| 18p loss | 7 (11%) | 59 |
0.859 (1.00) |
0.429 (1.00) |
0.313 (0.95) |
0.784 (1.00) |
0.166 (0.757) |
1 (1.00) |
0.432 (1.00) |
1 (1.00) |
0.255 (0.943) |
1 (1.00) |
||
| 18q loss | 9 (14%) | 57 |
0.3 (0.947) |
0.322 (0.969) |
0.0824 (0.639) |
0.49 (1.00) |
0.211 (0.86) |
1 (1.00) |
0.469 (1.00) |
1 (1.00) |
0.334 (0.994) |
1 (1.00) |
||
| 19q loss | 3 (5%) | 63 |
0.132 (0.718) |
0.423 (1.00) |
0.0114 (0.463) |
0.193 (0.832) |
0.0289 (0.616) |
1 (1.00) |
1 (1.00) |
0.101 (0.704) |
0.111 (0.704) |
|||
| 20p loss | 4 (6%) | 62 |
0.631 (1.00) |
0.237 (0.9) |
0.137 (0.726) |
0.142 (0.726) |
0.304 (0.947) |
1 (1.00) |
1 (1.00) |
1 (1.00) |
1 (1.00) |
1 (1.00) |
||
| 20q loss | 3 (5%) | 63 |
0.436 (1.00) |
0.432 (1.00) |
0.0415 (0.628) |
0.0257 (0.616) |
0.304 (0.947) |
1 (1.00) |
1 (1.00) |
1 (1.00) |
||||
| 21q loss | 35 (53%) | 31 |
0.0353 (0.616) |
0.375 (1.00) |
0.905 (1.00) |
0.781 (1.00) |
0.0731 (0.639) |
1 (1.00) |
0.805 (1.00) |
0.231 (0.894) |
0.705 (1.00) |
0.112 (0.704) |
0.546 (1.00) |
0.613 (1.00) |
| 22q loss | 8 (12%) | 58 |
0.29 (0.947) |
0.783 (1.00) |
0.179 (0.788) |
1 (1.00) |
0.211 (0.86) |
0.262 (0.943) |
0.0553 (0.628) |
1 (1.00) |
0.57 (1.00) |
0.39 (1.00) |
||
| xp loss | 38 (58%) | 28 |
0.865 (1.00) |
0.0808 (0.639) |
0.293 (0.947) |
0.544 (1.00) |
1 (1.00) |
1 (1.00) |
0.128 (0.706) |
1 (1.00) |
0.17 (0.759) |
0.112 (0.704) |
0.812 (1.00) |
1 (1.00) |
| xq loss | 38 (58%) | 28 |
0.34 (0.994) |
0.115 (0.704) |
0.549 (1.00) |
0.517 (1.00) |
1 (1.00) |
1 (1.00) |
0.311 (0.949) |
1 (1.00) |
0.17 (0.759) |
0.112 (0.704) |
0.815 (1.00) |
1 (1.00) |
P value = 0.00148 (Fisher's exact test), Q value = 0.19
Table S1. Gene #5: '5p gain' versus Clinical Feature #3: 'PATHOLOGIC_STAGE'
| nPatients | STAGE I | STAGE II | STAGE III | STAGE IV |
|---|---|---|---|---|
| ALL | 21 | 25 | 14 | 6 |
| 5P GAIN MUTATED | 1 | 3 | 0 | 4 |
| 5P GAIN WILD-TYPE | 20 | 22 | 14 | 2 |
Figure S1. Get High-res Image Gene #5: '5p gain' versus Clinical Feature #3: 'PATHOLOGIC_STAGE'
P value = 0.00135 (Fisher's exact test), Q value = 0.19
Table S2. Gene #6: '5q gain' versus Clinical Feature #3: 'PATHOLOGIC_STAGE'
| nPatients | STAGE I | STAGE II | STAGE III | STAGE IV |
|---|---|---|---|---|
| ALL | 21 | 25 | 14 | 6 |
| 5Q GAIN MUTATED | 1 | 3 | 0 | 4 |
| 5Q GAIN WILD-TYPE | 20 | 22 | 14 | 2 |
Figure S2. Get High-res Image Gene #6: '5q gain' versus Clinical Feature #3: 'PATHOLOGIC_STAGE'

P value = 5.46e-07 (logrank test), Q value = 0.00021
Table S3. Gene #51: '16p loss' versus Clinical Feature #1: 'Time to Death'
| nPatients | nDeath | Duration Range (Median), Month | |
|---|---|---|---|
| ALL | 65 | 9 | 1.0 - 153.7 (73.9) |
| 16P LOSS MUTATED | 3 | 2 | 1.0 - 30.2 (16.7) |
| 16P LOSS WILD-TYPE | 62 | 7 | 2.5 - 153.7 (85.7) |
Figure S3. Get High-res Image Gene #51: '16p loss' versus Clinical Feature #1: 'Time to Death'
P value = 0.000705 (Fisher's exact test), Q value = 0.13
Table S4. Gene #51: '16p loss' versus Clinical Feature #5: 'PATHOLOGY_N_STAGE'
| nPatients | N0 | N1+N2 |
|---|---|---|
| ALL | 40 | 5 |
| 16P LOSS MUTATED | 0 | 3 |
| 16P LOSS WILD-TYPE | 40 | 2 |
Figure S4. Get High-res Image Gene #51: '16p loss' versus Clinical Feature #5: 'PATHOLOGY_N_STAGE'
P value = 2.01e-09 (logrank test), Q value = 1.5e-06
Table S5. Gene #52: '16q loss' versus Clinical Feature #1: 'Time to Death'
| nPatients | nDeath | Duration Range (Median), Month | |
|---|---|---|---|
| ALL | 65 | 9 | 1.0 - 153.7 (73.9) |
| 16Q LOSS MUTATED | 5 | 4 | 1.0 - 52.3 (28.1) |
| 16Q LOSS WILD-TYPE | 60 | 5 | 2.5 - 153.7 (86.8) |
Figure S5. Get High-res Image Gene #52: '16q loss' versus Clinical Feature #1: 'Time to Death'
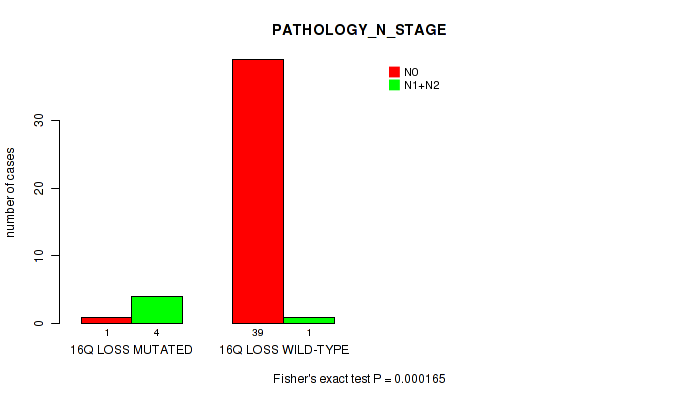
P value = 0.000165 (Fisher's exact test), Q value = 0.041
Table S6. Gene #52: '16q loss' versus Clinical Feature #5: 'PATHOLOGY_N_STAGE'
| nPatients | N0 | N1+N2 |
|---|---|---|
| ALL | 40 | 5 |
| 16Q LOSS MUTATED | 1 | 4 |
| 16Q LOSS WILD-TYPE | 39 | 1 |
Figure S6. Get High-res Image Gene #52: '16q loss' versus Clinical Feature #5: 'PATHOLOGY_N_STAGE'
-
Copy number data file = broad_values_by_arm.txt from GISTIC pipeline
-
Processed Copy number data file = /xchip/cga/gdac-prod/tcga-gdac/jobResults/GDAC_Correlate_Genomic_Events_Preprocess/KICH-TP/22507962/transformed.cor.cli.txt
-
Clinical data file = /xchip/cga/gdac-prod/tcga-gdac/jobResults/Append_Data/KICH-TP/22506450/KICH-TP.merged_data.txt
-
Number of patients = 66
-
Number of significantly arm-level cnvs = 63
-
Number of selected clinical features = 12
-
Exclude regions that fewer than K tumors have mutations, K = 3
For survival clinical features, the Kaplan-Meier survival curves of tumors with and without gene mutations were plotted and the statistical significance P values were estimated by logrank test (Bland and Altman 2004) using the 'survdiff' function in R
For binary or multi-class clinical features (nominal or ordinal), two-tailed Fisher's exact tests (Fisher 1922) were used to estimate the P values using the 'fisher.test' function in R
For multiple hypothesis correction, Q value is the False Discovery Rate (FDR) analogue of the P value (Benjamini and Hochberg 1995), defined as the minimum FDR at which the test may be called significant. We used the 'Benjamini and Hochberg' method of 'p.adjust' function in R to convert P values into Q values.
In addition to the links below, the full results of the analysis summarized in this report can also be downloaded programmatically using firehose_get, or interactively from either the Broad GDAC website or TCGA Data Coordination Center Portal.