This pipeline computes the correlation between significant copy number variation (cnv focal) genes and selected clinical features.
Testing the association between copy number variation 49 focal events and 8 clinical features across 512 patients, 136 significant findings detected with Q value < 0.25.
-
amp_1q22 cnv correlated to 'YEARS_TO_BIRTH'.
-
amp_1q32.1 cnv correlated to 'Time to Death', 'YEARS_TO_BIRTH', 'RADIATION_THERAPY', and 'KARNOFSKY_PERFORMANCE_SCORE'.
-
amp_2p24.3 cnv correlated to 'Time to Death'.
-
amp_3q26.33 cnv correlated to 'Time to Death', 'YEARS_TO_BIRTH', 'KARNOFSKY_PERFORMANCE_SCORE', and 'HISTOLOGICAL_TYPE'.
-
amp_4q12 cnv correlated to 'Time to Death', 'RADIATION_THERAPY', and 'HISTOLOGICAL_TYPE'.
-
amp_7p11.2 cnv correlated to 'Time to Death', 'YEARS_TO_BIRTH', 'RADIATION_THERAPY', 'KARNOFSKY_PERFORMANCE_SCORE', 'HISTOLOGICAL_TYPE', and 'RACE'.
-
amp_7q31.2 cnv correlated to 'Time to Death', 'YEARS_TO_BIRTH', 'GENDER', 'RADIATION_THERAPY', 'KARNOFSKY_PERFORMANCE_SCORE', 'HISTOLOGICAL_TYPE', and 'RACE'.
-
amp_7q32.3 cnv correlated to 'Time to Death', 'YEARS_TO_BIRTH', 'GENDER', 'RADIATION_THERAPY', 'KARNOFSKY_PERFORMANCE_SCORE', 'HISTOLOGICAL_TYPE', and 'RACE'.
-
amp_8q24.13 cnv correlated to 'YEARS_TO_BIRTH', 'RADIATION_THERAPY', and 'HISTOLOGICAL_TYPE'.
-
amp_9q34.3 cnv correlated to 'RADIATION_THERAPY' and 'HISTOLOGICAL_TYPE'.
-
amp_10p15.3 cnv correlated to 'YEARS_TO_BIRTH', 'RADIATION_THERAPY', and 'HISTOLOGICAL_TYPE'.
-
amp_12p13.32 cnv correlated to 'YEARS_TO_BIRTH' and 'RADIATION_THERAPY'.
-
amp_12q14.1 cnv correlated to 'Time to Death', 'YEARS_TO_BIRTH', 'RADIATION_THERAPY', and 'HISTOLOGICAL_TYPE'.
-
amp_13q34 cnv correlated to 'KARNOFSKY_PERFORMANCE_SCORE'.
-
amp_15q26.3 cnv correlated to 'Time to Death'.
-
amp_17q25.1 cnv correlated to 'Time to Death' and 'YEARS_TO_BIRTH'.
-
amp_19p13.3 cnv correlated to 'YEARS_TO_BIRTH', 'RADIATION_THERAPY', and 'HISTOLOGICAL_TYPE'.
-
amp_xp11.22 cnv correlated to 'RADIATION_THERAPY' and 'HISTOLOGICAL_TYPE'.
-
amp_xp11.22 cnv correlated to 'RADIATION_THERAPY' and 'HISTOLOGICAL_TYPE'.
-
del_1p36.32 cnv correlated to 'Time to Death', 'YEARS_TO_BIRTH', 'RADIATION_THERAPY', and 'HISTOLOGICAL_TYPE'.
-
del_1p32.3 cnv correlated to 'Time to Death', 'YEARS_TO_BIRTH', 'RADIATION_THERAPY', and 'HISTOLOGICAL_TYPE'.
-
del_2q37.3 cnv correlated to 'YEARS_TO_BIRTH', 'RADIATION_THERAPY', and 'HISTOLOGICAL_TYPE'.
-
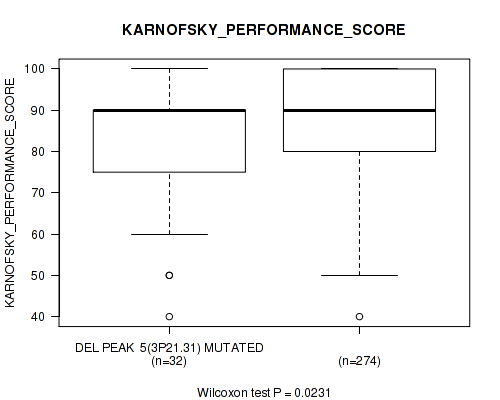
del_3p21.31 cnv correlated to 'RADIATION_THERAPY' and 'KARNOFSKY_PERFORMANCE_SCORE'.
-
del_3q13.31 cnv correlated to 'Time to Death' and 'RADIATION_THERAPY'.
-
del_3q29 cnv correlated to 'Time to Death' and 'KARNOFSKY_PERFORMANCE_SCORE'.
-
del_5p15.33 cnv correlated to 'RADIATION_THERAPY' and 'HISTOLOGICAL_TYPE'.
-
del_5q34 cnv correlated to 'RADIATION_THERAPY' and 'HISTOLOGICAL_TYPE'.
-
del_6p25.3 cnv correlated to 'Time to Death' and 'KARNOFSKY_PERFORMANCE_SCORE'.
-
del_6q22.31 cnv correlated to 'Time to Death', 'YEARS_TO_BIRTH', 'RADIATION_THERAPY', 'KARNOFSKY_PERFORMANCE_SCORE', and 'HISTOLOGICAL_TYPE'.
-
del_6q26 cnv correlated to 'Time to Death', 'RADIATION_THERAPY', 'KARNOFSKY_PERFORMANCE_SCORE', and 'HISTOLOGICAL_TYPE'.
-
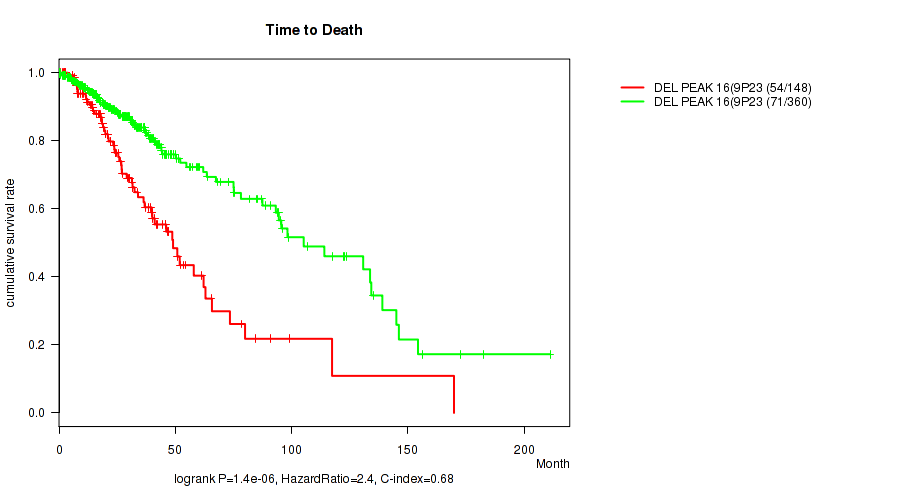
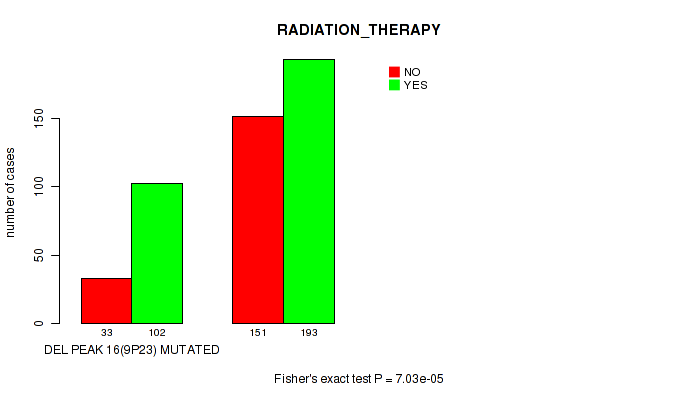
del_9p23 cnv correlated to 'Time to Death', 'YEARS_TO_BIRTH', 'RADIATION_THERAPY', 'KARNOFSKY_PERFORMANCE_SCORE', and 'HISTOLOGICAL_TYPE'.
-
del_9p21.3 cnv correlated to 'Time to Death', 'YEARS_TO_BIRTH', 'RADIATION_THERAPY', 'KARNOFSKY_PERFORMANCE_SCORE', and 'HISTOLOGICAL_TYPE'.
-
del_10q26.3 cnv correlated to 'Time to Death', 'YEARS_TO_BIRTH', 'GENDER', 'RADIATION_THERAPY', 'KARNOFSKY_PERFORMANCE_SCORE', and 'HISTOLOGICAL_TYPE'.
-
del_11p15.5 cnv correlated to 'Time to Death', 'YEARS_TO_BIRTH', 'RADIATION_THERAPY', and 'HISTOLOGICAL_TYPE'.
-
del_11p15.1 cnv correlated to 'Time to Death', 'RADIATION_THERAPY', 'KARNOFSKY_PERFORMANCE_SCORE', and 'HISTOLOGICAL_TYPE'.
-
del_12p13.1 cnv correlated to 'Time to Death'.
-
del_12q12 cnv correlated to 'RADIATION_THERAPY', 'HISTOLOGICAL_TYPE', and 'ETHNICITY'.
-
del_13q14.2 cnv correlated to 'Time to Death', 'RADIATION_THERAPY', 'KARNOFSKY_PERFORMANCE_SCORE', and 'HISTOLOGICAL_TYPE'.
-
del_13q34 cnv correlated to 'Time to Death' and 'RADIATION_THERAPY'.
-
del_14q24.3 cnv correlated to 'Time to Death', 'YEARS_TO_BIRTH', and 'GENDER'.
-
del_18q23 cnv correlated to 'YEARS_TO_BIRTH'.
-
del_19q13.42 cnv correlated to 'Time to Death', 'RADIATION_THERAPY', and 'HISTOLOGICAL_TYPE'.
-
del_22q13.31 cnv correlated to 'Time to Death', 'YEARS_TO_BIRTH', 'RADIATION_THERAPY', 'KARNOFSKY_PERFORMANCE_SCORE', and 'HISTOLOGICAL_TYPE'.
Table 1. Get Full Table Overview of the association between significant copy number variation of 49 focal events and 8 clinical features. Shown in the table are P values (Q values). Thresholded by Q value < 0.25, 136 significant findings detected.
|
Clinical Features |
Time to Death |
YEARS TO BIRTH |
GENDER |
RADIATION THERAPY |
KARNOFSKY PERFORMANCE SCORE |
HISTOLOGICAL TYPE |
RACE | ETHNICITY | ||
| nCNV (%) | nWild-Type | logrank test | Wilcoxon-test | Fisher's exact test | Fisher's exact test | Wilcoxon-test | Fisher's exact test | Fisher's exact test | Fisher's exact test | |
| amp 7q31 2 | 173 (34%) | 339 |
0.000167 (0.00154) |
3.04e-08 (1.7e-06) |
0.0482 (0.158) |
0.00262 (0.0151) |
0.0253 (0.0912) |
0.0655 (0.202) |
0.00926 (0.0454) |
0.448 (0.697) |
| amp 7q32 3 | 181 (35%) | 331 |
8.34e-05 (0.000934) |
5.13e-09 (3.35e-07) |
0.0255 (0.0912) |
0.00152 (0.00944) |
0.036 (0.124) |
0.0707 (0.215) |
0.0176 (0.072) |
0.347 (0.589) |
| amp 7p11 2 | 127 (25%) | 385 |
1.81e-10 (1.78e-08) |
3.25e-12 (4.25e-10) |
0.303 (0.533) |
0.000922 (0.00634) |
0.000391 (0.0032) |
0.0793 (0.232) |
0.0288 (0.102) |
1 (1.00) |
| del 10q26 3 | 151 (29%) | 361 |
9.55e-15 (3.74e-12) |
6.91e-08 (3.39e-06) |
0.0641 (0.2) |
4.92e-06 (0.000114) |
0.0151 (0.0656) |
2e-05 (0.00027) |
0.238 (0.469) |
0.845 (0.928) |
| del 6q22 31 | 77 (15%) | 435 |
1.34e-05 (0.000195) |
0.0803 (0.233) |
0.385 (0.634) |
0.00487 (0.0264) |
0.00186 (0.0112) |
0.0001 (0.00106) |
0.123 (0.318) |
1 (1.00) |
| del 9p23 | 149 (29%) | 363 |
1.4e-06 (3.92e-05) |
0.000504 (0.00387) |
0.494 (0.72) |
7.03e-05 (0.000836) |
8.72e-05 (0.00095) |
0.00772 (0.0388) |
0.68 (0.857) |
1 (1.00) |
| del 9p21 3 | 175 (34%) | 337 |
5.83e-13 (1.14e-10) |
9.28e-08 (3.64e-06) |
0.191 (0.413) |
8.48e-07 (2.77e-05) |
1.07e-05 (0.000161) |
0.0015 (0.00944) |
0.489 (0.715) |
0.565 (0.772) |
| del 22q13 31 | 77 (15%) | 435 |
3.86e-06 (9.46e-05) |
0.000444 (0.00355) |
0.62 (0.805) |
0.0111 (0.051) |
0.0516 (0.166) |
0.00107 (0.00699) |
0.157 (0.363) |
0.603 (0.796) |
| amp 1q32 1 | 43 (8%) | 469 |
0.00095 (0.00642) |
8.98e-08 (3.64e-06) |
1 (1.00) |
0.0644 (0.2) |
0.0135 (0.0601) |
0.154 (0.36) |
0.151 (0.36) |
0.0964 (0.268) |
| amp 3q26 33 | 21 (4%) | 491 |
1.57e-06 (4.1e-05) |
0.043 (0.143) |
0.825 (0.925) |
0.461 (0.697) |
0.0398 (0.134) |
0.00107 (0.00699) |
0.129 (0.322) |
0.629 (0.809) |
| amp 12q14 1 | 37 (7%) | 475 |
1.88e-09 (1.47e-07) |
0.00148 (0.00944) |
0.865 (0.942) |
0.0195 (0.0769) |
0.146 (0.353) |
0.0222 (0.0852) |
0.272 (0.509) |
0.498 (0.722) |
| del 1p36 32 | 206 (40%) | 306 |
0.0256 (0.0912) |
8.3e-07 (2.77e-05) |
0.587 (0.79) |
2.38e-05 (0.000311) |
0.479 (0.711) |
1e-05 (0.000157) |
0.283 (0.52) |
1 (1.00) |
| del 1p32 3 | 196 (38%) | 316 |
0.00342 (0.0194) |
5.46e-06 (0.000119) |
0.784 (0.901) |
1.13e-06 (3.4e-05) |
0.231 (0.465) |
1e-05 (0.000157) |
0.398 (0.65) |
0.852 (0.933) |
| del 6q26 | 81 (16%) | 431 |
0.000379 (0.00316) |
0.106 (0.285) |
0.273 (0.509) |
0.0123 (0.0553) |
0.00944 (0.0457) |
8e-05 (0.000922) |
0.144 (0.35) |
1 (1.00) |
| del 11p15 5 | 104 (20%) | 408 |
0.0566 (0.18) |
0.014 (0.0618) |
0.0979 (0.27) |
0.0035 (0.0196) |
0.143 (0.35) |
1e-05 (0.000157) |
0.457 (0.697) |
0.822 (0.925) |
| del 11p15 1 | 72 (14%) | 440 |
0.0103 (0.0483) |
0.236 (0.469) |
0.0959 (0.268) |
0.00688 (0.0351) |
0.0509 (0.165) |
0.00016 (0.00154) |
0.72 (0.872) |
1 (1.00) |
| del 13q14 2 | 144 (28%) | 368 |
0.0187 (0.0748) |
0.933 (0.992) |
0.237 (0.469) |
0.000169 (0.00154) |
0.00555 (0.0288) |
0.082 (0.236) |
0.114 (0.299) |
0.426 (0.685) |
| amp 4q12 | 30 (6%) | 482 |
0.000488 (0.00382) |
0.197 (0.418) |
0.706 (0.871) |
0.0172 (0.0711) |
0.147 (0.353) |
0.00078 (0.00566) |
1 (1.00) |
0.711 (0.871) |
| amp 8q24 13 | 99 (19%) | 413 |
0.36 (0.6) |
0.0157 (0.0667) |
0.262 (0.502) |
0.00918 (0.0454) |
0.936 (0.992) |
0.00558 (0.0288) |
0.625 (0.805) |
0.242 (0.47) |
| amp 10p15 3 | 71 (14%) | 441 |
0.516 (0.736) |
0.000195 (0.00174) |
0.159 (0.364) |
0.0784 (0.232) |
0.273 (0.509) |
1e-05 (0.000157) |
0.839 (0.928) |
0.174 (0.393) |
| amp 19p13 3 | 129 (25%) | 383 |
0.46 (0.697) |
0.0347 (0.12) |
0.539 (0.752) |
0.00514 (0.0272) |
0.537 (0.752) |
1e-05 (0.000157) |
0.723 (0.872) |
0.294 (0.524) |
| del 2q37 3 | 77 (15%) | 435 |
0.508 (0.73) |
0.0779 (0.232) |
0.456 (0.697) |
0.0169 (0.0706) |
0.355 (0.597) |
0.0104 (0.0483) |
0.734 (0.874) |
0.322 (0.56) |
| del 12q12 | 72 (14%) | 440 |
0.808 (0.916) |
0.522 (0.739) |
0.898 (0.962) |
0.0152 (0.0656) |
0.65 (0.828) |
5e-05 (0.000612) |
0.464 (0.697) |
0.0679 (0.208) |
| del 14q24 3 | 122 (24%) | 390 |
0.000126 (0.00127) |
0.0216 (0.0838) |
0.0765 (0.231) |
0.152 (0.36) |
0.27 (0.509) |
0.347 (0.589) |
0.187 (0.413) |
1 (1.00) |
| del 19q13 42 | 278 (54%) | 234 |
0.000321 (0.00273) |
0.257 (0.496) |
0.722 (0.872) |
0.000664 (0.00491) |
0.568 (0.772) |
1e-05 (0.000157) |
0.387 (0.635) |
1 (1.00) |
| amp 9q34 3 | 46 (9%) | 466 |
0.844 (0.928) |
0.71 (0.871) |
0.0899 (0.256) |
0.00492 (0.0264) |
0.506 (0.73) |
0.0235 (0.087) |
0.0992 (0.272) |
0.193 (0.413) |
| amp 12p13 32 | 72 (14%) | 440 |
0.202 (0.423) |
0.0366 (0.125) |
0.127 (0.321) |
0.0232 (0.0867) |
0.559 (0.769) |
0.125 (0.32) |
0.842 (0.928) |
0.6 (0.796) |
| amp 17q25 1 | 43 (8%) | 469 |
0.0402 (0.135) |
0.0334 (0.117) |
0.525 (0.74) |
0.743 (0.88) |
0.199 (0.418) |
0.303 (0.533) |
0.153 (0.36) |
0.318 (0.557) |
| amp xp11 22 | 48 (9%) | 464 |
0.126 (0.321) |
0.887 (0.958) |
0.761 (0.883) |
0.000651 (0.00491) |
0.624 (0.805) |
0.00249 (0.0146) |
0.281 (0.519) |
0.193 (0.413) |
| amp xp11 22 | 63 (12%) | 449 |
0.205 (0.426) |
0.719 (0.872) |
0.343 (0.588) |
0.000878 (0.00615) |
0.451 (0.697) |
3e-05 (0.000379) |
0.676 (0.855) |
0.569 (0.772) |
| del 3p21 31 | 49 (10%) | 463 |
0.193 (0.413) |
0.84 (0.928) |
0.764 (0.883) |
0.00418 (0.0231) |
0.0231 (0.0867) |
0.557 (0.769) |
0.787 (0.902) |
0.218 (0.448) |
| del 3q13 31 | 39 (8%) | 473 |
0.0183 (0.0738) |
0.839 (0.928) |
0.738 (0.877) |
0.0786 (0.232) |
0.186 (0.413) |
0.547 (0.758) |
0.602 (0.796) |
1 (1.00) |
| del 3q29 | 47 (9%) | 465 |
0.0229 (0.0867) |
0.972 (1.00) |
0.878 (0.953) |
0.107 (0.288) |
0.0633 (0.2) |
0.0901 (0.256) |
0.487 (0.715) |
0.516 (0.736) |
| del 5p15 33 | 50 (10%) | 462 |
0.423 (0.682) |
0.373 (0.617) |
0.766 (0.883) |
0.000104 (0.00108) |
0.128 (0.322) |
0.00227 (0.0135) |
0.79 (0.902) |
0.759 (0.883) |
| del 5q34 | 64 (12%) | 448 |
0.24 (0.469) |
0.595 (0.794) |
0.689 (0.861) |
0.000878 (0.00615) |
0.756 (0.883) |
1e-05 (0.000157) |
0.26 (0.5) |
0.407 (0.659) |
| del 6p25 3 | 50 (10%) | 462 |
0.000318 (0.00273) |
0.373 (0.617) |
1 (1.00) |
0.187 (0.413) |
0.0168 (0.0706) |
0.327 (0.567) |
0.173 (0.393) |
0.228 (0.463) |
| del 13q34 | 110 (21%) | 402 |
0.0096 (0.0459) |
0.482 (0.711) |
0.449 (0.697) |
0.0123 (0.0553) |
0.193 (0.413) |
0.898 (0.962) |
0.278 (0.517) |
0.826 (0.925) |
| amp 1q22 | 42 (8%) | 470 |
0.23 (0.465) |
0.000163 (0.00154) |
1 (1.00) |
0.242 (0.47) |
0.443 (0.697) |
0.223 (0.455) |
0.21 (0.433) |
0.0963 (0.268) |
| amp 2p24 3 | 24 (5%) | 488 |
0.0249 (0.0911) |
0.803 (0.913) |
1 (1.00) |
0.655 (0.831) |
0.616 (0.805) |
0.203 (0.424) |
0.749 (0.883) |
0.159 (0.364) |
| amp 13q34 | 22 (4%) | 490 |
0.572 (0.773) |
0.765 (0.883) |
0.828 (0.925) |
1 (1.00) |
0.0442 (0.145) |
0.62 (0.805) |
0.732 (0.874) |
0.644 (0.822) |
| amp 15q26 3 | 19 (4%) | 493 |
1.57e-05 (0.000219) |
0.953 (1.00) |
0.818 (0.924) |
0.34 (0.587) |
0.189 (0.413) |
0.109 (0.29) |
0.695 (0.862) |
0.343 (0.588) |
| del 12p13 1 | 38 (7%) | 474 |
0.00177 (0.0108) |
0.349 (0.59) |
1 (1.00) |
0.859 (0.938) |
0.569 (0.772) |
0.113 (0.298) |
1 (1.00) |
0.155 (0.361) |
| del 18q23 | 78 (15%) | 434 |
0.798 (0.91) |
0.0196 (0.0769) |
0.267 (0.507) |
0.695 (0.862) |
0.884 (0.957) |
0.238 (0.469) |
0.195 (0.415) |
0.445 (0.697) |
| amp 11q24 1 | 87 (17%) | 425 |
0.437 (0.697) |
0.527 (0.74) |
0.478 (0.711) |
0.903 (0.964) |
0.719 (0.872) |
0.507 (0.73) |
0.617 (0.805) |
1 (1.00) |
| del 1q43 | 35 (7%) | 477 |
0.699 (0.865) |
0.689 (0.861) |
0.29 (0.524) |
0.359 (0.6) |
0.927 (0.987) |
0.462 (0.697) |
0.46 (0.697) |
1 (1.00) |
| del 4q34 3 | 137 (27%) | 375 |
0.615 (0.805) |
0.131 (0.322) |
0.482 (0.711) |
0.457 (0.697) |
0.728 (0.872) |
0.726 (0.872) |
0.688 (0.861) |
0.543 (0.755) |
| del 7p22 3 | 23 (4%) | 489 |
0.11 (0.29) |
0.75 (0.883) |
0.522 (0.739) |
0.177 (0.399) |
0.595 (0.794) |
0.893 (0.961) |
0.293 (0.524) |
0.644 (0.822) |
| del 8q24 3 | 29 (6%) | 483 |
0.29 (0.524) |
0.438 (0.697) |
0.447 (0.697) |
0.3 (0.532) |
0.291 (0.524) |
0.286 (0.523) |
0.291 (0.524) |
0.405 (0.659) |
| del xq21 1 | 78 (15%) | 434 |
0.13 (0.322) |
0.1 (0.273) |
0.459 (0.697) |
0.119 (0.309) |
0.755 (0.883) |
0.59 (0.792) |
0.469 (0.702) |
1 (1.00) |
P value = 0.000163 (Wilcoxon-test), Q value = 0.0015
Table S1. Gene #1: 'amp_1q22' versus Clinical Feature #2: 'YEARS_TO_BIRTH'
| nPatients | Mean (Std.Dev) | |
|---|---|---|
| ALL | 511 | 43.0 (13.3) |
| AMP PEAK 1(1Q22) MUTATED | 42 | 50.4 (12.8) |
| AMP PEAK 1(1Q22) WILD-TYPE | 469 | 42.3 (13.2) |
Figure S1. Get High-res Image Gene #1: 'amp_1q22' versus Clinical Feature #2: 'YEARS_TO_BIRTH'

P value = 0.00095 (logrank test), Q value = 0.0064
Table S2. Gene #2: 'amp_1q32.1' versus Clinical Feature #1: 'Time to Death'
| nPatients | nDeath | Duration Range (Median), Month | |
|---|---|---|---|
| ALL | 508 | 125 | 0.0 - 211.2 (22.4) |
| AMP PEAK 2(1Q32.1) MUTATED | 43 | 21 | 0.2 - 211.2 (19.9) |
| AMP PEAK 2(1Q32.1) WILD-TYPE | 465 | 104 | 0.0 - 182.3 (23.2) |
Figure S2. Get High-res Image Gene #2: 'amp_1q32.1' versus Clinical Feature #1: 'Time to Death'

P value = 8.98e-08 (Wilcoxon-test), Q value = 3.6e-06
Table S3. Gene #2: 'amp_1q32.1' versus Clinical Feature #2: 'YEARS_TO_BIRTH'
| nPatients | Mean (Std.Dev) | |
|---|---|---|
| ALL | 511 | 43.0 (13.3) |
| AMP PEAK 2(1Q32.1) MUTATED | 43 | 53.7 (11.9) |
| AMP PEAK 2(1Q32.1) WILD-TYPE | 468 | 42.0 (13.0) |
Figure S3. Get High-res Image Gene #2: 'amp_1q32.1' versus Clinical Feature #2: 'YEARS_TO_BIRTH'

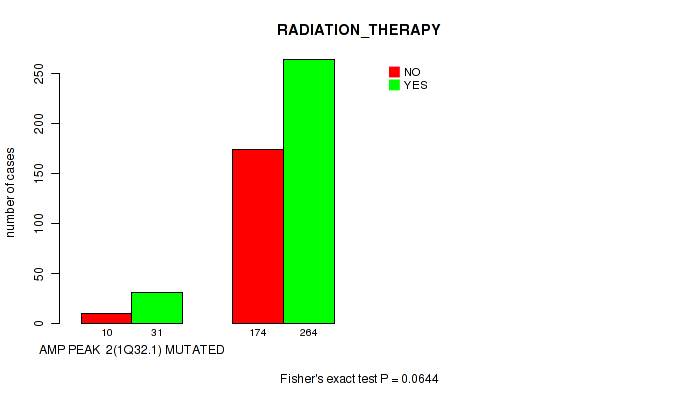
P value = 0.0644 (Fisher's exact test), Q value = 0.2
Table S4. Gene #2: 'amp_1q32.1' versus Clinical Feature #4: 'RADIATION_THERAPY'
| nPatients | NO | YES |
|---|---|---|
| ALL | 184 | 295 |
| AMP PEAK 2(1Q32.1) MUTATED | 10 | 31 |
| AMP PEAK 2(1Q32.1) WILD-TYPE | 174 | 264 |
Figure S4. Get High-res Image Gene #2: 'amp_1q32.1' versus Clinical Feature #4: 'RADIATION_THERAPY'
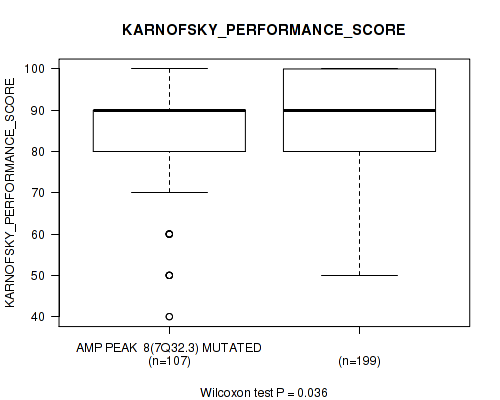
P value = 0.0135 (Wilcoxon-test), Q value = 0.06
Table S5. Gene #2: 'amp_1q32.1' versus Clinical Feature #5: 'KARNOFSKY_PERFORMANCE_SCORE'
| nPatients | Mean (Std.Dev) | |
|---|---|---|
| ALL | 306 | 86.7 (12.6) |
| AMP PEAK 2(1Q32.1) MUTATED | 27 | 81.5 (12.6) |
| AMP PEAK 2(1Q32.1) WILD-TYPE | 279 | 87.2 (12.5) |
Figure S5. Get High-res Image Gene #2: 'amp_1q32.1' versus Clinical Feature #5: 'KARNOFSKY_PERFORMANCE_SCORE'

P value = 0.0249 (logrank test), Q value = 0.091
Table S6. Gene #3: 'amp_2p24.3' versus Clinical Feature #1: 'Time to Death'
| nPatients | nDeath | Duration Range (Median), Month | |
|---|---|---|---|
| ALL | 508 | 125 | 0.0 - 211.2 (22.4) |
| AMP PEAK 3(2P24.3) MUTATED | 24 | 10 | 0.1 - 94.5 (20.4) |
| AMP PEAK 3(2P24.3) WILD-TYPE | 484 | 115 | 0.0 - 211.2 (22.5) |
Figure S6. Get High-res Image Gene #3: 'amp_2p24.3' versus Clinical Feature #1: 'Time to Death'

P value = 1.57e-06 (logrank test), Q value = 4.1e-05
Table S7. Gene #4: 'amp_3q26.33' versus Clinical Feature #1: 'Time to Death'
| nPatients | nDeath | Duration Range (Median), Month | |
|---|---|---|---|
| ALL | 508 | 125 | 0.0 - 211.2 (22.4) |
| AMP PEAK 4(3Q26.33) MUTATED | 20 | 10 | 0.2 - 47.8 (17.6) |
| AMP PEAK 4(3Q26.33) WILD-TYPE | 488 | 115 | 0.0 - 211.2 (23.2) |
Figure S7. Get High-res Image Gene #4: 'amp_3q26.33' versus Clinical Feature #1: 'Time to Death'

P value = 0.043 (Wilcoxon-test), Q value = 0.14
Table S8. Gene #4: 'amp_3q26.33' versus Clinical Feature #2: 'YEARS_TO_BIRTH'
| nPatients | Mean (Std.Dev) | |
|---|---|---|
| ALL | 511 | 43.0 (13.3) |
| AMP PEAK 4(3Q26.33) MUTATED | 21 | 48.3 (12.0) |
| AMP PEAK 4(3Q26.33) WILD-TYPE | 490 | 42.8 (13.4) |
Figure S8. Get High-res Image Gene #4: 'amp_3q26.33' versus Clinical Feature #2: 'YEARS_TO_BIRTH'

P value = 0.0398 (Wilcoxon-test), Q value = 0.13
Table S9. Gene #4: 'amp_3q26.33' versus Clinical Feature #5: 'KARNOFSKY_PERFORMANCE_SCORE'
| nPatients | Mean (Std.Dev) | |
|---|---|---|
| ALL | 306 | 86.7 (12.6) |
| AMP PEAK 4(3Q26.33) MUTATED | 14 | 81.4 (11.0) |
| AMP PEAK 4(3Q26.33) WILD-TYPE | 292 | 86.9 (12.6) |
Figure S9. Get High-res Image Gene #4: 'amp_3q26.33' versus Clinical Feature #5: 'KARNOFSKY_PERFORMANCE_SCORE'

P value = 0.00107 (Fisher's exact test), Q value = 0.007
Table S10. Gene #4: 'amp_3q26.33' versus Clinical Feature #6: 'HISTOLOGICAL_TYPE'
| nPatients | ASTROCYTOMA | OLIGOASTROCYTOMA | OLIGODENDROGLIOMA |
|---|---|---|---|
| ALL | 194 | 129 | 189 |
| AMP PEAK 4(3Q26.33) MUTATED | 16 | 1 | 4 |
| AMP PEAK 4(3Q26.33) WILD-TYPE | 178 | 128 | 185 |
Figure S10. Get High-res Image Gene #4: 'amp_3q26.33' versus Clinical Feature #6: 'HISTOLOGICAL_TYPE'

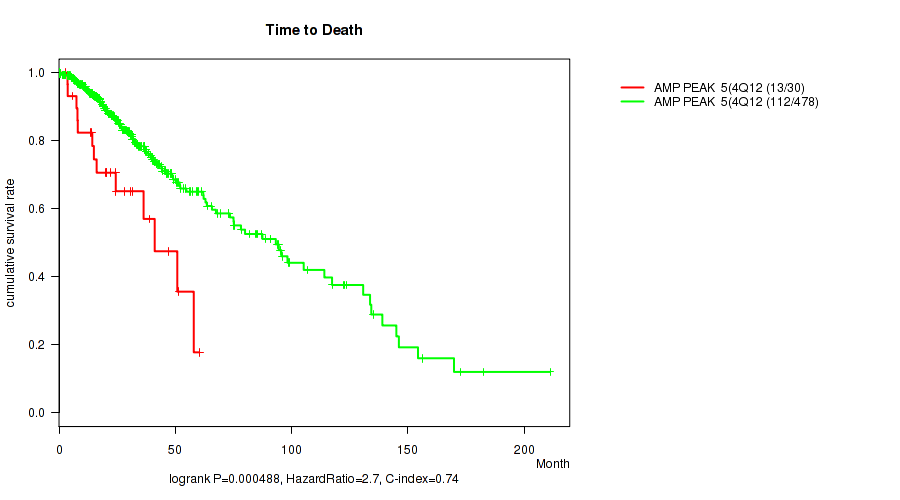
P value = 0.000488 (logrank test), Q value = 0.0038
Table S11. Gene #5: 'amp_4q12' versus Clinical Feature #1: 'Time to Death'
| nPatients | nDeath | Duration Range (Median), Month | |
|---|---|---|---|
| ALL | 508 | 125 | 0.0 - 211.2 (22.4) |
| AMP PEAK 5(4Q12) MUTATED | 30 | 13 | 2.8 - 60.3 (21.4) |
| AMP PEAK 5(4Q12) WILD-TYPE | 478 | 112 | 0.0 - 211.2 (22.5) |
Figure S11. Get High-res Image Gene #5: 'amp_4q12' versus Clinical Feature #1: 'Time to Death'
P value = 0.0172 (Fisher's exact test), Q value = 0.071
Table S12. Gene #5: 'amp_4q12' versus Clinical Feature #4: 'RADIATION_THERAPY'
| nPatients | NO | YES |
|---|---|---|
| ALL | 184 | 295 |
| AMP PEAK 5(4Q12) MUTATED | 5 | 24 |
| AMP PEAK 5(4Q12) WILD-TYPE | 179 | 271 |
Figure S12. Get High-res Image Gene #5: 'amp_4q12' versus Clinical Feature #4: 'RADIATION_THERAPY'

P value = 0.00078 (Fisher's exact test), Q value = 0.0057
Table S13. Gene #5: 'amp_4q12' versus Clinical Feature #6: 'HISTOLOGICAL_TYPE'
| nPatients | ASTROCYTOMA | OLIGOASTROCYTOMA | OLIGODENDROGLIOMA |
|---|---|---|---|
| ALL | 194 | 129 | 189 |
| AMP PEAK 5(4Q12) MUTATED | 21 | 2 | 7 |
| AMP PEAK 5(4Q12) WILD-TYPE | 173 | 127 | 182 |
Figure S13. Get High-res Image Gene #5: 'amp_4q12' versus Clinical Feature #6: 'HISTOLOGICAL_TYPE'

P value = 1.81e-10 (logrank test), Q value = 1.8e-08
Table S14. Gene #6: 'amp_7p11.2' versus Clinical Feature #1: 'Time to Death'
| nPatients | nDeath | Duration Range (Median), Month | |
|---|---|---|---|
| ALL | 508 | 125 | 0.0 - 211.2 (22.4) |
| AMP PEAK 6(7P11.2) MUTATED | 127 | 54 | 0.1 - 211.2 (18.6) |
| AMP PEAK 6(7P11.2) WILD-TYPE | 381 | 71 | 0.0 - 182.3 (24.9) |
Figure S14. Get High-res Image Gene #6: 'amp_7p11.2' versus Clinical Feature #1: 'Time to Death'

P value = 3.25e-12 (Wilcoxon-test), Q value = 4.2e-10
Table S15. Gene #6: 'amp_7p11.2' versus Clinical Feature #2: 'YEARS_TO_BIRTH'
| nPatients | Mean (Std.Dev) | |
|---|---|---|
| ALL | 511 | 43.0 (13.3) |
| AMP PEAK 6(7P11.2) MUTATED | 127 | 50.3 (13.1) |
| AMP PEAK 6(7P11.2) WILD-TYPE | 384 | 40.6 (12.5) |
Figure S15. Get High-res Image Gene #6: 'amp_7p11.2' versus Clinical Feature #2: 'YEARS_TO_BIRTH'

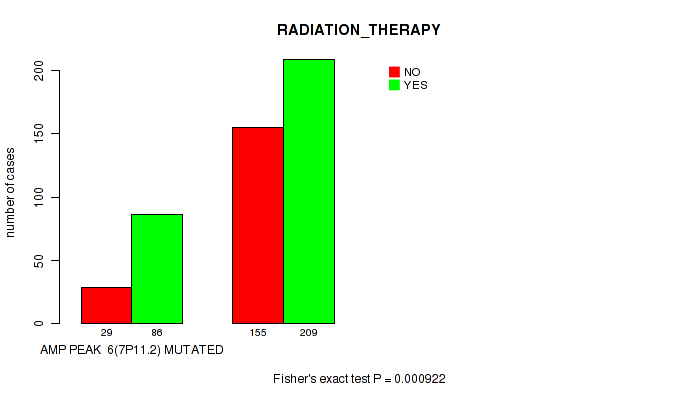
P value = 0.000922 (Fisher's exact test), Q value = 0.0063
Table S16. Gene #6: 'amp_7p11.2' versus Clinical Feature #4: 'RADIATION_THERAPY'
| nPatients | NO | YES |
|---|---|---|
| ALL | 184 | 295 |
| AMP PEAK 6(7P11.2) MUTATED | 29 | 86 |
| AMP PEAK 6(7P11.2) WILD-TYPE | 155 | 209 |
Figure S16. Get High-res Image Gene #6: 'amp_7p11.2' versus Clinical Feature #4: 'RADIATION_THERAPY'
P value = 0.000391 (Wilcoxon-test), Q value = 0.0032
Table S17. Gene #6: 'amp_7p11.2' versus Clinical Feature #5: 'KARNOFSKY_PERFORMANCE_SCORE'
| nPatients | Mean (Std.Dev) | |
|---|---|---|
| ALL | 306 | 86.7 (12.6) |
| AMP PEAK 6(7P11.2) MUTATED | 77 | 81.8 (15.1) |
| AMP PEAK 6(7P11.2) WILD-TYPE | 229 | 88.3 (11.2) |
Figure S17. Get High-res Image Gene #6: 'amp_7p11.2' versus Clinical Feature #5: 'KARNOFSKY_PERFORMANCE_SCORE'

P value = 0.0793 (Fisher's exact test), Q value = 0.23
Table S18. Gene #6: 'amp_7p11.2' versus Clinical Feature #6: 'HISTOLOGICAL_TYPE'
| nPatients | ASTROCYTOMA | OLIGOASTROCYTOMA | OLIGODENDROGLIOMA |
|---|---|---|---|
| ALL | 194 | 129 | 189 |
| AMP PEAK 6(7P11.2) MUTATED | 57 | 33 | 37 |
| AMP PEAK 6(7P11.2) WILD-TYPE | 137 | 96 | 152 |
Figure S18. Get High-res Image Gene #6: 'amp_7p11.2' versus Clinical Feature #6: 'HISTOLOGICAL_TYPE'

P value = 0.0288 (Fisher's exact test), Q value = 0.1
Table S19. Gene #6: 'amp_7p11.2' versus Clinical Feature #7: 'RACE'
| nPatients | AMERICAN INDIAN OR ALASKA NATIVE | ASIAN | BLACK OR AFRICAN AMERICAN | WHITE |
|---|---|---|---|---|
| ALL | 1 | 8 | 21 | 472 |
| AMP PEAK 6(7P11.2) MUTATED | 1 | 2 | 10 | 114 |
| AMP PEAK 6(7P11.2) WILD-TYPE | 0 | 6 | 11 | 358 |
Figure S19. Get High-res Image Gene #6: 'amp_7p11.2' versus Clinical Feature #7: 'RACE'

P value = 0.000167 (logrank test), Q value = 0.0015
Table S20. Gene #7: 'amp_7q31.2' versus Clinical Feature #1: 'Time to Death'
| nPatients | nDeath | Duration Range (Median), Month | |
|---|---|---|---|
| ALL | 508 | 125 | 0.0 - 211.2 (22.4) |
| AMP PEAK 7(7Q31.2) MUTATED | 173 | 61 | 0.1 - 211.2 (19.6) |
| AMP PEAK 7(7Q31.2) WILD-TYPE | 335 | 64 | 0.0 - 182.3 (25.4) |
Figure S20. Get High-res Image Gene #7: 'amp_7q31.2' versus Clinical Feature #1: 'Time to Death'

P value = 3.04e-08 (Wilcoxon-test), Q value = 1.7e-06
Table S21. Gene #7: 'amp_7q31.2' versus Clinical Feature #2: 'YEARS_TO_BIRTH'
| nPatients | Mean (Std.Dev) | |
|---|---|---|
| ALL | 511 | 43.0 (13.3) |
| AMP PEAK 7(7Q31.2) MUTATED | 173 | 47.6 (13.3) |
| AMP PEAK 7(7Q31.2) WILD-TYPE | 338 | 40.6 (12.8) |
Figure S21. Get High-res Image Gene #7: 'amp_7q31.2' versus Clinical Feature #2: 'YEARS_TO_BIRTH'

P value = 0.0482 (Fisher's exact test), Q value = 0.16
Table S22. Gene #7: 'amp_7q31.2' versus Clinical Feature #3: 'GENDER'
| nPatients | FEMALE | MALE |
|---|---|---|
| ALL | 228 | 284 |
| AMP PEAK 7(7Q31.2) MUTATED | 88 | 85 |
| AMP PEAK 7(7Q31.2) WILD-TYPE | 140 | 199 |
Figure S22. Get High-res Image Gene #7: 'amp_7q31.2' versus Clinical Feature #3: 'GENDER'

P value = 0.00262 (Fisher's exact test), Q value = 0.015
Table S23. Gene #7: 'amp_7q31.2' versus Clinical Feature #4: 'RADIATION_THERAPY'
| nPatients | NO | YES |
|---|---|---|
| ALL | 184 | 295 |
| AMP PEAK 7(7Q31.2) MUTATED | 45 | 112 |
| AMP PEAK 7(7Q31.2) WILD-TYPE | 139 | 183 |
Figure S23. Get High-res Image Gene #7: 'amp_7q31.2' versus Clinical Feature #4: 'RADIATION_THERAPY'

P value = 0.0253 (Wilcoxon-test), Q value = 0.091
Table S24. Gene #7: 'amp_7q31.2' versus Clinical Feature #5: 'KARNOFSKY_PERFORMANCE_SCORE'
| nPatients | Mean (Std.Dev) | |
|---|---|---|
| ALL | 306 | 86.7 (12.6) |
| AMP PEAK 7(7Q31.2) MUTATED | 102 | 83.8 (14.8) |
| AMP PEAK 7(7Q31.2) WILD-TYPE | 204 | 88.1 (11.1) |
Figure S24. Get High-res Image Gene #7: 'amp_7q31.2' versus Clinical Feature #5: 'KARNOFSKY_PERFORMANCE_SCORE'

P value = 0.0655 (Fisher's exact test), Q value = 0.2
Table S25. Gene #7: 'amp_7q31.2' versus Clinical Feature #6: 'HISTOLOGICAL_TYPE'
| nPatients | ASTROCYTOMA | OLIGOASTROCYTOMA | OLIGODENDROGLIOMA |
|---|---|---|---|
| ALL | 194 | 129 | 189 |
| AMP PEAK 7(7Q31.2) MUTATED | 74 | 47 | 52 |
| AMP PEAK 7(7Q31.2) WILD-TYPE | 120 | 82 | 137 |
Figure S25. Get High-res Image Gene #7: 'amp_7q31.2' versus Clinical Feature #6: 'HISTOLOGICAL_TYPE'

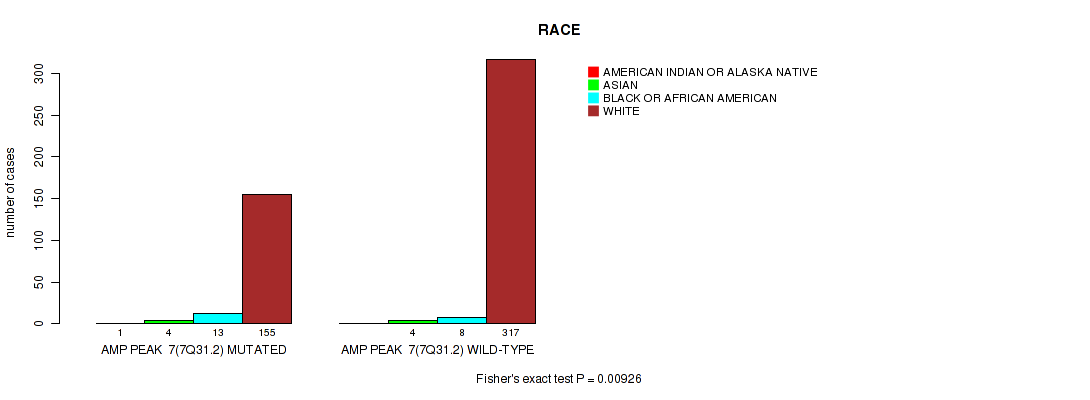
P value = 0.00926 (Fisher's exact test), Q value = 0.045
Table S26. Gene #7: 'amp_7q31.2' versus Clinical Feature #7: 'RACE'
| nPatients | AMERICAN INDIAN OR ALASKA NATIVE | ASIAN | BLACK OR AFRICAN AMERICAN | WHITE |
|---|---|---|---|---|
| ALL | 1 | 8 | 21 | 472 |
| AMP PEAK 7(7Q31.2) MUTATED | 1 | 4 | 13 | 155 |
| AMP PEAK 7(7Q31.2) WILD-TYPE | 0 | 4 | 8 | 317 |
Figure S26. Get High-res Image Gene #7: 'amp_7q31.2' versus Clinical Feature #7: 'RACE'
P value = 8.34e-05 (logrank test), Q value = 0.00093
Table S27. Gene #8: 'amp_7q32.3' versus Clinical Feature #1: 'Time to Death'
| nPatients | nDeath | Duration Range (Median), Month | |
|---|---|---|---|
| ALL | 508 | 125 | 0.0 - 211.2 (22.4) |
| AMP PEAK 8(7Q32.3) MUTATED | 181 | 64 | 0.1 - 211.2 (19.3) |
| AMP PEAK 8(7Q32.3) WILD-TYPE | 327 | 61 | 0.0 - 182.3 (25.5) |
Figure S27. Get High-res Image Gene #8: 'amp_7q32.3' versus Clinical Feature #1: 'Time to Death'

P value = 5.13e-09 (Wilcoxon-test), Q value = 3.3e-07
Table S28. Gene #8: 'amp_7q32.3' versus Clinical Feature #2: 'YEARS_TO_BIRTH'
| nPatients | Mean (Std.Dev) | |
|---|---|---|
| ALL | 511 | 43.0 (13.3) |
| AMP PEAK 8(7Q32.3) MUTATED | 181 | 47.6 (13.1) |
| AMP PEAK 8(7Q32.3) WILD-TYPE | 330 | 40.4 (12.8) |
Figure S28. Get High-res Image Gene #8: 'amp_7q32.3' versus Clinical Feature #2: 'YEARS_TO_BIRTH'

P value = 0.0255 (Fisher's exact test), Q value = 0.091
Table S29. Gene #8: 'amp_7q32.3' versus Clinical Feature #3: 'GENDER'
| nPatients | FEMALE | MALE |
|---|---|---|
| ALL | 228 | 284 |
| AMP PEAK 8(7Q32.3) MUTATED | 93 | 88 |
| AMP PEAK 8(7Q32.3) WILD-TYPE | 135 | 196 |
Figure S29. Get High-res Image Gene #8: 'amp_7q32.3' versus Clinical Feature #3: 'GENDER'

P value = 0.00152 (Fisher's exact test), Q value = 0.0094
Table S30. Gene #8: 'amp_7q32.3' versus Clinical Feature #4: 'RADIATION_THERAPY'
| nPatients | NO | YES |
|---|---|---|
| ALL | 184 | 295 |
| AMP PEAK 8(7Q32.3) MUTATED | 47 | 118 |
| AMP PEAK 8(7Q32.3) WILD-TYPE | 137 | 177 |
Figure S30. Get High-res Image Gene #8: 'amp_7q32.3' versus Clinical Feature #4: 'RADIATION_THERAPY'

P value = 0.036 (Wilcoxon-test), Q value = 0.12
Table S31. Gene #8: 'amp_7q32.3' versus Clinical Feature #5: 'KARNOFSKY_PERFORMANCE_SCORE'
| nPatients | Mean (Std.Dev) | |
|---|---|---|
| ALL | 306 | 86.7 (12.6) |
| AMP PEAK 8(7Q32.3) MUTATED | 107 | 84.1 (14.6) |
| AMP PEAK 8(7Q32.3) WILD-TYPE | 199 | 88.0 (11.2) |
Figure S31. Get High-res Image Gene #8: 'amp_7q32.3' versus Clinical Feature #5: 'KARNOFSKY_PERFORMANCE_SCORE'
P value = 0.0707 (Fisher's exact test), Q value = 0.21
Table S32. Gene #8: 'amp_7q32.3' versus Clinical Feature #6: 'HISTOLOGICAL_TYPE'
| nPatients | ASTROCYTOMA | OLIGOASTROCYTOMA | OLIGODENDROGLIOMA |
|---|---|---|---|
| ALL | 194 | 129 | 189 |
| AMP PEAK 8(7Q32.3) MUTATED | 77 | 49 | 55 |
| AMP PEAK 8(7Q32.3) WILD-TYPE | 117 | 80 | 134 |
Figure S32. Get High-res Image Gene #8: 'amp_7q32.3' versus Clinical Feature #6: 'HISTOLOGICAL_TYPE'

P value = 0.0176 (Fisher's exact test), Q value = 0.072
Table S33. Gene #8: 'amp_7q32.3' versus Clinical Feature #7: 'RACE'
| nPatients | AMERICAN INDIAN OR ALASKA NATIVE | ASIAN | BLACK OR AFRICAN AMERICAN | WHITE |
|---|---|---|---|---|
| ALL | 1 | 8 | 21 | 472 |
| AMP PEAK 8(7Q32.3) MUTATED | 1 | 4 | 13 | 163 |
| AMP PEAK 8(7Q32.3) WILD-TYPE | 0 | 4 | 8 | 309 |
Figure S33. Get High-res Image Gene #8: 'amp_7q32.3' versus Clinical Feature #7: 'RACE'

P value = 0.0157 (Wilcoxon-test), Q value = 0.067
Table S34. Gene #9: 'amp_8q24.13' versus Clinical Feature #2: 'YEARS_TO_BIRTH'
| nPatients | Mean (Std.Dev) | |
|---|---|---|
| ALL | 511 | 43.0 (13.3) |
| AMP PEAK 9(8Q24.13) MUTATED | 99 | 40.3 (13.0) |
| AMP PEAK 9(8Q24.13) WILD-TYPE | 412 | 43.6 (13.4) |
Figure S34. Get High-res Image Gene #9: 'amp_8q24.13' versus Clinical Feature #2: 'YEARS_TO_BIRTH'

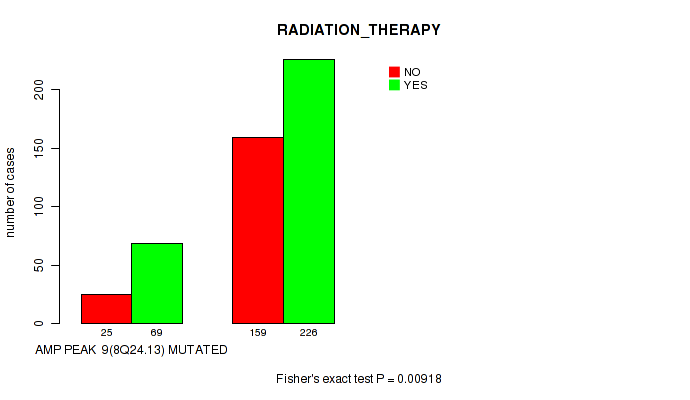
P value = 0.00918 (Fisher's exact test), Q value = 0.045
Table S35. Gene #9: 'amp_8q24.13' versus Clinical Feature #4: 'RADIATION_THERAPY'
| nPatients | NO | YES |
|---|---|---|
| ALL | 184 | 295 |
| AMP PEAK 9(8Q24.13) MUTATED | 25 | 69 |
| AMP PEAK 9(8Q24.13) WILD-TYPE | 159 | 226 |
Figure S35. Get High-res Image Gene #9: 'amp_8q24.13' versus Clinical Feature #4: 'RADIATION_THERAPY'
P value = 0.00558 (Fisher's exact test), Q value = 0.029
Table S36. Gene #9: 'amp_8q24.13' versus Clinical Feature #6: 'HISTOLOGICAL_TYPE'
| nPatients | ASTROCYTOMA | OLIGOASTROCYTOMA | OLIGODENDROGLIOMA |
|---|---|---|---|
| ALL | 194 | 129 | 189 |
| AMP PEAK 9(8Q24.13) MUTATED | 47 | 29 | 23 |
| AMP PEAK 9(8Q24.13) WILD-TYPE | 147 | 100 | 166 |
Figure S36. Get High-res Image Gene #9: 'amp_8q24.13' versus Clinical Feature #6: 'HISTOLOGICAL_TYPE'

P value = 0.00492 (Fisher's exact test), Q value = 0.026
Table S37. Gene #10: 'amp_9q34.3' versus Clinical Feature #4: 'RADIATION_THERAPY'
| nPatients | NO | YES |
|---|---|---|
| ALL | 184 | 295 |
| AMP PEAK 10(9Q34.3) MUTATED | 8 | 35 |
| AMP PEAK 10(9Q34.3) WILD-TYPE | 176 | 260 |
Figure S37. Get High-res Image Gene #10: 'amp_9q34.3' versus Clinical Feature #4: 'RADIATION_THERAPY'

P value = 0.0235 (Fisher's exact test), Q value = 0.087
Table S38. Gene #10: 'amp_9q34.3' versus Clinical Feature #6: 'HISTOLOGICAL_TYPE'
| nPatients | ASTROCYTOMA | OLIGOASTROCYTOMA | OLIGODENDROGLIOMA |
|---|---|---|---|
| ALL | 194 | 129 | 189 |
| AMP PEAK 10(9Q34.3) MUTATED | 24 | 13 | 9 |
| AMP PEAK 10(9Q34.3) WILD-TYPE | 170 | 116 | 180 |
Figure S38. Get High-res Image Gene #10: 'amp_9q34.3' versus Clinical Feature #6: 'HISTOLOGICAL_TYPE'

P value = 0.000195 (Wilcoxon-test), Q value = 0.0017
Table S39. Gene #11: 'amp_10p15.3' versus Clinical Feature #2: 'YEARS_TO_BIRTH'
| nPatients | Mean (Std.Dev) | |
|---|---|---|
| ALL | 511 | 43.0 (13.3) |
| AMP PEAK 11(10P15.3) MUTATED | 71 | 37.0 (10.3) |
| AMP PEAK 11(10P15.3) WILD-TYPE | 440 | 44.0 (13.5) |
Figure S39. Get High-res Image Gene #11: 'amp_10p15.3' versus Clinical Feature #2: 'YEARS_TO_BIRTH'

P value = 0.0784 (Fisher's exact test), Q value = 0.23
Table S40. Gene #11: 'amp_10p15.3' versus Clinical Feature #4: 'RADIATION_THERAPY'
| nPatients | NO | YES |
|---|---|---|
| ALL | 184 | 295 |
| AMP PEAK 11(10P15.3) MUTATED | 19 | 48 |
| AMP PEAK 11(10P15.3) WILD-TYPE | 165 | 247 |
Figure S40. Get High-res Image Gene #11: 'amp_10p15.3' versus Clinical Feature #4: 'RADIATION_THERAPY'

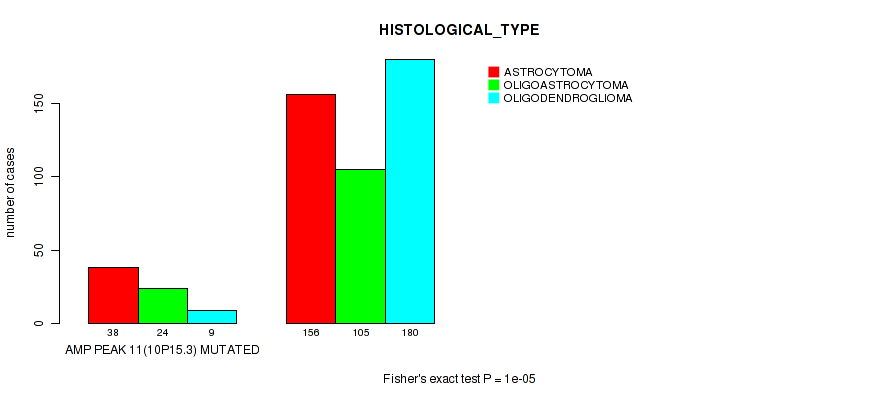
P value = 1e-05 (Fisher's exact test), Q value = 0.00016
Table S41. Gene #11: 'amp_10p15.3' versus Clinical Feature #6: 'HISTOLOGICAL_TYPE'
| nPatients | ASTROCYTOMA | OLIGOASTROCYTOMA | OLIGODENDROGLIOMA |
|---|---|---|---|
| ALL | 194 | 129 | 189 |
| AMP PEAK 11(10P15.3) MUTATED | 38 | 24 | 9 |
| AMP PEAK 11(10P15.3) WILD-TYPE | 156 | 105 | 180 |
Figure S41. Get High-res Image Gene #11: 'amp_10p15.3' versus Clinical Feature #6: 'HISTOLOGICAL_TYPE'
P value = 0.0366 (Wilcoxon-test), Q value = 0.12
Table S42. Gene #13: 'amp_12p13.32' versus Clinical Feature #2: 'YEARS_TO_BIRTH'
| nPatients | Mean (Std.Dev) | |
|---|---|---|
| ALL | 511 | 43.0 (13.3) |
| AMP PEAK 13(12P13.32) MUTATED | 72 | 40.4 (12.9) |
| AMP PEAK 13(12P13.32) WILD-TYPE | 439 | 43.4 (13.4) |
Figure S42. Get High-res Image Gene #13: 'amp_12p13.32' versus Clinical Feature #2: 'YEARS_TO_BIRTH'

P value = 0.0232 (Fisher's exact test), Q value = 0.087
Table S43. Gene #13: 'amp_12p13.32' versus Clinical Feature #4: 'RADIATION_THERAPY'
| nPatients | NO | YES |
|---|---|---|
| ALL | 184 | 295 |
| AMP PEAK 13(12P13.32) MUTATED | 18 | 52 |
| AMP PEAK 13(12P13.32) WILD-TYPE | 166 | 243 |
Figure S43. Get High-res Image Gene #13: 'amp_12p13.32' versus Clinical Feature #4: 'RADIATION_THERAPY'

P value = 1.88e-09 (logrank test), Q value = 1.5e-07
Table S44. Gene #14: 'amp_12q14.1' versus Clinical Feature #1: 'Time to Death'
| nPatients | nDeath | Duration Range (Median), Month | |
|---|---|---|---|
| ALL | 508 | 125 | 0.0 - 211.2 (22.4) |
| AMP PEAK 14(12Q14.1) MUTATED | 37 | 21 | 0.2 - 84.3 (17.9) |
| AMP PEAK 14(12Q14.1) WILD-TYPE | 471 | 104 | 0.0 - 211.2 (23.2) |
Figure S44. Get High-res Image Gene #14: 'amp_12q14.1' versus Clinical Feature #1: 'Time to Death'

P value = 0.00148 (Wilcoxon-test), Q value = 0.0094
Table S45. Gene #14: 'amp_12q14.1' versus Clinical Feature #2: 'YEARS_TO_BIRTH'
| nPatients | Mean (Std.Dev) | |
|---|---|---|
| ALL | 511 | 43.0 (13.3) |
| AMP PEAK 14(12Q14.1) MUTATED | 37 | 50.2 (14.3) |
| AMP PEAK 14(12Q14.1) WILD-TYPE | 474 | 42.4 (13.1) |
Figure S45. Get High-res Image Gene #14: 'amp_12q14.1' versus Clinical Feature #2: 'YEARS_TO_BIRTH'

P value = 0.0195 (Fisher's exact test), Q value = 0.077
Table S46. Gene #14: 'amp_12q14.1' versus Clinical Feature #4: 'RADIATION_THERAPY'
| nPatients | NO | YES |
|---|---|---|
| ALL | 184 | 295 |
| AMP PEAK 14(12Q14.1) MUTATED | 7 | 28 |
| AMP PEAK 14(12Q14.1) WILD-TYPE | 177 | 267 |
Figure S46. Get High-res Image Gene #14: 'amp_12q14.1' versus Clinical Feature #4: 'RADIATION_THERAPY'

P value = 0.0222 (Fisher's exact test), Q value = 0.085
Table S47. Gene #14: 'amp_12q14.1' versus Clinical Feature #6: 'HISTOLOGICAL_TYPE'
| nPatients | ASTROCYTOMA | OLIGOASTROCYTOMA | OLIGODENDROGLIOMA |
|---|---|---|---|
| ALL | 194 | 129 | 189 |
| AMP PEAK 14(12Q14.1) MUTATED | 22 | 5 | 10 |
| AMP PEAK 14(12Q14.1) WILD-TYPE | 172 | 124 | 179 |
Figure S47. Get High-res Image Gene #14: 'amp_12q14.1' versus Clinical Feature #6: 'HISTOLOGICAL_TYPE'

P value = 0.0442 (Wilcoxon-test), Q value = 0.15
Table S48. Gene #15: 'amp_13q34' versus Clinical Feature #5: 'KARNOFSKY_PERFORMANCE_SCORE'
| nPatients | Mean (Std.Dev) | |
|---|---|---|
| ALL | 306 | 86.7 (12.6) |
| AMP PEAK 15(13Q34) MUTATED | 14 | 77.1 (18.6) |
| AMP PEAK 15(13Q34) WILD-TYPE | 292 | 87.1 (12.1) |
Figure S48. Get High-res Image Gene #15: 'amp_13q34' versus Clinical Feature #5: 'KARNOFSKY_PERFORMANCE_SCORE'

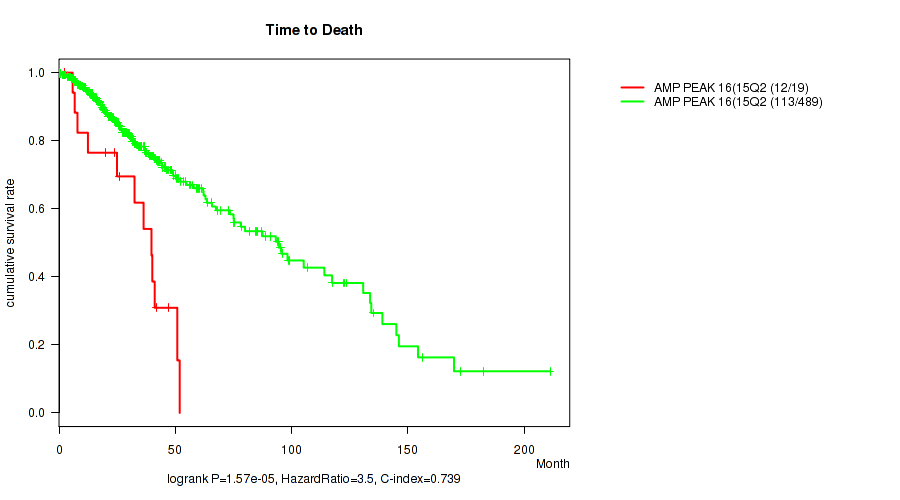
P value = 1.57e-05 (logrank test), Q value = 0.00022
Table S49. Gene #16: 'amp_15q26.3' versus Clinical Feature #1: 'Time to Death'
| nPatients | nDeath | Duration Range (Median), Month | |
|---|---|---|---|
| ALL | 508 | 125 | 0.0 - 211.2 (22.4) |
| AMP PEAK 16(15Q26.3) MUTATED | 19 | 12 | 2.4 - 51.9 (25.9) |
| AMP PEAK 16(15Q26.3) WILD-TYPE | 489 | 113 | 0.0 - 211.2 (22.1) |
Figure S49. Get High-res Image Gene #16: 'amp_15q26.3' versus Clinical Feature #1: 'Time to Death'
P value = 0.0402 (logrank test), Q value = 0.13
Table S50. Gene #17: 'amp_17q25.1' versus Clinical Feature #1: 'Time to Death'
| nPatients | nDeath | Duration Range (Median), Month | |
|---|---|---|---|
| ALL | 508 | 125 | 0.0 - 211.2 (22.4) |
| AMP PEAK 17(17Q25.1) MUTATED | 43 | 14 | 0.2 - 85.5 (23.3) |
| AMP PEAK 17(17Q25.1) WILD-TYPE | 465 | 111 | 0.0 - 211.2 (22.3) |
Figure S50. Get High-res Image Gene #17: 'amp_17q25.1' versus Clinical Feature #1: 'Time to Death'

P value = 0.0334 (Wilcoxon-test), Q value = 0.12
Table S51. Gene #17: 'amp_17q25.1' versus Clinical Feature #2: 'YEARS_TO_BIRTH'
| nPatients | Mean (Std.Dev) | |
|---|---|---|
| ALL | 511 | 43.0 (13.3) |
| AMP PEAK 17(17Q25.1) MUTATED | 43 | 46.7 (12.4) |
| AMP PEAK 17(17Q25.1) WILD-TYPE | 468 | 42.7 (13.4) |
Figure S51. Get High-res Image Gene #17: 'amp_17q25.1' versus Clinical Feature #2: 'YEARS_TO_BIRTH'

P value = 0.0347 (Wilcoxon-test), Q value = 0.12
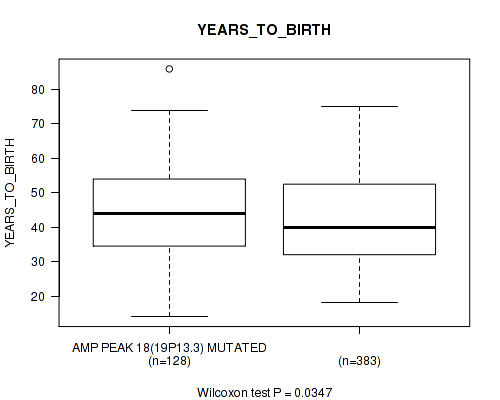
Table S52. Gene #18: 'amp_19p13.3' versus Clinical Feature #2: 'YEARS_TO_BIRTH'
| nPatients | Mean (Std.Dev) | |
|---|---|---|
| ALL | 511 | 43.0 (13.3) |
| AMP PEAK 18(19P13.3) MUTATED | 128 | 45.1 (13.8) |
| AMP PEAK 18(19P13.3) WILD-TYPE | 383 | 42.3 (13.1) |
Figure S52. Get High-res Image Gene #18: 'amp_19p13.3' versus Clinical Feature #2: 'YEARS_TO_BIRTH'
P value = 0.00514 (Fisher's exact test), Q value = 0.027
Table S53. Gene #18: 'amp_19p13.3' versus Clinical Feature #4: 'RADIATION_THERAPY'
| nPatients | NO | YES |
|---|---|---|
| ALL | 184 | 295 |
| AMP PEAK 18(19P13.3) MUTATED | 60 | 62 |
| AMP PEAK 18(19P13.3) WILD-TYPE | 124 | 233 |
Figure S53. Get High-res Image Gene #18: 'amp_19p13.3' versus Clinical Feature #4: 'RADIATION_THERAPY'

P value = 1e-05 (Fisher's exact test), Q value = 0.00016
Table S54. Gene #18: 'amp_19p13.3' versus Clinical Feature #6: 'HISTOLOGICAL_TYPE'
| nPatients | ASTROCYTOMA | OLIGOASTROCYTOMA | OLIGODENDROGLIOMA |
|---|---|---|---|
| ALL | 194 | 129 | 189 |
| AMP PEAK 18(19P13.3) MUTATED | 26 | 29 | 74 |
| AMP PEAK 18(19P13.3) WILD-TYPE | 168 | 100 | 115 |
Figure S54. Get High-res Image Gene #18: 'amp_19p13.3' versus Clinical Feature #6: 'HISTOLOGICAL_TYPE'

P value = 0.000651 (Fisher's exact test), Q value = 0.0049
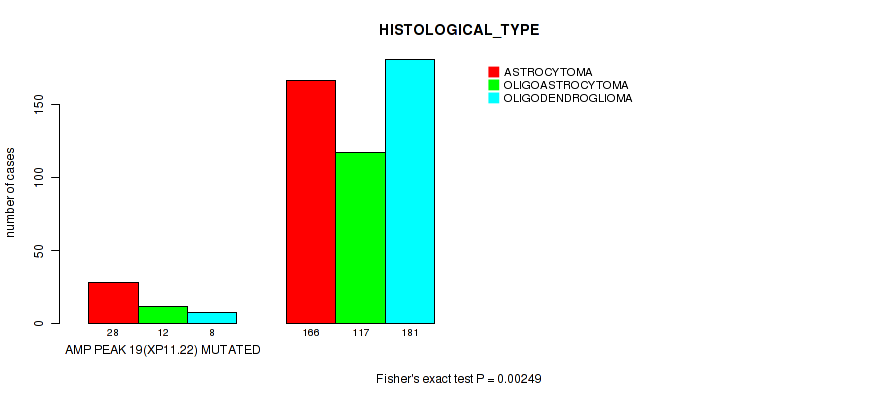
Table S55. Gene #19: 'amp_xp11.22' versus Clinical Feature #4: 'RADIATION_THERAPY'
| nPatients | NO | YES |
|---|---|---|
| ALL | 184 | 295 |
| AMP PEAK 19(XP11.22) MUTATED | 7 | 38 |
| AMP PEAK 19(XP11.22) WILD-TYPE | 177 | 257 |
Figure S55. Get High-res Image Gene #19: 'amp_xp11.22' versus Clinical Feature #4: 'RADIATION_THERAPY'

P value = 0.00249 (Fisher's exact test), Q value = 0.015
Table S56. Gene #19: 'amp_xp11.22' versus Clinical Feature #6: 'HISTOLOGICAL_TYPE'
| nPatients | ASTROCYTOMA | OLIGOASTROCYTOMA | OLIGODENDROGLIOMA |
|---|---|---|---|
| ALL | 194 | 129 | 189 |
| AMP PEAK 19(XP11.22) MUTATED | 28 | 12 | 8 |
| AMP PEAK 19(XP11.22) WILD-TYPE | 166 | 117 | 181 |
Figure S56. Get High-res Image Gene #19: 'amp_xp11.22' versus Clinical Feature #6: 'HISTOLOGICAL_TYPE'
P value = 0.000878 (Fisher's exact test), Q value = 0.0061
Table S57. Gene #20: 'amp_xp11.22' versus Clinical Feature #4: 'RADIATION_THERAPY'
| nPatients | NO | YES |
|---|---|---|
| ALL | 184 | 295 |
| AMP PEAK 20(XP11.22) MUTATED | 11 | 48 |
| AMP PEAK 20(XP11.22) WILD-TYPE | 173 | 247 |
Figure S57. Get High-res Image Gene #20: 'amp_xp11.22' versus Clinical Feature #4: 'RADIATION_THERAPY'
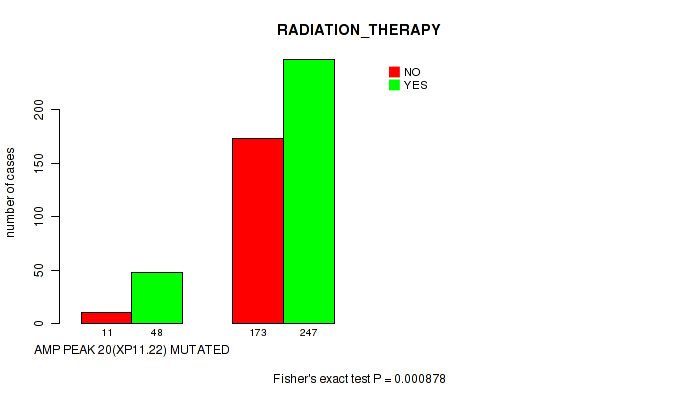
P value = 3e-05 (Fisher's exact test), Q value = 0.00038
Table S58. Gene #20: 'amp_xp11.22' versus Clinical Feature #6: 'HISTOLOGICAL_TYPE'
| nPatients | ASTROCYTOMA | OLIGOASTROCYTOMA | OLIGODENDROGLIOMA |
|---|---|---|---|
| ALL | 194 | 129 | 189 |
| AMP PEAK 20(XP11.22) MUTATED | 39 | 15 | 9 |
| AMP PEAK 20(XP11.22) WILD-TYPE | 155 | 114 | 180 |
Figure S58. Get High-res Image Gene #20: 'amp_xp11.22' versus Clinical Feature #6: 'HISTOLOGICAL_TYPE'

P value = 0.0256 (logrank test), Q value = 0.091
Table S59. Gene #21: 'del_1p36.32' versus Clinical Feature #1: 'Time to Death'
| nPatients | nDeath | Duration Range (Median), Month | |
|---|---|---|---|
| ALL | 508 | 125 | 0.0 - 211.2 (22.4) |
| DEL PEAK 1(1P36.32) MUTATED | 203 | 38 | 0.1 - 182.3 (21.6) |
| DEL PEAK 1(1P36.32) WILD-TYPE | 305 | 87 | 0.0 - 211.2 (23.5) |
Figure S59. Get High-res Image Gene #21: 'del_1p36.32' versus Clinical Feature #1: 'Time to Death'

P value = 8.3e-07 (Wilcoxon-test), Q value = 2.8e-05
Table S60. Gene #21: 'del_1p36.32' versus Clinical Feature #2: 'YEARS_TO_BIRTH'
| nPatients | Mean (Std.Dev) | |
|---|---|---|
| ALL | 511 | 43.0 (13.3) |
| DEL PEAK 1(1P36.32) MUTATED | 205 | 46.3 (12.8) |
| DEL PEAK 1(1P36.32) WILD-TYPE | 306 | 40.7 (13.3) |
Figure S60. Get High-res Image Gene #21: 'del_1p36.32' versus Clinical Feature #2: 'YEARS_TO_BIRTH'

P value = 2.38e-05 (Fisher's exact test), Q value = 0.00031
Table S61. Gene #21: 'del_1p36.32' versus Clinical Feature #4: 'RADIATION_THERAPY'
| nPatients | NO | YES |
|---|---|---|
| ALL | 184 | 295 |
| DEL PEAK 1(1P36.32) MUTATED | 97 | 97 |
| DEL PEAK 1(1P36.32) WILD-TYPE | 87 | 198 |
Figure S61. Get High-res Image Gene #21: 'del_1p36.32' versus Clinical Feature #4: 'RADIATION_THERAPY'

P value = 1e-05 (Fisher's exact test), Q value = 0.00016
Table S62. Gene #21: 'del_1p36.32' versus Clinical Feature #6: 'HISTOLOGICAL_TYPE'
| nPatients | ASTROCYTOMA | OLIGOASTROCYTOMA | OLIGODENDROGLIOMA |
|---|---|---|---|
| ALL | 194 | 129 | 189 |
| DEL PEAK 1(1P36.32) MUTATED | 22 | 46 | 138 |
| DEL PEAK 1(1P36.32) WILD-TYPE | 172 | 83 | 51 |
Figure S62. Get High-res Image Gene #21: 'del_1p36.32' versus Clinical Feature #6: 'HISTOLOGICAL_TYPE'
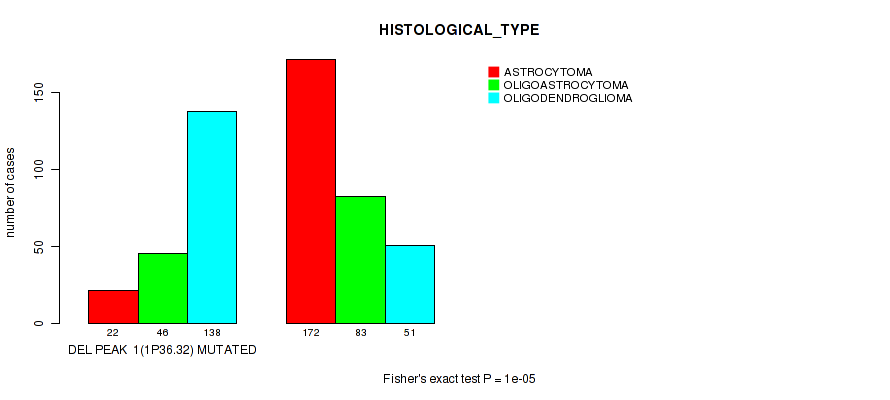
P value = 0.00342 (logrank test), Q value = 0.019
Table S63. Gene #22: 'del_1p32.3' versus Clinical Feature #1: 'Time to Death'
| nPatients | nDeath | Duration Range (Median), Month | |
|---|---|---|---|
| ALL | 508 | 125 | 0.0 - 211.2 (22.4) |
| DEL PEAK 2(1P32.3) MUTATED | 193 | 33 | 0.1 - 182.3 (22.4) |
| DEL PEAK 2(1P32.3) WILD-TYPE | 315 | 92 | 0.0 - 211.2 (22.3) |
Figure S63. Get High-res Image Gene #22: 'del_1p32.3' versus Clinical Feature #1: 'Time to Death'

P value = 5.46e-06 (Wilcoxon-test), Q value = 0.00012
Table S64. Gene #22: 'del_1p32.3' versus Clinical Feature #2: 'YEARS_TO_BIRTH'
| nPatients | Mean (Std.Dev) | |
|---|---|---|
| ALL | 511 | 43.0 (13.3) |
| DEL PEAK 2(1P32.3) MUTATED | 195 | 46.3 (13.1) |
| DEL PEAK 2(1P32.3) WILD-TYPE | 316 | 40.9 (13.1) |
Figure S64. Get High-res Image Gene #22: 'del_1p32.3' versus Clinical Feature #2: 'YEARS_TO_BIRTH'

P value = 1.13e-06 (Fisher's exact test), Q value = 3.4e-05
Table S65. Gene #22: 'del_1p32.3' versus Clinical Feature #4: 'RADIATION_THERAPY'
| nPatients | NO | YES |
|---|---|---|
| ALL | 184 | 295 |
| DEL PEAK 2(1P32.3) MUTATED | 95 | 86 |
| DEL PEAK 2(1P32.3) WILD-TYPE | 89 | 209 |
Figure S65. Get High-res Image Gene #22: 'del_1p32.3' versus Clinical Feature #4: 'RADIATION_THERAPY'

P value = 1e-05 (Fisher's exact test), Q value = 0.00016
Table S66. Gene #22: 'del_1p32.3' versus Clinical Feature #6: 'HISTOLOGICAL_TYPE'
| nPatients | ASTROCYTOMA | OLIGOASTROCYTOMA | OLIGODENDROGLIOMA |
|---|---|---|---|
| ALL | 194 | 129 | 189 |
| DEL PEAK 2(1P32.3) MUTATED | 16 | 42 | 138 |
| DEL PEAK 2(1P32.3) WILD-TYPE | 178 | 87 | 51 |
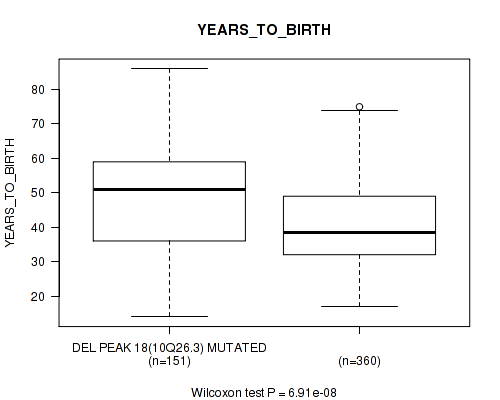
Figure S66. Get High-res Image Gene #22: 'del_1p32.3' versus Clinical Feature #6: 'HISTOLOGICAL_TYPE'

P value = 0.0779 (Wilcoxon-test), Q value = 0.23
Table S67. Gene #24: 'del_2q37.3' versus Clinical Feature #2: 'YEARS_TO_BIRTH'
| nPatients | Mean (Std.Dev) | |
|---|---|---|
| ALL | 511 | 43.0 (13.3) |
| DEL PEAK 4(2Q37.3) MUTATED | 77 | 40.8 (13.3) |
| DEL PEAK 4(2Q37.3) WILD-TYPE | 434 | 43.4 (13.3) |
Figure S67. Get High-res Image Gene #24: 'del_2q37.3' versus Clinical Feature #2: 'YEARS_TO_BIRTH'
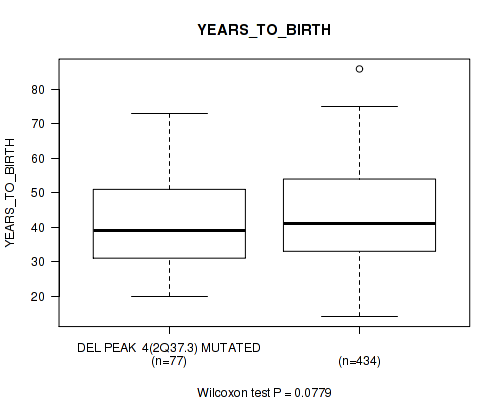
P value = 0.0169 (Fisher's exact test), Q value = 0.071
Table S68. Gene #24: 'del_2q37.3' versus Clinical Feature #4: 'RADIATION_THERAPY'
| nPatients | NO | YES |
|---|---|---|
| ALL | 184 | 295 |
| DEL PEAK 4(2Q37.3) MUTATED | 18 | 53 |
| DEL PEAK 4(2Q37.3) WILD-TYPE | 166 | 242 |
Figure S68. Get High-res Image Gene #24: 'del_2q37.3' versus Clinical Feature #4: 'RADIATION_THERAPY'
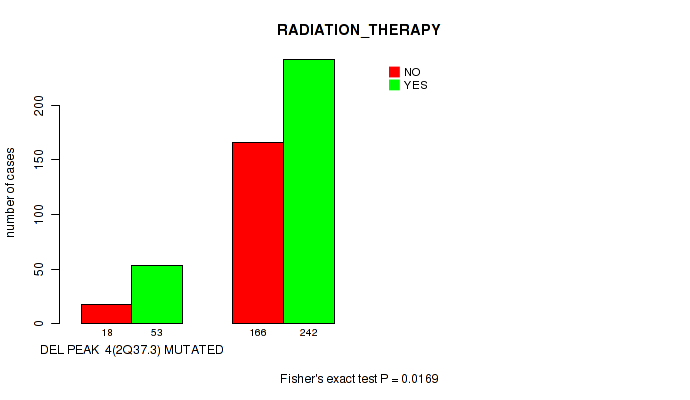
P value = 0.0104 (Fisher's exact test), Q value = 0.048
Table S69. Gene #24: 'del_2q37.3' versus Clinical Feature #6: 'HISTOLOGICAL_TYPE'
| nPatients | ASTROCYTOMA | OLIGOASTROCYTOMA | OLIGODENDROGLIOMA |
|---|---|---|---|
| ALL | 194 | 129 | 189 |
| DEL PEAK 4(2Q37.3) MUTATED | 37 | 23 | 17 |
| DEL PEAK 4(2Q37.3) WILD-TYPE | 157 | 106 | 172 |
Figure S69. Get High-res Image Gene #24: 'del_2q37.3' versus Clinical Feature #6: 'HISTOLOGICAL_TYPE'
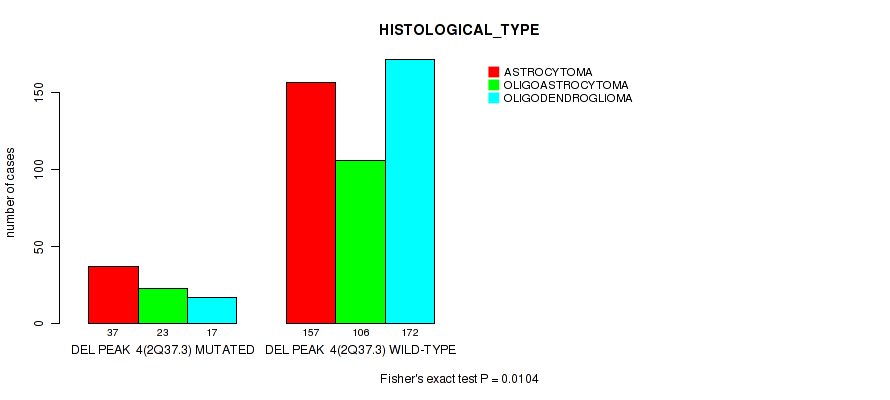
P value = 0.00418 (Fisher's exact test), Q value = 0.023
Table S70. Gene #25: 'del_3p21.31' versus Clinical Feature #4: 'RADIATION_THERAPY'
| nPatients | NO | YES |
|---|---|---|
| ALL | 184 | 295 |
| DEL PEAK 5(3P21.31) MUTATED | 9 | 38 |
| DEL PEAK 5(3P21.31) WILD-TYPE | 175 | 257 |
Figure S70. Get High-res Image Gene #25: 'del_3p21.31' versus Clinical Feature #4: 'RADIATION_THERAPY'

P value = 0.0231 (Wilcoxon-test), Q value = 0.087
Table S71. Gene #25: 'del_3p21.31' versus Clinical Feature #5: 'KARNOFSKY_PERFORMANCE_SCORE'
| nPatients | Mean (Std.Dev) | |
|---|---|---|
| ALL | 306 | 86.7 (12.6) |
| DEL PEAK 5(3P21.31) MUTATED | 32 | 81.2 (15.4) |
| DEL PEAK 5(3P21.31) WILD-TYPE | 274 | 87.3 (12.1) |
Figure S71. Get High-res Image Gene #25: 'del_3p21.31' versus Clinical Feature #5: 'KARNOFSKY_PERFORMANCE_SCORE'
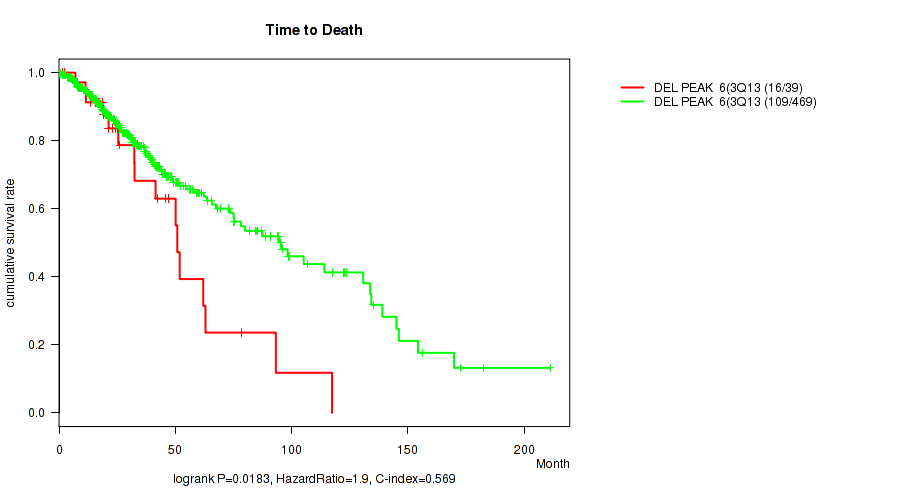
P value = 0.0183 (logrank test), Q value = 0.074
Table S72. Gene #26: 'del_3q13.31' versus Clinical Feature #1: 'Time to Death'
| nPatients | nDeath | Duration Range (Median), Month | |
|---|---|---|---|
| ALL | 508 | 125 | 0.0 - 211.2 (22.4) |
| DEL PEAK 6(3Q13.31) MUTATED | 39 | 16 | 0.2 - 117.4 (23.2) |
| DEL PEAK 6(3Q13.31) WILD-TYPE | 469 | 109 | 0.0 - 211.2 (22.3) |
Figure S72. Get High-res Image Gene #26: 'del_3q13.31' versus Clinical Feature #1: 'Time to Death'
P value = 0.0786 (Fisher's exact test), Q value = 0.23
Table S73. Gene #26: 'del_3q13.31' versus Clinical Feature #4: 'RADIATION_THERAPY'
| nPatients | NO | YES |
|---|---|---|
| ALL | 184 | 295 |
| DEL PEAK 6(3Q13.31) MUTATED | 9 | 28 |
| DEL PEAK 6(3Q13.31) WILD-TYPE | 175 | 267 |
Figure S73. Get High-res Image Gene #26: 'del_3q13.31' versus Clinical Feature #4: 'RADIATION_THERAPY'

P value = 0.0229 (logrank test), Q value = 0.087
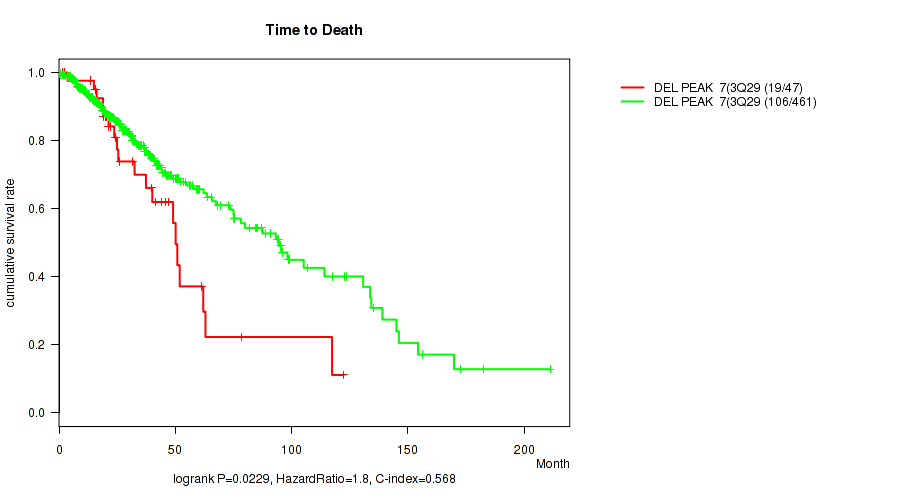
Table S74. Gene #27: 'del_3q29' versus Clinical Feature #1: 'Time to Death'
| nPatients | nDeath | Duration Range (Median), Month | |
|---|---|---|---|
| ALL | 508 | 125 | 0.0 - 211.2 (22.4) |
| DEL PEAK 7(3Q29) MUTATED | 47 | 19 | 0.0 - 122.5 (24.3) |
| DEL PEAK 7(3Q29) WILD-TYPE | 461 | 106 | 0.1 - 211.2 (21.6) |
Figure S74. Get High-res Image Gene #27: 'del_3q29' versus Clinical Feature #1: 'Time to Death'
P value = 0.0633 (Wilcoxon-test), Q value = 0.2
Table S75. Gene #27: 'del_3q29' versus Clinical Feature #5: 'KARNOFSKY_PERFORMANCE_SCORE'
| nPatients | Mean (Std.Dev) | |
|---|---|---|
| ALL | 306 | 86.7 (12.6) |
| DEL PEAK 7(3Q29) MUTATED | 33 | 82.7 (14.2) |
| DEL PEAK 7(3Q29) WILD-TYPE | 273 | 87.1 (12.3) |
Figure S75. Get High-res Image Gene #27: 'del_3q29' versus Clinical Feature #5: 'KARNOFSKY_PERFORMANCE_SCORE'

P value = 0.000104 (Fisher's exact test), Q value = 0.0011
Table S76. Gene #29: 'del_5p15.33' versus Clinical Feature #4: 'RADIATION_THERAPY'
| nPatients | NO | YES |
|---|---|---|
| ALL | 184 | 295 |
| DEL PEAK 9(5P15.33) MUTATED | 6 | 40 |
| DEL PEAK 9(5P15.33) WILD-TYPE | 178 | 255 |
Figure S76. Get High-res Image Gene #29: 'del_5p15.33' versus Clinical Feature #4: 'RADIATION_THERAPY'

P value = 0.00227 (Fisher's exact test), Q value = 0.013
Table S77. Gene #29: 'del_5p15.33' versus Clinical Feature #6: 'HISTOLOGICAL_TYPE'
| nPatients | ASTROCYTOMA | OLIGOASTROCYTOMA | OLIGODENDROGLIOMA |
|---|---|---|---|
| ALL | 194 | 129 | 189 |
| DEL PEAK 9(5P15.33) MUTATED | 23 | 19 | 8 |
| DEL PEAK 9(5P15.33) WILD-TYPE | 171 | 110 | 181 |
Figure S77. Get High-res Image Gene #29: 'del_5p15.33' versus Clinical Feature #6: 'HISTOLOGICAL_TYPE'

P value = 0.000878 (Fisher's exact test), Q value = 0.0061
Table S78. Gene #30: 'del_5q34' versus Clinical Feature #4: 'RADIATION_THERAPY'
| nPatients | NO | YES |
|---|---|---|
| ALL | 184 | 295 |
| DEL PEAK 10(5Q34) MUTATED | 11 | 48 |
| DEL PEAK 10(5Q34) WILD-TYPE | 173 | 247 |
Figure S78. Get High-res Image Gene #30: 'del_5q34' versus Clinical Feature #4: 'RADIATION_THERAPY'

P value = 1e-05 (Fisher's exact test), Q value = 0.00016
Table S79. Gene #30: 'del_5q34' versus Clinical Feature #6: 'HISTOLOGICAL_TYPE'
| nPatients | ASTROCYTOMA | OLIGOASTROCYTOMA | OLIGODENDROGLIOMA |
|---|---|---|---|
| ALL | 194 | 129 | 189 |
| DEL PEAK 10(5Q34) MUTATED | 41 | 14 | 9 |
| DEL PEAK 10(5Q34) WILD-TYPE | 153 | 115 | 180 |
Figure S79. Get High-res Image Gene #30: 'del_5q34' versus Clinical Feature #6: 'HISTOLOGICAL_TYPE'

P value = 0.000318 (logrank test), Q value = 0.0027
Table S80. Gene #31: 'del_6p25.3' versus Clinical Feature #1: 'Time to Death'
| nPatients | nDeath | Duration Range (Median), Month | |
|---|---|---|---|
| ALL | 508 | 125 | 0.0 - 211.2 (22.4) |
| DEL PEAK 11(6P25.3) MUTATED | 49 | 21 | 0.2 - 145.1 (19.3) |
| DEL PEAK 11(6P25.3) WILD-TYPE | 459 | 104 | 0.0 - 211.2 (22.4) |
Figure S80. Get High-res Image Gene #31: 'del_6p25.3' versus Clinical Feature #1: 'Time to Death'

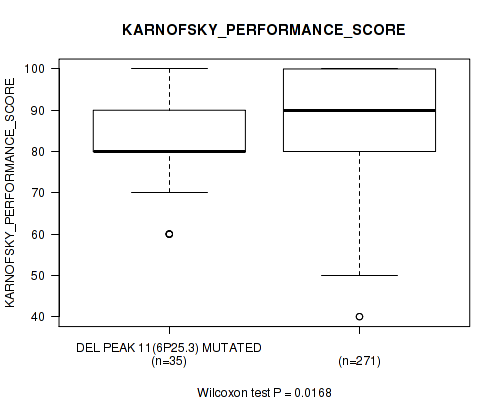
P value = 0.0168 (Wilcoxon-test), Q value = 0.071
Table S81. Gene #31: 'del_6p25.3' versus Clinical Feature #5: 'KARNOFSKY_PERFORMANCE_SCORE'
| nPatients | Mean (Std.Dev) | |
|---|---|---|
| ALL | 306 | 86.7 (12.6) |
| DEL PEAK 11(6P25.3) MUTATED | 35 | 82.6 (12.4) |
| DEL PEAK 11(6P25.3) WILD-TYPE | 271 | 87.2 (12.5) |
Figure S81. Get High-res Image Gene #31: 'del_6p25.3' versus Clinical Feature #5: 'KARNOFSKY_PERFORMANCE_SCORE'
P value = 1.34e-05 (logrank test), Q value = 2e-04
Table S82. Gene #32: 'del_6q22.31' versus Clinical Feature #1: 'Time to Death'
| nPatients | nDeath | Duration Range (Median), Month | |
|---|---|---|---|
| ALL | 508 | 125 | 0.0 - 211.2 (22.4) |
| DEL PEAK 12(6Q22.31) MUTATED | 76 | 28 | 0.1 - 117.4 (18.5) |
| DEL PEAK 12(6Q22.31) WILD-TYPE | 432 | 97 | 0.0 - 211.2 (23.5) |
Figure S82. Get High-res Image Gene #32: 'del_6q22.31' versus Clinical Feature #1: 'Time to Death'

P value = 0.0803 (Wilcoxon-test), Q value = 0.23
Table S83. Gene #32: 'del_6q22.31' versus Clinical Feature #2: 'YEARS_TO_BIRTH'
| nPatients | Mean (Std.Dev) | |
|---|---|---|
| ALL | 511 | 43.0 (13.3) |
| DEL PEAK 12(6Q22.31) MUTATED | 77 | 45.5 (13.8) |
| DEL PEAK 12(6Q22.31) WILD-TYPE | 434 | 42.5 (13.2) |
Figure S83. Get High-res Image Gene #32: 'del_6q22.31' versus Clinical Feature #2: 'YEARS_TO_BIRTH'

P value = 0.00487 (Fisher's exact test), Q value = 0.026
Table S84. Gene #32: 'del_6q22.31' versus Clinical Feature #4: 'RADIATION_THERAPY'
| nPatients | NO | YES |
|---|---|---|
| ALL | 184 | 295 |
| DEL PEAK 12(6Q22.31) MUTATED | 16 | 53 |
| DEL PEAK 12(6Q22.31) WILD-TYPE | 168 | 242 |
Figure S84. Get High-res Image Gene #32: 'del_6q22.31' versus Clinical Feature #4: 'RADIATION_THERAPY'

P value = 0.00186 (Wilcoxon-test), Q value = 0.011
Table S85. Gene #32: 'del_6q22.31' versus Clinical Feature #5: 'KARNOFSKY_PERFORMANCE_SCORE'
| nPatients | Mean (Std.Dev) | |
|---|---|---|
| ALL | 306 | 86.7 (12.6) |
| DEL PEAK 12(6Q22.31) MUTATED | 51 | 81.6 (13.9) |
| DEL PEAK 12(6Q22.31) WILD-TYPE | 255 | 87.7 (12.1) |
Figure S85. Get High-res Image Gene #32: 'del_6q22.31' versus Clinical Feature #5: 'KARNOFSKY_PERFORMANCE_SCORE'

P value = 1e-04 (Fisher's exact test), Q value = 0.0011
Table S86. Gene #32: 'del_6q22.31' versus Clinical Feature #6: 'HISTOLOGICAL_TYPE'
| nPatients | ASTROCYTOMA | OLIGOASTROCYTOMA | OLIGODENDROGLIOMA |
|---|---|---|---|
| ALL | 194 | 129 | 189 |
| DEL PEAK 12(6Q22.31) MUTATED | 47 | 11 | 19 |
| DEL PEAK 12(6Q22.31) WILD-TYPE | 147 | 118 | 170 |
Figure S86. Get High-res Image Gene #32: 'del_6q22.31' versus Clinical Feature #6: 'HISTOLOGICAL_TYPE'

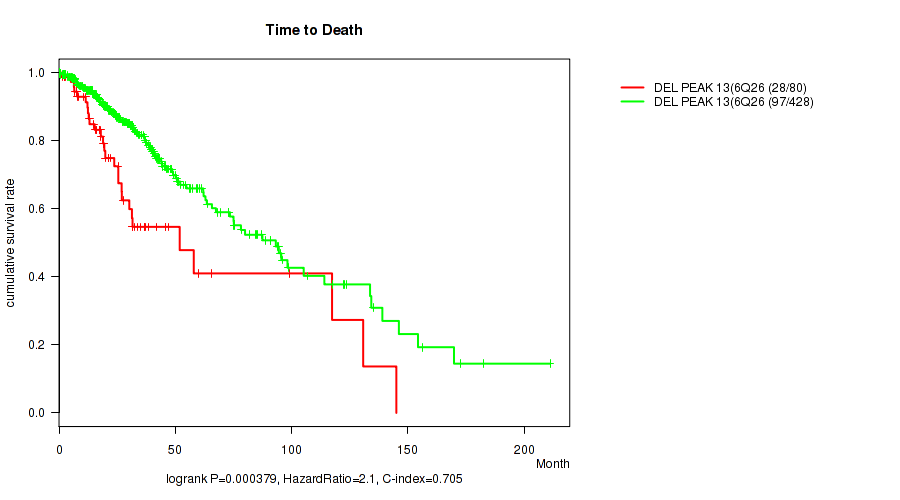
P value = 0.000379 (logrank test), Q value = 0.0032
Table S87. Gene #33: 'del_6q26' versus Clinical Feature #1: 'Time to Death'
| nPatients | nDeath | Duration Range (Median), Month | |
|---|---|---|---|
| ALL | 508 | 125 | 0.0 - 211.2 (22.4) |
| DEL PEAK 13(6Q26) MUTATED | 80 | 28 | 0.0 - 145.1 (18.5) |
| DEL PEAK 13(6Q26) WILD-TYPE | 428 | 97 | 0.1 - 211.2 (23.6) |
Figure S87. Get High-res Image Gene #33: 'del_6q26' versus Clinical Feature #1: 'Time to Death'
P value = 0.0123 (Fisher's exact test), Q value = 0.055
Table S88. Gene #33: 'del_6q26' versus Clinical Feature #4: 'RADIATION_THERAPY'
| nPatients | NO | YES |
|---|---|---|
| ALL | 184 | 295 |
| DEL PEAK 13(6Q26) MUTATED | 18 | 54 |
| DEL PEAK 13(6Q26) WILD-TYPE | 166 | 241 |
Figure S88. Get High-res Image Gene #33: 'del_6q26' versus Clinical Feature #4: 'RADIATION_THERAPY'

P value = 0.00944 (Wilcoxon-test), Q value = 0.046
Table S89. Gene #33: 'del_6q26' versus Clinical Feature #5: 'KARNOFSKY_PERFORMANCE_SCORE'
| nPatients | Mean (Std.Dev) | |
|---|---|---|
| ALL | 306 | 86.7 (12.6) |
| DEL PEAK 13(6Q26) MUTATED | 52 | 82.5 (13.8) |
| DEL PEAK 13(6Q26) WILD-TYPE | 254 | 87.5 (12.2) |
Figure S89. Get High-res Image Gene #33: 'del_6q26' versus Clinical Feature #5: 'KARNOFSKY_PERFORMANCE_SCORE'

P value = 8e-05 (Fisher's exact test), Q value = 0.00092
Table S90. Gene #33: 'del_6q26' versus Clinical Feature #6: 'HISTOLOGICAL_TYPE'
| nPatients | ASTROCYTOMA | OLIGOASTROCYTOMA | OLIGODENDROGLIOMA |
|---|---|---|---|
| ALL | 194 | 129 | 189 |
| DEL PEAK 13(6Q26) MUTATED | 48 | 12 | 21 |
| DEL PEAK 13(6Q26) WILD-TYPE | 146 | 117 | 168 |
Figure S90. Get High-res Image Gene #33: 'del_6q26' versus Clinical Feature #6: 'HISTOLOGICAL_TYPE'

P value = 1.4e-06 (logrank test), Q value = 3.9e-05
Table S91. Gene #36: 'del_9p23' versus Clinical Feature #1: 'Time to Death'
| nPatients | nDeath | Duration Range (Median), Month | |
|---|---|---|---|
| ALL | 508 | 125 | 0.0 - 211.2 (22.4) |
| DEL PEAK 16(9P23) MUTATED | 148 | 54 | 0.1 - 169.8 (21.8) |
| DEL PEAK 16(9P23) WILD-TYPE | 360 | 71 | 0.0 - 211.2 (22.5) |
Figure S91. Get High-res Image Gene #36: 'del_9p23' versus Clinical Feature #1: 'Time to Death'
P value = 0.000504 (Wilcoxon-test), Q value = 0.0039
Table S92. Gene #36: 'del_9p23' versus Clinical Feature #2: 'YEARS_TO_BIRTH'
| nPatients | Mean (Std.Dev) | |
|---|---|---|
| ALL | 511 | 43.0 (13.3) |
| DEL PEAK 16(9P23) MUTATED | 148 | 46.2 (13.5) |
| DEL PEAK 16(9P23) WILD-TYPE | 363 | 41.7 (13.1) |
Figure S92. Get High-res Image Gene #36: 'del_9p23' versus Clinical Feature #2: 'YEARS_TO_BIRTH'

P value = 7.03e-05 (Fisher's exact test), Q value = 0.00084
Table S93. Gene #36: 'del_9p23' versus Clinical Feature #4: 'RADIATION_THERAPY'
| nPatients | NO | YES |
|---|---|---|
| ALL | 184 | 295 |
| DEL PEAK 16(9P23) MUTATED | 33 | 102 |
| DEL PEAK 16(9P23) WILD-TYPE | 151 | 193 |
Figure S93. Get High-res Image Gene #36: 'del_9p23' versus Clinical Feature #4: 'RADIATION_THERAPY'
P value = 8.72e-05 (Wilcoxon-test), Q value = 0.00095
Table S94. Gene #36: 'del_9p23' versus Clinical Feature #5: 'KARNOFSKY_PERFORMANCE_SCORE'
| nPatients | Mean (Std.Dev) | |
|---|---|---|
| ALL | 306 | 86.7 (12.6) |
| DEL PEAK 16(9P23) MUTATED | 96 | 82.6 (13.6) |
| DEL PEAK 16(9P23) WILD-TYPE | 210 | 88.5 (11.7) |
Figure S94. Get High-res Image Gene #36: 'del_9p23' versus Clinical Feature #5: 'KARNOFSKY_PERFORMANCE_SCORE'
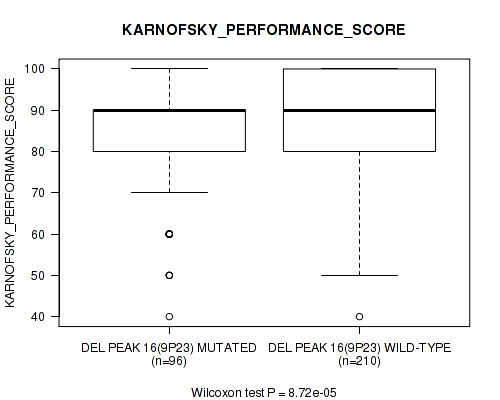
P value = 0.00772 (Fisher's exact test), Q value = 0.039
Table S95. Gene #36: 'del_9p23' versus Clinical Feature #6: 'HISTOLOGICAL_TYPE'
| nPatients | ASTROCYTOMA | OLIGOASTROCYTOMA | OLIGODENDROGLIOMA |
|---|---|---|---|
| ALL | 194 | 129 | 189 |
| DEL PEAK 16(9P23) MUTATED | 72 | 33 | 44 |
| DEL PEAK 16(9P23) WILD-TYPE | 122 | 96 | 145 |
Figure S95. Get High-res Image Gene #36: 'del_9p23' versus Clinical Feature #6: 'HISTOLOGICAL_TYPE'

P value = 5.83e-13 (logrank test), Q value = 1.1e-10
Table S96. Gene #37: 'del_9p21.3' versus Clinical Feature #1: 'Time to Death'
| nPatients | nDeath | Duration Range (Median), Month | |
|---|---|---|---|
| ALL | 508 | 125 | 0.0 - 211.2 (22.4) |
| DEL PEAK 17(9P21.3) MUTATED | 174 | 69 | 0.1 - 169.8 (20.0) |
| DEL PEAK 17(9P21.3) WILD-TYPE | 334 | 56 | 0.0 - 211.2 (24.1) |
Figure S96. Get High-res Image Gene #37: 'del_9p21.3' versus Clinical Feature #1: 'Time to Death'

P value = 9.28e-08 (Wilcoxon-test), Q value = 3.6e-06
Table S97. Gene #37: 'del_9p21.3' versus Clinical Feature #2: 'YEARS_TO_BIRTH'
| nPatients | Mean (Std.Dev) | |
|---|---|---|
| ALL | 511 | 43.0 (13.3) |
| DEL PEAK 17(9P21.3) MUTATED | 174 | 47.6 (14.0) |
| DEL PEAK 17(9P21.3) WILD-TYPE | 337 | 40.6 (12.4) |
Figure S97. Get High-res Image Gene #37: 'del_9p21.3' versus Clinical Feature #2: 'YEARS_TO_BIRTH'

P value = 8.48e-07 (Fisher's exact test), Q value = 2.8e-05
Table S98. Gene #37: 'del_9p21.3' versus Clinical Feature #4: 'RADIATION_THERAPY'
| nPatients | NO | YES |
|---|---|---|
| ALL | 184 | 295 |
| DEL PEAK 17(9P21.3) MUTATED | 36 | 121 |
| DEL PEAK 17(9P21.3) WILD-TYPE | 148 | 174 |
Figure S98. Get High-res Image Gene #37: 'del_9p21.3' versus Clinical Feature #4: 'RADIATION_THERAPY'
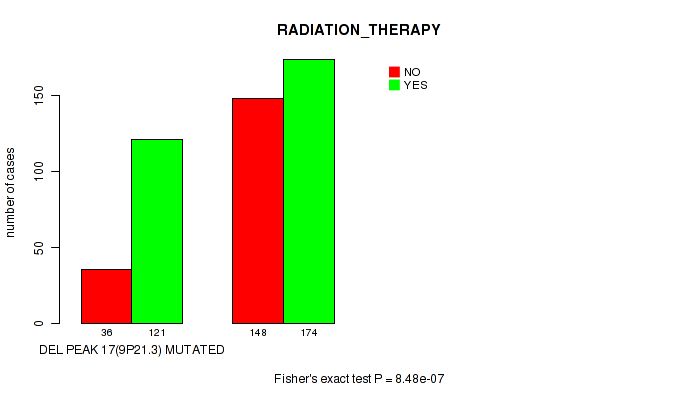
P value = 1.07e-05 (Wilcoxon-test), Q value = 0.00016
Table S99. Gene #37: 'del_9p21.3' versus Clinical Feature #5: 'KARNOFSKY_PERFORMANCE_SCORE'
| nPatients | Mean (Std.Dev) | |
|---|---|---|
| ALL | 306 | 86.7 (12.6) |
| DEL PEAK 17(9P21.3) MUTATED | 105 | 82.1 (14.3) |
| DEL PEAK 17(9P21.3) WILD-TYPE | 201 | 89.1 (10.9) |
Figure S99. Get High-res Image Gene #37: 'del_9p21.3' versus Clinical Feature #5: 'KARNOFSKY_PERFORMANCE_SCORE'

P value = 0.0015 (Fisher's exact test), Q value = 0.0094
Table S100. Gene #37: 'del_9p21.3' versus Clinical Feature #6: 'HISTOLOGICAL_TYPE'
| nPatients | ASTROCYTOMA | OLIGOASTROCYTOMA | OLIGODENDROGLIOMA |
|---|---|---|---|
| ALL | 194 | 129 | 189 |
| DEL PEAK 17(9P21.3) MUTATED | 85 | 36 | 54 |
| DEL PEAK 17(9P21.3) WILD-TYPE | 109 | 93 | 135 |
Figure S100. Get High-res Image Gene #37: 'del_9p21.3' versus Clinical Feature #6: 'HISTOLOGICAL_TYPE'

P value = 9.55e-15 (logrank test), Q value = 3.7e-12
Table S101. Gene #38: 'del_10q26.3' versus Clinical Feature #1: 'Time to Death'
| nPatients | nDeath | Duration Range (Median), Month | |
|---|---|---|---|
| ALL | 508 | 125 | 0.0 - 211.2 (22.4) |
| DEL PEAK 18(10Q26.3) MUTATED | 150 | 68 | 0.1 - 172.8 (18.2) |
| DEL PEAK 18(10Q26.3) WILD-TYPE | 358 | 57 | 0.0 - 211.2 (26.1) |
Figure S101. Get High-res Image Gene #38: 'del_10q26.3' versus Clinical Feature #1: 'Time to Death'

P value = 6.91e-08 (Wilcoxon-test), Q value = 3.4e-06
Table S102. Gene #38: 'del_10q26.3' versus Clinical Feature #2: 'YEARS_TO_BIRTH'
| nPatients | Mean (Std.Dev) | |
|---|---|---|
| ALL | 511 | 43.0 (13.3) |
| DEL PEAK 18(10Q26.3) MUTATED | 151 | 48.1 (13.9) |
| DEL PEAK 18(10Q26.3) WILD-TYPE | 360 | 40.8 (12.5) |
Figure S102. Get High-res Image Gene #38: 'del_10q26.3' versus Clinical Feature #2: 'YEARS_TO_BIRTH'
P value = 0.0641 (Fisher's exact test), Q value = 0.2
Table S103. Gene #38: 'del_10q26.3' versus Clinical Feature #3: 'GENDER'
| nPatients | FEMALE | MALE |
|---|---|---|
| ALL | 228 | 284 |
| DEL PEAK 18(10Q26.3) MUTATED | 77 | 74 |
| DEL PEAK 18(10Q26.3) WILD-TYPE | 151 | 210 |
Figure S103. Get High-res Image Gene #38: 'del_10q26.3' versus Clinical Feature #3: 'GENDER'

P value = 4.92e-06 (Fisher's exact test), Q value = 0.00011
Table S104. Gene #38: 'del_10q26.3' versus Clinical Feature #4: 'RADIATION_THERAPY'
| nPatients | NO | YES |
|---|---|---|
| ALL | 184 | 295 |
| DEL PEAK 18(10Q26.3) MUTATED | 32 | 109 |
| DEL PEAK 18(10Q26.3) WILD-TYPE | 152 | 186 |
Figure S104. Get High-res Image Gene #38: 'del_10q26.3' versus Clinical Feature #4: 'RADIATION_THERAPY'

P value = 0.0151 (Wilcoxon-test), Q value = 0.066
Table S105. Gene #38: 'del_10q26.3' versus Clinical Feature #5: 'KARNOFSKY_PERFORMANCE_SCORE'
| nPatients | Mean (Std.Dev) | |
|---|---|---|
| ALL | 306 | 86.7 (12.6) |
| DEL PEAK 18(10Q26.3) MUTATED | 90 | 83.3 (15.0) |
| DEL PEAK 18(10Q26.3) WILD-TYPE | 216 | 88.1 (11.2) |
Figure S105. Get High-res Image Gene #38: 'del_10q26.3' versus Clinical Feature #5: 'KARNOFSKY_PERFORMANCE_SCORE'

P value = 2e-05 (Fisher's exact test), Q value = 0.00027
Table S106. Gene #38: 'del_10q26.3' versus Clinical Feature #6: 'HISTOLOGICAL_TYPE'
| nPatients | ASTROCYTOMA | OLIGOASTROCYTOMA | OLIGODENDROGLIOMA |
|---|---|---|---|
| ALL | 194 | 129 | 189 |
| DEL PEAK 18(10Q26.3) MUTATED | 81 | 33 | 37 |
| DEL PEAK 18(10Q26.3) WILD-TYPE | 113 | 96 | 152 |
Figure S106. Get High-res Image Gene #38: 'del_10q26.3' versus Clinical Feature #6: 'HISTOLOGICAL_TYPE'

P value = 0.0566 (logrank test), Q value = 0.18
Table S107. Gene #39: 'del_11p15.5' versus Clinical Feature #1: 'Time to Death'
| nPatients | nDeath | Duration Range (Median), Month | |
|---|---|---|---|
| ALL | 508 | 125 | 0.0 - 211.2 (22.4) |
| DEL PEAK 19(11P15.5) MUTATED | 103 | 31 | 0.1 - 156.2 (20.2) |
| DEL PEAK 19(11P15.5) WILD-TYPE | 405 | 94 | 0.0 - 211.2 (23.2) |
Figure S107. Get High-res Image Gene #39: 'del_11p15.5' versus Clinical Feature #1: 'Time to Death'

P value = 0.014 (Wilcoxon-test), Q value = 0.062
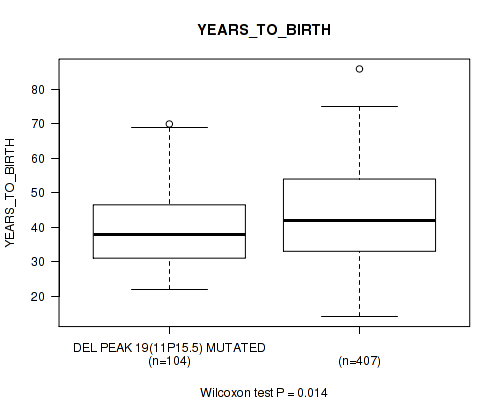
Table S108. Gene #39: 'del_11p15.5' versus Clinical Feature #2: 'YEARS_TO_BIRTH'
| nPatients | Mean (Std.Dev) | |
|---|---|---|
| ALL | 511 | 43.0 (13.3) |
| DEL PEAK 19(11P15.5) MUTATED | 104 | 40.1 (11.4) |
| DEL PEAK 19(11P15.5) WILD-TYPE | 407 | 43.7 (13.7) |
Figure S108. Get High-res Image Gene #39: 'del_11p15.5' versus Clinical Feature #2: 'YEARS_TO_BIRTH'
P value = 0.0035 (Fisher's exact test), Q value = 0.02
Table S109. Gene #39: 'del_11p15.5' versus Clinical Feature #4: 'RADIATION_THERAPY'
| nPatients | NO | YES |
|---|---|---|
| ALL | 184 | 295 |
| DEL PEAK 19(11P15.5) MUTATED | 25 | 73 |
| DEL PEAK 19(11P15.5) WILD-TYPE | 159 | 222 |
Figure S109. Get High-res Image Gene #39: 'del_11p15.5' versus Clinical Feature #4: 'RADIATION_THERAPY'
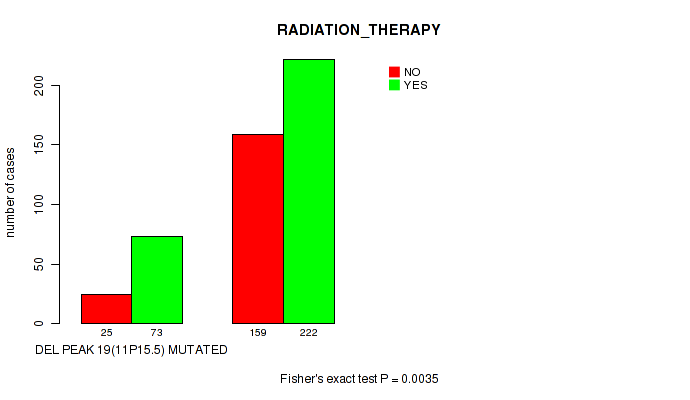
P value = 1e-05 (Fisher's exact test), Q value = 0.00016
Table S110. Gene #39: 'del_11p15.5' versus Clinical Feature #6: 'HISTOLOGICAL_TYPE'
| nPatients | ASTROCYTOMA | OLIGOASTROCYTOMA | OLIGODENDROGLIOMA |
|---|---|---|---|
| ALL | 194 | 129 | 189 |
| DEL PEAK 19(11P15.5) MUTATED | 57 | 30 | 17 |
| DEL PEAK 19(11P15.5) WILD-TYPE | 137 | 99 | 172 |
Figure S110. Get High-res Image Gene #39: 'del_11p15.5' versus Clinical Feature #6: 'HISTOLOGICAL_TYPE'

P value = 0.0103 (logrank test), Q value = 0.048
Table S111. Gene #40: 'del_11p15.1' versus Clinical Feature #1: 'Time to Death'
| nPatients | nDeath | Duration Range (Median), Month | |
|---|---|---|---|
| ALL | 508 | 125 | 0.0 - 211.2 (22.4) |
| DEL PEAK 20(11P15.1) MUTATED | 71 | 27 | 0.2 - 156.2 (21.5) |
| DEL PEAK 20(11P15.1) WILD-TYPE | 437 | 98 | 0.0 - 211.2 (22.4) |
Figure S111. Get High-res Image Gene #40: 'del_11p15.1' versus Clinical Feature #1: 'Time to Death'

P value = 0.00688 (Fisher's exact test), Q value = 0.035
Table S112. Gene #40: 'del_11p15.1' versus Clinical Feature #4: 'RADIATION_THERAPY'
| nPatients | NO | YES |
|---|---|---|
| ALL | 184 | 295 |
| DEL PEAK 20(11P15.1) MUTATED | 16 | 52 |
| DEL PEAK 20(11P15.1) WILD-TYPE | 168 | 243 |
Figure S112. Get High-res Image Gene #40: 'del_11p15.1' versus Clinical Feature #4: 'RADIATION_THERAPY'

P value = 0.0509 (Wilcoxon-test), Q value = 0.16
Table S113. Gene #40: 'del_11p15.1' versus Clinical Feature #5: 'KARNOFSKY_PERFORMANCE_SCORE'
| nPatients | Mean (Std.Dev) | |
|---|---|---|
| ALL | 306 | 86.7 (12.6) |
| DEL PEAK 20(11P15.1) MUTATED | 53 | 84.5 (11.5) |
| DEL PEAK 20(11P15.1) WILD-TYPE | 253 | 87.1 (12.8) |
Figure S113. Get High-res Image Gene #40: 'del_11p15.1' versus Clinical Feature #5: 'KARNOFSKY_PERFORMANCE_SCORE'

P value = 0.00016 (Fisher's exact test), Q value = 0.0015
Table S114. Gene #40: 'del_11p15.1' versus Clinical Feature #6: 'HISTOLOGICAL_TYPE'
| nPatients | ASTROCYTOMA | OLIGOASTROCYTOMA | OLIGODENDROGLIOMA |
|---|---|---|---|
| ALL | 194 | 129 | 189 |
| DEL PEAK 20(11P15.1) MUTATED | 43 | 15 | 14 |
| DEL PEAK 20(11P15.1) WILD-TYPE | 151 | 114 | 175 |
Figure S114. Get High-res Image Gene #40: 'del_11p15.1' versus Clinical Feature #6: 'HISTOLOGICAL_TYPE'

P value = 0.00177 (logrank test), Q value = 0.011
Table S115. Gene #41: 'del_12p13.1' versus Clinical Feature #1: 'Time to Death'
| nPatients | nDeath | Duration Range (Median), Month | |
|---|---|---|---|
| ALL | 508 | 125 | 0.0 - 211.2 (22.4) |
| DEL PEAK 21(12P13.1) MUTATED | 37 | 15 | 0.1 - 95.1 (21.4) |
| DEL PEAK 21(12P13.1) WILD-TYPE | 471 | 110 | 0.0 - 211.2 (22.5) |
Figure S115. Get High-res Image Gene #41: 'del_12p13.1' versus Clinical Feature #1: 'Time to Death'

P value = 0.0152 (Fisher's exact test), Q value = 0.066
Table S116. Gene #42: 'del_12q12' versus Clinical Feature #4: 'RADIATION_THERAPY'
| nPatients | NO | YES |
|---|---|---|
| ALL | 184 | 295 |
| DEL PEAK 22(12Q12) MUTATED | 17 | 51 |
| DEL PEAK 22(12Q12) WILD-TYPE | 167 | 244 |
Figure S116. Get High-res Image Gene #42: 'del_12q12' versus Clinical Feature #4: 'RADIATION_THERAPY'

P value = 5e-05 (Fisher's exact test), Q value = 0.00061
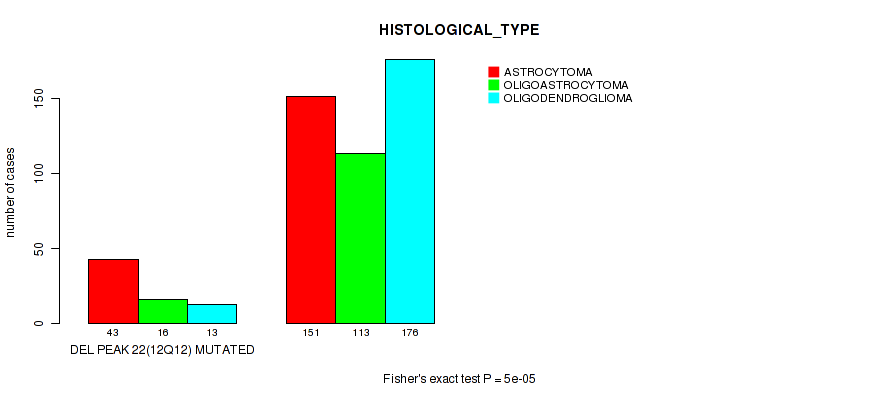
Table S117. Gene #42: 'del_12q12' versus Clinical Feature #6: 'HISTOLOGICAL_TYPE'
| nPatients | ASTROCYTOMA | OLIGOASTROCYTOMA | OLIGODENDROGLIOMA |
|---|---|---|---|
| ALL | 194 | 129 | 189 |
| DEL PEAK 22(12Q12) MUTATED | 43 | 16 | 13 |
| DEL PEAK 22(12Q12) WILD-TYPE | 151 | 113 | 176 |
Figure S117. Get High-res Image Gene #42: 'del_12q12' versus Clinical Feature #6: 'HISTOLOGICAL_TYPE'
P value = 0.0679 (Fisher's exact test), Q value = 0.21
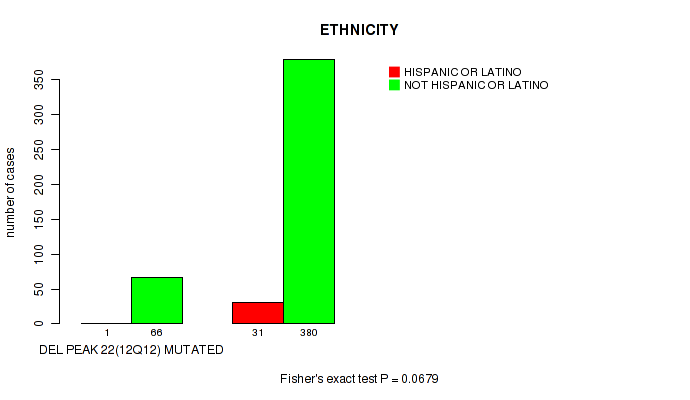
Table S118. Gene #42: 'del_12q12' versus Clinical Feature #8: 'ETHNICITY'
| nPatients | HISPANIC OR LATINO | NOT HISPANIC OR LATINO |
|---|---|---|
| ALL | 32 | 446 |
| DEL PEAK 22(12Q12) MUTATED | 1 | 66 |
| DEL PEAK 22(12Q12) WILD-TYPE | 31 | 380 |
Figure S118. Get High-res Image Gene #42: 'del_12q12' versus Clinical Feature #8: 'ETHNICITY'
P value = 0.0187 (logrank test), Q value = 0.075
Table S119. Gene #43: 'del_13q14.2' versus Clinical Feature #1: 'Time to Death'
| nPatients | nDeath | Duration Range (Median), Month | |
|---|---|---|---|
| ALL | 508 | 125 | 0.0 - 211.2 (22.4) |
| DEL PEAK 23(13Q14.2) MUTATED | 143 | 49 | 0.1 - 211.2 (20.6) |
| DEL PEAK 23(13Q14.2) WILD-TYPE | 365 | 76 | 0.0 - 182.3 (23.5) |
Figure S119. Get High-res Image Gene #43: 'del_13q14.2' versus Clinical Feature #1: 'Time to Death'
P value = 0.000169 (Fisher's exact test), Q value = 0.0015
Table S120. Gene #43: 'del_13q14.2' versus Clinical Feature #4: 'RADIATION_THERAPY'
| nPatients | NO | YES |
|---|---|---|
| ALL | 184 | 295 |
| DEL PEAK 23(13Q14.2) MUTATED | 34 | 101 |
| DEL PEAK 23(13Q14.2) WILD-TYPE | 150 | 194 |
Figure S120. Get High-res Image Gene #43: 'del_13q14.2' versus Clinical Feature #4: 'RADIATION_THERAPY'

P value = 0.00555 (Wilcoxon-test), Q value = 0.029
Table S121. Gene #43: 'del_13q14.2' versus Clinical Feature #5: 'KARNOFSKY_PERFORMANCE_SCORE'
| nPatients | Mean (Std.Dev) | |
|---|---|---|
| ALL | 306 | 86.7 (12.6) |
| DEL PEAK 23(13Q14.2) MUTATED | 91 | 83.6 (13.5) |
| DEL PEAK 23(13Q14.2) WILD-TYPE | 215 | 88.0 (12.0) |
Figure S121. Get High-res Image Gene #43: 'del_13q14.2' versus Clinical Feature #5: 'KARNOFSKY_PERFORMANCE_SCORE'

P value = 0.082 (Fisher's exact test), Q value = 0.24
Table S122. Gene #43: 'del_13q14.2' versus Clinical Feature #6: 'HISTOLOGICAL_TYPE'
| nPatients | ASTROCYTOMA | OLIGOASTROCYTOMA | OLIGODENDROGLIOMA |
|---|---|---|---|
| ALL | 194 | 129 | 189 |
| DEL PEAK 23(13Q14.2) MUTATED | 64 | 37 | 43 |
| DEL PEAK 23(13Q14.2) WILD-TYPE | 130 | 92 | 146 |
Figure S122. Get High-res Image Gene #43: 'del_13q14.2' versus Clinical Feature #6: 'HISTOLOGICAL_TYPE'

P value = 0.0096 (logrank test), Q value = 0.046
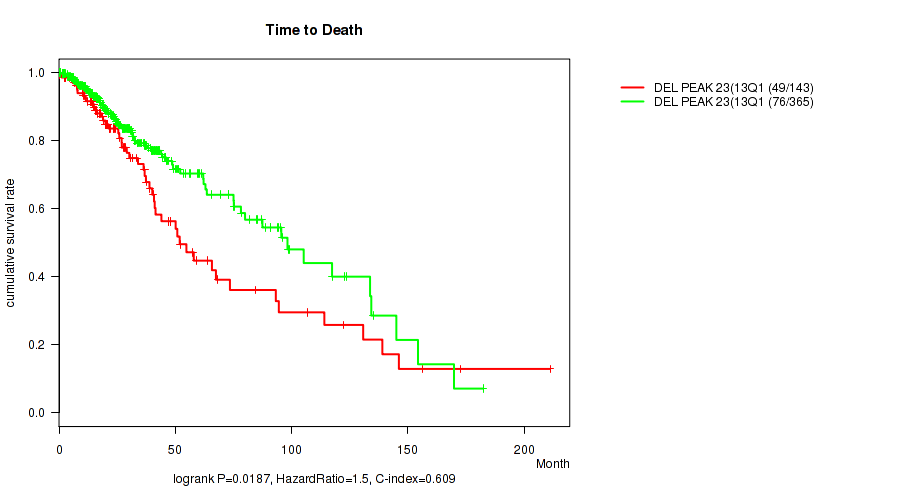
Table S123. Gene #44: 'del_13q34' versus Clinical Feature #1: 'Time to Death'
| nPatients | nDeath | Duration Range (Median), Month | |
|---|---|---|---|
| ALL | 508 | 125 | 0.0 - 211.2 (22.4) |
| DEL PEAK 24(13Q34) MUTATED | 110 | 39 | 0.1 - 211.2 (19.0) |
| DEL PEAK 24(13Q34) WILD-TYPE | 398 | 86 | 0.0 - 182.3 (24.2) |
Figure S123. Get High-res Image Gene #44: 'del_13q34' versus Clinical Feature #1: 'Time to Death'

P value = 0.0123 (Fisher's exact test), Q value = 0.055
Table S124. Gene #44: 'del_13q34' versus Clinical Feature #4: 'RADIATION_THERAPY'
| nPatients | NO | YES |
|---|---|---|
| ALL | 184 | 295 |
| DEL PEAK 24(13Q34) MUTATED | 29 | 76 |
| DEL PEAK 24(13Q34) WILD-TYPE | 155 | 219 |
Figure S124. Get High-res Image Gene #44: 'del_13q34' versus Clinical Feature #4: 'RADIATION_THERAPY'

P value = 0.000126 (logrank test), Q value = 0.0013
Table S125. Gene #45: 'del_14q24.3' versus Clinical Feature #1: 'Time to Death'
| nPatients | nDeath | Duration Range (Median), Month | |
|---|---|---|---|
| ALL | 508 | 125 | 0.0 - 211.2 (22.4) |
| DEL PEAK 25(14Q24.3) MUTATED | 121 | 45 | 0.1 - 130.8 (22.3) |
| DEL PEAK 25(14Q24.3) WILD-TYPE | 387 | 80 | 0.0 - 211.2 (22.5) |
Figure S125. Get High-res Image Gene #45: 'del_14q24.3' versus Clinical Feature #1: 'Time to Death'

P value = 0.0216 (Wilcoxon-test), Q value = 0.084
Table S126. Gene #45: 'del_14q24.3' versus Clinical Feature #2: 'YEARS_TO_BIRTH'
| nPatients | Mean (Std.Dev) | |
|---|---|---|
| ALL | 511 | 43.0 (13.3) |
| DEL PEAK 25(14Q24.3) MUTATED | 122 | 45.4 (13.1) |
| DEL PEAK 25(14Q24.3) WILD-TYPE | 389 | 42.2 (13.3) |
Figure S126. Get High-res Image Gene #45: 'del_14q24.3' versus Clinical Feature #2: 'YEARS_TO_BIRTH'

P value = 0.0765 (Fisher's exact test), Q value = 0.23
Table S127. Gene #45: 'del_14q24.3' versus Clinical Feature #3: 'GENDER'
| nPatients | FEMALE | MALE |
|---|---|---|
| ALL | 228 | 284 |
| DEL PEAK 25(14Q24.3) MUTATED | 63 | 59 |
| DEL PEAK 25(14Q24.3) WILD-TYPE | 165 | 225 |
Figure S127. Get High-res Image Gene #45: 'del_14q24.3' versus Clinical Feature #3: 'GENDER'

P value = 0.0196 (Wilcoxon-test), Q value = 0.077
Table S128. Gene #46: 'del_18q23' versus Clinical Feature #2: 'YEARS_TO_BIRTH'
| nPatients | Mean (Std.Dev) | |
|---|---|---|
| ALL | 511 | 43.0 (13.3) |
| DEL PEAK 26(18Q23) MUTATED | 78 | 46.7 (14.6) |
| DEL PEAK 26(18Q23) WILD-TYPE | 433 | 42.3 (13.0) |
Figure S128. Get High-res Image Gene #46: 'del_18q23' versus Clinical Feature #2: 'YEARS_TO_BIRTH'

P value = 0.000321 (logrank test), Q value = 0.0027
Table S129. Gene #47: 'del_19q13.42' versus Clinical Feature #1: 'Time to Death'
| nPatients | nDeath | Duration Range (Median), Month | |
|---|---|---|---|
| ALL | 508 | 125 | 0.0 - 211.2 (22.4) |
| DEL PEAK 27(19Q13.42) MUTATED | 274 | 54 | 0.0 - 182.3 (24.2) |
| DEL PEAK 27(19Q13.42) WILD-TYPE | 234 | 71 | 0.1 - 211.2 (20.6) |
Figure S129. Get High-res Image Gene #47: 'del_19q13.42' versus Clinical Feature #1: 'Time to Death'

P value = 0.000664 (Fisher's exact test), Q value = 0.0049
Table S130. Gene #47: 'del_19q13.42' versus Clinical Feature #4: 'RADIATION_THERAPY'
| nPatients | NO | YES |
|---|---|---|
| ALL | 184 | 295 |
| DEL PEAK 27(19Q13.42) MUTATED | 119 | 143 |
| DEL PEAK 27(19Q13.42) WILD-TYPE | 65 | 152 |
Figure S130. Get High-res Image Gene #47: 'del_19q13.42' versus Clinical Feature #4: 'RADIATION_THERAPY'

P value = 1e-05 (Fisher's exact test), Q value = 0.00016
Table S131. Gene #47: 'del_19q13.42' versus Clinical Feature #6: 'HISTOLOGICAL_TYPE'
| nPatients | ASTROCYTOMA | OLIGOASTROCYTOMA | OLIGODENDROGLIOMA |
|---|---|---|---|
| ALL | 194 | 129 | 189 |
| DEL PEAK 27(19Q13.42) MUTATED | 60 | 64 | 154 |
| DEL PEAK 27(19Q13.42) WILD-TYPE | 134 | 65 | 35 |
Figure S131. Get High-res Image Gene #47: 'del_19q13.42' versus Clinical Feature #6: 'HISTOLOGICAL_TYPE'

P value = 3.86e-06 (logrank test), Q value = 9.5e-05
Table S132. Gene #48: 'del_22q13.31' versus Clinical Feature #1: 'Time to Death'
| nPatients | nDeath | Duration Range (Median), Month | |
|---|---|---|---|
| ALL | 508 | 125 | 0.0 - 211.2 (22.4) |
| DEL PEAK 28(22Q13.31) MUTATED | 77 | 35 | 0.1 - 156.2 (21.3) |
| DEL PEAK 28(22Q13.31) WILD-TYPE | 431 | 90 | 0.0 - 211.2 (22.5) |
Figure S132. Get High-res Image Gene #48: 'del_22q13.31' versus Clinical Feature #1: 'Time to Death'
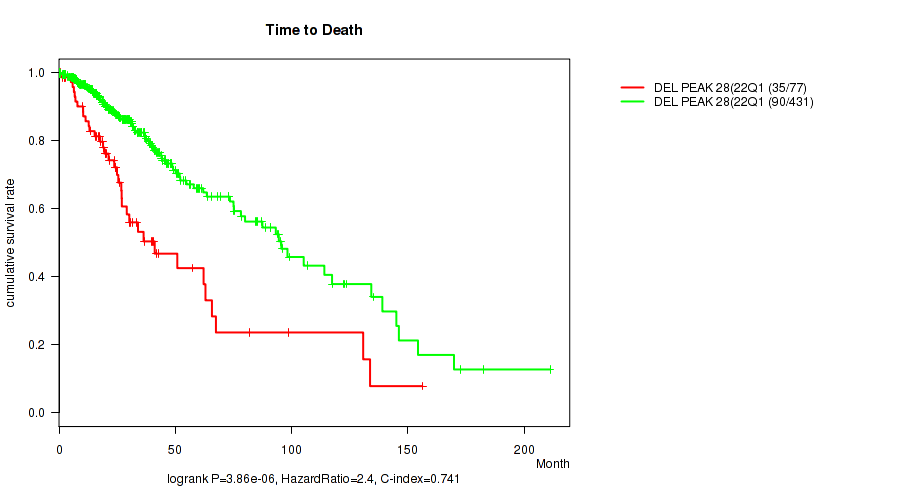
P value = 0.000444 (Wilcoxon-test), Q value = 0.0036
Table S133. Gene #48: 'del_22q13.31' versus Clinical Feature #2: 'YEARS_TO_BIRTH'
| nPatients | Mean (Std.Dev) | |
|---|---|---|
| ALL | 511 | 43.0 (13.3) |
| DEL PEAK 28(22Q13.31) MUTATED | 77 | 48.4 (14.5) |
| DEL PEAK 28(22Q13.31) WILD-TYPE | 434 | 42.0 (12.9) |
Figure S133. Get High-res Image Gene #48: 'del_22q13.31' versus Clinical Feature #2: 'YEARS_TO_BIRTH'

P value = 0.0111 (Fisher's exact test), Q value = 0.051
Table S134. Gene #48: 'del_22q13.31' versus Clinical Feature #4: 'RADIATION_THERAPY'
| nPatients | NO | YES |
|---|---|---|
| ALL | 184 | 295 |
| DEL PEAK 28(22Q13.31) MUTATED | 17 | 52 |
| DEL PEAK 28(22Q13.31) WILD-TYPE | 167 | 243 |
Figure S134. Get High-res Image Gene #48: 'del_22q13.31' versus Clinical Feature #4: 'RADIATION_THERAPY'

P value = 0.0516 (Wilcoxon-test), Q value = 0.17
Table S135. Gene #48: 'del_22q13.31' versus Clinical Feature #5: 'KARNOFSKY_PERFORMANCE_SCORE'
| nPatients | Mean (Std.Dev) | |
|---|---|---|
| ALL | 306 | 86.7 (12.6) |
| DEL PEAK 28(22Q13.31) MUTATED | 49 | 83.3 (14.3) |
| DEL PEAK 28(22Q13.31) WILD-TYPE | 257 | 87.3 (12.2) |
Figure S135. Get High-res Image Gene #48: 'del_22q13.31' versus Clinical Feature #5: 'KARNOFSKY_PERFORMANCE_SCORE'

P value = 0.00107 (Fisher's exact test), Q value = 0.007
Table S136. Gene #48: 'del_22q13.31' versus Clinical Feature #6: 'HISTOLOGICAL_TYPE'
| nPatients | ASTROCYTOMA | OLIGOASTROCYTOMA | OLIGODENDROGLIOMA |
|---|---|---|---|
| ALL | 194 | 129 | 189 |
| DEL PEAK 28(22Q13.31) MUTATED | 44 | 15 | 18 |
| DEL PEAK 28(22Q13.31) WILD-TYPE | 150 | 114 | 171 |
Figure S136. Get High-res Image Gene #48: 'del_22q13.31' versus Clinical Feature #6: 'HISTOLOGICAL_TYPE'
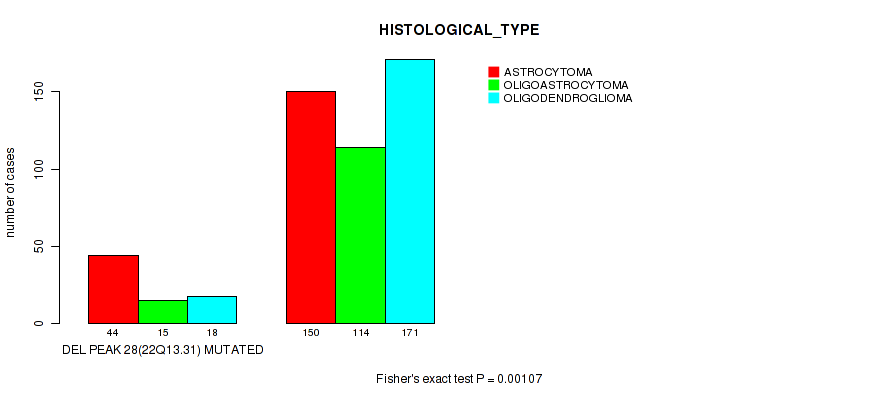
-
Copy number data file = all_lesions.txt from GISTIC pipeline
-
Processed Copy number data file = /xchip/cga/gdac-prod/tcga-gdac/jobResults/GDAC_Correlate_Genomic_Events_Preprocess/LGG-TP/22533658/transformed.cor.cli.txt
-
Clinical data file = /xchip/cga/gdac-prod/tcga-gdac/jobResults/Append_Data/LGG-TP/22506744/LGG-TP.merged_data.txt
-
Number of patients = 512
-
Number of significantly focal cnvs = 49
-
Number of selected clinical features = 8
-
Exclude genes that fewer than K tumors have mutations, K = 3
For survival clinical features, the Kaplan-Meier survival curves of tumors with and without gene mutations were plotted and the statistical significance P values were estimated by logrank test (Bland and Altman 2004) using the 'survdiff' function in R
For binary or multi-class clinical features (nominal or ordinal), two-tailed Fisher's exact tests (Fisher 1922) were used to estimate the P values using the 'fisher.test' function in R
For multiple hypothesis correction, Q value is the False Discovery Rate (FDR) analogue of the P value (Benjamini and Hochberg 1995), defined as the minimum FDR at which the test may be called significant. We used the 'Benjamini and Hochberg' method of 'p.adjust' function in R to convert P values into Q values.
In addition to the links below, the full results of the analysis summarized in this report can also be downloaded programmatically using firehose_get, or interactively from either the Broad GDAC website or TCGA Data Coordination Center Portal.