This pipeline computes the correlation between significant arm-level copy number variations (cnvs) and selected clinical features.
Testing the association between copy number variation 82 arm-level events and 7 clinical features across 573 patients, 28 significant findings detected with Q value < 0.25.
-
1q gain cnv correlated to 'YEARS_TO_BIRTH'.
-
2p gain cnv correlated to 'YEARS_TO_BIRTH'.
-
2q gain cnv correlated to 'YEARS_TO_BIRTH'.
-
3p gain cnv correlated to 'YEARS_TO_BIRTH'.
-
3q gain cnv correlated to 'YEARS_TO_BIRTH'.
-
5p gain cnv correlated to 'YEARS_TO_BIRTH'.
-
6p gain cnv correlated to 'YEARS_TO_BIRTH'.
-
6q gain cnv correlated to 'YEARS_TO_BIRTH'.
-
7p gain cnv correlated to 'YEARS_TO_BIRTH'.
-
7q gain cnv correlated to 'YEARS_TO_BIRTH'.
-
10p gain cnv correlated to 'YEARS_TO_BIRTH'.
-
10q gain cnv correlated to 'YEARS_TO_BIRTH'.
-
12p gain cnv correlated to 'YEARS_TO_BIRTH'.
-
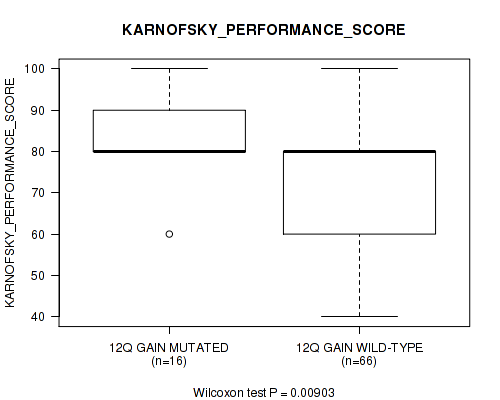
12q gain cnv correlated to 'YEARS_TO_BIRTH' and 'KARNOFSKY_PERFORMANCE_SCORE'.
-
13q gain cnv correlated to 'YEARS_TO_BIRTH'.
-
19q gain cnv correlated to 'YEARS_TO_BIRTH'.
-
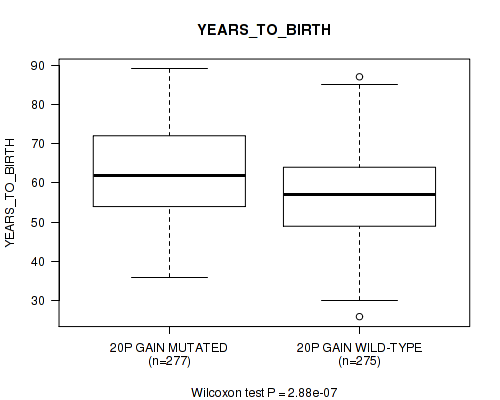
20p gain cnv correlated to 'YEARS_TO_BIRTH'.
-
20q gain cnv correlated to 'YEARS_TO_BIRTH'.
-
21q gain cnv correlated to 'YEARS_TO_BIRTH'.
-
8q loss cnv correlated to 'YEARS_TO_BIRTH'.
-
9q loss cnv correlated to 'YEARS_TO_BIRTH'.
-
11p loss cnv correlated to 'YEARS_TO_BIRTH'.
-
14q loss cnv correlated to 'YEARS_TO_BIRTH'.
-
15q loss cnv correlated to 'YEARS_TO_BIRTH'.
-
16q loss cnv correlated to 'YEARS_TO_BIRTH'.
-
xp loss cnv correlated to 'YEARS_TO_BIRTH'.
-
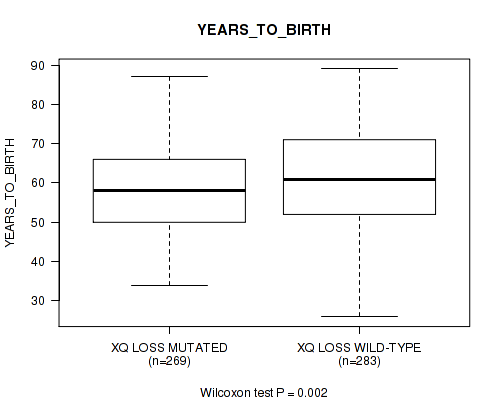
xq loss cnv correlated to 'YEARS_TO_BIRTH'.
Table 1. Get Full Table Overview of the association between significant copy number variation of 82 arm-level events and 7 clinical features. Shown in the table are P values (Q values). Thresholded by Q value < 0.25, 28 significant findings detected.
|
Clinical Features |
Time to Death |
YEARS TO BIRTH |
TUMOR TISSUE SITE |
RADIATION THERAPY |
KARNOFSKY PERFORMANCE SCORE |
RESIDUAL TUMOR |
ETHNICITY | ||
| nCNV (%) | nWild-Type | logrank test | Wilcoxon-test | Fisher's exact test | Fisher's exact test | Wilcoxon-test | Fisher's exact test | Fisher's exact test | |
| 12q gain | 177 (31%) | 396 |
0.227 (0.895) |
3.04e-07 (3.49e-05) |
0.0459 (0.598) |
0.165 (0.84) |
0.00903 (0.193) |
0.252 (0.895) |
0.462 (1.00) |
| 1q gain | 221 (39%) | 352 |
0.375 (1.00) |
0.000323 (0.0143) |
0.128 (0.785) |
0.162 (0.84) |
0.042 (0.588) |
0.678 (1.00) |
0.74 (1.00) |
| 2p gain | 186 (32%) | 387 |
0.0583 (0.629) |
5.5e-06 (0.000395) |
1 (1.00) |
0.182 (0.853) |
0.858 (1.00) |
0.874 (1.00) |
1 (1.00) |
| 2q gain | 153 (27%) | 420 |
0.252 (0.895) |
0.00314 (0.09) |
0.767 (1.00) |
1 (1.00) |
0.494 (1.00) |
1 (1.00) |
0.706 (1.00) |
| 3p gain | 162 (28%) | 411 |
0.33 (0.948) |
0.00429 (0.112) |
0.408 (1.00) |
1 (1.00) |
0.423 (1.00) |
0.326 (0.941) |
1 (1.00) |
| 3q gain | 275 (48%) | 298 |
0.0857 (0.698) |
1.03e-07 (1.97e-05) |
0.425 (1.00) |
0.374 (1.00) |
0.819 (1.00) |
0.649 (1.00) |
0.521 (1.00) |
| 5p gain | 197 (34%) | 376 |
0.957 (1.00) |
0.00886 (0.193) |
0.0982 (0.705) |
0.663 (1.00) |
0.483 (1.00) |
0.0712 (0.681) |
1 (1.00) |
| 6p gain | 171 (30%) | 402 |
0.202 (0.872) |
8.9e-07 (7.3e-05) |
0.782 (1.00) |
1 (1.00) |
0.0527 (0.619) |
1 (1.00) |
0.729 (1.00) |
| 6q gain | 100 (17%) | 473 |
0.469 (1.00) |
1.85e-05 (0.00118) |
1 (1.00) |
0.593 (1.00) |
0.232 (0.895) |
0.827 (1.00) |
0.674 (1.00) |
| 7p gain | 176 (31%) | 397 |
0.266 (0.918) |
0.000536 (0.022) |
0.299 (0.938) |
0.641 (1.00) |
0.185 (0.853) |
1 (1.00) |
0.179 (0.853) |
| 7q gain | 200 (35%) | 373 |
0.12 (0.785) |
0.0011 (0.0394) |
1 (1.00) |
0.665 (1.00) |
0.192 (0.869) |
0.959 (1.00) |
1 (1.00) |
| 10p gain | 187 (33%) | 386 |
0.31 (0.941) |
4.09e-08 (1.17e-05) |
0.0576 (0.629) |
0.665 (1.00) |
0.404 (1.00) |
0.855 (1.00) |
0.506 (1.00) |
| 10q gain | 108 (19%) | 465 |
0.391 (1.00) |
0.00508 (0.127) |
0.0696 (0.678) |
0.589 (1.00) |
0.915 (1.00) |
0.742 (1.00) |
0.694 (1.00) |
| 12p gain | 256 (45%) | 317 |
0.231 (0.895) |
1.14e-09 (6.54e-07) |
0.235 (0.895) |
0.659 (1.00) |
0.0679 (0.672) |
0.93 (1.00) |
0.326 (0.941) |
| 13q gain | 61 (11%) | 512 |
0.319 (0.941) |
0.0091 (0.193) |
1 (1.00) |
1 (1.00) |
0.202 (0.872) |
0.546 (1.00) |
0.612 (1.00) |
| 19q gain | 162 (28%) | 411 |
0.0573 (0.629) |
0.00392 (0.107) |
0.101 (0.705) |
0.137 (0.785) |
1 (1.00) |
0.578 (1.00) |
0.733 (1.00) |
| 20p gain | 286 (50%) | 287 |
0.0466 (0.598) |
2.88e-07 (3.49e-05) |
0.248 (0.895) |
0.373 (1.00) |
0.253 (0.895) |
0.499 (1.00) |
0.751 (1.00) |
| 20q gain | 325 (57%) | 248 |
0.208 (0.872) |
3.05e-05 (0.00175) |
0.4 (1.00) |
0.657 (1.00) |
0.235 (0.895) |
0.598 (1.00) |
0.353 (0.978) |
| 21q gain | 107 (19%) | 466 |
0.632 (1.00) |
0.00148 (0.0499) |
0.0404 (0.58) |
0.59 (1.00) |
0.423 (1.00) |
0.625 (1.00) |
0.679 (1.00) |
| 8q loss | 90 (16%) | 483 |
0.726 (1.00) |
0.00857 (0.193) |
1 (1.00) |
0.568 (1.00) |
0.431 (1.00) |
0.522 (1.00) |
1 (1.00) |
| 9q loss | 287 (50%) | 286 |
0.609 (1.00) |
4.07e-07 (3.89e-05) |
0.435 (1.00) |
1 (1.00) |
0.979 (1.00) |
0.739 (1.00) |
1 (1.00) |
| 11p loss | 198 (35%) | 375 |
0.647 (1.00) |
0.00162 (0.0516) |
0.152 (0.821) |
0.348 (0.975) |
0.957 (1.00) |
0.78 (1.00) |
0.731 (1.00) |
| 14q loss | 216 (38%) | 357 |
0.237 (0.895) |
0.000709 (0.0271) |
1 (1.00) |
1 (1.00) |
0.578 (1.00) |
0.458 (1.00) |
0.193 (0.869) |
| 15q loss | 277 (48%) | 296 |
0.27 (0.923) |
0.000136 (0.0065) |
0.423 (1.00) |
1 (1.00) |
0.481 (1.00) |
0.676 (1.00) |
0.525 (1.00) |
| 16q loss | 409 (71%) | 164 |
0.0771 (0.681) |
5.44e-05 (0.00284) |
1 (1.00) |
1 (1.00) |
0.129 (0.785) |
0.575 (1.00) |
0.159 (0.84) |
| xp loss | 324 (57%) | 249 |
0.965 (1.00) |
0.0106 (0.217) |
0.315 (0.941) |
0.397 (1.00) |
0.933 (1.00) |
0.52 (1.00) |
0.759 (1.00) |
| xq loss | 281 (49%) | 292 |
0.35 (0.975) |
0.002 (0.0604) |
0.626 (1.00) |
0.21 (0.872) |
0.397 (1.00) |
0.655 (1.00) |
0.752 (1.00) |
| 1p gain | 173 (30%) | 400 |
0.0899 (0.698) |
0.051 (0.619) |
0.781 (1.00) |
0.638 (1.00) |
0.0834 (0.698) |
0.435 (1.00) |
0.462 (1.00) |
| 4p gain | 61 (11%) | 512 |
0.0592 (0.629) |
0.0395 (0.58) |
0.0894 (0.698) |
0.0927 (0.7) |
0.765 (1.00) |
0.706 (1.00) |
1 (1.00) |
| 4q gain | 32 (6%) | 541 |
0.138 (0.785) |
0.0624 (0.638) |
1 (1.00) |
0.254 (0.895) |
0.168 (0.84) |
0.445 (1.00) |
|
| 5q gain | 59 (10%) | 514 |
0.716 (1.00) |
0.172 (0.849) |
0.217 (0.872) |
1 (1.00) |
0.148 (0.818) |
0.167 (0.84) |
1 (1.00) |
| 8p gain | 125 (22%) | 448 |
0.764 (1.00) |
0.756 (1.00) |
0.467 (1.00) |
0.592 (1.00) |
0.789 (1.00) |
0.74 (1.00) |
0.701 (1.00) |
| 8q gain | 248 (43%) | 325 |
0.25 (0.895) |
0.0977 (0.705) |
0.314 (0.941) |
0.393 (1.00) |
0.72 (1.00) |
0.279 (0.932) |
1 (1.00) |
| 9p gain | 89 (16%) | 484 |
0.386 (1.00) |
0.815 (1.00) |
1 (1.00) |
0.572 (1.00) |
0.682 (1.00) |
0.79 (1.00) |
0.37 (1.00) |
| 9q gain | 43 (8%) | 530 |
0.645 (1.00) |
0.182 (0.853) |
1 (1.00) |
0.324 (0.941) |
0.542 (1.00) |
1 (1.00) |
1 (1.00) |
| 11p gain | 73 (13%) | 500 |
0.0588 (0.629) |
0.682 (1.00) |
1 (1.00) |
1 (1.00) |
0.527 (1.00) |
1 (1.00) |
|
| 11q gain | 112 (20%) | 461 |
0.867 (1.00) |
0.999 (1.00) |
1 (1.00) |
0.589 (1.00) |
0.727 (1.00) |
0.0758 (0.681) |
0.218 (0.872) |
| 14q gain | 57 (10%) | 516 |
0.0889 (0.698) |
0.249 (0.895) |
1 (1.00) |
0.413 (1.00) |
0.766 (1.00) |
0.856 (1.00) |
0.609 (1.00) |
| 15q gain | 38 (7%) | 535 |
0.117 (0.782) |
0.769 (1.00) |
1 (1.00) |
1 (1.00) |
0.134 (0.785) |
1 (1.00) |
|
| 16p gain | 59 (10%) | 514 |
0.728 (1.00) |
0.204 (0.872) |
1 (1.00) |
1 (1.00) |
0.0528 (0.619) |
0.121 (0.785) |
1 (1.00) |
| 16q gain | 32 (6%) | 541 |
0.731 (1.00) |
0.95 (1.00) |
1 (1.00) |
1 (1.00) |
0.162 (0.84) |
0.219 (0.872) |
1 (1.00) |
| 17p gain | 21 (4%) | 552 |
0.105 (0.726) |
0.241 (0.895) |
1 (1.00) |
1 (1.00) |
0.923 (1.00) |
1 (1.00) |
|
| 17q gain | 41 (7%) | 532 |
0.921 (1.00) |
0.495 (1.00) |
1 (1.00) |
1 (1.00) |
0.347 (0.975) |
0.0915 (0.7) |
1 (1.00) |
| 18p gain | 119 (21%) | 454 |
0.125 (0.785) |
0.0255 (0.407) |
1 (1.00) |
0.589 (1.00) |
0.449 (1.00) |
0.363 (0.997) |
1 (1.00) |
| 18q gain | 67 (12%) | 506 |
0.178 (0.853) |
0.549 (1.00) |
1 (1.00) |
1 (1.00) |
0.745 (1.00) |
0.858 (1.00) |
0.612 (1.00) |
| 19p gain | 169 (29%) | 404 |
0.65 (1.00) |
0.0496 (0.619) |
0.783 (1.00) |
0.153 (0.821) |
0.449 (1.00) |
0.275 (0.932) |
0.731 (1.00) |
| 22q gain | 23 (4%) | 550 |
0.183 (0.853) |
0.851 (1.00) |
0.186 (0.853) |
1 (1.00) |
0.476 (1.00) |
1 (1.00) |
1 (1.00) |
| xp gain | 78 (14%) | 495 |
0.775 (1.00) |
0.138 (0.785) |
0.0328 (0.509) |
0.524 (1.00) |
0.772 (1.00) |
0.131 (0.785) |
1 (1.00) |
| xq gain | 108 (19%) | 465 |
0.859 (1.00) |
0.15 (0.818) |
0.0237 (0.389) |
0.589 (1.00) |
0.692 (1.00) |
1 (1.00) |
1 (1.00) |
| 1p loss | 60 (10%) | 513 |
0.844 (1.00) |
0.402 (1.00) |
1 (1.00) |
0.419 (1.00) |
0.148 (0.818) |
0.859 (1.00) |
0.302 (0.938) |
| 1q loss | 40 (7%) | 533 |
0.49 (1.00) |
0.721 (1.00) |
1 (1.00) |
0.283 (0.938) |
0.181 (0.853) |
0.588 (1.00) |
0.527 (1.00) |
| 2p loss | 52 (9%) | 521 |
0.956 (1.00) |
0.654 (1.00) |
1 (1.00) |
1 (1.00) |
0.166 (0.84) |
1 (1.00) |
|
| 2q loss | 62 (11%) | 511 |
0.638 (1.00) |
0.0374 (0.564) |
0.231 (0.895) |
1 (1.00) |
0.522 (1.00) |
0.655 (1.00) |
1 (1.00) |
| 3p loss | 96 (17%) | 477 |
0.363 (0.997) |
0.0139 (0.266) |
0.608 (1.00) |
1 (1.00) |
0.424 (1.00) |
0.242 (0.895) |
1 (1.00) |
| 3q loss | 42 (7%) | 531 |
0.471 (1.00) |
0.24 (0.895) |
0.317 (0.941) |
0.317 (0.941) |
0.739 (1.00) |
0.557 (1.00) |
|
| 4p loss | 312 (54%) | 261 |
0.499 (1.00) |
0.775 (1.00) |
0.412 (1.00) |
1 (1.00) |
0.126 (0.785) |
0.736 (1.00) |
1 (1.00) |
| 4q loss | 360 (63%) | 213 |
0.96 (1.00) |
0.614 (1.00) |
1 (1.00) |
0.656 (1.00) |
0.781 (1.00) |
0.668 (1.00) |
0.326 (0.941) |
| 5p loss | 132 (23%) | 441 |
0.997 (1.00) |
0.0157 (0.291) |
0.735 (1.00) |
0.593 (1.00) |
0.117 (0.782) |
0.124 (0.785) |
0.706 (1.00) |
| 5q loss | 226 (39%) | 347 |
0.291 (0.938) |
0.0214 (0.372) |
1 (1.00) |
1 (1.00) |
0.135 (0.785) |
0.194 (0.869) |
0.532 (1.00) |
| 6p loss | 159 (28%) | 414 |
0.399 (1.00) |
0.061 (0.636) |
1 (1.00) |
0.616 (1.00) |
0.91 (1.00) |
0.279 (0.932) |
0.73 (1.00) |
| 6q loss | 236 (41%) | 337 |
0.695 (1.00) |
0.0856 (0.698) |
0.5 (1.00) |
1 (1.00) |
0.631 (1.00) |
0.429 (1.00) |
0.526 (1.00) |
| 7p loss | 121 (21%) | 452 |
0.722 (1.00) |
0.679 (1.00) |
0.45 (1.00) |
0.59 (1.00) |
0.0995 (0.705) |
0.543 (1.00) |
0.694 (1.00) |
| 7q loss | 79 (14%) | 494 |
0.919 (1.00) |
0.289 (0.938) |
0.3 (0.938) |
0.534 (1.00) |
0.134 (0.785) |
0.549 (1.00) |
0.617 (1.00) |
| 8p loss | 268 (47%) | 305 |
0.304 (0.938) |
0.0468 (0.598) |
0.513 (1.00) |
1 (1.00) |
0.264 (0.918) |
0.277 (0.932) |
0.754 (1.00) |
| 9p loss | 264 (46%) | 309 |
0.799 (1.00) |
0.021 (0.372) |
0.413 (1.00) |
1 (1.00) |
0.76 (1.00) |
0.209 (0.872) |
0.526 (1.00) |
| 10p loss | 98 (17%) | 475 |
0.969 (1.00) |
0.212 (0.872) |
1 (1.00) |
0.595 (1.00) |
0.745 (1.00) |
0.629 (1.00) |
0.652 (1.00) |
| 10q loss | 127 (22%) | 446 |
0.613 (1.00) |
0.0947 (0.705) |
0.464 (1.00) |
0.303 (0.938) |
0.956 (1.00) |
1 (1.00) |
1 (1.00) |
| 11q loss | 147 (26%) | 426 |
0.287 (0.938) |
0.0135 (0.266) |
0.0804 (0.698) |
0.607 (1.00) |
0.29 (0.938) |
0.867 (1.00) |
0.708 (1.00) |
| 12p loss | 78 (14%) | 495 |
0.828 (1.00) |
0.0751 (0.681) |
1 (1.00) |
1 (1.00) |
0.632 (1.00) |
1 (1.00) |
1 (1.00) |
| 12q loss | 105 (18%) | 468 |
0.678 (1.00) |
0.381 (1.00) |
1 (1.00) |
0.59 (1.00) |
0.405 (1.00) |
0.675 (1.00) |
1 (1.00) |
| 13q loss | 304 (53%) | 269 |
0.206 (0.872) |
0.598 (1.00) |
0.517 (1.00) |
0.673 (1.00) |
0.888 (1.00) |
0.609 (1.00) |
0.524 (1.00) |
| 16p loss | 332 (58%) | 241 |
0.421 (1.00) |
0.168 (0.84) |
1 (1.00) |
0.077 (0.681) |
0.926 (1.00) |
1 (1.00) |
0.0973 (0.705) |
| 17p loss | 474 (83%) | 99 |
0.645 (1.00) |
0.377 (1.00) |
0.207 (0.872) |
1 (1.00) |
0.613 (1.00) |
0.294 (0.938) |
0.385 (1.00) |
| 17q loss | 384 (67%) | 189 |
0.621 (1.00) |
0.608 (1.00) |
0.801 (1.00) |
1 (1.00) |
0.0221 (0.373) |
0.573 (1.00) |
0.0889 (0.698) |
| 18p loss | 229 (40%) | 344 |
0.0446 (0.598) |
0.987 (1.00) |
0.496 (1.00) |
0.0855 (0.698) |
0.749 (1.00) |
0.348 (0.975) |
1 (1.00) |
| 18q loss | 285 (50%) | 288 |
0.246 (0.895) |
0.4 (1.00) |
0.528 (1.00) |
0.209 (0.872) |
0.73 (1.00) |
0.266 (0.918) |
0.207 (0.872) |
| 19p loss | 182 (32%) | 391 |
0.916 (1.00) |
0.074 (0.681) |
1 (1.00) |
1 (1.00) |
0.323 (0.941) |
0.219 (0.872) |
0.737 (1.00) |
| 19q loss | 173 (30%) | 400 |
0.3 (0.938) |
1 (1.00) |
0.288 (0.938) |
1 (1.00) |
0.129 (0.785) |
0.216 (0.872) |
0.513 (1.00) |
| 20p loss | 50 (9%) | 523 |
0.296 (0.938) |
0.324 (0.941) |
1 (1.00) |
0.376 (1.00) |
0.421 (1.00) |
0.106 (0.727) |
0.244 (0.895) |
| 20q loss | 33 (6%) | 540 |
0.349 (0.975) |
0.897 (1.00) |
1 (1.00) |
1 (1.00) |
0.476 (1.00) |
0.496 (1.00) |
|
| 21q loss | 198 (35%) | 375 |
0.316 (0.941) |
0.267 (0.918) |
0.797 (1.00) |
0.663 (1.00) |
0.173 (0.85) |
0.957 (1.00) |
0.75 (1.00) |
| 22q loss | 429 (75%) | 144 |
0.484 (1.00) |
0.141 (0.795) |
0.529 (1.00) |
0.34 (0.971) |
0.387 (1.00) |
0.0634 (0.638) |
1 (1.00) |
P value = 0.000323 (Wilcoxon-test), Q value = 0.014
Table S1. Gene #2: '1q gain' versus Clinical Feature #2: 'YEARS_TO_BIRTH'
| nPatients | Mean (Std.Dev) | |
|---|---|---|
| ALL | 552 | 59.8 (11.6) |
| 1Q GAIN MUTATED | 211 | 62.0 (10.7) |
| 1Q GAIN WILD-TYPE | 341 | 58.5 (11.9) |
Figure S1. Get High-res Image Gene #2: '1q gain' versus Clinical Feature #2: 'YEARS_TO_BIRTH'

P value = 5.5e-06 (Wilcoxon-test), Q value = 0.00039
Table S2. Gene #3: '2p gain' versus Clinical Feature #2: 'YEARS_TO_BIRTH'
| nPatients | Mean (Std.Dev) | |
|---|---|---|
| ALL | 552 | 59.8 (11.6) |
| 2P GAIN MUTATED | 177 | 63.2 (11.2) |
| 2P GAIN WILD-TYPE | 375 | 58.3 (11.4) |
Figure S2. Get High-res Image Gene #3: '2p gain' versus Clinical Feature #2: 'YEARS_TO_BIRTH'

P value = 0.00314 (Wilcoxon-test), Q value = 0.09
Table S3. Gene #4: '2q gain' versus Clinical Feature #2: 'YEARS_TO_BIRTH'
| nPatients | Mean (Std.Dev) | |
|---|---|---|
| ALL | 552 | 59.8 (11.6) |
| 2Q GAIN MUTATED | 146 | 62.2 (10.8) |
| 2Q GAIN WILD-TYPE | 406 | 59.0 (11.7) |
Figure S3. Get High-res Image Gene #4: '2q gain' versus Clinical Feature #2: 'YEARS_TO_BIRTH'

P value = 0.00429 (Wilcoxon-test), Q value = 0.11
Table S4. Gene #5: '3p gain' versus Clinical Feature #2: 'YEARS_TO_BIRTH'
| nPatients | Mean (Std.Dev) | |
|---|---|---|
| ALL | 552 | 59.8 (11.6) |
| 3P GAIN MUTATED | 156 | 62.1 (11.3) |
| 3P GAIN WILD-TYPE | 396 | 58.9 (11.5) |
Figure S4. Get High-res Image Gene #5: '3p gain' versus Clinical Feature #2: 'YEARS_TO_BIRTH'

P value = 1.03e-07 (Wilcoxon-test), Q value = 2e-05
Table S5. Gene #6: '3q gain' versus Clinical Feature #2: 'YEARS_TO_BIRTH'
| nPatients | Mean (Std.Dev) | |
|---|---|---|
| ALL | 552 | 59.8 (11.6) |
| 3Q GAIN MUTATED | 268 | 62.5 (11.1) |
| 3Q GAIN WILD-TYPE | 284 | 57.3 (11.4) |
Figure S5. Get High-res Image Gene #6: '3q gain' versus Clinical Feature #2: 'YEARS_TO_BIRTH'

P value = 0.00886 (Wilcoxon-test), Q value = 0.19
Table S6. Gene #9: '5p gain' versus Clinical Feature #2: 'YEARS_TO_BIRTH'
| nPatients | Mean (Std.Dev) | |
|---|---|---|
| ALL | 552 | 59.8 (11.6) |
| 5P GAIN MUTATED | 192 | 61.6 (11.7) |
| 5P GAIN WILD-TYPE | 360 | 58.9 (11.4) |
Figure S6. Get High-res Image Gene #9: '5p gain' versus Clinical Feature #2: 'YEARS_TO_BIRTH'

P value = 8.9e-07 (Wilcoxon-test), Q value = 7.3e-05
Table S7. Gene #11: '6p gain' versus Clinical Feature #2: 'YEARS_TO_BIRTH'
| nPatients | Mean (Std.Dev) | |
|---|---|---|
| ALL | 552 | 59.8 (11.6) |
| 6P GAIN MUTATED | 167 | 63.4 (10.9) |
| 6P GAIN WILD-TYPE | 385 | 58.3 (11.5) |
Figure S7. Get High-res Image Gene #11: '6p gain' versus Clinical Feature #2: 'YEARS_TO_BIRTH'

P value = 1.85e-05 (Wilcoxon-test), Q value = 0.0012
Table S8. Gene #12: '6q gain' versus Clinical Feature #2: 'YEARS_TO_BIRTH'
| nPatients | Mean (Std.Dev) | |
|---|---|---|
| ALL | 552 | 59.8 (11.6) |
| 6Q GAIN MUTATED | 96 | 64.3 (10.6) |
| 6Q GAIN WILD-TYPE | 456 | 58.9 (11.5) |
Figure S8. Get High-res Image Gene #12: '6q gain' versus Clinical Feature #2: 'YEARS_TO_BIRTH'

P value = 0.000536 (Wilcoxon-test), Q value = 0.022
Table S9. Gene #13: '7p gain' versus Clinical Feature #2: 'YEARS_TO_BIRTH'
| nPatients | Mean (Std.Dev) | |
|---|---|---|
| ALL | 552 | 59.8 (11.6) |
| 7P GAIN MUTATED | 169 | 62.4 (10.9) |
| 7P GAIN WILD-TYPE | 383 | 58.7 (11.7) |
Figure S9. Get High-res Image Gene #13: '7p gain' versus Clinical Feature #2: 'YEARS_TO_BIRTH'

P value = 0.0011 (Wilcoxon-test), Q value = 0.039
Table S10. Gene #14: '7q gain' versus Clinical Feature #2: 'YEARS_TO_BIRTH'
| nPatients | Mean (Std.Dev) | |
|---|---|---|
| ALL | 552 | 59.8 (11.6) |
| 7Q GAIN MUTATED | 192 | 62.0 (11.1) |
| 7Q GAIN WILD-TYPE | 360 | 58.7 (11.7) |
Figure S10. Get High-res Image Gene #14: '7q gain' versus Clinical Feature #2: 'YEARS_TO_BIRTH'

P value = 4.09e-08 (Wilcoxon-test), Q value = 1.2e-05
Table S11. Gene #19: '10p gain' versus Clinical Feature #2: 'YEARS_TO_BIRTH'
| nPatients | Mean (Std.Dev) | |
|---|---|---|
| ALL | 552 | 59.8 (11.6) |
| 10P GAIN MUTATED | 181 | 63.6 (11.0) |
| 10P GAIN WILD-TYPE | 371 | 58.0 (11.4) |
Figure S11. Get High-res Image Gene #19: '10p gain' versus Clinical Feature #2: 'YEARS_TO_BIRTH'

P value = 0.00508 (Wilcoxon-test), Q value = 0.13
Table S12. Gene #20: '10q gain' versus Clinical Feature #2: 'YEARS_TO_BIRTH'
| nPatients | Mean (Std.Dev) | |
|---|---|---|
| ALL | 552 | 59.8 (11.6) |
| 10Q GAIN MUTATED | 104 | 62.6 (11.2) |
| 10Q GAIN WILD-TYPE | 448 | 59.2 (11.6) |
Figure S12. Get High-res Image Gene #20: '10q gain' versus Clinical Feature #2: 'YEARS_TO_BIRTH'

P value = 1.14e-09 (Wilcoxon-test), Q value = 6.5e-07
Table S13. Gene #23: '12p gain' versus Clinical Feature #2: 'YEARS_TO_BIRTH'
| nPatients | Mean (Std.Dev) | |
|---|---|---|
| ALL | 552 | 59.8 (11.6) |
| 12P GAIN MUTATED | 243 | 63.3 (11.1) |
| 12P GAIN WILD-TYPE | 309 | 57.1 (11.2) |
Figure S13. Get High-res Image Gene #23: '12p gain' versus Clinical Feature #2: 'YEARS_TO_BIRTH'

P value = 3.04e-07 (Wilcoxon-test), Q value = 3.5e-05
Table S14. Gene #24: '12q gain' versus Clinical Feature #2: 'YEARS_TO_BIRTH'
| nPatients | Mean (Std.Dev) | |
|---|---|---|
| ALL | 552 | 59.8 (11.6) |
| 12Q GAIN MUTATED | 167 | 63.6 (10.4) |
| 12Q GAIN WILD-TYPE | 385 | 58.2 (11.7) |
Figure S14. Get High-res Image Gene #24: '12q gain' versus Clinical Feature #2: 'YEARS_TO_BIRTH'

P value = 0.00903 (Wilcoxon-test), Q value = 0.19
Table S15. Gene #24: '12q gain' versus Clinical Feature #5: 'KARNOFSKY_PERFORMANCE_SCORE'
| nPatients | Mean (Std.Dev) | |
|---|---|---|
| ALL | 82 | 75.7 (13.9) |
| 12Q GAIN MUTATED | 16 | 83.8 (10.9) |
| 12Q GAIN WILD-TYPE | 66 | 73.8 (13.9) |
Figure S15. Get High-res Image Gene #24: '12q gain' versus Clinical Feature #5: 'KARNOFSKY_PERFORMANCE_SCORE'
P value = 0.0091 (Wilcoxon-test), Q value = 0.19
Table S16. Gene #25: '13q gain' versus Clinical Feature #2: 'YEARS_TO_BIRTH'
| nPatients | Mean (Std.Dev) | |
|---|---|---|
| ALL | 552 | 59.8 (11.6) |
| 13Q GAIN MUTATED | 58 | 63.3 (9.6) |
| 13Q GAIN WILD-TYPE | 494 | 59.4 (11.7) |
Figure S16. Get High-res Image Gene #25: '13q gain' versus Clinical Feature #2: 'YEARS_TO_BIRTH'

P value = 0.00392 (Wilcoxon-test), Q value = 0.11
Table S17. Gene #35: '19q gain' versus Clinical Feature #2: 'YEARS_TO_BIRTH'
| nPatients | Mean (Std.Dev) | |
|---|---|---|
| ALL | 552 | 59.8 (11.6) |
| 19Q GAIN MUTATED | 156 | 62.3 (11.5) |
| 19Q GAIN WILD-TYPE | 396 | 58.9 (11.5) |
Figure S17. Get High-res Image Gene #35: '19q gain' versus Clinical Feature #2: 'YEARS_TO_BIRTH'

P value = 2.88e-07 (Wilcoxon-test), Q value = 3.5e-05
Table S18. Gene #36: '20p gain' versus Clinical Feature #2: 'YEARS_TO_BIRTH'
| nPatients | Mean (Std.Dev) | |
|---|---|---|
| ALL | 552 | 59.8 (11.6) |
| 20P GAIN MUTATED | 277 | 62.3 (11.5) |
| 20P GAIN WILD-TYPE | 275 | 57.3 (11.1) |
Figure S18. Get High-res Image Gene #36: '20p gain' versus Clinical Feature #2: 'YEARS_TO_BIRTH'
P value = 3.05e-05 (Wilcoxon-test), Q value = 0.0018
Table S19. Gene #37: '20q gain' versus Clinical Feature #2: 'YEARS_TO_BIRTH'
| nPatients | Mean (Std.Dev) | |
|---|---|---|
| ALL | 552 | 59.8 (11.6) |
| 20Q GAIN MUTATED | 314 | 61.7 (11.8) |
| 20Q GAIN WILD-TYPE | 238 | 57.4 (10.8) |
Figure S19. Get High-res Image Gene #37: '20q gain' versus Clinical Feature #2: 'YEARS_TO_BIRTH'

P value = 0.00148 (Wilcoxon-test), Q value = 0.05
Table S20. Gene #38: '21q gain' versus Clinical Feature #2: 'YEARS_TO_BIRTH'
| nPatients | Mean (Std.Dev) | |
|---|---|---|
| ALL | 552 | 59.8 (11.6) |
| 21Q GAIN MUTATED | 104 | 63.1 (10.6) |
| 21Q GAIN WILD-TYPE | 448 | 59.1 (11.7) |
Figure S20. Get High-res Image Gene #38: '21q gain' versus Clinical Feature #2: 'YEARS_TO_BIRTH'

P value = 0.00857 (Wilcoxon-test), Q value = 0.19
Table S21. Gene #57: '8q loss' versus Clinical Feature #2: 'YEARS_TO_BIRTH'
| nPatients | Mean (Std.Dev) | |
|---|---|---|
| ALL | 552 | 59.8 (11.6) |
| 8Q LOSS MUTATED | 85 | 62.9 (11.9) |
| 8Q LOSS WILD-TYPE | 467 | 59.3 (11.4) |
Figure S21. Get High-res Image Gene #57: '8q loss' versus Clinical Feature #2: 'YEARS_TO_BIRTH'

P value = 4.07e-07 (Wilcoxon-test), Q value = 3.9e-05
Table S22. Gene #59: '9q loss' versus Clinical Feature #2: 'YEARS_TO_BIRTH'
| nPatients | Mean (Std.Dev) | |
|---|---|---|
| ALL | 552 | 59.8 (11.6) |
| 9Q LOSS MUTATED | 273 | 62.4 (11.3) |
| 9Q LOSS WILD-TYPE | 279 | 57.3 (11.3) |
Figure S22. Get High-res Image Gene #59: '9q loss' versus Clinical Feature #2: 'YEARS_TO_BIRTH'

P value = 0.00162 (Wilcoxon-test), Q value = 0.052
Table S23. Gene #62: '11p loss' versus Clinical Feature #2: 'YEARS_TO_BIRTH'
| nPatients | Mean (Std.Dev) | |
|---|---|---|
| ALL | 552 | 59.8 (11.6) |
| 11P LOSS MUTATED | 191 | 62.0 (11.5) |
| 11P LOSS WILD-TYPE | 361 | 58.7 (11.4) |
Figure S23. Get High-res Image Gene #62: '11p loss' versus Clinical Feature #2: 'YEARS_TO_BIRTH'

P value = 0.000709 (Wilcoxon-test), Q value = 0.027
Table S24. Gene #67: '14q loss' versus Clinical Feature #2: 'YEARS_TO_BIRTH'
| nPatients | Mean (Std.Dev) | |
|---|---|---|
| ALL | 552 | 59.8 (11.6) |
| 14Q LOSS MUTATED | 210 | 61.9 (11.3) |
| 14Q LOSS WILD-TYPE | 342 | 58.6 (11.6) |
Figure S24. Get High-res Image Gene #67: '14q loss' versus Clinical Feature #2: 'YEARS_TO_BIRTH'

P value = 0.000136 (Wilcoxon-test), Q value = 0.0065
Table S25. Gene #68: '15q loss' versus Clinical Feature #2: 'YEARS_TO_BIRTH'
| nPatients | Mean (Std.Dev) | |
|---|---|---|
| ALL | 552 | 59.8 (11.6) |
| 15Q LOSS MUTATED | 269 | 61.8 (11.3) |
| 15Q LOSS WILD-TYPE | 283 | 58.0 (11.5) |
Figure S25. Get High-res Image Gene #68: '15q loss' versus Clinical Feature #2: 'YEARS_TO_BIRTH'

P value = 5.44e-05 (Wilcoxon-test), Q value = 0.0028
Table S26. Gene #70: '16q loss' versus Clinical Feature #2: 'YEARS_TO_BIRTH'
| nPatients | Mean (Std.Dev) | |
|---|---|---|
| ALL | 552 | 59.8 (11.6) |
| 16Q LOSS MUTATED | 394 | 61.1 (11.4) |
| 16Q LOSS WILD-TYPE | 158 | 56.6 (11.4) |
Figure S26. Get High-res Image Gene #70: '16q loss' versus Clinical Feature #2: 'YEARS_TO_BIRTH'

P value = 0.0106 (Wilcoxon-test), Q value = 0.22
Table S27. Gene #81: 'xp loss' versus Clinical Feature #2: 'YEARS_TO_BIRTH'
| nPatients | Mean (Std.Dev) | |
|---|---|---|
| ALL | 552 | 59.8 (11.6) |
| XP LOSS MUTATED | 312 | 58.8 (11.5) |
| XP LOSS WILD-TYPE | 240 | 61.2 (11.6) |
Figure S27. Get High-res Image Gene #81: 'xp loss' versus Clinical Feature #2: 'YEARS_TO_BIRTH'

P value = 0.002 (Wilcoxon-test), Q value = 0.06
Table S28. Gene #82: 'xq loss' versus Clinical Feature #2: 'YEARS_TO_BIRTH'
| nPatients | Mean (Std.Dev) | |
|---|---|---|
| ALL | 552 | 59.8 (11.6) |
| XQ LOSS MUTATED | 269 | 58.3 (11.3) |
| XQ LOSS WILD-TYPE | 283 | 61.3 (11.6) |
Figure S28. Get High-res Image Gene #82: 'xq loss' versus Clinical Feature #2: 'YEARS_TO_BIRTH'
-
Copy number data file = broad_values_by_arm.txt from GISTIC pipeline
-
Processed Copy number data file = /xchip/cga/gdac-prod/tcga-gdac/jobResults/GDAC_Correlate_Genomic_Events_Preprocess/OV-TP/22534547/transformed.cor.cli.txt
-
Clinical data file = /xchip/cga/gdac-prod/tcga-gdac/jobResults/Append_Data/OV-TP/22507289/OV-TP.merged_data.txt
-
Number of patients = 573
-
Number of significantly arm-level cnvs = 82
-
Number of selected clinical features = 7
-
Exclude regions that fewer than K tumors have mutations, K = 3
For survival clinical features, the Kaplan-Meier survival curves of tumors with and without gene mutations were plotted and the statistical significance P values were estimated by logrank test (Bland and Altman 2004) using the 'survdiff' function in R
For binary or multi-class clinical features (nominal or ordinal), two-tailed Fisher's exact tests (Fisher 1922) were used to estimate the P values using the 'fisher.test' function in R
For multiple hypothesis correction, Q value is the False Discovery Rate (FDR) analogue of the P value (Benjamini and Hochberg 1995), defined as the minimum FDR at which the test may be called significant. We used the 'Benjamini and Hochberg' method of 'p.adjust' function in R to convert P values into Q values.
In addition to the links below, the full results of the analysis summarized in this report can also be downloaded programmatically using firehose_get, or interactively from either the Broad GDAC website or TCGA Data Coordination Center Portal.