This pipeline computes the correlation between significant copy number variation (cnv focal) genes and selected clinical features.
Testing the association between copy number variation 73 focal events and 7 clinical features across 573 patients, 28 significant findings detected with Q value < 0.25.
-
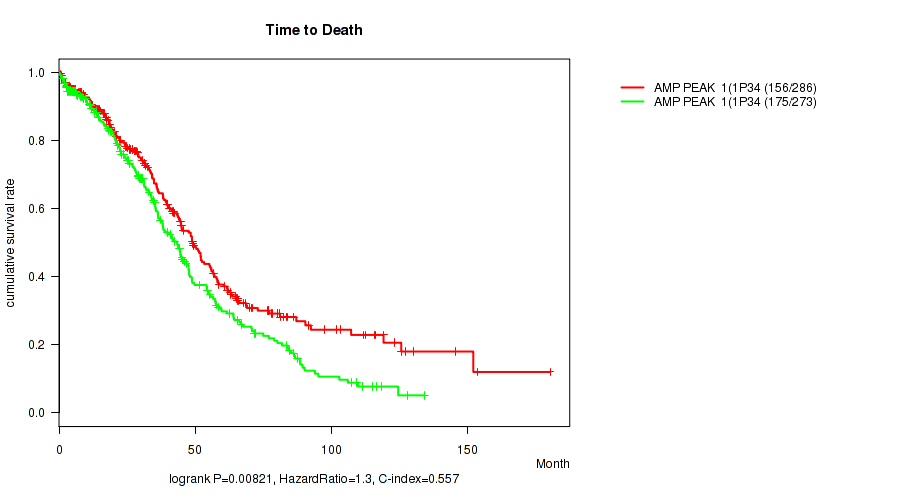
amp_1p34.3 cnv correlated to 'Time to Death'.
-
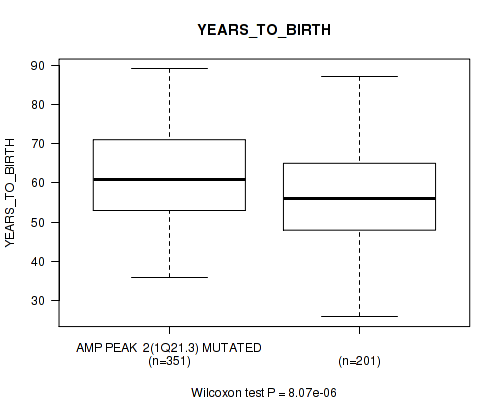
amp_1q21.3 cnv correlated to 'YEARS_TO_BIRTH'.
-
amp_1q42.2 cnv correlated to 'YEARS_TO_BIRTH'.
-
amp_3q26.2 cnv correlated to 'YEARS_TO_BIRTH'.
-
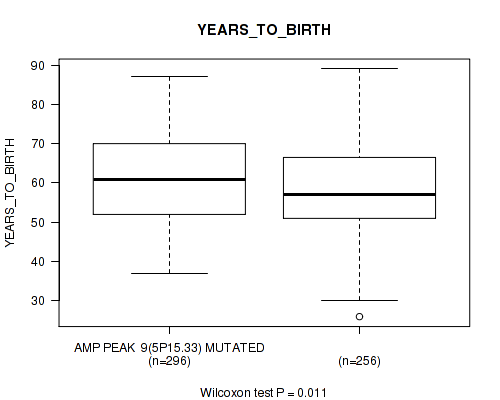
amp_5p15.33 cnv correlated to 'YEARS_TO_BIRTH'.
-
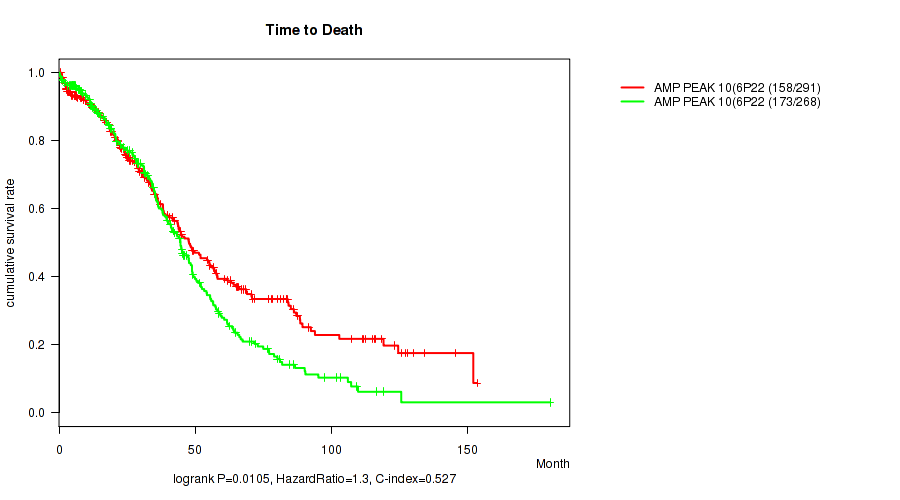
amp_6p22.3 cnv correlated to 'Time to Death' and 'YEARS_TO_BIRTH'.
-
amp_8p11.21 cnv correlated to 'YEARS_TO_BIRTH'.
-
amp_10p15.3 cnv correlated to 'YEARS_TO_BIRTH'.
-
amp_12p13.33 cnv correlated to 'YEARS_TO_BIRTH'.
-
amp_12p12.1 cnv correlated to 'YEARS_TO_BIRTH'.
-
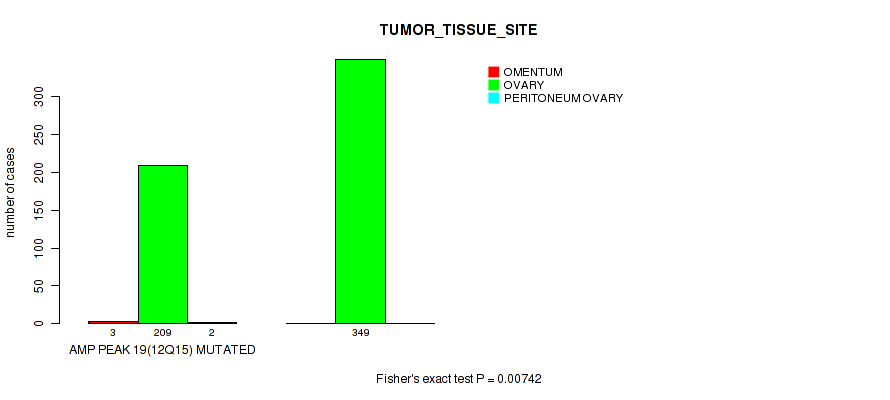
amp_12q15 cnv correlated to 'YEARS_TO_BIRTH' and 'TUMOR_TISSUE_SITE'.
-
amp_19q12 cnv correlated to 'YEARS_TO_BIRTH'.
-
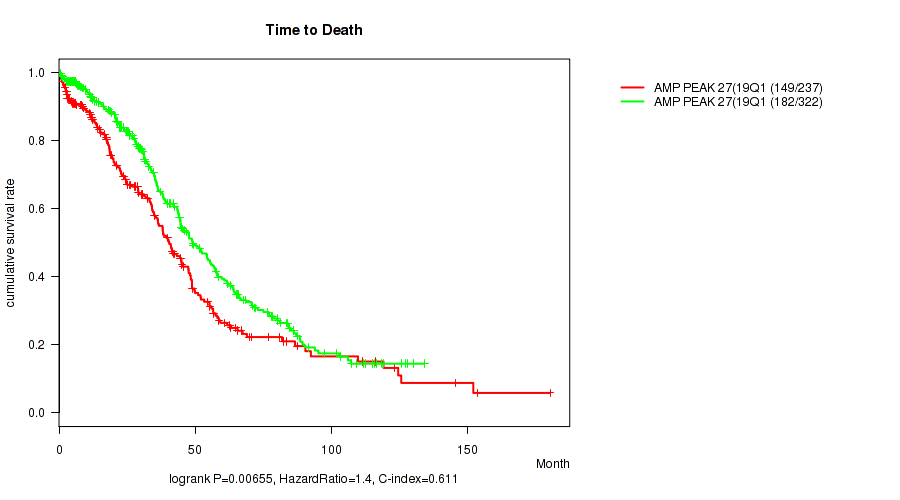
amp_19q13.2 cnv correlated to 'Time to Death' and 'YEARS_TO_BIRTH'.
-
amp_20p13 cnv correlated to 'YEARS_TO_BIRTH'.
-
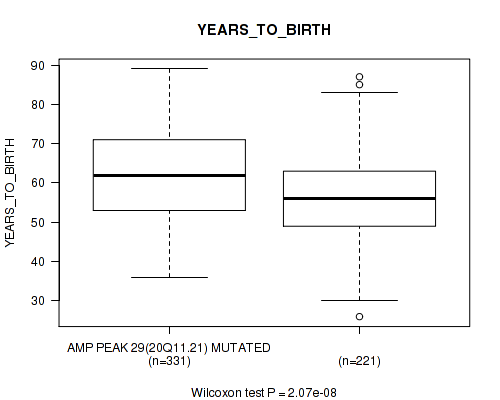
amp_20q11.21 cnv correlated to 'YEARS_TO_BIRTH'.
-
amp_20q13.33 cnv correlated to 'YEARS_TO_BIRTH'.
-
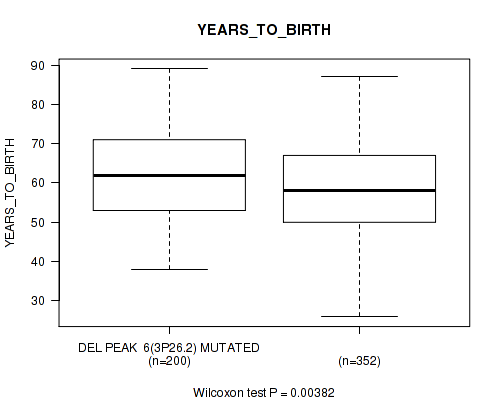
del_3p26.2 cnv correlated to 'YEARS_TO_BIRTH'.
-
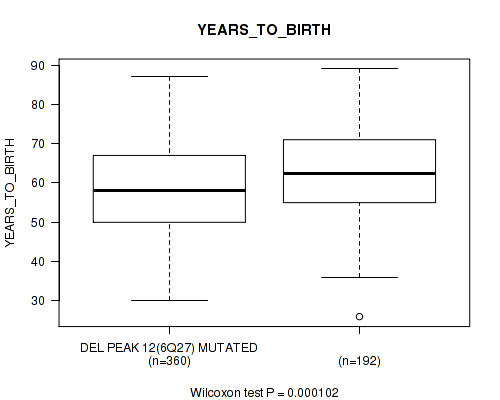
del_6q27 cnv correlated to 'YEARS_TO_BIRTH'.
-
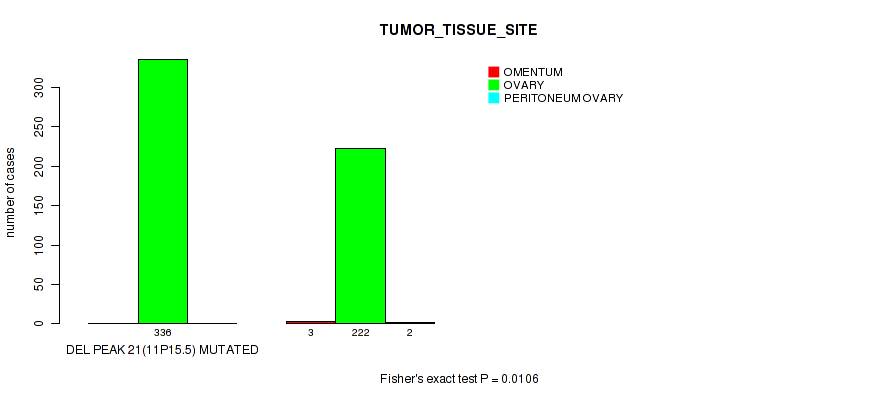
del_11p15.5 cnv correlated to 'TUMOR_TISSUE_SITE'.
-
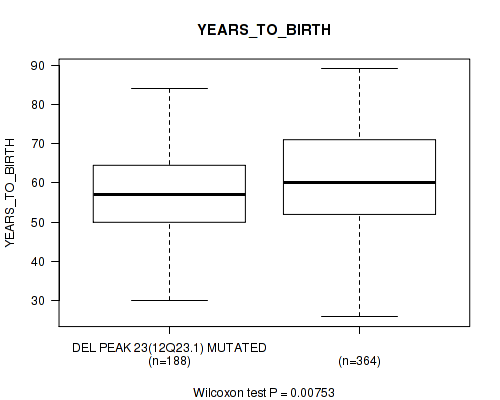
del_12q23.1 cnv correlated to 'YEARS_TO_BIRTH'.
-
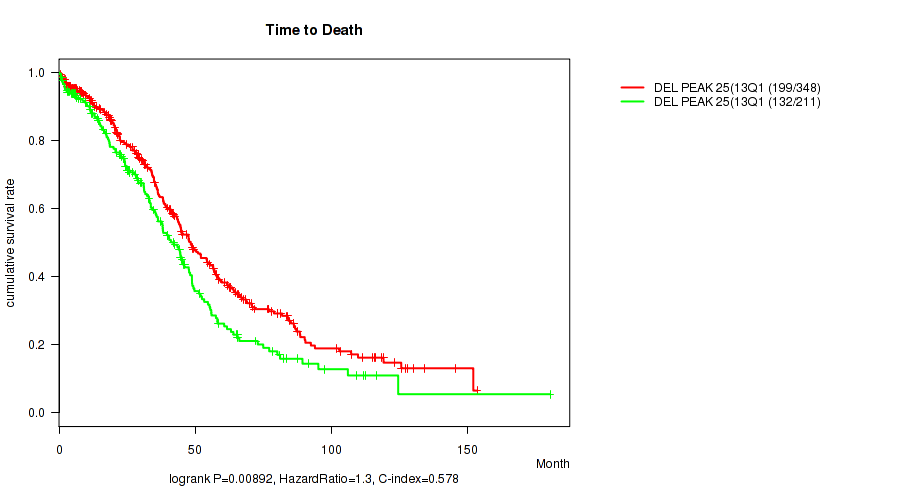
del_13q14.2 cnv correlated to 'Time to Death'.
-
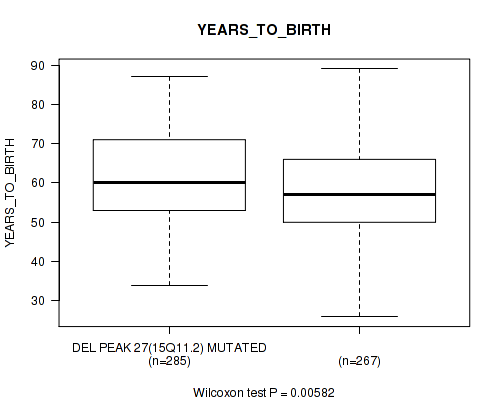
del_15q11.2 cnv correlated to 'YEARS_TO_BIRTH'.
-
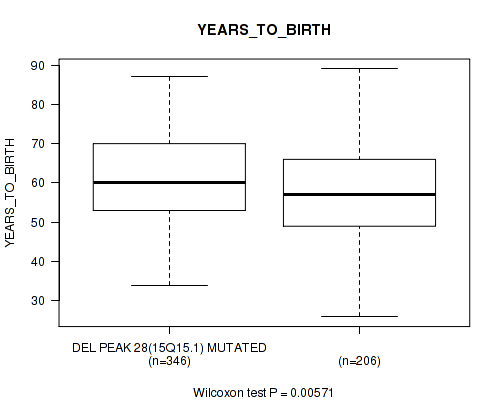
del_15q15.1 cnv correlated to 'YEARS_TO_BIRTH'.
-
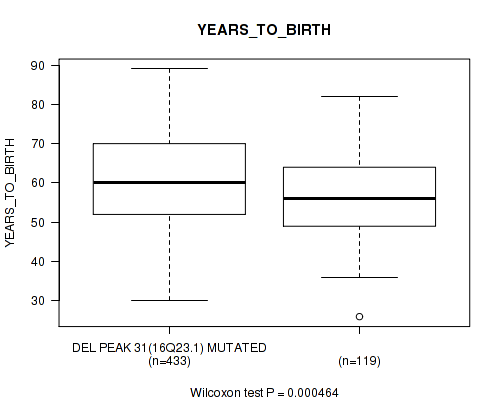
del_16q23.1 cnv correlated to 'YEARS_TO_BIRTH'.
-
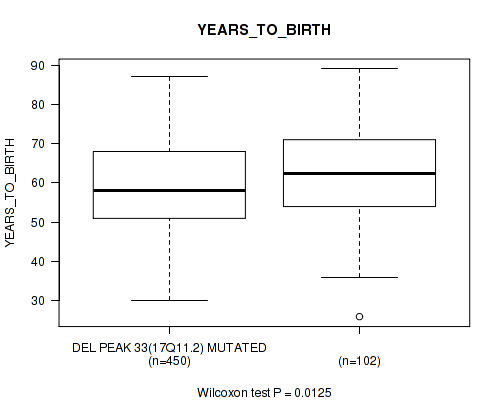
del_17q11.2 cnv correlated to 'YEARS_TO_BIRTH'.
Table 1. Get Full Table Overview of the association between significant copy number variation of 73 focal events and 7 clinical features. Shown in the table are P values (Q values). Thresholded by Q value < 0.25, 28 significant findings detected.
|
Clinical Features |
Time to Death |
YEARS TO BIRTH |
TUMOR TISSUE SITE |
RADIATION THERAPY |
KARNOFSKY PERFORMANCE SCORE |
RESIDUAL TUMOR |
ETHNICITY | ||
| nCNV (%) | nWild-Type | logrank test | Wilcoxon-test | Fisher's exact test | Fisher's exact test | Wilcoxon-test | Fisher's exact test | Fisher's exact test | |
| amp 6p22 3 | 300 (52%) | 273 |
0.0105 (0.208) |
0.00267 (0.091) |
1 (1.00) |
1 (1.00) |
0.289 (0.941) |
0.872 (1.00) |
0.342 (0.974) |
| amp 12q15 | 221 (39%) | 352 |
0.257 (0.912) |
4.56e-07 (5.83e-05) |
0.00742 (0.175) |
0.373 (0.989) |
0.343 (0.974) |
0.402 (0.994) |
0.739 (1.00) |
| amp 19q13 2 | 242 (42%) | 331 |
0.00655 (0.167) |
3.06e-06 (0.000313) |
0.0746 (0.508) |
1 (1.00) |
0.845 (1.00) |
0.739 (1.00) |
0.747 (1.00) |
| amp 1p34 3 | 291 (51%) | 282 |
0.00821 (0.182) |
0.0164 (0.27) |
1 (1.00) |
1 (1.00) |
0.654 (1.00) |
0.398 (0.994) |
1 (1.00) |
| amp 1q21 3 | 364 (64%) | 209 |
0.291 (0.941) |
8.07e-06 (0.000589) |
0.382 (0.989) |
0.36 (0.989) |
0.364 (0.989) |
0.0885 (0.552) |
1 (1.00) |
| amp 1q42 2 | 317 (55%) | 256 |
0.196 (0.798) |
0.000784 (0.0308) |
0.174 (0.761) |
0.182 (0.775) |
0.749 (1.00) |
0.883 (1.00) |
0.53 (1.00) |
| amp 3q26 2 | 479 (84%) | 94 |
0.693 (1.00) |
0.00206 (0.0751) |
1 (1.00) |
0.189 (0.784) |
0.0256 (0.336) |
0.828 (1.00) |
0.648 (1.00) |
| amp 5p15 33 | 305 (53%) | 268 |
0.0985 (0.579) |
0.011 (0.209) |
0.509 (1.00) |
0.187 (0.784) |
0.735 (1.00) |
0.165 (0.761) |
0.752 (1.00) |
| amp 8p11 21 | 210 (37%) | 363 |
0.0626 (0.498) |
0.000568 (0.0242) |
0.115 (0.615) |
1 (1.00) |
0.941 (1.00) |
0.784 (1.00) |
1 (1.00) |
| amp 10p15 3 | 250 (44%) | 323 |
0.0797 (0.534) |
0.000468 (0.0218) |
0.318 (0.966) |
0.659 (1.00) |
0.979 (1.00) |
0.651 (1.00) |
0.197 (0.798) |
| amp 12p13 33 | 328 (57%) | 245 |
0.431 (1.00) |
1.86e-07 (3.18e-05) |
0.401 (0.994) |
0.0729 (0.508) |
0.79 (1.00) |
0.277 (0.926) |
1 (1.00) |
| amp 12p12 1 | 311 (54%) | 262 |
0.0859 (0.546) |
1.45e-08 (5.3e-06) |
0.128 (0.659) |
1 (1.00) |
0.495 (1.00) |
1 (1.00) |
1 (1.00) |
| amp 19q12 | 319 (56%) | 254 |
0.0419 (0.42) |
2.94e-05 (0.00188) |
0.0437 (0.429) |
0.659 (1.00) |
0.715 (1.00) |
0.229 (0.854) |
1 (1.00) |
| amp 20p13 | 315 (55%) | 258 |
0.227 (0.853) |
0.00526 (0.157) |
0.327 (0.966) |
0.659 (1.00) |
0.169 (0.761) |
0.752 (1.00) |
0.524 (1.00) |
| amp 20q11 21 | 344 (60%) | 229 |
0.0865 (0.546) |
2.07e-08 (5.3e-06) |
1 (1.00) |
1 (1.00) |
0.361 (0.989) |
0.699 (1.00) |
0.748 (1.00) |
| amp 20q13 33 | 399 (70%) | 174 |
0.565 (1.00) |
6.57e-06 (0.000559) |
0.595 (1.00) |
0.641 (1.00) |
0.475 (1.00) |
0.0633 (0.498) |
0.731 (1.00) |
| del 3p26 2 | 208 (36%) | 365 |
0.474 (1.00) |
0.00382 (0.122) |
0.277 (0.926) |
1 (1.00) |
0.405 (0.994) |
0.537 (1.00) |
1 (1.00) |
| del 6q27 | 375 (65%) | 198 |
0.0222 (0.32) |
0.000102 (0.00578) |
0.368 (0.989) |
0.662 (1.00) |
0.968 (1.00) |
0.783 (1.00) |
1 (1.00) |
| del 11p15 5 | 340 (59%) | 233 |
0.0474 (0.432) |
0.363 (0.989) |
0.0106 (0.208) |
0.653 (1.00) |
0.539 (1.00) |
0.752 (1.00) |
1 (1.00) |
| del 12q23 1 | 193 (34%) | 380 |
0.29 (0.941) |
0.00753 (0.175) |
0.801 (1.00) |
1 (1.00) |
0.798 (1.00) |
0.957 (1.00) |
1 (1.00) |
| del 13q14 2 | 359 (63%) | 214 |
0.00892 (0.19) |
0.403 (0.994) |
0.382 (0.989) |
0.371 (0.989) |
0.843 (1.00) |
0.253 (0.905) |
0.746 (1.00) |
| del 15q11 2 | 296 (52%) | 277 |
0.603 (1.00) |
0.00582 (0.157) |
0.624 (1.00) |
1 (1.00) |
0.557 (1.00) |
0.465 (1.00) |
0.752 (1.00) |
| del 15q15 1 | 359 (63%) | 214 |
0.69 (1.00) |
0.00571 (0.157) |
0.793 (1.00) |
1 (1.00) |
0.708 (1.00) |
1 (1.00) |
0.327 (0.966) |
| del 16q23 1 | 447 (78%) | 126 |
0.227 (0.853) |
0.000464 (0.0218) |
0.712 (1.00) |
0.59 (1.00) |
0.0657 (0.501) |
0.051 (0.45) |
0.249 (0.894) |
| del 17q11 2 | 467 (82%) | 106 |
0.528 (1.00) |
0.0125 (0.228) |
0.0225 (0.32) |
1 (1.00) |
0.994 (1.00) |
1 (1.00) |
0.697 (1.00) |
| amp 2p23 2 | 247 (43%) | 326 |
0.52 (1.00) |
0.0926 (0.564) |
1 (1.00) |
1 (1.00) |
0.843 (1.00) |
0.785 (1.00) |
1 (1.00) |
| amp 2q31 2 | 259 (45%) | 314 |
0.232 (0.854) |
0.0245 (0.329) |
0.325 (0.966) |
0.662 (1.00) |
0.903 (1.00) |
0.847 (1.00) |
0.338 (0.974) |
| amp 4p16 3 | 162 (28%) | 411 |
0.583 (1.00) |
0.698 (1.00) |
0.583 (1.00) |
0.626 (1.00) |
0.209 (0.823) |
0.745 (1.00) |
0.468 (1.00) |
| amp 4q13 3 | 113 (20%) | 460 |
0.151 (0.744) |
0.198 (0.798) |
0.261 (0.912) |
0.265 (0.915) |
0.555 (1.00) |
0.105 (0.588) |
1 (1.00) |
| amp 7q36 3 | 316 (55%) | 257 |
0.149 (0.744) |
0.715 (1.00) |
1 (1.00) |
1 (1.00) |
0.0805 (0.534) |
0.849 (1.00) |
0.342 (0.974) |
| amp 8q24 21 | 455 (79%) | 118 |
0.712 (1.00) |
0.0981 (0.579) |
1 (1.00) |
0.273 (0.926) |
0.801 (1.00) |
0.923 (1.00) |
0.428 (1.00) |
| amp 10q22 3 | 182 (32%) | 391 |
0.475 (1.00) |
0.111 (0.611) |
0.0537 (0.458) |
0.659 (1.00) |
0.852 (1.00) |
0.461 (1.00) |
1 (1.00) |
| amp 11q14 1 | 252 (44%) | 321 |
0.652 (1.00) |
0.507 (1.00) |
0.634 (1.00) |
0.391 (0.994) |
0.76 (1.00) |
0.719 (1.00) |
0.526 (1.00) |
| amp 14q11 2 | 146 (25%) | 427 |
0.174 (0.761) |
0.0461 (0.429) |
0.0815 (0.534) |
1 (1.00) |
0.469 (1.00) |
0.741 (1.00) |
0.139 (0.703) |
| amp 14q32 33 | 156 (27%) | 417 |
0.267 (0.915) |
0.0187 (0.29) |
0.392 (0.994) |
0.122 (0.635) |
0.991 (1.00) |
0.956 (1.00) |
0.72 (1.00) |
| amp 15q26 3 | 160 (28%) | 413 |
0.024 (0.329) |
0.204 (0.813) |
1 (1.00) |
1 (1.00) |
0.833 (1.00) |
0.869 (1.00) |
0.733 (1.00) |
| amp 17q25 3 | 212 (37%) | 361 |
0.215 (0.826) |
0.768 (1.00) |
0.622 (1.00) |
0.656 (1.00) |
0.925 (1.00) |
0.0535 (0.458) |
1 (1.00) |
| amp 18q11 2 | 139 (24%) | 434 |
0.474 (1.00) |
0.11 (0.608) |
0.0724 (0.508) |
1 (1.00) |
0.435 (1.00) |
1 (1.00) |
0.26 (0.912) |
| amp 19p13 12 | 314 (55%) | 259 |
0.784 (1.00) |
0.0414 (0.42) |
0.797 (1.00) |
1 (1.00) |
0.318 (0.966) |
0.265 (0.915) |
1 (1.00) |
| amp 22q12 2 | 91 (16%) | 482 |
0.868 (1.00) |
0.0413 (0.42) |
0.0927 (0.564) |
1 (1.00) |
0.302 (0.964) |
0.622 (1.00) |
0.173 (0.761) |
| amp xp11 23 | 159 (28%) | 414 |
0.232 (0.854) |
0.104 (0.588) |
0.0347 (0.42) |
1 (1.00) |
0.554 (1.00) |
0.191 (0.786) |
1 (1.00) |
| amp xq28 | 217 (38%) | 356 |
0.631 (1.00) |
0.624 (1.00) |
1 (1.00) |
0.373 (0.989) |
0.245 (0.887) |
0.53 (1.00) |
0.327 (0.966) |
| del 1p36 11 | 266 (46%) | 307 |
0.0388 (0.42) |
0.289 (0.941) |
0.626 (1.00) |
1 (1.00) |
0.815 (1.00) |
0.757 (1.00) |
0.525 (1.00) |
| del 1q41 | 95 (17%) | 478 |
0.309 (0.966) |
0.442 (1.00) |
1 (1.00) |
0.189 (0.784) |
0.979 (1.00) |
0.591 (1.00) |
0.377 (0.989) |
| del 2p25 3 | 120 (21%) | 453 |
0.915 (1.00) |
0.467 (1.00) |
0.698 (1.00) |
1 (1.00) |
0.995 (1.00) |
0.0388 (0.42) |
0.45 (1.00) |
| del 2q22 1 | 133 (23%) | 440 |
0.647 (1.00) |
0.334 (0.971) |
0.492 (1.00) |
1 (1.00) |
0.967 (1.00) |
0.666 (1.00) |
0.0614 (0.498) |
| del 2q37 3 | 172 (30%) | 401 |
0.498 (1.00) |
0.0175 (0.28) |
0.783 (1.00) |
0.167 (0.761) |
0.166 (0.761) |
0.514 (1.00) |
0.491 (1.00) |
| del 3q13 31 | 84 (15%) | 489 |
0.449 (1.00) |
0.811 (1.00) |
1 (1.00) |
1 (1.00) |
0.225 (0.853) |
0.433 (1.00) |
1 (1.00) |
| del 4q22 1 | 390 (68%) | 183 |
0.0604 (0.498) |
0.879 (1.00) |
0.797 (1.00) |
0.659 (1.00) |
0.736 (1.00) |
0.852 (1.00) |
0.174 (0.761) |
| del 4q34 3 | 416 (73%) | 157 |
0.481 (1.00) |
0.46 (1.00) |
0.572 (1.00) |
0.329 (0.966) |
0.152 (0.744) |
0.407 (0.995) |
0.0674 (0.501) |
| del 5q12 1 | 350 (61%) | 223 |
0.79 (1.00) |
0.678 (1.00) |
0.501 (1.00) |
1 (1.00) |
0.243 (0.885) |
0.377 (0.989) |
1 (1.00) |
| del 5q13 2 | 414 (72%) | 159 |
0.0677 (0.501) |
0.998 (1.00) |
0.402 (0.994) |
0.62 (1.00) |
0.177 (0.761) |
0.214 (0.826) |
0.733 (1.00) |
| del 7p22 2 | 251 (44%) | 322 |
0.0643 (0.498) |
0.0199 (0.299) |
0.402 (0.994) |
0.659 (1.00) |
0.626 (1.00) |
0.577 (1.00) |
0.754 (1.00) |
| del 8p23 3 | 384 (67%) | 189 |
0.215 (0.826) |
0.0691 (0.505) |
1 (1.00) |
0.668 (1.00) |
0.555 (1.00) |
0.522 (1.00) |
0.175 (0.761) |
| del 8p21 2 | 401 (70%) | 172 |
0.613 (1.00) |
0.0738 (0.508) |
1 (1.00) |
0.641 (1.00) |
0.894 (1.00) |
0.561 (1.00) |
0.293 (0.941) |
| del 9p24 3 | 259 (45%) | 314 |
0.751 (1.00) |
0.0153 (0.26) |
0.321 (0.966) |
1 (1.00) |
0.554 (1.00) |
0.814 (1.00) |
1 (1.00) |
| del 9q34 13 | 341 (60%) | 232 |
0.314 (0.966) |
0.0614 (0.498) |
0.501 (1.00) |
1 (1.00) |
0.962 (1.00) |
0.68 (1.00) |
1 (1.00) |
| del 10p15 3 | 117 (20%) | 456 |
0.46 (1.00) |
0.881 (1.00) |
0.681 (1.00) |
0.589 (1.00) |
0.831 (1.00) |
1 (1.00) |
0.697 (1.00) |
| del 10q23 31 | 222 (39%) | 351 |
0.0509 (0.45) |
0.799 (1.00) |
1 (1.00) |
0.383 (0.989) |
0.644 (1.00) |
0.868 (1.00) |
1 (1.00) |
| del 10q25 1 | 238 (42%) | 335 |
0.122 (0.635) |
0.467 (1.00) |
1 (1.00) |
0.654 (1.00) |
0.529 (1.00) |
0.949 (1.00) |
0.532 (1.00) |
| del 11q25 | 200 (35%) | 373 |
0.502 (1.00) |
0.041 (0.42) |
0.16 (0.761) |
1 (1.00) |
0.322 (0.966) |
0.709 (1.00) |
0.0382 (0.42) |
| del 12q24 33 | 214 (37%) | 359 |
0.935 (1.00) |
0.0741 (0.508) |
0.382 (0.989) |
0.655 (1.00) |
0.636 (1.00) |
0.046 (0.429) |
0.0368 (0.42) |
| del 14q23 3 | 303 (53%) | 270 |
0.898 (1.00) |
0.498 (1.00) |
0.177 (0.761) |
0.668 (1.00) |
0.0965 (0.579) |
0.374 (0.989) |
0.115 (0.615) |
| del 16p13 3 | 309 (54%) | 264 |
0.835 (1.00) |
0.688 (1.00) |
1 (1.00) |
0.667 (1.00) |
0.501 (1.00) |
0.905 (1.00) |
0.521 (1.00) |
| del 16q22 1 | 457 (80%) | 116 |
0.798 (1.00) |
0.0145 (0.255) |
0.274 (0.926) |
0.589 (1.00) |
0.133 (0.679) |
0.0454 (0.429) |
0.428 (1.00) |
| del 17p12 | 486 (85%) | 87 |
0.477 (1.00) |
0.772 (1.00) |
0.171 (0.761) |
1 (1.00) |
0.831 (1.00) |
0.494 (1.00) |
0.656 (1.00) |
| del 18q23 | 377 (66%) | 196 |
0.569 (1.00) |
0.615 (1.00) |
0.154 (0.744) |
1 (1.00) |
0.653 (1.00) |
0.105 (0.588) |
1 (1.00) |
| del 19p13 3 | 506 (88%) | 67 |
0.418 (1.00) |
0.0263 (0.336) |
1 (1.00) |
1 (1.00) |
0.102 (0.588) |
1 (1.00) |
1 (1.00) |
| del 19q13 33 | 296 (52%) | 277 |
0.154 (0.744) |
0.548 (1.00) |
0.805 (1.00) |
1 (1.00) |
0.0847 (0.546) |
0.326 (0.966) |
0.114 (0.615) |
| del 19q13 43 | 282 (49%) | 291 |
0.51 (1.00) |
0.0336 (0.419) |
1 (1.00) |
0.373 (0.989) |
0.0408 (0.42) |
0.373 (0.989) |
0.209 (0.823) |
| del 21q22 3 | 224 (39%) | 349 |
0.326 (0.966) |
0.426 (1.00) |
0.793 (1.00) |
1 (1.00) |
0.329 (0.966) |
0.357 (0.989) |
0.331 (0.966) |
| del 22q13 32 | 499 (87%) | 74 |
0.577 (1.00) |
0.914 (1.00) |
0.282 (0.937) |
1 (1.00) |
0.432 (1.00) |
0.819 (1.00) |
1 (1.00) |
| del xp21 1 | 354 (62%) | 219 |
0.439 (1.00) |
0.396 (0.994) |
1 (1.00) |
0.655 (1.00) |
0.948 (1.00) |
0.759 (1.00) |
0.746 (1.00) |
P value = 0.00821 (logrank test), Q value = 0.18
Table S1. Gene #1: 'amp_1p34.3' versus Clinical Feature #1: 'Time to Death'
| nPatients | nDeath | Duration Range (Median), Month | |
|---|---|---|---|
| ALL | 559 | 331 | 0.3 - 180.2 (32.9) |
| AMP PEAK 1(1P34.3) MUTATED | 286 | 156 | 0.4 - 180.2 (34.5) |
| AMP PEAK 1(1P34.3) WILD-TYPE | 273 | 175 | 0.3 - 134.0 (31.0) |
Figure S1. Get High-res Image Gene #1: 'amp_1p34.3' versus Clinical Feature #1: 'Time to Death'
P value = 8.07e-06 (Wilcoxon-test), Q value = 0.00059
Table S2. Gene #2: 'amp_1q21.3' versus Clinical Feature #2: 'YEARS_TO_BIRTH'
| nPatients | Mean (Std.Dev) | |
|---|---|---|
| ALL | 552 | 59.8 (11.6) |
| AMP PEAK 2(1Q21.3) MUTATED | 351 | 61.5 (10.9) |
| AMP PEAK 2(1Q21.3) WILD-TYPE | 201 | 56.9 (12.1) |
Figure S2. Get High-res Image Gene #2: 'amp_1q21.3' versus Clinical Feature #2: 'YEARS_TO_BIRTH'
P value = 0.000784 (Wilcoxon-test), Q value = 0.031
Table S3. Gene #3: 'amp_1q42.2' versus Clinical Feature #2: 'YEARS_TO_BIRTH'
| nPatients | Mean (Std.Dev) | |
|---|---|---|
| ALL | 552 | 59.8 (11.6) |
| AMP PEAK 3(1Q42.2) MUTATED | 304 | 61.3 (11.2) |
| AMP PEAK 3(1Q42.2) WILD-TYPE | 248 | 58.1 (11.8) |
Figure S3. Get High-res Image Gene #3: 'amp_1q42.2' versus Clinical Feature #2: 'YEARS_TO_BIRTH'

P value = 0.00206 (Wilcoxon-test), Q value = 0.075
Table S4. Gene #6: 'amp_3q26.2' versus Clinical Feature #2: 'YEARS_TO_BIRTH'
| nPatients | Mean (Std.Dev) | |
|---|---|---|
| ALL | 552 | 59.8 (11.6) |
| AMP PEAK 6(3Q26.2) MUTATED | 462 | 60.5 (11.3) |
| AMP PEAK 6(3Q26.2) WILD-TYPE | 90 | 56.2 (12.3) |
Figure S4. Get High-res Image Gene #6: 'amp_3q26.2' versus Clinical Feature #2: 'YEARS_TO_BIRTH'

P value = 0.011 (Wilcoxon-test), Q value = 0.21
Table S5. Gene #9: 'amp_5p15.33' versus Clinical Feature #2: 'YEARS_TO_BIRTH'
| nPatients | Mean (Std.Dev) | |
|---|---|---|
| ALL | 552 | 59.8 (11.6) |
| AMP PEAK 9(5P15.33) MUTATED | 296 | 61.0 (11.5) |
| AMP PEAK 9(5P15.33) WILD-TYPE | 256 | 58.5 (11.5) |
Figure S5. Get High-res Image Gene #9: 'amp_5p15.33' versus Clinical Feature #2: 'YEARS_TO_BIRTH'
P value = 0.0105 (logrank test), Q value = 0.21
Table S6. Gene #10: 'amp_6p22.3' versus Clinical Feature #1: 'Time to Death'
| nPatients | nDeath | Duration Range (Median), Month | |
|---|---|---|---|
| ALL | 559 | 331 | 0.3 - 180.2 (32.9) |
| AMP PEAK 10(6P22.3) MUTATED | 291 | 158 | 0.5 - 153.4 (31.3) |
| AMP PEAK 10(6P22.3) WILD-TYPE | 268 | 173 | 0.3 - 180.2 (34.0) |
Figure S6. Get High-res Image Gene #10: 'amp_6p22.3' versus Clinical Feature #1: 'Time to Death'
P value = 0.00267 (Wilcoxon-test), Q value = 0.091
Table S7. Gene #10: 'amp_6p22.3' versus Clinical Feature #2: 'YEARS_TO_BIRTH'
| nPatients | Mean (Std.Dev) | |
|---|---|---|
| ALL | 552 | 59.8 (11.6) |
| AMP PEAK 10(6P22.3) MUTATED | 290 | 61.2 (11.8) |
| AMP PEAK 10(6P22.3) WILD-TYPE | 262 | 58.3 (11.2) |
Figure S7. Get High-res Image Gene #10: 'amp_6p22.3' versus Clinical Feature #2: 'YEARS_TO_BIRTH'

P value = 0.000568 (Wilcoxon-test), Q value = 0.024
Table S8. Gene #12: 'amp_8p11.21' versus Clinical Feature #2: 'YEARS_TO_BIRTH'
| nPatients | Mean (Std.Dev) | |
|---|---|---|
| ALL | 552 | 59.8 (11.6) |
| AMP PEAK 12(8P11.21) MUTATED | 200 | 62.1 (10.9) |
| AMP PEAK 12(8P11.21) WILD-TYPE | 352 | 58.5 (11.8) |
Figure S8. Get High-res Image Gene #12: 'amp_8p11.21' versus Clinical Feature #2: 'YEARS_TO_BIRTH'

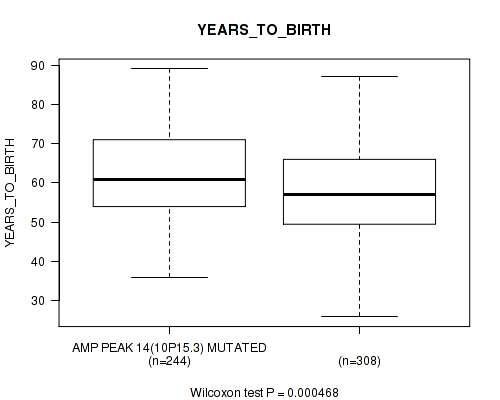
P value = 0.000468 (Wilcoxon-test), Q value = 0.022
Table S9. Gene #14: 'amp_10p15.3' versus Clinical Feature #2: 'YEARS_TO_BIRTH'
| nPatients | Mean (Std.Dev) | |
|---|---|---|
| ALL | 552 | 59.8 (11.6) |
| AMP PEAK 14(10P15.3) MUTATED | 244 | 61.7 (11.2) |
| AMP PEAK 14(10P15.3) WILD-TYPE | 308 | 58.4 (11.7) |
Figure S9. Get High-res Image Gene #14: 'amp_10p15.3' versus Clinical Feature #2: 'YEARS_TO_BIRTH'
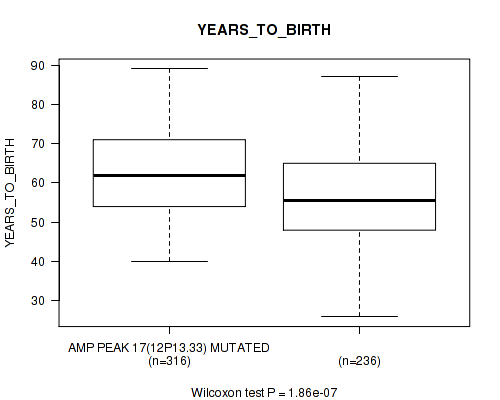
P value = 1.86e-07 (Wilcoxon-test), Q value = 3.2e-05
Table S10. Gene #17: 'amp_12p13.33' versus Clinical Feature #2: 'YEARS_TO_BIRTH'
| nPatients | Mean (Std.Dev) | |
|---|---|---|
| ALL | 552 | 59.8 (11.6) |
| AMP PEAK 17(12P13.33) MUTATED | 316 | 62.1 (10.8) |
| AMP PEAK 17(12P13.33) WILD-TYPE | 236 | 56.8 (11.9) |
Figure S10. Get High-res Image Gene #17: 'amp_12p13.33' versus Clinical Feature #2: 'YEARS_TO_BIRTH'
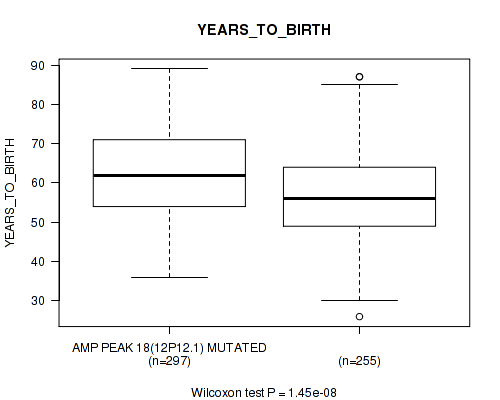
P value = 1.45e-08 (Wilcoxon-test), Q value = 5.3e-06
Table S11. Gene #18: 'amp_12p12.1' versus Clinical Feature #2: 'YEARS_TO_BIRTH'
| nPatients | Mean (Std.Dev) | |
|---|---|---|
| ALL | 552 | 59.8 (11.6) |
| AMP PEAK 18(12P12.1) MUTATED | 297 | 62.4 (11.2) |
| AMP PEAK 18(12P12.1) WILD-TYPE | 255 | 56.8 (11.2) |
Figure S11. Get High-res Image Gene #18: 'amp_12p12.1' versus Clinical Feature #2: 'YEARS_TO_BIRTH'
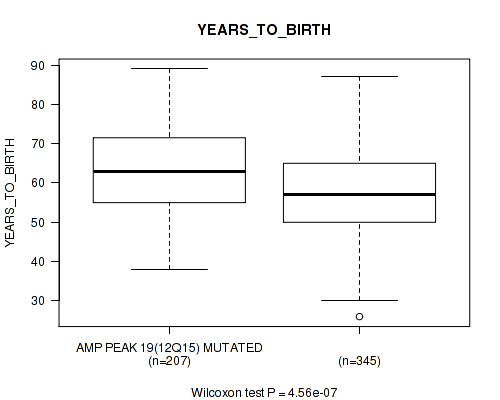
P value = 4.56e-07 (Wilcoxon-test), Q value = 5.8e-05
Table S12. Gene #19: 'amp_12q15' versus Clinical Feature #2: 'YEARS_TO_BIRTH'
| nPatients | Mean (Std.Dev) | |
|---|---|---|
| ALL | 552 | 59.8 (11.6) |
| AMP PEAK 19(12Q15) MUTATED | 207 | 63.0 (11.2) |
| AMP PEAK 19(12Q15) WILD-TYPE | 345 | 57.9 (11.4) |
Figure S12. Get High-res Image Gene #19: 'amp_12q15' versus Clinical Feature #2: 'YEARS_TO_BIRTH'
P value = 0.00742 (Fisher's exact test), Q value = 0.17
Table S13. Gene #19: 'amp_12q15' versus Clinical Feature #3: 'TUMOR_TISSUE_SITE'
| nPatients | OMENTUM | OVARY | PERITONEUM OVARY |
|---|---|---|---|
| ALL | 3 | 558 | 2 |
| AMP PEAK 19(12Q15) MUTATED | 3 | 209 | 2 |
| AMP PEAK 19(12Q15) WILD-TYPE | 0 | 349 | 0 |
Figure S13. Get High-res Image Gene #19: 'amp_12q15' versus Clinical Feature #3: 'TUMOR_TISSUE_SITE'
P value = 2.94e-05 (Wilcoxon-test), Q value = 0.0019
Table S14. Gene #26: 'amp_19q12' versus Clinical Feature #2: 'YEARS_TO_BIRTH'
| nPatients | Mean (Std.Dev) | |
|---|---|---|
| ALL | 552 | 59.8 (11.6) |
| AMP PEAK 26(19Q12) MUTATED | 308 | 61.7 (11.1) |
| AMP PEAK 26(19Q12) WILD-TYPE | 244 | 57.5 (11.7) |
Figure S14. Get High-res Image Gene #26: 'amp_19q12' versus Clinical Feature #2: 'YEARS_TO_BIRTH'

P value = 0.00655 (logrank test), Q value = 0.17
Table S15. Gene #27: 'amp_19q13.2' versus Clinical Feature #1: 'Time to Death'
| nPatients | nDeath | Duration Range (Median), Month | |
|---|---|---|---|
| ALL | 559 | 331 | 0.3 - 180.2 (32.9) |
| AMP PEAK 27(19Q13.2) MUTATED | 237 | 149 | 0.3 - 180.2 (29.0) |
| AMP PEAK 27(19Q13.2) WILD-TYPE | 322 | 182 | 0.4 - 134.0 (35.0) |
Figure S15. Get High-res Image Gene #27: 'amp_19q13.2' versus Clinical Feature #1: 'Time to Death'
P value = 3.06e-06 (Wilcoxon-test), Q value = 0.00031
Table S16. Gene #27: 'amp_19q13.2' versus Clinical Feature #2: 'YEARS_TO_BIRTH'
| nPatients | Mean (Std.Dev) | |
|---|---|---|
| ALL | 552 | 59.8 (11.6) |
| AMP PEAK 27(19Q13.2) MUTATED | 235 | 62.5 (11.2) |
| AMP PEAK 27(19Q13.2) WILD-TYPE | 317 | 57.8 (11.5) |
Figure S16. Get High-res Image Gene #27: 'amp_19q13.2' versus Clinical Feature #2: 'YEARS_TO_BIRTH'

P value = 0.00526 (Wilcoxon-test), Q value = 0.16
Table S17. Gene #28: 'amp_20p13' versus Clinical Feature #2: 'YEARS_TO_BIRTH'
| nPatients | Mean (Std.Dev) | |
|---|---|---|
| ALL | 552 | 59.8 (11.6) |
| AMP PEAK 28(20P13) MUTATED | 305 | 61.1 (11.7) |
| AMP PEAK 28(20P13) WILD-TYPE | 247 | 58.2 (11.2) |
Figure S17. Get High-res Image Gene #28: 'amp_20p13' versus Clinical Feature #2: 'YEARS_TO_BIRTH'

P value = 2.07e-08 (Wilcoxon-test), Q value = 5.3e-06
Table S18. Gene #29: 'amp_20q11.21' versus Clinical Feature #2: 'YEARS_TO_BIRTH'
| nPatients | Mean (Std.Dev) | |
|---|---|---|
| ALL | 552 | 59.8 (11.6) |
| AMP PEAK 29(20Q11.21) MUTATED | 331 | 62.1 (11.5) |
| AMP PEAK 29(20Q11.21) WILD-TYPE | 221 | 56.4 (10.9) |
Figure S18. Get High-res Image Gene #29: 'amp_20q11.21' versus Clinical Feature #2: 'YEARS_TO_BIRTH'
P value = 6.57e-06 (Wilcoxon-test), Q value = 0.00056
Table S19. Gene #30: 'amp_20q13.33' versus Clinical Feature #2: 'YEARS_TO_BIRTH'
| nPatients | Mean (Std.Dev) | |
|---|---|---|
| ALL | 552 | 59.8 (11.6) |
| AMP PEAK 30(20Q13.33) MUTATED | 386 | 61.3 (11.5) |
| AMP PEAK 30(20Q13.33) WILD-TYPE | 166 | 56.5 (11.1) |
Figure S19. Get High-res Image Gene #30: 'amp_20q13.33' versus Clinical Feature #2: 'YEARS_TO_BIRTH'

P value = 0.00382 (Wilcoxon-test), Q value = 0.12
Table S20. Gene #39: 'del_3p26.2' versus Clinical Feature #2: 'YEARS_TO_BIRTH'
| nPatients | Mean (Std.Dev) | |
|---|---|---|
| ALL | 552 | 59.8 (11.6) |
| DEL PEAK 6(3P26.2) MUTATED | 200 | 61.8 (11.6) |
| DEL PEAK 6(3P26.2) WILD-TYPE | 352 | 58.7 (11.4) |
Figure S20. Get High-res Image Gene #39: 'del_3p26.2' versus Clinical Feature #2: 'YEARS_TO_BIRTH'
P value = 0.000102 (Wilcoxon-test), Q value = 0.0058
Table S21. Gene #45: 'del_6q27' versus Clinical Feature #2: 'YEARS_TO_BIRTH'
| nPatients | Mean (Std.Dev) | |
|---|---|---|
| ALL | 552 | 59.8 (11.6) |
| DEL PEAK 12(6Q27) MUTATED | 360 | 58.5 (11.4) |
| DEL PEAK 12(6Q27) WILD-TYPE | 192 | 62.4 (11.5) |
Figure S21. Get High-res Image Gene #45: 'del_6q27' versus Clinical Feature #2: 'YEARS_TO_BIRTH'
P value = 0.0106 (Fisher's exact test), Q value = 0.21
Table S22. Gene #54: 'del_11p15.5' versus Clinical Feature #3: 'TUMOR_TISSUE_SITE'
| nPatients | OMENTUM | OVARY | PERITONEUM OVARY |
|---|---|---|---|
| ALL | 3 | 558 | 2 |
| DEL PEAK 21(11P15.5) MUTATED | 0 | 336 | 0 |
| DEL PEAK 21(11P15.5) WILD-TYPE | 3 | 222 | 2 |
Figure S22. Get High-res Image Gene #54: 'del_11p15.5' versus Clinical Feature #3: 'TUMOR_TISSUE_SITE'
P value = 0.00753 (Wilcoxon-test), Q value = 0.17
Table S23. Gene #56: 'del_12q23.1' versus Clinical Feature #2: 'YEARS_TO_BIRTH'
| nPatients | Mean (Std.Dev) | |
|---|---|---|
| ALL | 552 | 59.8 (11.6) |
| DEL PEAK 23(12Q23.1) MUTATED | 188 | 58.0 (10.6) |
| DEL PEAK 23(12Q23.1) WILD-TYPE | 364 | 60.8 (11.9) |
Figure S23. Get High-res Image Gene #56: 'del_12q23.1' versus Clinical Feature #2: 'YEARS_TO_BIRTH'
P value = 0.00892 (logrank test), Q value = 0.19
Table S24. Gene #58: 'del_13q14.2' versus Clinical Feature #1: 'Time to Death'
| nPatients | nDeath | Duration Range (Median), Month | |
|---|---|---|---|
| ALL | 559 | 331 | 0.3 - 180.2 (32.9) |
| DEL PEAK 25(13Q14.2) MUTATED | 348 | 199 | 0.3 - 153.4 (34.8) |
| DEL PEAK 25(13Q14.2) WILD-TYPE | 211 | 132 | 0.3 - 180.2 (29.2) |
Figure S24. Get High-res Image Gene #58: 'del_13q14.2' versus Clinical Feature #1: 'Time to Death'
P value = 0.00582 (Wilcoxon-test), Q value = 0.16
Table S25. Gene #60: 'del_15q11.2' versus Clinical Feature #2: 'YEARS_TO_BIRTH'
| nPatients | Mean (Std.Dev) | |
|---|---|---|
| ALL | 552 | 59.8 (11.6) |
| DEL PEAK 27(15Q11.2) MUTATED | 285 | 61.1 (11.4) |
| DEL PEAK 27(15Q11.2) WILD-TYPE | 267 | 58.4 (11.6) |
Figure S25. Get High-res Image Gene #60: 'del_15q11.2' versus Clinical Feature #2: 'YEARS_TO_BIRTH'
P value = 0.00571 (Wilcoxon-test), Q value = 0.16
Table S26. Gene #61: 'del_15q15.1' versus Clinical Feature #2: 'YEARS_TO_BIRTH'
| nPatients | Mean (Std.Dev) | |
|---|---|---|
| ALL | 552 | 59.8 (11.6) |
| DEL PEAK 28(15Q15.1) MUTATED | 346 | 60.9 (11.1) |
| DEL PEAK 28(15Q15.1) WILD-TYPE | 206 | 58.1 (12.1) |
Figure S26. Get High-res Image Gene #61: 'del_15q15.1' versus Clinical Feature #2: 'YEARS_TO_BIRTH'
P value = 0.000464 (Wilcoxon-test), Q value = 0.022
Table S27. Gene #64: 'del_16q23.1' versus Clinical Feature #2: 'YEARS_TO_BIRTH'
| nPatients | Mean (Std.Dev) | |
|---|---|---|
| ALL | 552 | 59.8 (11.6) |
| DEL PEAK 31(16Q23.1) MUTATED | 433 | 60.8 (11.5) |
| DEL PEAK 31(16Q23.1) WILD-TYPE | 119 | 56.4 (11.3) |
Figure S27. Get High-res Image Gene #64: 'del_16q23.1' versus Clinical Feature #2: 'YEARS_TO_BIRTH'
P value = 0.0125 (Wilcoxon-test), Q value = 0.23
Table S28. Gene #66: 'del_17q11.2' versus Clinical Feature #2: 'YEARS_TO_BIRTH'
| nPatients | Mean (Std.Dev) | |
|---|---|---|
| ALL | 552 | 59.8 (11.6) |
| DEL PEAK 33(17Q11.2) MUTATED | 450 | 59.3 (11.5) |
| DEL PEAK 33(17Q11.2) WILD-TYPE | 102 | 62.2 (11.7) |
Figure S28. Get High-res Image Gene #66: 'del_17q11.2' versus Clinical Feature #2: 'YEARS_TO_BIRTH'
-
Copy number data file = all_lesions.txt from GISTIC pipeline
-
Processed Copy number data file = /xchip/cga/gdac-prod/tcga-gdac/jobResults/GDAC_Correlate_Genomic_Events_Preprocess/OV-TP/22534546/transformed.cor.cli.txt
-
Clinical data file = /xchip/cga/gdac-prod/tcga-gdac/jobResults/Append_Data/OV-TP/22507289/OV-TP.merged_data.txt
-
Number of patients = 573
-
Number of significantly focal cnvs = 73
-
Number of selected clinical features = 7
-
Exclude genes that fewer than K tumors have mutations, K = 3
For survival clinical features, the Kaplan-Meier survival curves of tumors with and without gene mutations were plotted and the statistical significance P values were estimated by logrank test (Bland and Altman 2004) using the 'survdiff' function in R
For binary or multi-class clinical features (nominal or ordinal), two-tailed Fisher's exact tests (Fisher 1922) were used to estimate the P values using the 'fisher.test' function in R
For multiple hypothesis correction, Q value is the False Discovery Rate (FDR) analogue of the P value (Benjamini and Hochberg 1995), defined as the minimum FDR at which the test may be called significant. We used the 'Benjamini and Hochberg' method of 'p.adjust' function in R to convert P values into Q values.
In addition to the links below, the full results of the analysis summarized in this report can also be downloaded programmatically using firehose_get, or interactively from either the Broad GDAC website or TCGA Data Coordination Center Portal.