This pipeline computes the correlation between APOBRC groups and selected clinical features.
Testing the association between APOBEC groups identified by 2 different apobec score and 17 clinical features across 492 patients, 10 significant findings detected with Q value < 0.25.
-
3 subtypes identified in current cancer cohort by 'APOBEC MUTLOAD MINESTIMATE'. These subtypes correlate to 'YEARS_TO_BIRTH', 'PATHOLOGY_T_STAGE', 'HISTOLOGICAL_TYPE', 'RADIATION_EXPOSURE', 'EXTRATHYROIDAL_EXTENSION', and 'MULTIFOCALITY'.
-
2 subtypes identified in current cancer cohort by 'APOBEC ENRICH'. These subtypes correlate to 'YEARS_TO_BIRTH', 'PATHOLOGY_T_STAGE', 'HISTOLOGICAL_TYPE', and 'EXTRATHYROIDAL_EXTENSION'.
Table 1. Get Full Table Overview of the association between APOBEC groups by 2 different APOBEC scores and 17 clinical features. Shown in the table are P values (Q values). Thresholded by Q value < 0.25, 10 significant findings detected.
|
Clinical Features |
Statistical Tests |
APOBEC MUTLOAD MINESTIMATE |
APOBEC ENRICH |
| Time to Death | logrank test |
0.328 (0.508) |
0.232 (0.416) |
| YEARS TO BIRTH | Wilcoxon-test |
0.0412 (0.238) |
0.0139 (0.158) |
| PATHOLOGIC STAGE | Fisher's exact test |
0.359 (0.531) |
0.308 (0.499) |
| PATHOLOGY T STAGE | Fisher's exact test |
0.0511 (0.238) |
0.0639 (0.238) |
| PATHOLOGY N STAGE | Fisher's exact test |
0.673 (0.915) |
0.471 (0.668) |
| PATHOLOGY M STAGE | Fisher's exact test |
1 (1.00) |
1 (1.00) |
| GENDER | Fisher's exact test |
0.718 (0.938) |
0.796 (1.00) |
| RADIATION THERAPY | Fisher's exact test |
0.13 (0.275) |
0.0881 (0.27) |
| HISTOLOGICAL TYPE | Fisher's exact test |
0.00432 (0.147) |
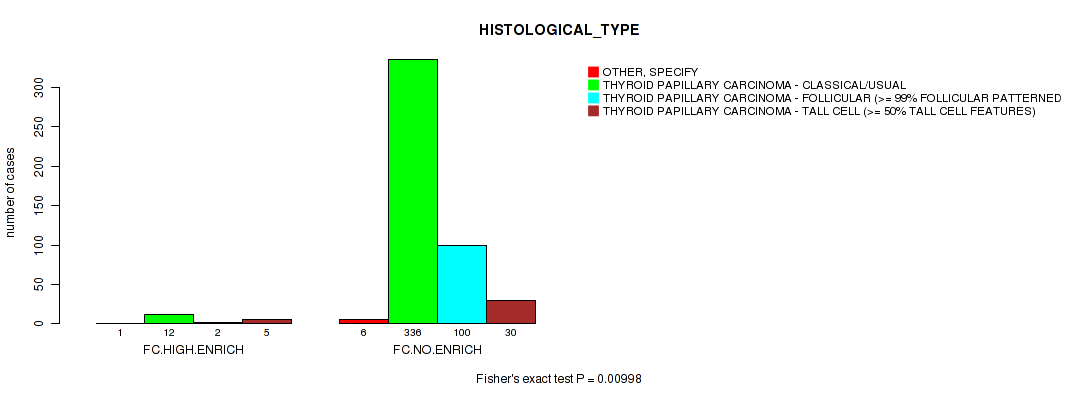
0.00998 (0.158) |
| RADIATION EXPOSURE | Fisher's exact test |
0.07 (0.238) |
0.126 (0.275) |
| EXTRATHYROIDAL EXTENSION | Fisher's exact test |
0.02 (0.17) |
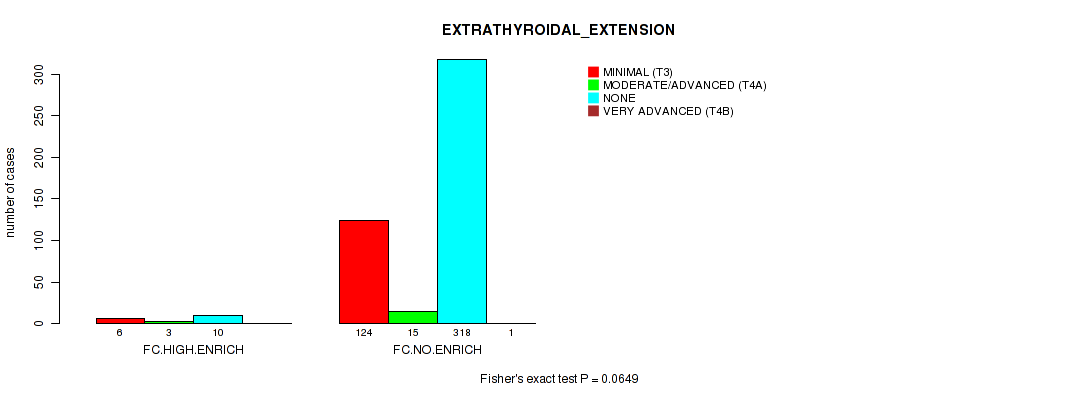
0.0649 (0.238) |
| RESIDUAL TUMOR | Fisher's exact test |
0.266 (0.453) |
0.211 (0.416) |
| NUMBER OF LYMPH NODES | Wilcoxon-test |
0.96 (1.00) |
0.892 (1.00) |
| MULTIFOCALITY | Fisher's exact test |
0.0564 (0.238) |
0.23 (0.416) |
| TUMOR SIZE | Wilcoxon-test |
0.103 (0.27) |
0.909 (1.00) |
| RACE | Fisher's exact test |
0.115 (0.275) |
0.0956 (0.27) |
| ETHNICITY | Fisher's exact test |
1 (1.00) |
1 (1.00) |
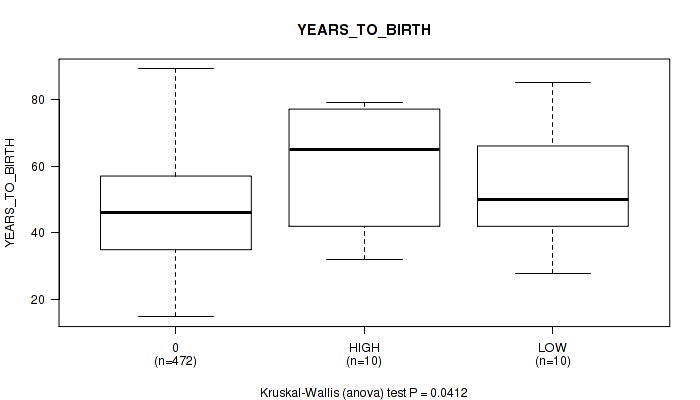
Table S1. Description of APOBEC group #1: 'APOBEC MUTLOAD MINESTIMATE'
| Cluster Labels | 0 | HIGH | LOW |
|---|---|---|---|
| Number of samples | 472 | 10 | 10 |
P value = 0.0412 (Kruskal-Wallis (anova)), Q value = 0.24
Table S2. Clustering Approach #1: 'APOBEC MUTLOAD MINESTIMATE' versus Clinical Feature #2: 'YEARS_TO_BIRTH'
| nPatients | Mean (Std.Dev) | |
|---|---|---|
| ALL | 492 | 47.2 (15.7) |
| 0 | 472 | 46.8 (15.5) |
| HIGH | 10 | 59.6 (18.8) |
| LOW | 10 | 54.5 (17.5) |
Figure S1. Get High-res Image Clustering Approach #1: 'APOBEC MUTLOAD MINESTIMATE' versus Clinical Feature #2: 'YEARS_TO_BIRTH'
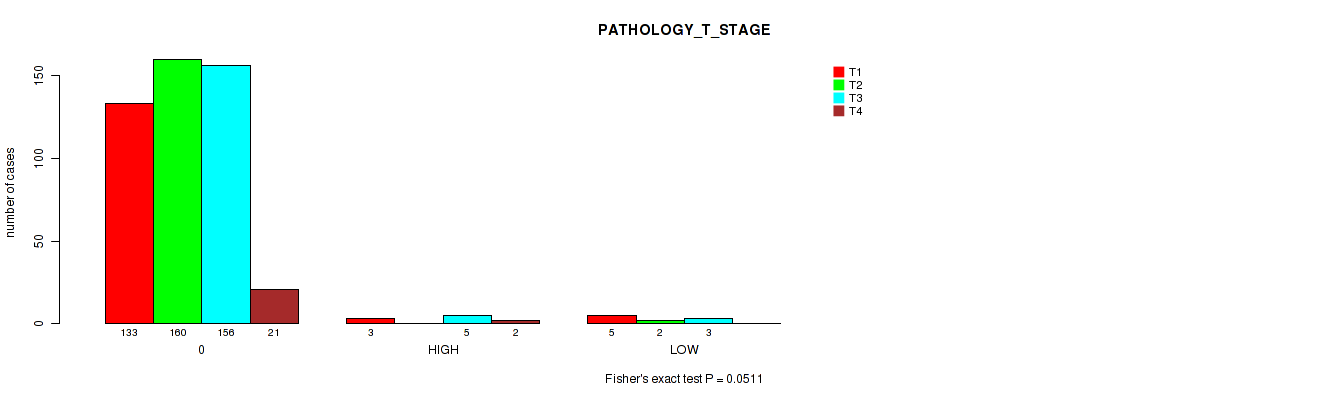
P value = 0.0511 (Fisher's exact test), Q value = 0.24
Table S3. Clustering Approach #1: 'APOBEC MUTLOAD MINESTIMATE' versus Clinical Feature #4: 'PATHOLOGY_T_STAGE'
| nPatients | T1 | T2 | T3 | T4 |
|---|---|---|---|---|
| ALL | 141 | 162 | 164 | 23 |
| 0 | 133 | 160 | 156 | 21 |
| HIGH | 3 | 0 | 5 | 2 |
| LOW | 5 | 2 | 3 | 0 |
Figure S2. Get High-res Image Clustering Approach #1: 'APOBEC MUTLOAD MINESTIMATE' versus Clinical Feature #4: 'PATHOLOGY_T_STAGE'
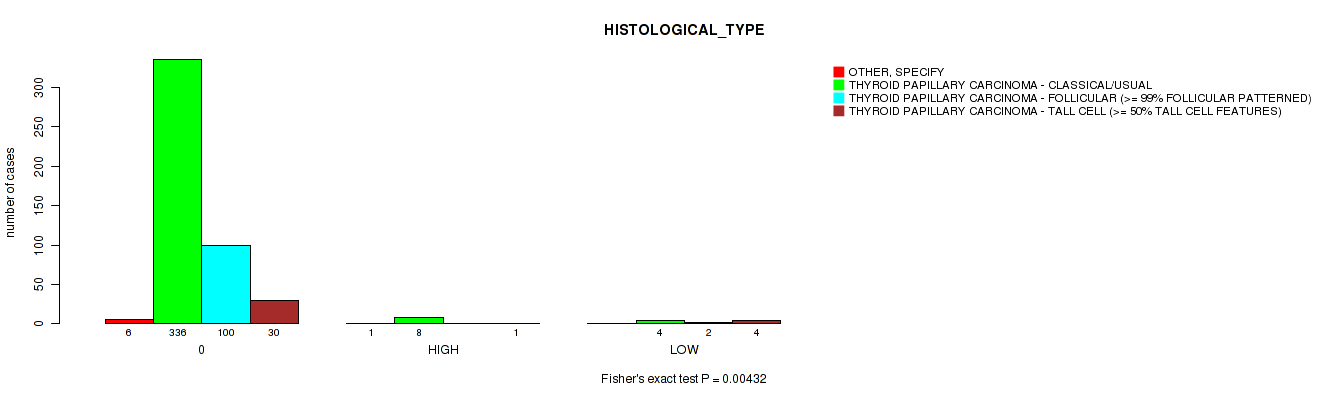
P value = 0.00432 (Fisher's exact test), Q value = 0.15
Table S4. Clustering Approach #1: 'APOBEC MUTLOAD MINESTIMATE' versus Clinical Feature #9: 'HISTOLOGICAL_TYPE'
| nPatients | OTHER, SPECIFY | THYROID PAPILLARY CARCINOMA - CLASSICAL/USUAL | THYROID PAPILLARY CARCINOMA - FOLLICULAR (>= 99% FOLLICULAR PATTERNED) | THYROID PAPILLARY CARCINOMA - TALL CELL (>= 50% TALL CELL FEATURES) |
|---|---|---|---|---|
| ALL | 7 | 348 | 102 | 35 |
| 0 | 6 | 336 | 100 | 30 |
| HIGH | 1 | 8 | 0 | 1 |
| LOW | 0 | 4 | 2 | 4 |
Figure S3. Get High-res Image Clustering Approach #1: 'APOBEC MUTLOAD MINESTIMATE' versus Clinical Feature #9: 'HISTOLOGICAL_TYPE'
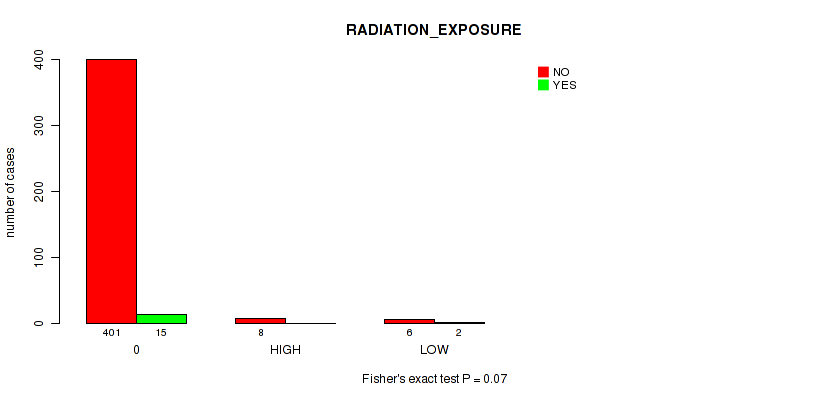
P value = 0.07 (Fisher's exact test), Q value = 0.24
Table S5. Clustering Approach #1: 'APOBEC MUTLOAD MINESTIMATE' versus Clinical Feature #10: 'RADIATION_EXPOSURE'
| nPatients | NO | YES |
|---|---|---|
| ALL | 415 | 17 |
| 0 | 401 | 15 |
| HIGH | 8 | 0 |
| LOW | 6 | 2 |
Figure S4. Get High-res Image Clustering Approach #1: 'APOBEC MUTLOAD MINESTIMATE' versus Clinical Feature #10: 'RADIATION_EXPOSURE'
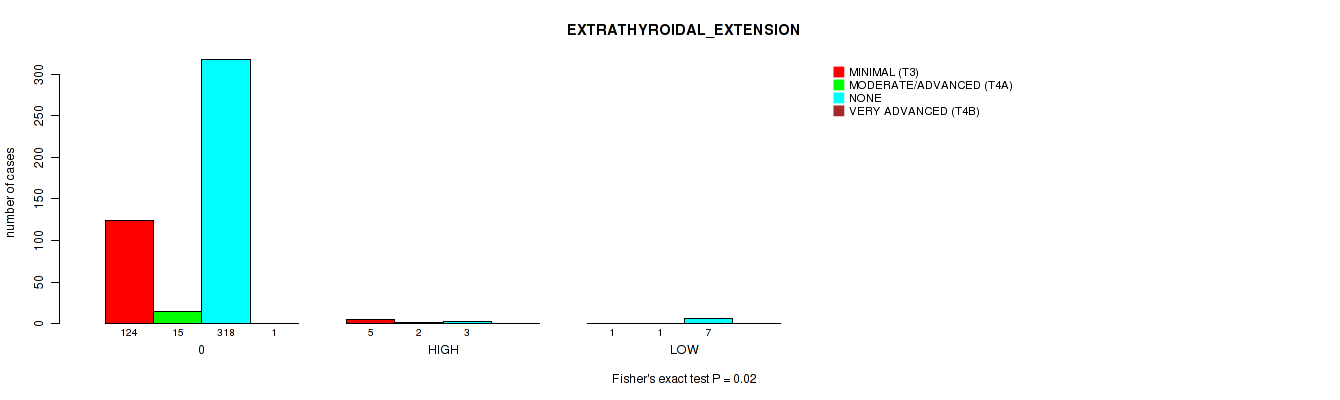
P value = 0.02 (Fisher's exact test), Q value = 0.17
Table S6. Clustering Approach #1: 'APOBEC MUTLOAD MINESTIMATE' versus Clinical Feature #11: 'EXTRATHYROIDAL_EXTENSION'
| nPatients | MINIMAL (T3) | MODERATE/ADVANCED (T4A) | NONE | VERY ADVANCED (T4B) |
|---|---|---|---|---|
| ALL | 130 | 18 | 328 | 1 |
| 0 | 124 | 15 | 318 | 1 |
| HIGH | 5 | 2 | 3 | 0 |
| LOW | 1 | 1 | 7 | 0 |
Figure S5. Get High-res Image Clustering Approach #1: 'APOBEC MUTLOAD MINESTIMATE' versus Clinical Feature #11: 'EXTRATHYROIDAL_EXTENSION'
P value = 0.0564 (Fisher's exact test), Q value = 0.24
Table S7. Clustering Approach #1: 'APOBEC MUTLOAD MINESTIMATE' versus Clinical Feature #14: 'MULTIFOCALITY'
| nPatients | MULTIFOCAL | UNIFOCAL |
|---|---|---|
| ALL | 221 | 262 |
| 0 | 210 | 255 |
| HIGH | 4 | 6 |
| LOW | 7 | 1 |
Figure S6. Get High-res Image Clustering Approach #1: 'APOBEC MUTLOAD MINESTIMATE' versus Clinical Feature #14: 'MULTIFOCALITY'
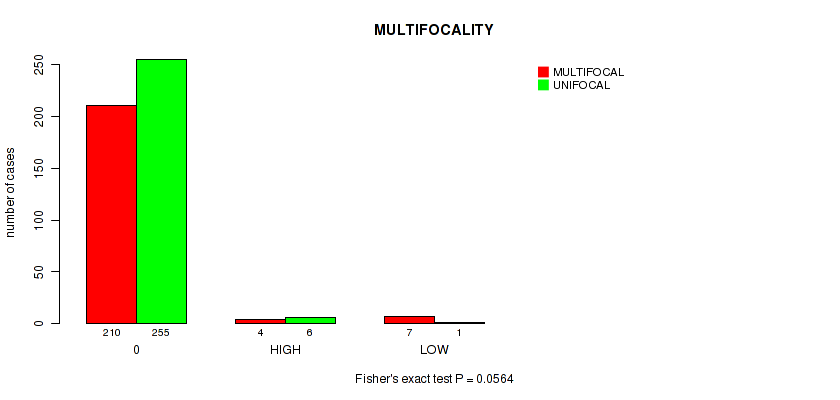
Table S8. Description of APOBEC group #2: 'APOBEC ENRICH'
| Cluster Labels | FC.HIGH.ENRICH | FC.NO.ENRICH |
|---|---|---|
| Number of samples | 20 | 472 |
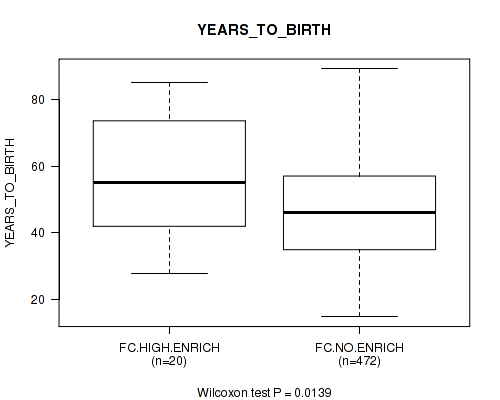
P value = 0.0139 (Wilcoxon-test), Q value = 0.16
Table S9. Clustering Approach #2: 'APOBEC ENRICH' versus Clinical Feature #2: 'YEARS_TO_BIRTH'
| nPatients | Mean (Std.Dev) | |
|---|---|---|
| ALL | 492 | 47.2 (15.7) |
| FC.HIGH.ENRICH | 20 | 57.0 (17.9) |
| FC.NO.ENRICH | 472 | 46.8 (15.5) |
Figure S7. Get High-res Image Clustering Approach #2: 'APOBEC ENRICH' versus Clinical Feature #2: 'YEARS_TO_BIRTH'
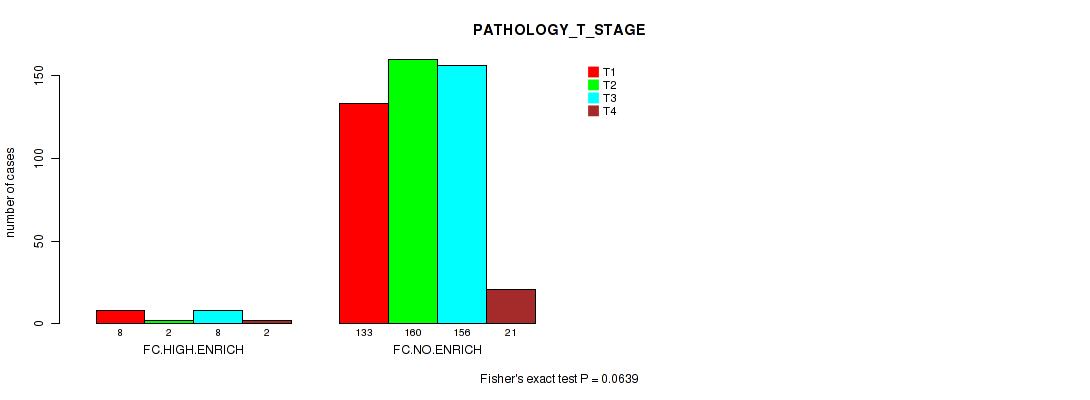
P value = 0.0639 (Fisher's exact test), Q value = 0.24
Table S10. Clustering Approach #2: 'APOBEC ENRICH' versus Clinical Feature #4: 'PATHOLOGY_T_STAGE'
| nPatients | T1 | T2 | T3 | T4 |
|---|---|---|---|---|
| ALL | 141 | 162 | 164 | 23 |
| FC.HIGH.ENRICH | 8 | 2 | 8 | 2 |
| FC.NO.ENRICH | 133 | 160 | 156 | 21 |
Figure S8. Get High-res Image Clustering Approach #2: 'APOBEC ENRICH' versus Clinical Feature #4: 'PATHOLOGY_T_STAGE'
P value = 0.00998 (Fisher's exact test), Q value = 0.16
Table S11. Clustering Approach #2: 'APOBEC ENRICH' versus Clinical Feature #9: 'HISTOLOGICAL_TYPE'
| nPatients | OTHER, SPECIFY | THYROID PAPILLARY CARCINOMA - CLASSICAL/USUAL | THYROID PAPILLARY CARCINOMA - FOLLICULAR (>= 99% FOLLICULAR PATTERNED) | THYROID PAPILLARY CARCINOMA - TALL CELL (>= 50% TALL CELL FEATURES) |
|---|---|---|---|---|
| ALL | 7 | 348 | 102 | 35 |
| FC.HIGH.ENRICH | 1 | 12 | 2 | 5 |
| FC.NO.ENRICH | 6 | 336 | 100 | 30 |
Figure S9. Get High-res Image Clustering Approach #2: 'APOBEC ENRICH' versus Clinical Feature #9: 'HISTOLOGICAL_TYPE'
P value = 0.0649 (Fisher's exact test), Q value = 0.24
Table S12. Clustering Approach #2: 'APOBEC ENRICH' versus Clinical Feature #11: 'EXTRATHYROIDAL_EXTENSION'
| nPatients | MINIMAL (T3) | MODERATE/ADVANCED (T4A) | NONE | VERY ADVANCED (T4B) |
|---|---|---|---|---|
| ALL | 130 | 18 | 328 | 1 |
| FC.HIGH.ENRICH | 6 | 3 | 10 | 0 |
| FC.NO.ENRICH | 124 | 15 | 318 | 1 |
Figure S10. Get High-res Image Clustering Approach #2: 'APOBEC ENRICH' versus Clinical Feature #11: 'EXTRATHYROIDAL_EXTENSION'
-
APOBEC groups file = /xchip/cga/gdac-prod/tcga-gdac/jobResults/APOBEC_Pipelines/THCA-TP/22507680/APOBEC_clinical_corr_input_22537043/APOBEC_for_clinical.correlaion.input.categorical.txt
-
Clinical data file = /xchip/cga/gdac-prod/tcga-gdac/jobResults/Append_Data/THCA-TP/22507188/THCA-TP.merged_data.txt
-
Number of patients = 492
-
Number of selected clinical features = 17
APOBEC classification based on APOBEC_MutLoad_MinEstimate : a. APOBEC non group -- samples with zero value, b. APOBEC high group -- samples above median value in non zero samples, c. APOBEC low group -- samples below median value in non zero samples.
APOBEC classification based on APOBEC_enrich : a. No Enrichmment group -- all samples with BH_Fisher_p-value_tCw > 0.05, b. Low enrichment group -- samples with BH_Fisher_p-value_tCw = < 0.05 and APOBEC_enrich=<2, c. High enrichment group -- samples with BH_Fisher_p-value_tCw =< 0.05 and APOBEC_enrich>2.
For survival clinical features, the Kaplan-Meier survival curves of tumors with and without gene mutations were plotted and the statistical significance P values were estimated by logrank test (Bland and Altman 2004) using the 'survdiff' function in R
For binary clinical features, two-tailed Fisher's exact tests (Fisher 1922) were used to estimate the P values using the 'fisher.test' function in R
For multiple hypothesis correction, Q value is the False Discovery Rate (FDR) analogue of the P value (Benjamini and Hochberg 1995), defined as the minimum FDR at which the test may be called significant. We used the 'Benjamini and Hochberg' method of 'p.adjust' function in R to convert P values into Q values.
In addition to the links below, the full results of the analysis summarized in this report can also be downloaded programmatically using firehose_get, or interactively from either the Broad GDAC website or TCGA Data Coordination Center Portal.