This pipeline computes the correlation between significant copy number variation (cnv focal) genes and selected clinical features.
Testing the association between copy number variation 18 focal events and 8 clinical features across 123 patients, 24 significant findings detected with Q value < 0.25.
-
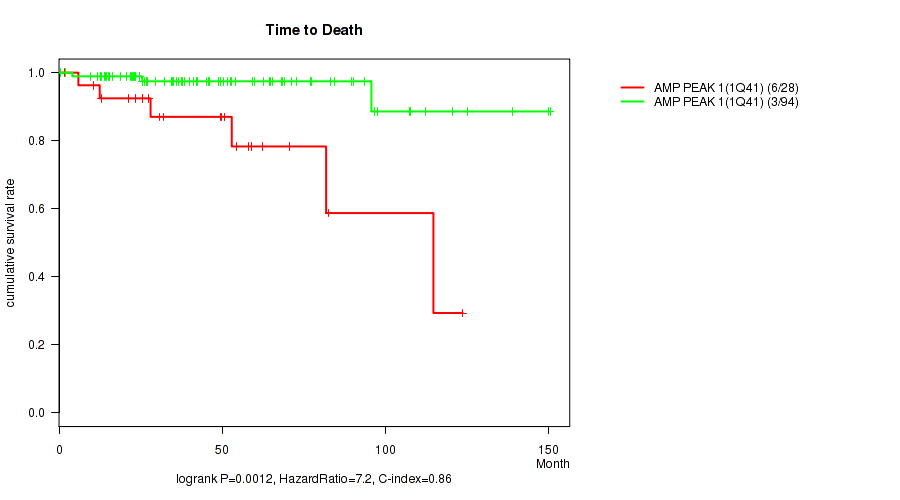
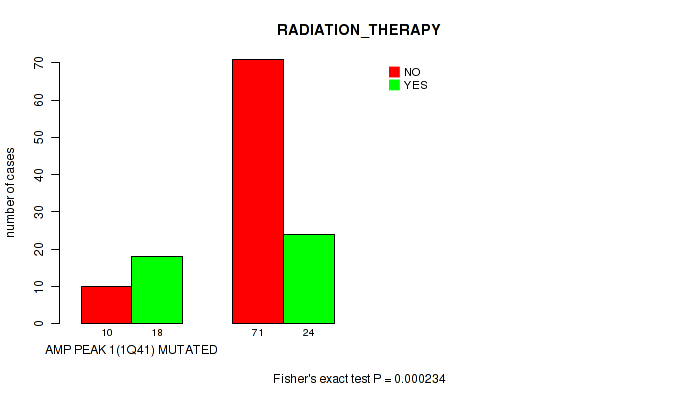
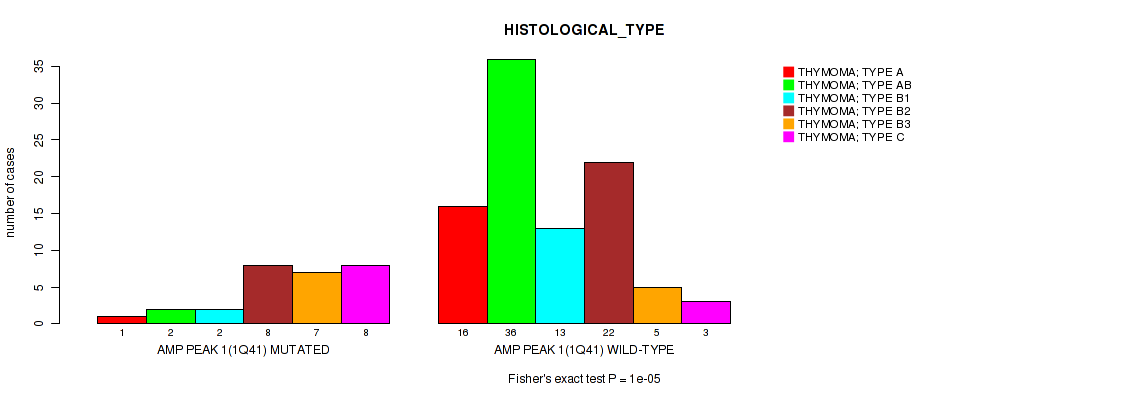
amp_1q41 cnv correlated to 'Time to Death', 'RADIATION_THERAPY', and 'HISTOLOGICAL_TYPE'.
-
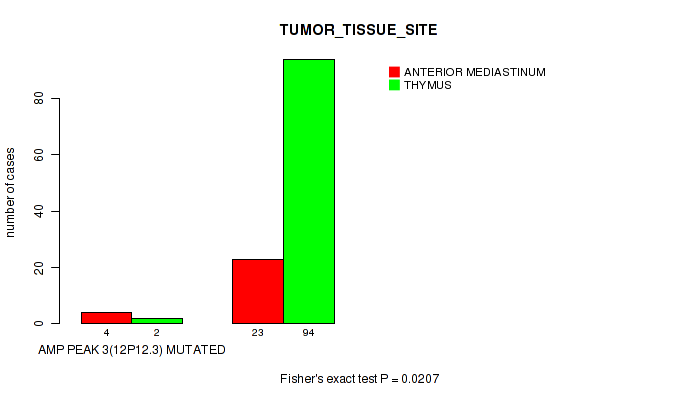
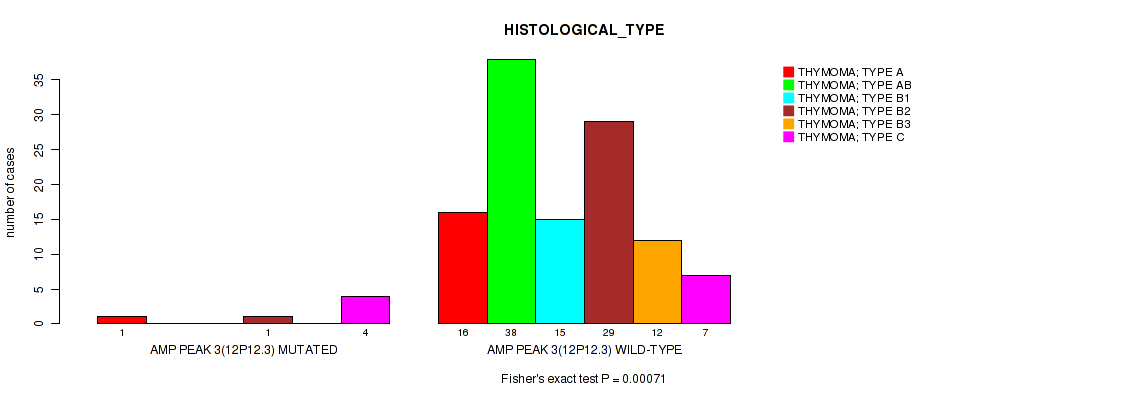
amp_12p12.3 cnv correlated to 'TUMOR_TISSUE_SITE' and 'HISTOLOGICAL_TYPE'.
-
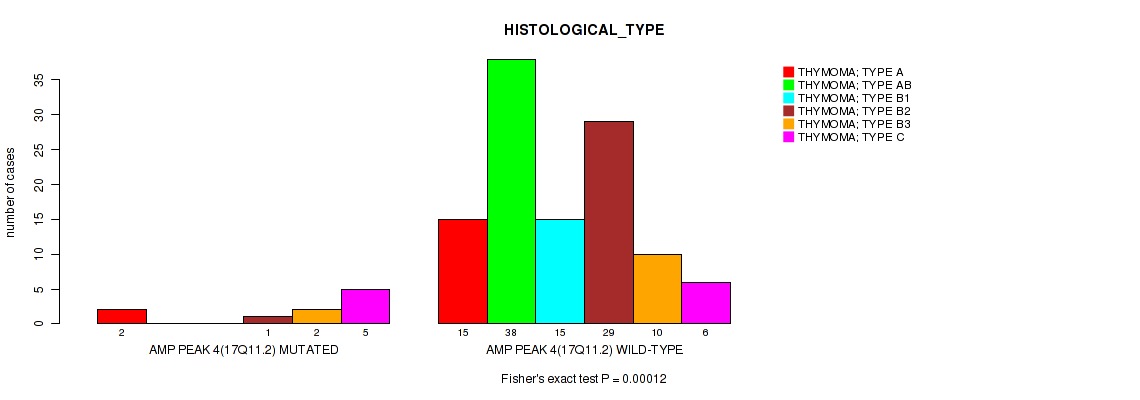
amp_17q11.2 cnv correlated to 'HISTOLOGICAL_TYPE'.
-
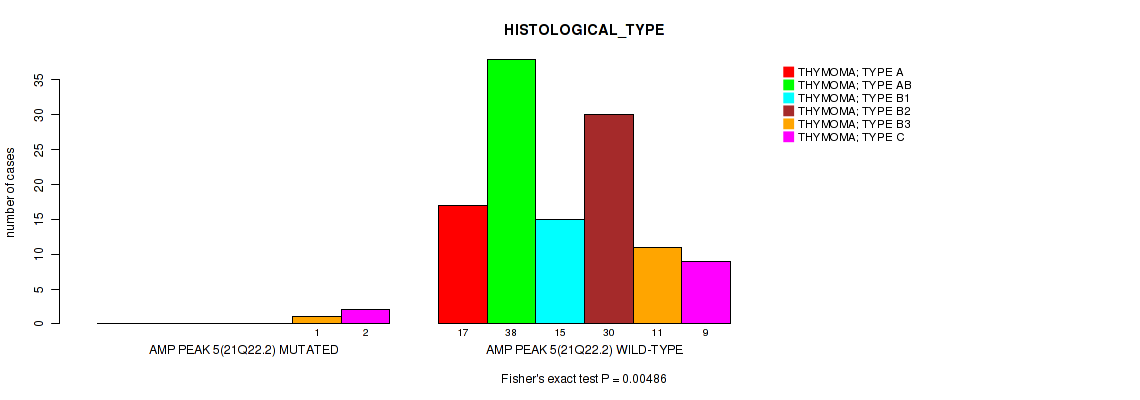
amp_21q22.2 cnv correlated to 'HISTOLOGICAL_TYPE'.
-
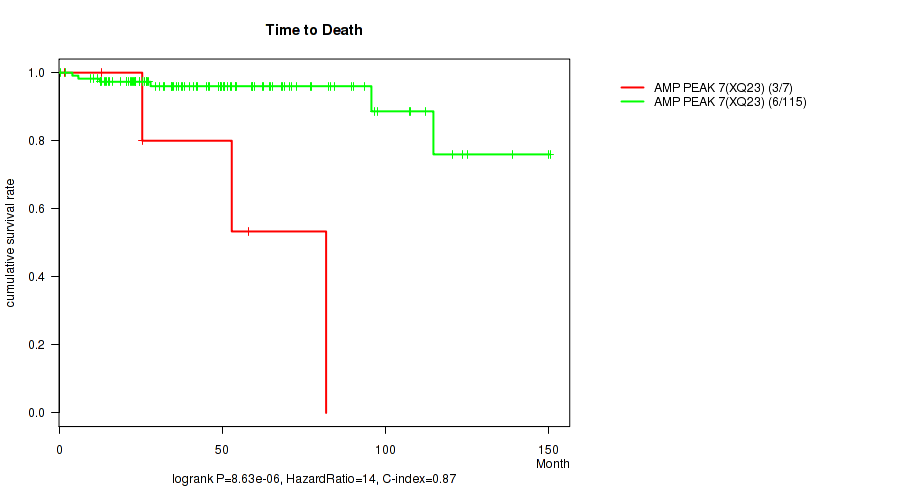
amp_xq23 cnv correlated to 'Time to Death'.
-
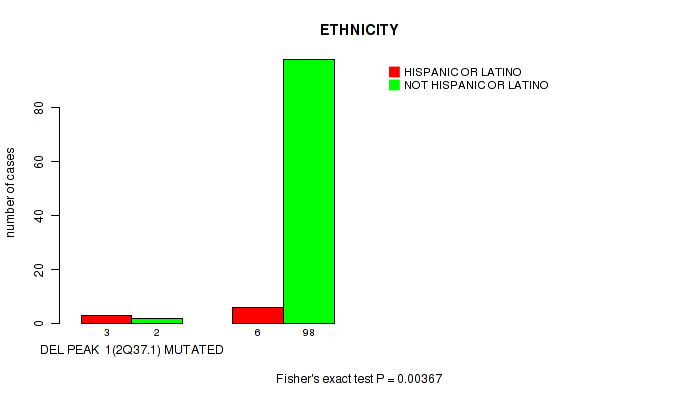
del_2q37.1 cnv correlated to 'ETHNICITY'.
-
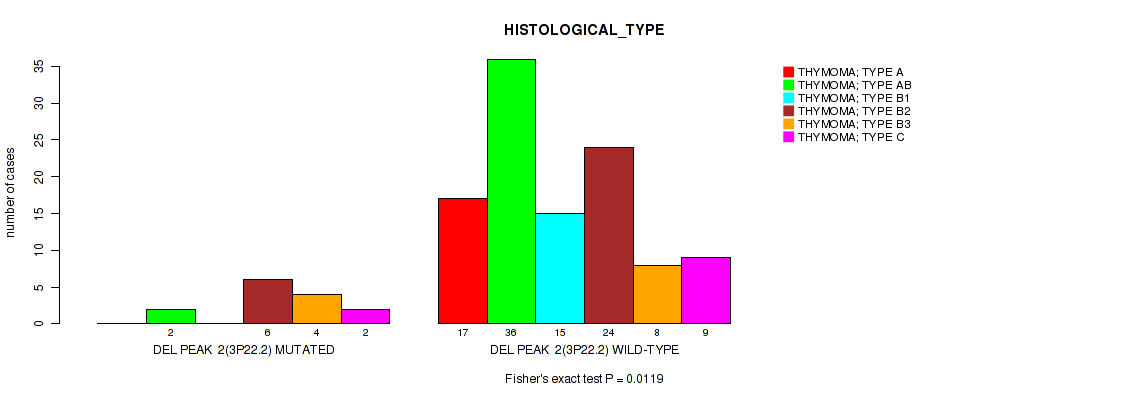
del_3p22.2 cnv correlated to 'HISTOLOGICAL_TYPE' and 'ETHNICITY'.
-
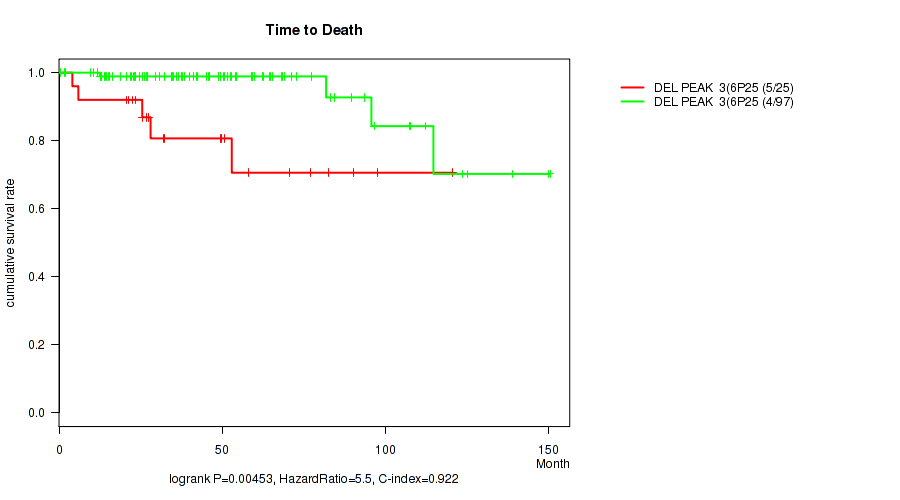
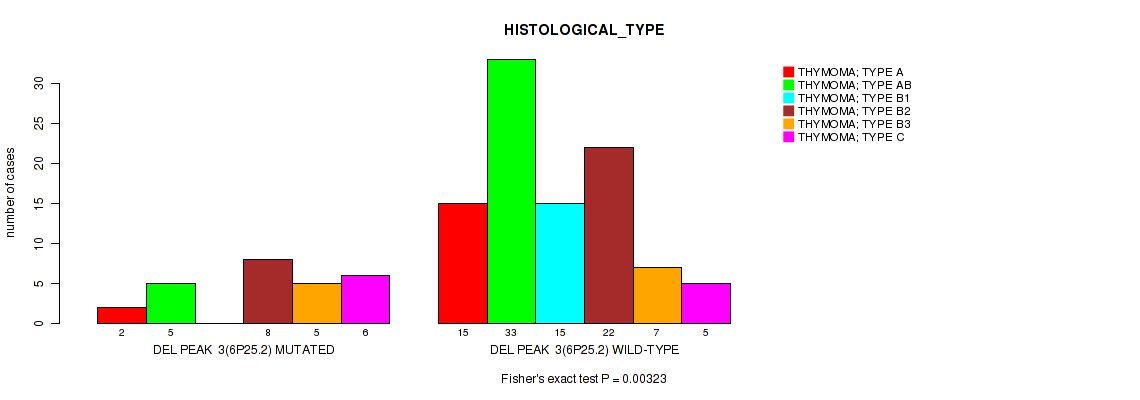
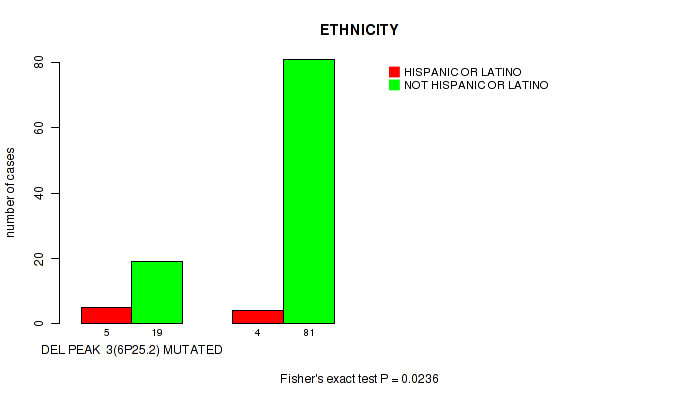
del_6p25.2 cnv correlated to 'Time to Death', 'HISTOLOGICAL_TYPE', and 'ETHNICITY'.
-
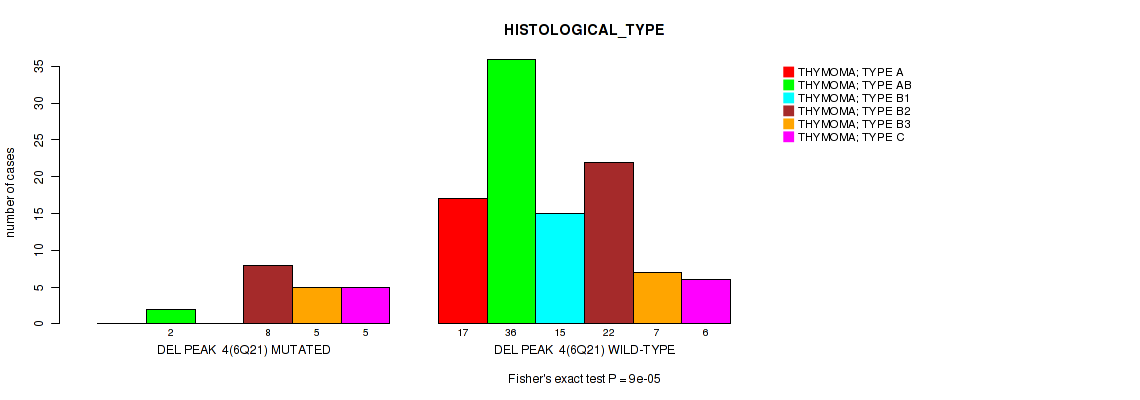
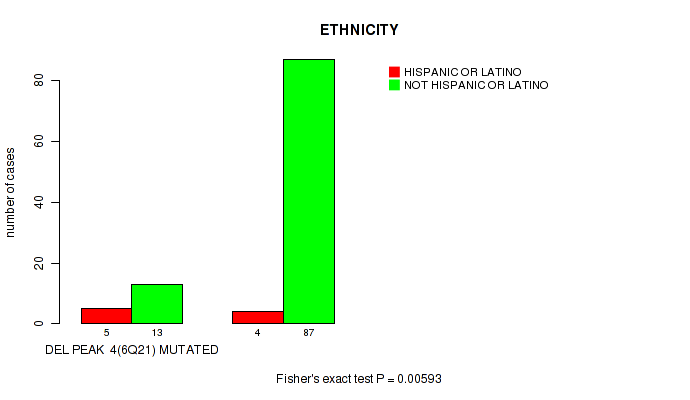
del_6q21 cnv correlated to 'HISTOLOGICAL_TYPE' and 'ETHNICITY'.
-
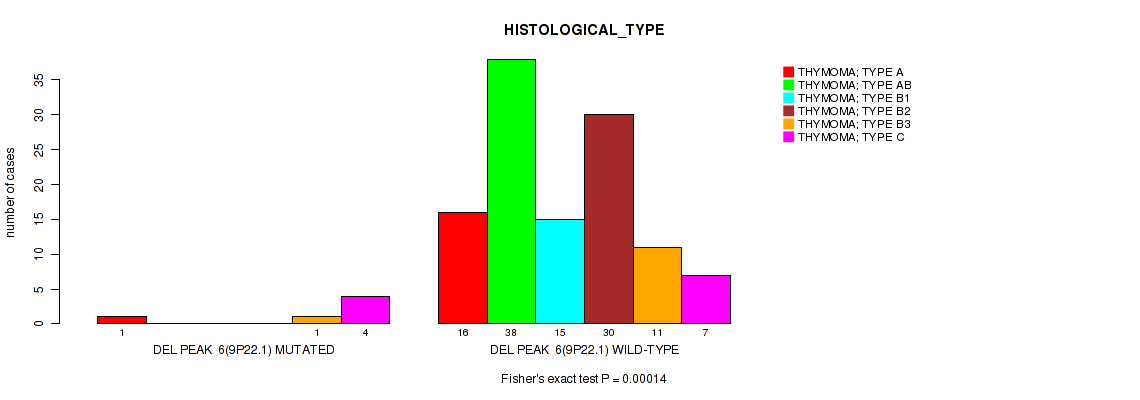
del_9p22.1 cnv correlated to 'HISTOLOGICAL_TYPE'.
-
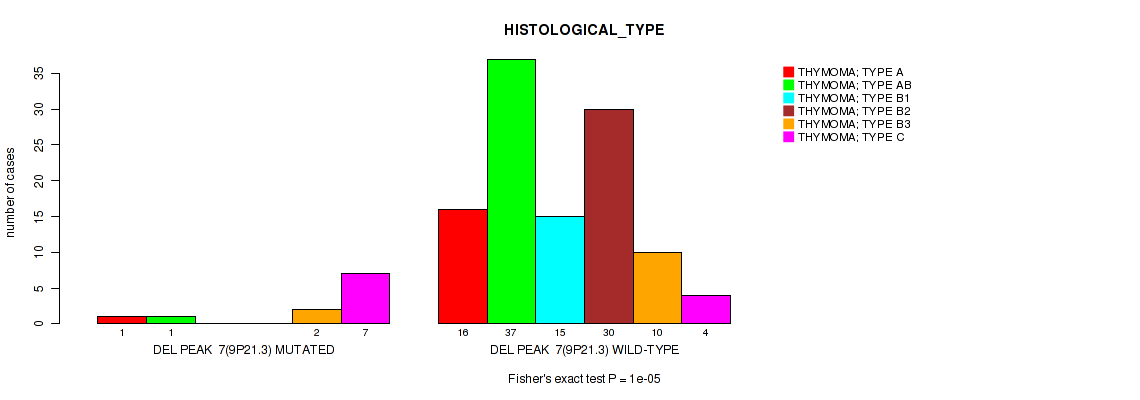
del_9p21.3 cnv correlated to 'HISTOLOGICAL_TYPE'.
-
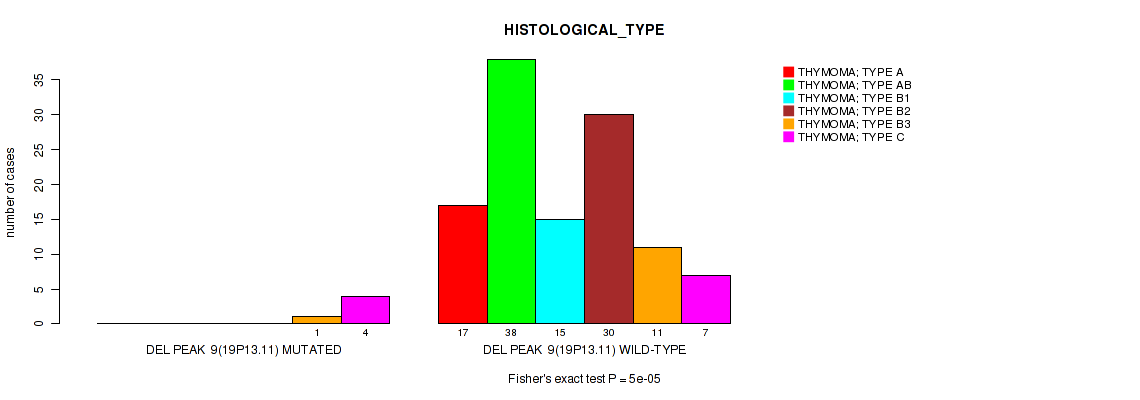
del_19p13.11 cnv correlated to 'HISTOLOGICAL_TYPE'.
-
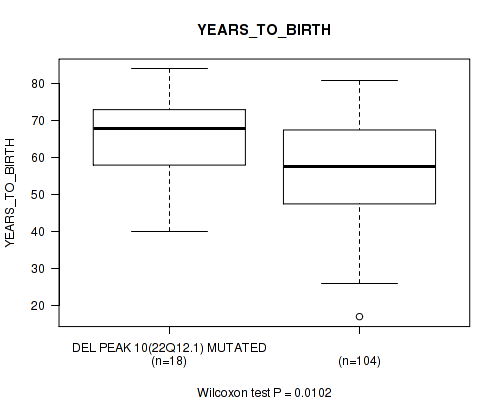
del_22q12.1 cnv correlated to 'YEARS_TO_BIRTH' and 'ETHNICITY'.
-
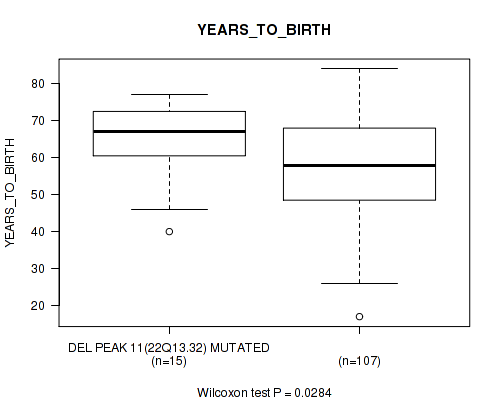
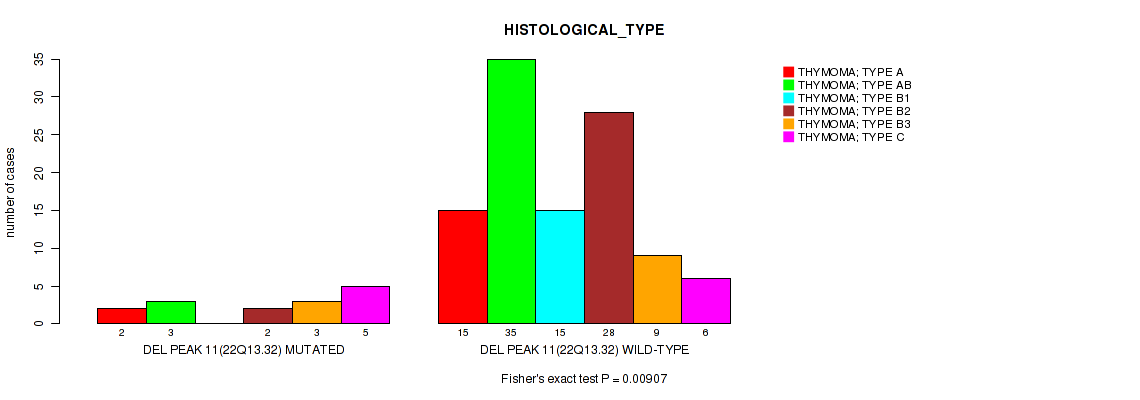
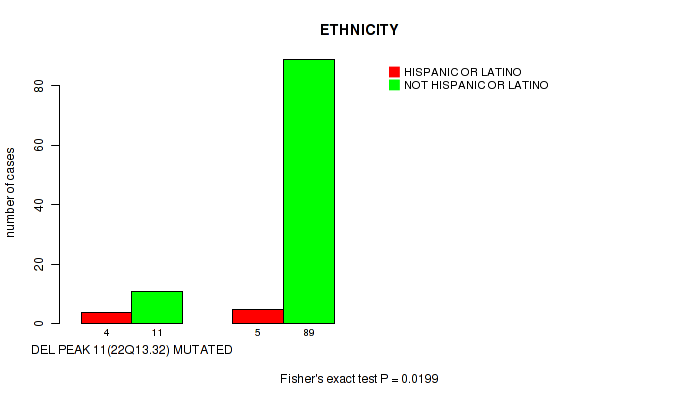
del_22q13.32 cnv correlated to 'YEARS_TO_BIRTH', 'HISTOLOGICAL_TYPE', and 'ETHNICITY'.
Table 1. Get Full Table Overview of the association between significant copy number variation of 18 focal events and 8 clinical features. Shown in the table are P values (Q values). Thresholded by Q value < 0.25, 24 significant findings detected.
|
Clinical Features |
Time to Death |
YEARS TO BIRTH |
TUMOR TISSUE SITE |
GENDER |
RADIATION THERAPY |
HISTOLOGICAL TYPE |
RACE | ETHNICITY | ||
| nCNV (%) | nWild-Type | logrank test | Wilcoxon-test | Fisher's exact test | Fisher's exact test | Fisher's exact test | Fisher's exact test | Fisher's exact test | Fisher's exact test | |
| amp 1q41 | 28 (23%) | 95 |
0.0012 (0.0172) |
0.0831 (0.323) |
1 (1.00) |
0.138 (0.413) |
0.000234 (0.0042) |
1e-05 (0.00048) |
1 (1.00) |
0.443 (0.787) |
| del 6p25 2 | 26 (21%) | 97 |
0.00453 (0.05) |
0.718 (0.984) |
1 (1.00) |
1 (1.00) |
0.645 (0.941) |
0.00323 (0.0423) |
0.274 (0.616) |
0.0236 (0.148) |
| del 22q13 32 | 15 (12%) | 108 |
0.763 (1.00) |
0.0284 (0.17) |
0.0947 (0.359) |
0.411 (0.769) |
0.144 (0.423) |
0.00907 (0.0768) |
1 (1.00) |
0.0199 (0.136) |
| amp 12p12 3 | 6 (5%) | 117 |
0.297 (0.649) |
0.102 (0.368) |
0.0207 (0.136) |
1 (1.00) |
1 (1.00) |
0.00071 (0.0114) |
1 (1.00) |
0.0767 (0.307) |
| del 3p22 2 | 14 (11%) | 109 |
0.199 (0.522) |
0.656 (0.941) |
0.187 (0.515) |
1 (1.00) |
0.552 (0.903) |
0.0119 (0.0856) |
1 (1.00) |
0.0113 (0.0856) |
| del 6q21 | 20 (16%) | 103 |
0.0594 (0.296) |
0.187 (0.515) |
0.379 (0.758) |
0.626 (0.939) |
0.609 (0.939) |
9e-05 (0.00259) |
0.501 (0.839) |
0.00593 (0.0569) |
| del 22q12 1 | 19 (15%) | 104 |
0.369 (0.749) |
0.0102 (0.0819) |
0.128 (0.401) |
0.455 (0.792) |
0.797 (1.00) |
0.0675 (0.296) |
0.871 (1.00) |
0.00777 (0.0699) |
| amp 17q11 2 | 10 (8%) | 113 |
0.396 (0.769) |
0.207 (0.533) |
0.456 (0.792) |
1 (1.00) |
0.307 (0.65) |
0.00012 (0.00288) |
1 (1.00) |
0.192 (0.515) |
| amp 21q22 2 | 3 (2%) | 120 |
0.782 (1.00) |
0.221 (0.551) |
0.121 (0.39) |
0.107 (0.368) |
1 (1.00) |
0.00486 (0.05) |
1 (1.00) |
1 (1.00) |
| amp xq23 | 7 (6%) | 116 |
8.63e-06 (0.00048) |
0.0582 (0.296) |
0.648 (0.941) |
1 (1.00) |
0.229 (0.551) |
0.103 (0.368) |
1 (1.00) |
1 (1.00) |
| del 2q37 1 | 5 (4%) | 118 |
0.62 (0.939) |
0.333 (0.694) |
0.0699 (0.296) |
1 (1.00) |
0.66 (0.941) |
0.431 (0.775) |
0.303 (0.65) |
0.00367 (0.044) |
| del 9p22 1 | 6 (5%) | 117 |
0.609 (0.939) |
0.0613 (0.296) |
0.119 (0.39) |
0.425 (0.775) |
0.41 (0.769) |
0.00014 (0.00288) |
1 (1.00) |
0.0767 (0.307) |
| del 9p21 3 | 11 (9%) | 112 |
0.476 (0.816) |
0.122 (0.39) |
0.705 (0.982) |
0.35 (0.72) |
1 (1.00) |
1e-05 (0.00048) |
1 (1.00) |
0.225 (0.551) |
| del 19p13 11 | 5 (4%) | 118 |
0.668 (0.943) |
0.0628 (0.296) |
0.0699 (0.296) |
0.193 (0.515) |
1 (1.00) |
5e-05 (0.0018) |
1 (1.00) |
0.0535 (0.296) |
| amp 10q11 21 | 3 (2%) | 120 |
0.709 (0.982) |
0.487 (0.826) |
1 (1.00) |
0.107 (0.368) |
0.268 (0.613) |
0.138 (0.413) |
0.401 (0.769) |
1 (1.00) |
| amp xp11 22 | 3 (2%) | 120 |
0.618 (0.939) |
0.791 (1.00) |
1 (1.00) |
0.607 (0.939) |
0.268 (0.613) |
0.0664 (0.296) |
1 (1.00) |
1 (1.00) |
| del 7q36 3 | 3 (2%) | 120 |
0.779 (1.00) |
0.62 (0.939) |
0.528 (0.874) |
0.607 (0.939) |
0.268 (0.613) |
0.0452 (0.261) |
1 (1.00) |
0.23 (0.551) |
| del 10q26 3 | 6 (5%) | 117 |
0.168 (0.485) |
0.845 (1.00) |
1 (1.00) |
0.425 (0.775) |
1 (1.00) |
0.297 (0.649) |
0.651 (0.941) |
0.411 (0.769) |
P value = 0.0012 (logrank test), Q value = 0.017
Table S1. Gene #1: 'amp_1q41' versus Clinical Feature #1: 'Time to Death'
| nPatients | nDeath | Duration Range (Median), Month | |
|---|---|---|---|
| ALL | 122 | 9 | 0.5 - 150.4 (40.6) |
| AMP PEAK 1(1Q41) MUTATED | 28 | 6 | 1.6 - 123.7 (40.6) |
| AMP PEAK 1(1Q41) WILD-TYPE | 94 | 3 | 0.5 - 150.4 (40.6) |
Figure S1. Get High-res Image Gene #1: 'amp_1q41' versus Clinical Feature #1: 'Time to Death'
P value = 0.000234 (Fisher's exact test), Q value = 0.0042
Table S2. Gene #1: 'amp_1q41' versus Clinical Feature #5: 'RADIATION_THERAPY'
| nPatients | NO | YES |
|---|---|---|
| ALL | 81 | 42 |
| AMP PEAK 1(1Q41) MUTATED | 10 | 18 |
| AMP PEAK 1(1Q41) WILD-TYPE | 71 | 24 |
Figure S2. Get High-res Image Gene #1: 'amp_1q41' versus Clinical Feature #5: 'RADIATION_THERAPY'
P value = 1e-05 (Fisher's exact test), Q value = 0.00048
Table S3. Gene #1: 'amp_1q41' versus Clinical Feature #6: 'HISTOLOGICAL_TYPE'
| nPatients | THYMOMA; TYPE A | THYMOMA; TYPE AB | THYMOMA; TYPE B1 | THYMOMA; TYPE B2 | THYMOMA; TYPE B3 | THYMOMA; TYPE C |
|---|---|---|---|---|---|---|
| ALL | 17 | 38 | 15 | 30 | 12 | 11 |
| AMP PEAK 1(1Q41) MUTATED | 1 | 2 | 2 | 8 | 7 | 8 |
| AMP PEAK 1(1Q41) WILD-TYPE | 16 | 36 | 13 | 22 | 5 | 3 |
Figure S3. Get High-res Image Gene #1: 'amp_1q41' versus Clinical Feature #6: 'HISTOLOGICAL_TYPE'
P value = 0.0207 (Fisher's exact test), Q value = 0.14
Table S4. Gene #3: 'amp_12p12.3' versus Clinical Feature #3: 'TUMOR_TISSUE_SITE'
| nPatients | ANTERIOR MEDIASTINUM | THYMUS |
|---|---|---|
| ALL | 27 | 96 |
| AMP PEAK 3(12P12.3) MUTATED | 4 | 2 |
| AMP PEAK 3(12P12.3) WILD-TYPE | 23 | 94 |
Figure S4. Get High-res Image Gene #3: 'amp_12p12.3' versus Clinical Feature #3: 'TUMOR_TISSUE_SITE'
P value = 0.00071 (Fisher's exact test), Q value = 0.011
Table S5. Gene #3: 'amp_12p12.3' versus Clinical Feature #6: 'HISTOLOGICAL_TYPE'
| nPatients | THYMOMA; TYPE A | THYMOMA; TYPE AB | THYMOMA; TYPE B1 | THYMOMA; TYPE B2 | THYMOMA; TYPE B3 | THYMOMA; TYPE C |
|---|---|---|---|---|---|---|
| ALL | 17 | 38 | 15 | 30 | 12 | 11 |
| AMP PEAK 3(12P12.3) MUTATED | 1 | 0 | 0 | 1 | 0 | 4 |
| AMP PEAK 3(12P12.3) WILD-TYPE | 16 | 38 | 15 | 29 | 12 | 7 |
Figure S5. Get High-res Image Gene #3: 'amp_12p12.3' versus Clinical Feature #6: 'HISTOLOGICAL_TYPE'
P value = 0.00012 (Fisher's exact test), Q value = 0.0029
Table S6. Gene #4: 'amp_17q11.2' versus Clinical Feature #6: 'HISTOLOGICAL_TYPE'
| nPatients | THYMOMA; TYPE A | THYMOMA; TYPE AB | THYMOMA; TYPE B1 | THYMOMA; TYPE B2 | THYMOMA; TYPE B3 | THYMOMA; TYPE C |
|---|---|---|---|---|---|---|
| ALL | 17 | 38 | 15 | 30 | 12 | 11 |
| AMP PEAK 4(17Q11.2) MUTATED | 2 | 0 | 0 | 1 | 2 | 5 |
| AMP PEAK 4(17Q11.2) WILD-TYPE | 15 | 38 | 15 | 29 | 10 | 6 |
Figure S6. Get High-res Image Gene #4: 'amp_17q11.2' versus Clinical Feature #6: 'HISTOLOGICAL_TYPE'
P value = 0.00486 (Fisher's exact test), Q value = 0.05
Table S7. Gene #5: 'amp_21q22.2' versus Clinical Feature #6: 'HISTOLOGICAL_TYPE'
| nPatients | THYMOMA; TYPE A | THYMOMA; TYPE AB | THYMOMA; TYPE B1 | THYMOMA; TYPE B2 | THYMOMA; TYPE B3 | THYMOMA; TYPE C |
|---|---|---|---|---|---|---|
| ALL | 17 | 38 | 15 | 30 | 12 | 11 |
| AMP PEAK 5(21Q22.2) MUTATED | 0 | 0 | 0 | 0 | 1 | 2 |
| AMP PEAK 5(21Q22.2) WILD-TYPE | 17 | 38 | 15 | 30 | 11 | 9 |
Figure S7. Get High-res Image Gene #5: 'amp_21q22.2' versus Clinical Feature #6: 'HISTOLOGICAL_TYPE'
P value = 8.63e-06 (logrank test), Q value = 0.00048
Table S8. Gene #7: 'amp_xq23' versus Clinical Feature #1: 'Time to Death'
| nPatients | nDeath | Duration Range (Median), Month | |
|---|---|---|---|
| ALL | 122 | 9 | 0.5 - 150.4 (40.6) |
| AMP PEAK 7(XQ23) MUTATED | 7 | 3 | 1.6 - 81.8 (25.6) |
| AMP PEAK 7(XQ23) WILD-TYPE | 115 | 6 | 0.5 - 150.4 (41.2) |
Figure S8. Get High-res Image Gene #7: 'amp_xq23' versus Clinical Feature #1: 'Time to Death'
P value = 0.00367 (Fisher's exact test), Q value = 0.044
Table S9. Gene #8: 'del_2q37.1' versus Clinical Feature #8: 'ETHNICITY'
| nPatients | HISPANIC OR LATINO | NOT HISPANIC OR LATINO |
|---|---|---|
| ALL | 9 | 100 |
| DEL PEAK 1(2Q37.1) MUTATED | 3 | 2 |
| DEL PEAK 1(2Q37.1) WILD-TYPE | 6 | 98 |
Figure S9. Get High-res Image Gene #8: 'del_2q37.1' versus Clinical Feature #8: 'ETHNICITY'
P value = 0.0119 (Fisher's exact test), Q value = 0.086
Table S10. Gene #9: 'del_3p22.2' versus Clinical Feature #6: 'HISTOLOGICAL_TYPE'
| nPatients | THYMOMA; TYPE A | THYMOMA; TYPE AB | THYMOMA; TYPE B1 | THYMOMA; TYPE B2 | THYMOMA; TYPE B3 | THYMOMA; TYPE C |
|---|---|---|---|---|---|---|
| ALL | 17 | 38 | 15 | 30 | 12 | 11 |
| DEL PEAK 2(3P22.2) MUTATED | 0 | 2 | 0 | 6 | 4 | 2 |
| DEL PEAK 2(3P22.2) WILD-TYPE | 17 | 36 | 15 | 24 | 8 | 9 |
Figure S10. Get High-res Image Gene #9: 'del_3p22.2' versus Clinical Feature #6: 'HISTOLOGICAL_TYPE'
P value = 0.0113 (Fisher's exact test), Q value = 0.086
Table S11. Gene #9: 'del_3p22.2' versus Clinical Feature #8: 'ETHNICITY'
| nPatients | HISPANIC OR LATINO | NOT HISPANIC OR LATINO |
|---|---|---|
| ALL | 9 | 100 |
| DEL PEAK 2(3P22.2) MUTATED | 4 | 9 |
| DEL PEAK 2(3P22.2) WILD-TYPE | 5 | 91 |
Figure S11. Get High-res Image Gene #9: 'del_3p22.2' versus Clinical Feature #8: 'ETHNICITY'

P value = 0.00453 (logrank test), Q value = 0.05
Table S12. Gene #10: 'del_6p25.2' versus Clinical Feature #1: 'Time to Death'
| nPatients | nDeath | Duration Range (Median), Month | |
|---|---|---|---|
| ALL | 122 | 9 | 0.5 - 150.4 (40.6) |
| DEL PEAK 3(6P25.2) MUTATED | 25 | 5 | 4.1 - 120.4 (31.9) |
| DEL PEAK 3(6P25.2) WILD-TYPE | 97 | 4 | 0.5 - 150.4 (42.1) |
Figure S12. Get High-res Image Gene #10: 'del_6p25.2' versus Clinical Feature #1: 'Time to Death'
P value = 0.00323 (Fisher's exact test), Q value = 0.042
Table S13. Gene #10: 'del_6p25.2' versus Clinical Feature #6: 'HISTOLOGICAL_TYPE'
| nPatients | THYMOMA; TYPE A | THYMOMA; TYPE AB | THYMOMA; TYPE B1 | THYMOMA; TYPE B2 | THYMOMA; TYPE B3 | THYMOMA; TYPE C |
|---|---|---|---|---|---|---|
| ALL | 17 | 38 | 15 | 30 | 12 | 11 |
| DEL PEAK 3(6P25.2) MUTATED | 2 | 5 | 0 | 8 | 5 | 6 |
| DEL PEAK 3(6P25.2) WILD-TYPE | 15 | 33 | 15 | 22 | 7 | 5 |
Figure S13. Get High-res Image Gene #10: 'del_6p25.2' versus Clinical Feature #6: 'HISTOLOGICAL_TYPE'
P value = 0.0236 (Fisher's exact test), Q value = 0.15
Table S14. Gene #10: 'del_6p25.2' versus Clinical Feature #8: 'ETHNICITY'
| nPatients | HISPANIC OR LATINO | NOT HISPANIC OR LATINO |
|---|---|---|
| ALL | 9 | 100 |
| DEL PEAK 3(6P25.2) MUTATED | 5 | 19 |
| DEL PEAK 3(6P25.2) WILD-TYPE | 4 | 81 |
Figure S14. Get High-res Image Gene #10: 'del_6p25.2' versus Clinical Feature #8: 'ETHNICITY'
P value = 9e-05 (Fisher's exact test), Q value = 0.0026
Table S15. Gene #11: 'del_6q21' versus Clinical Feature #6: 'HISTOLOGICAL_TYPE'
| nPatients | THYMOMA; TYPE A | THYMOMA; TYPE AB | THYMOMA; TYPE B1 | THYMOMA; TYPE B2 | THYMOMA; TYPE B3 | THYMOMA; TYPE C |
|---|---|---|---|---|---|---|
| ALL | 17 | 38 | 15 | 30 | 12 | 11 |
| DEL PEAK 4(6Q21) MUTATED | 0 | 2 | 0 | 8 | 5 | 5 |
| DEL PEAK 4(6Q21) WILD-TYPE | 17 | 36 | 15 | 22 | 7 | 6 |
Figure S15. Get High-res Image Gene #11: 'del_6q21' versus Clinical Feature #6: 'HISTOLOGICAL_TYPE'
P value = 0.00593 (Fisher's exact test), Q value = 0.057
Table S16. Gene #11: 'del_6q21' versus Clinical Feature #8: 'ETHNICITY'
| nPatients | HISPANIC OR LATINO | NOT HISPANIC OR LATINO |
|---|---|---|
| ALL | 9 | 100 |
| DEL PEAK 4(6Q21) MUTATED | 5 | 13 |
| DEL PEAK 4(6Q21) WILD-TYPE | 4 | 87 |
Figure S16. Get High-res Image Gene #11: 'del_6q21' versus Clinical Feature #8: 'ETHNICITY'
P value = 0.00014 (Fisher's exact test), Q value = 0.0029
Table S17. Gene #13: 'del_9p22.1' versus Clinical Feature #6: 'HISTOLOGICAL_TYPE'
| nPatients | THYMOMA; TYPE A | THYMOMA; TYPE AB | THYMOMA; TYPE B1 | THYMOMA; TYPE B2 | THYMOMA; TYPE B3 | THYMOMA; TYPE C |
|---|---|---|---|---|---|---|
| ALL | 17 | 38 | 15 | 30 | 12 | 11 |
| DEL PEAK 6(9P22.1) MUTATED | 1 | 0 | 0 | 0 | 1 | 4 |
| DEL PEAK 6(9P22.1) WILD-TYPE | 16 | 38 | 15 | 30 | 11 | 7 |
Figure S17. Get High-res Image Gene #13: 'del_9p22.1' versus Clinical Feature #6: 'HISTOLOGICAL_TYPE'
P value = 1e-05 (Fisher's exact test), Q value = 0.00048
Table S18. Gene #14: 'del_9p21.3' versus Clinical Feature #6: 'HISTOLOGICAL_TYPE'
| nPatients | THYMOMA; TYPE A | THYMOMA; TYPE AB | THYMOMA; TYPE B1 | THYMOMA; TYPE B2 | THYMOMA; TYPE B3 | THYMOMA; TYPE C |
|---|---|---|---|---|---|---|
| ALL | 17 | 38 | 15 | 30 | 12 | 11 |
| DEL PEAK 7(9P21.3) MUTATED | 1 | 1 | 0 | 0 | 2 | 7 |
| DEL PEAK 7(9P21.3) WILD-TYPE | 16 | 37 | 15 | 30 | 10 | 4 |
Figure S18. Get High-res Image Gene #14: 'del_9p21.3' versus Clinical Feature #6: 'HISTOLOGICAL_TYPE'
P value = 5e-05 (Fisher's exact test), Q value = 0.0018
Table S19. Gene #16: 'del_19p13.11' versus Clinical Feature #6: 'HISTOLOGICAL_TYPE'
| nPatients | THYMOMA; TYPE A | THYMOMA; TYPE AB | THYMOMA; TYPE B1 | THYMOMA; TYPE B2 | THYMOMA; TYPE B3 | THYMOMA; TYPE C |
|---|---|---|---|---|---|---|
| ALL | 17 | 38 | 15 | 30 | 12 | 11 |
| DEL PEAK 9(19P13.11) MUTATED | 0 | 0 | 0 | 0 | 1 | 4 |
| DEL PEAK 9(19P13.11) WILD-TYPE | 17 | 38 | 15 | 30 | 11 | 7 |
Figure S19. Get High-res Image Gene #16: 'del_19p13.11' versus Clinical Feature #6: 'HISTOLOGICAL_TYPE'
P value = 0.0102 (Wilcoxon-test), Q value = 0.082
Table S20. Gene #17: 'del_22q12.1' versus Clinical Feature #2: 'YEARS_TO_BIRTH'
| nPatients | Mean (Std.Dev) | |
|---|---|---|
| ALL | 122 | 58.3 (13.0) |
| DEL PEAK 10(22Q12.1) MUTATED | 18 | 65.3 (11.3) |
| DEL PEAK 10(22Q12.1) WILD-TYPE | 104 | 57.0 (12.9) |
Figure S20. Get High-res Image Gene #17: 'del_22q12.1' versus Clinical Feature #2: 'YEARS_TO_BIRTH'
P value = 0.00777 (Fisher's exact test), Q value = 0.07
Table S21. Gene #17: 'del_22q12.1' versus Clinical Feature #8: 'ETHNICITY'
| nPatients | HISPANIC OR LATINO | NOT HISPANIC OR LATINO |
|---|---|---|
| ALL | 9 | 100 |
| DEL PEAK 10(22Q12.1) MUTATED | 5 | 14 |
| DEL PEAK 10(22Q12.1) WILD-TYPE | 4 | 86 |
Figure S21. Get High-res Image Gene #17: 'del_22q12.1' versus Clinical Feature #8: 'ETHNICITY'

P value = 0.0284 (Wilcoxon-test), Q value = 0.17
Table S22. Gene #18: 'del_22q13.32' versus Clinical Feature #2: 'YEARS_TO_BIRTH'
| nPatients | Mean (Std.Dev) | |
|---|---|---|
| ALL | 122 | 58.3 (13.0) |
| DEL PEAK 11(22Q13.32) MUTATED | 15 | 64.7 (11.2) |
| DEL PEAK 11(22Q13.32) WILD-TYPE | 107 | 57.4 (13.0) |
Figure S22. Get High-res Image Gene #18: 'del_22q13.32' versus Clinical Feature #2: 'YEARS_TO_BIRTH'
P value = 0.00907 (Fisher's exact test), Q value = 0.077
Table S23. Gene #18: 'del_22q13.32' versus Clinical Feature #6: 'HISTOLOGICAL_TYPE'
| nPatients | THYMOMA; TYPE A | THYMOMA; TYPE AB | THYMOMA; TYPE B1 | THYMOMA; TYPE B2 | THYMOMA; TYPE B3 | THYMOMA; TYPE C |
|---|---|---|---|---|---|---|
| ALL | 17 | 38 | 15 | 30 | 12 | 11 |
| DEL PEAK 11(22Q13.32) MUTATED | 2 | 3 | 0 | 2 | 3 | 5 |
| DEL PEAK 11(22Q13.32) WILD-TYPE | 15 | 35 | 15 | 28 | 9 | 6 |
Figure S23. Get High-res Image Gene #18: 'del_22q13.32' versus Clinical Feature #6: 'HISTOLOGICAL_TYPE'
P value = 0.0199 (Fisher's exact test), Q value = 0.14
Table S24. Gene #18: 'del_22q13.32' versus Clinical Feature #8: 'ETHNICITY'
| nPatients | HISPANIC OR LATINO | NOT HISPANIC OR LATINO |
|---|---|---|
| ALL | 9 | 100 |
| DEL PEAK 11(22Q13.32) MUTATED | 4 | 11 |
| DEL PEAK 11(22Q13.32) WILD-TYPE | 5 | 89 |
Figure S24. Get High-res Image Gene #18: 'del_22q13.32' versus Clinical Feature #8: 'ETHNICITY'
-
Copy number data file = all_lesions.txt from GISTIC pipeline
-
Processed Copy number data file = /xchip/cga/gdac-prod/tcga-gdac/jobResults/GDAC_Correlate_Genomic_Events_Preprocess/THYM-TP/22516313/transformed.cor.cli.txt
-
Clinical data file = /xchip/cga/gdac-prod/tcga-gdac/jobResults/Append_Data/THYM-TP/22507339/THYM-TP.merged_data.txt
-
Number of patients = 123
-
Number of significantly focal cnvs = 18
-
Number of selected clinical features = 8
-
Exclude genes that fewer than K tumors have mutations, K = 3
For survival clinical features, the Kaplan-Meier survival curves of tumors with and without gene mutations were plotted and the statistical significance P values were estimated by logrank test (Bland and Altman 2004) using the 'survdiff' function in R
For binary or multi-class clinical features (nominal or ordinal), two-tailed Fisher's exact tests (Fisher 1922) were used to estimate the P values using the 'fisher.test' function in R
For multiple hypothesis correction, Q value is the False Discovery Rate (FDR) analogue of the P value (Benjamini and Hochberg 1995), defined as the minimum FDR at which the test may be called significant. We used the 'Benjamini and Hochberg' method of 'p.adjust' function in R to convert P values into Q values.
In addition to the links below, the full results of the analysis summarized in this report can also be downloaded programmatically using firehose_get, or interactively from either the Broad GDAC website or TCGA Data Coordination Center Portal.