This pipeline computes the correlation between significantly recurrent gene mutations and selected clinical features.
Testing the association between mutation status of 8 genes and 8 clinical features across 120 patients, 6 significant findings detected with Q value < 0.25.
-
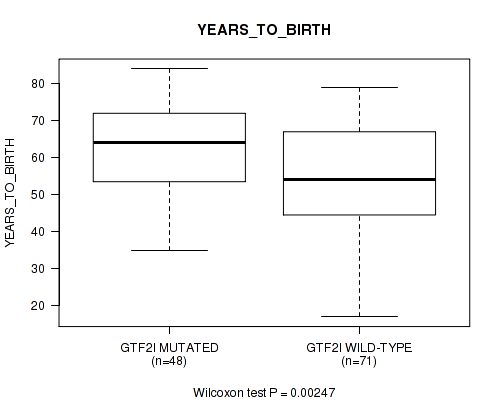
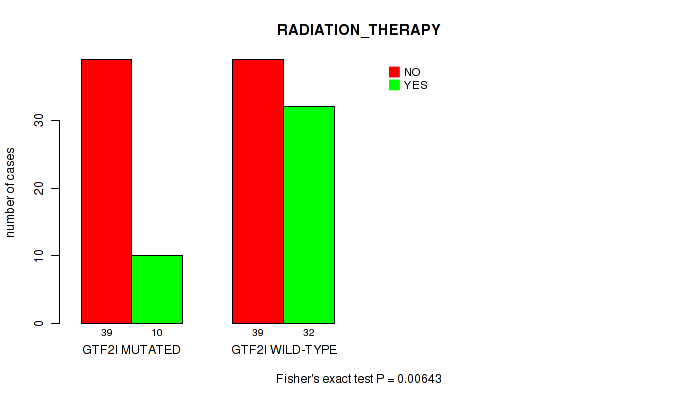
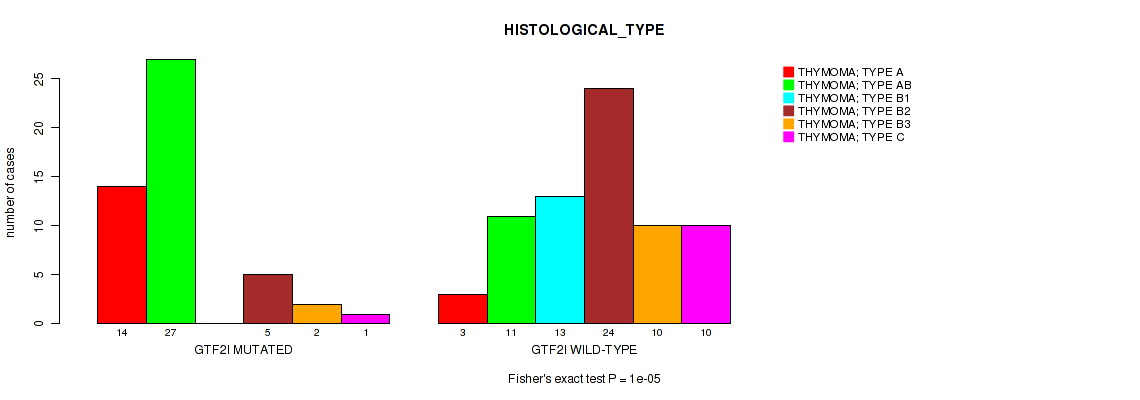
GTF2I mutation correlated to 'YEARS_TO_BIRTH', 'RADIATION_THERAPY', and 'HISTOLOGICAL_TYPE'.
-
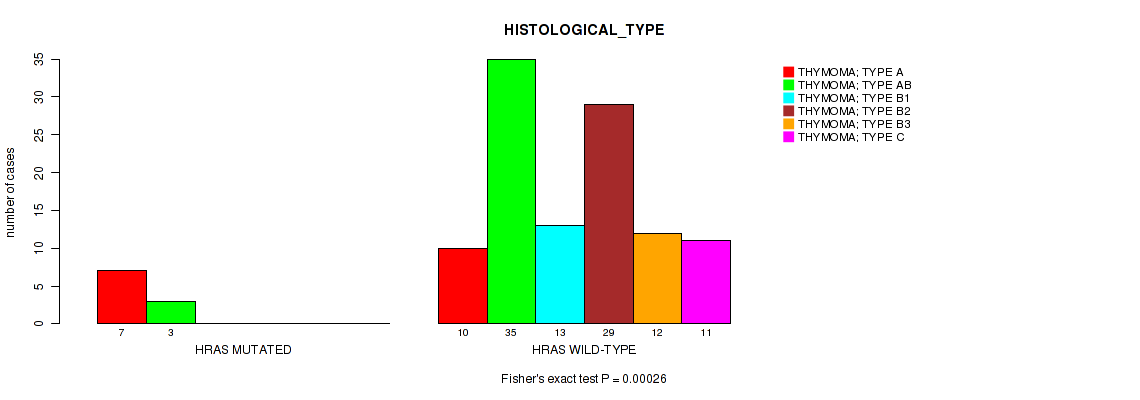
HRAS mutation correlated to 'HISTOLOGICAL_TYPE'.
-
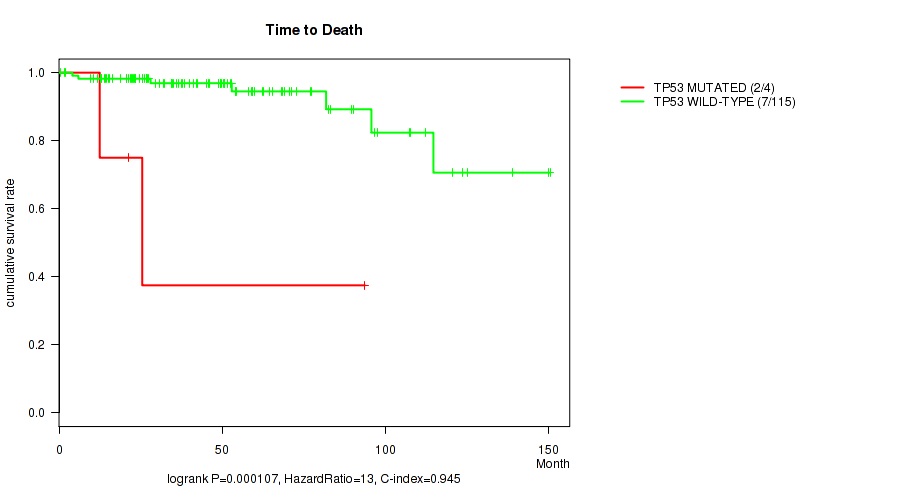
TP53 mutation correlated to 'Time to Death'.
-
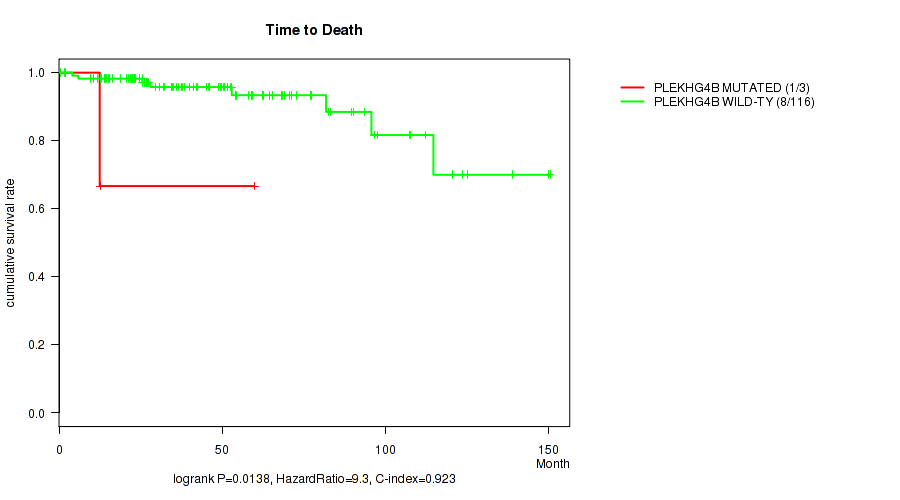
PLEKHG4B mutation correlated to 'Time to Death'.
Table 1. Get Full Table Overview of the association between mutation status of 8 genes and 8 clinical features. Shown in the table are P values (Q values). Thresholded by Q value < 0.25, 6 significant findings detected.
|
Clinical Features |
Time to Death |
YEARS TO BIRTH |
TUMOR TISSUE SITE |
GENDER |
RADIATION THERAPY |
HISTOLOGICAL TYPE |
RACE | ETHNICITY | ||
| nMutated (%) | nWild-Type | logrank test | Wilcoxon-test | Fisher's exact test | Fisher's exact test | Fisher's exact test | Fisher's exact test | Fisher's exact test | Fisher's exact test | |
| GTF2I | 49 (41%) | 71 |
0.521 (1.00) |
0.00247 (0.0395) |
0.652 (1.00) |
0.714 (1.00) |
0.00643 (0.0823) |
1e-05 (0.00064) |
0.537 (1.00) |
0.736 (1.00) |
| HRAS | 10 (8%) | 110 |
0.709 (1.00) |
0.0432 (0.345) |
0.686 (1.00) |
0.323 (0.97) |
1 (1.00) |
0.00026 (0.00555) |
1 (1.00) |
1 (1.00) |
| TP53 | 4 (3%) | 116 |
0.000107 (0.00341) |
0.439 (1.00) |
0.579 (1.00) |
0.619 (1.00) |
0.123 (0.604) |
0.0351 (0.321) |
1 (1.00) |
0.303 (0.97) |
| PLEKHG4B | 3 (2%) | 117 |
0.0138 (0.147) |
0.067 (0.42) |
1 (1.00) |
1 (1.00) |
1 (1.00) |
0.312 (0.97) |
1 (1.00) |
|
| CAPNS1 | 3 (2%) | 117 |
0.705 (1.00) |
0.0722 (0.42) |
1 (1.00) |
0.116 (0.604) |
1 (1.00) |
0.623 (1.00) |
1 (1.00) |
1 (1.00) |
| ATRN | 3 (2%) | 117 |
0.57 (1.00) |
0.973 (1.00) |
0.507 (1.00) |
1 (1.00) |
0.551 (1.00) |
0.443 (1.00) |
0.413 (1.00) |
1 (1.00) |
| NRAS | 3 (2%) | 117 |
0.421 (1.00) |
0.832 (1.00) |
0.507 (1.00) |
0.244 (0.97) |
0.28 (0.97) |
0.31 (0.97) |
0.0677 (0.42) |
1 (1.00) |
| UNC93B1 | 5 (4%) | 115 |
0.652 (1.00) |
0.333 (0.97) |
1 (1.00) |
0.677 (1.00) |
0.161 (0.736) |
0.383 (1.00) |
1 (1.00) |
0.236 (0.97) |
P value = 0.00247 (Wilcoxon-test), Q value = 0.04
Table S1. Gene #1: 'GTF2I MUTATION STATUS' versus Clinical Feature #2: 'YEARS_TO_BIRTH'
| nPatients | Mean (Std.Dev) | |
|---|---|---|
| ALL | 119 | 58.5 (12.7) |
| GTF2I MUTATED | 48 | 63.0 (11.0) |
| GTF2I WILD-TYPE | 71 | 55.5 (13.0) |
Figure S1. Get High-res Image Gene #1: 'GTF2I MUTATION STATUS' versus Clinical Feature #2: 'YEARS_TO_BIRTH'
P value = 0.00643 (Fisher's exact test), Q value = 0.082
Table S2. Gene #1: 'GTF2I MUTATION STATUS' versus Clinical Feature #5: 'RADIATION_THERAPY'
| nPatients | NO | YES |
|---|---|---|
| ALL | 78 | 42 |
| GTF2I MUTATED | 39 | 10 |
| GTF2I WILD-TYPE | 39 | 32 |
Figure S2. Get High-res Image Gene #1: 'GTF2I MUTATION STATUS' versus Clinical Feature #5: 'RADIATION_THERAPY'
P value = 1e-05 (Fisher's exact test), Q value = 0.00064
Table S3. Gene #1: 'GTF2I MUTATION STATUS' versus Clinical Feature #6: 'HISTOLOGICAL_TYPE'
| nPatients | THYMOMA; TYPE A | THYMOMA; TYPE AB | THYMOMA; TYPE B1 | THYMOMA; TYPE B2 | THYMOMA; TYPE B3 | THYMOMA; TYPE C |
|---|---|---|---|---|---|---|
| ALL | 17 | 38 | 13 | 29 | 12 | 11 |
| GTF2I MUTATED | 14 | 27 | 0 | 5 | 2 | 1 |
| GTF2I WILD-TYPE | 3 | 11 | 13 | 24 | 10 | 10 |
Figure S3. Get High-res Image Gene #1: 'GTF2I MUTATION STATUS' versus Clinical Feature #6: 'HISTOLOGICAL_TYPE'
P value = 0.00026 (Fisher's exact test), Q value = 0.0055
Table S4. Gene #2: 'HRAS MUTATION STATUS' versus Clinical Feature #6: 'HISTOLOGICAL_TYPE'
| nPatients | THYMOMA; TYPE A | THYMOMA; TYPE AB | THYMOMA; TYPE B1 | THYMOMA; TYPE B2 | THYMOMA; TYPE B3 | THYMOMA; TYPE C |
|---|---|---|---|---|---|---|
| ALL | 17 | 38 | 13 | 29 | 12 | 11 |
| HRAS MUTATED | 7 | 3 | 0 | 0 | 0 | 0 |
| HRAS WILD-TYPE | 10 | 35 | 13 | 29 | 12 | 11 |
Figure S4. Get High-res Image Gene #2: 'HRAS MUTATION STATUS' versus Clinical Feature #6: 'HISTOLOGICAL_TYPE'
P value = 0.000107 (logrank test), Q value = 0.0034
Table S5. Gene #4: 'TP53 MUTATION STATUS' versus Clinical Feature #1: 'Time to Death'
| nPatients | nDeath | Duration Range (Median), Month | |
|---|---|---|---|
| ALL | 119 | 9 | 0.5 - 150.4 (40.1) |
| TP53 MUTATED | 4 | 2 | 12.5 - 93.7 (23.3) |
| TP53 WILD-TYPE | 115 | 7 | 0.5 - 150.4 (41.2) |
Figure S5. Get High-res Image Gene #4: 'TP53 MUTATION STATUS' versus Clinical Feature #1: 'Time to Death'
P value = 0.0138 (logrank test), Q value = 0.15
Table S6. Gene #7: 'PLEKHG4B MUTATION STATUS' versus Clinical Feature #1: 'Time to Death'
| nPatients | nDeath | Duration Range (Median), Month | |
|---|---|---|---|
| ALL | 119 | 9 | 0.5 - 150.4 (40.1) |
| PLEKHG4B MUTATED | 3 | 1 | 12.5 - 59.8 (12.7) |
| PLEKHG4B WILD-TYPE | 116 | 8 | 0.5 - 150.4 (40.6) |
Figure S6. Get High-res Image Gene #7: 'PLEKHG4B MUTATION STATUS' versus Clinical Feature #1: 'Time to Death'
-
Mutation data file = sample_sig_gene_table.txt from Mutsig_2CV pipeline
-
Processed Mutation data file = /xchip/cga/gdac-prod/tcga-gdac/jobResults/GDAC_Correlate_Genomic_Events_Preprocess/THYM-TP/22571831/transformed.cor.cli.txt
-
Clinical data file = /xchip/cga/gdac-prod/tcga-gdac/jobResults/Append_Data/THYM-TP/22507339/THYM-TP.merged_data.txt
-
Number of patients = 120
-
Number of significantly mutated genes = 8
-
Number of selected clinical features = 8
-
Exclude genes that fewer than K tumors have mutations, K = 3
For survival clinical features, the Kaplan-Meier survival curves of tumors with and without gene mutations were plotted and the statistical significance P values were estimated by logrank test (Bland and Altman 2004) using the 'survdiff' function in R
For binary or multi-class clinical features (nominal or ordinal), two-tailed Fisher's exact tests (Fisher 1922) were used to estimate the P values using the 'fisher.test' function in R
For multiple hypothesis correction, Q value is the False Discovery Rate (FDR) analogue of the P value (Benjamini and Hochberg 1995), defined as the minimum FDR at which the test may be called significant. We used the 'Benjamini and Hochberg' method of 'p.adjust' function in R to convert P values into Q values.
In addition to the links below, the full results of the analysis summarized in this report can also be downloaded programmatically using firehose_get, or interactively from either the Broad GDAC website or TCGA Data Coordination Center Portal.