This pipeline computes the correlation between cancer subtypes identified by different molecular patterns and selected clinical features.
Testing the association between subtypes identified by 12 different clustering approaches and 4 clinical features across 548 patients, 23 significant findings detected with P value < 0.05 and Q value < 0.25.
-
CNMF clustering analysis on array-based mRNA expression data identified 4 subtypes that correlate to 'HISTOLOGICAL_TYPE'.
-
Consensus hierarchical clustering analysis on array-based mRNA expression data identified 5 subtypes that correlate to 'HISTOLOGICAL_TYPE'.
-
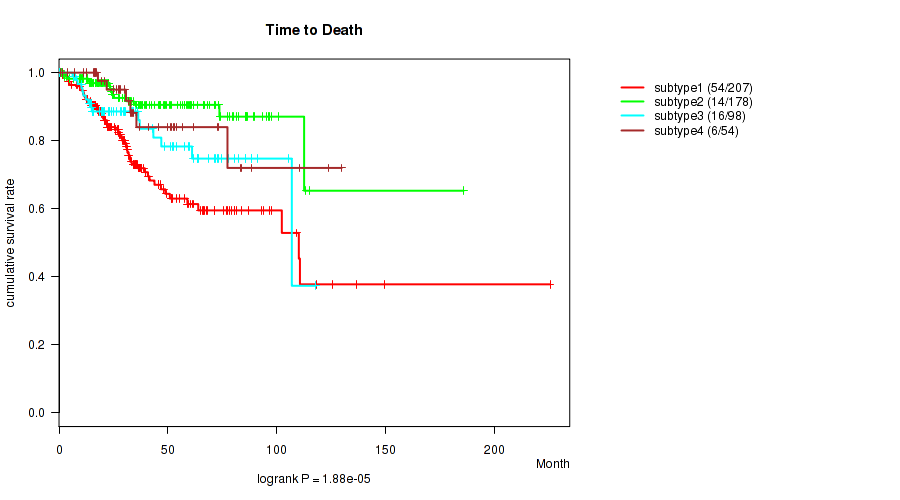
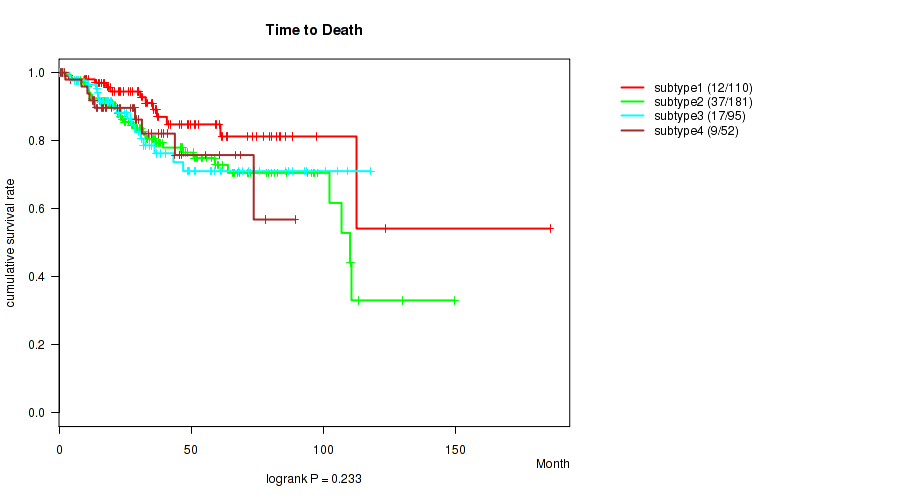
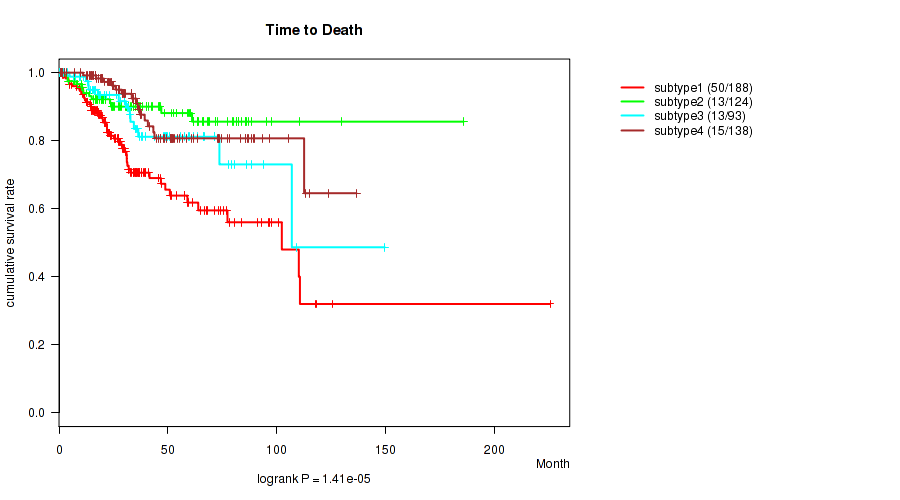
4 subtypes identified in current cancer cohort by 'Copy Number Ratio CNMF subtypes'. These subtypes correlate to 'Time to Death', 'HISTOLOGICAL_TYPE', and 'RESIDUAL_TUMOR'.
-
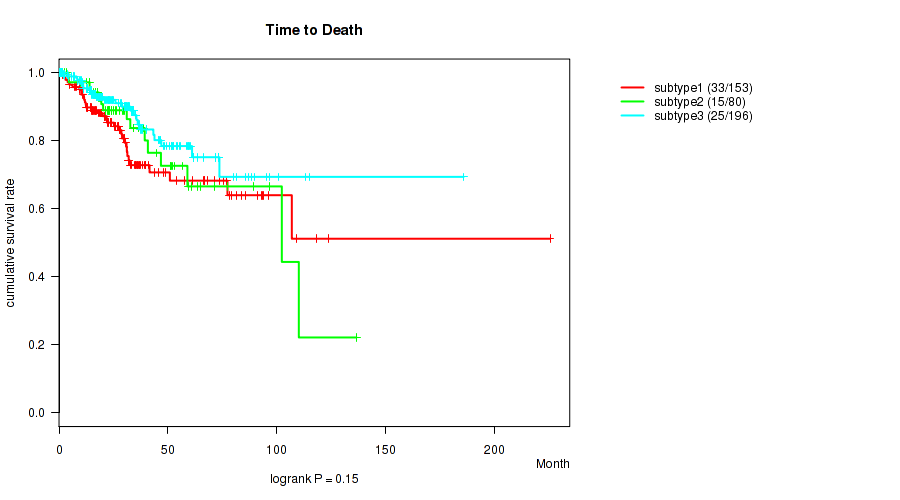
3 subtypes identified in current cancer cohort by 'METHLYATION CNMF'. These subtypes correlate to 'HISTOLOGICAL_TYPE' and 'RESIDUAL_TUMOR'.
-
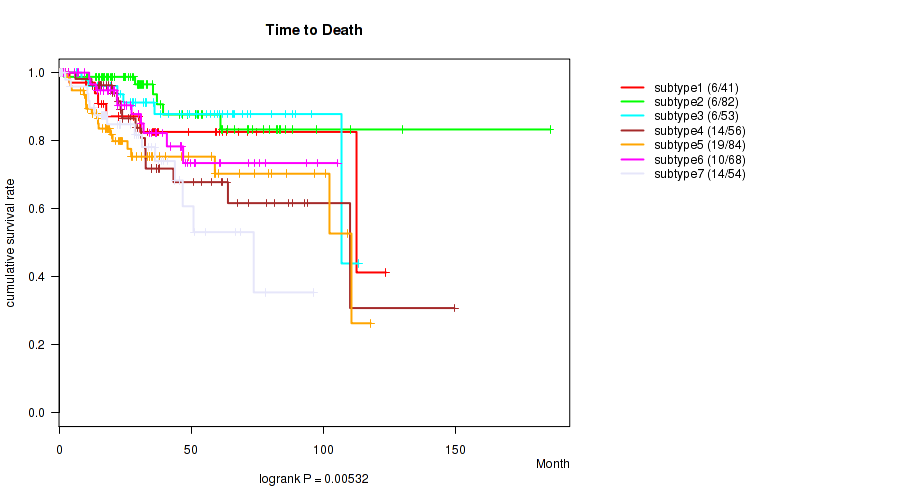
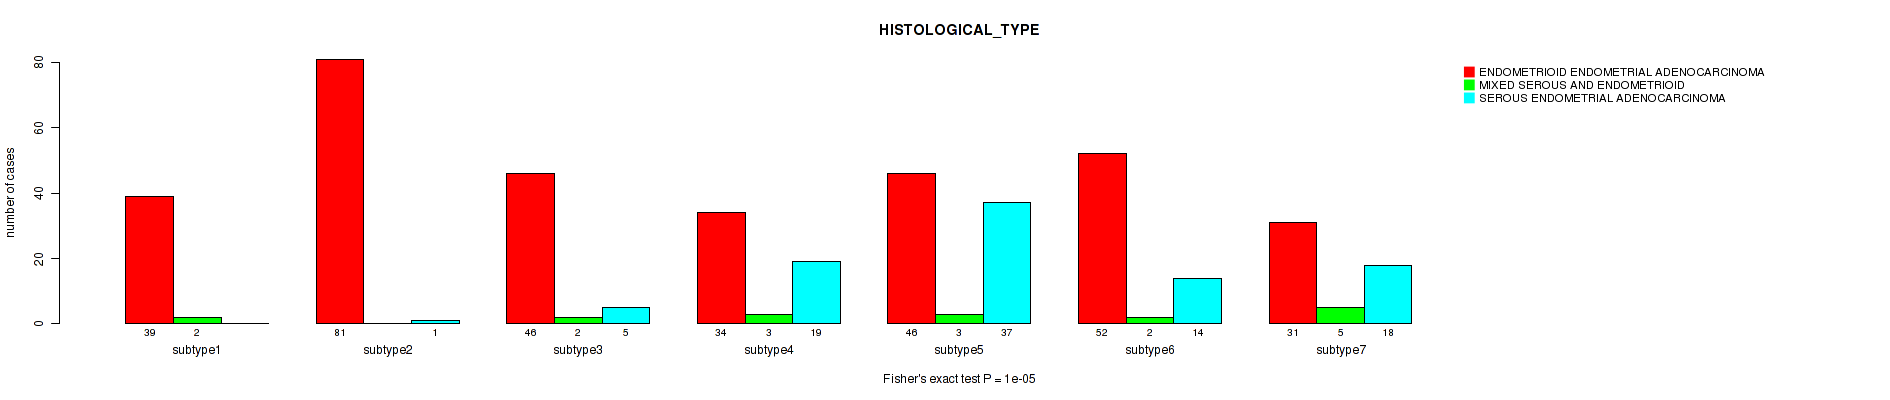
CNMF clustering analysis on RPPA data identified 7 subtypes that correlate to 'Time to Death' and 'HISTOLOGICAL_TYPE'.
-
Consensus hierarchical clustering analysis on RPPA data identified 4 subtypes that correlate to 'HISTOLOGICAL_TYPE'.
-
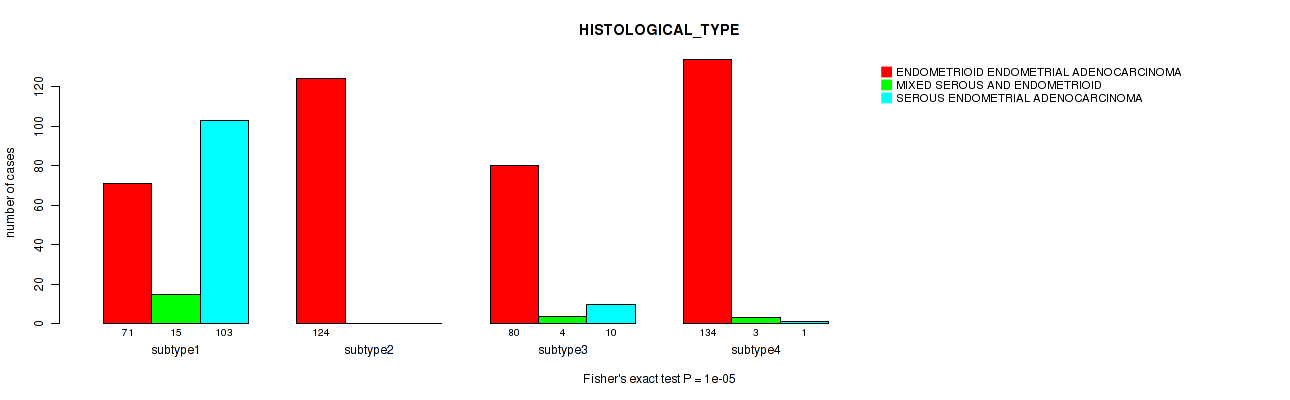
CNMF clustering analysis on sequencing-based mRNA expression data identified 4 subtypes that correlate to 'Time to Death', 'HISTOLOGICAL_TYPE', and 'RESIDUAL_TUMOR'.
-
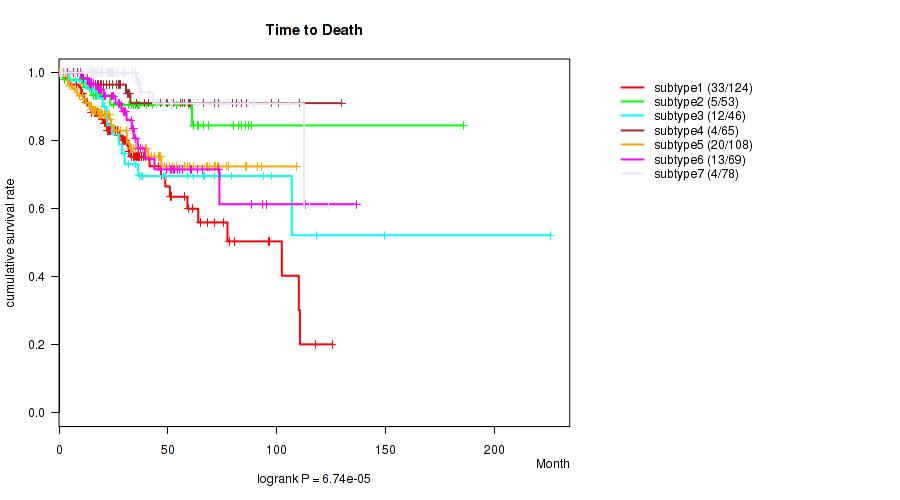
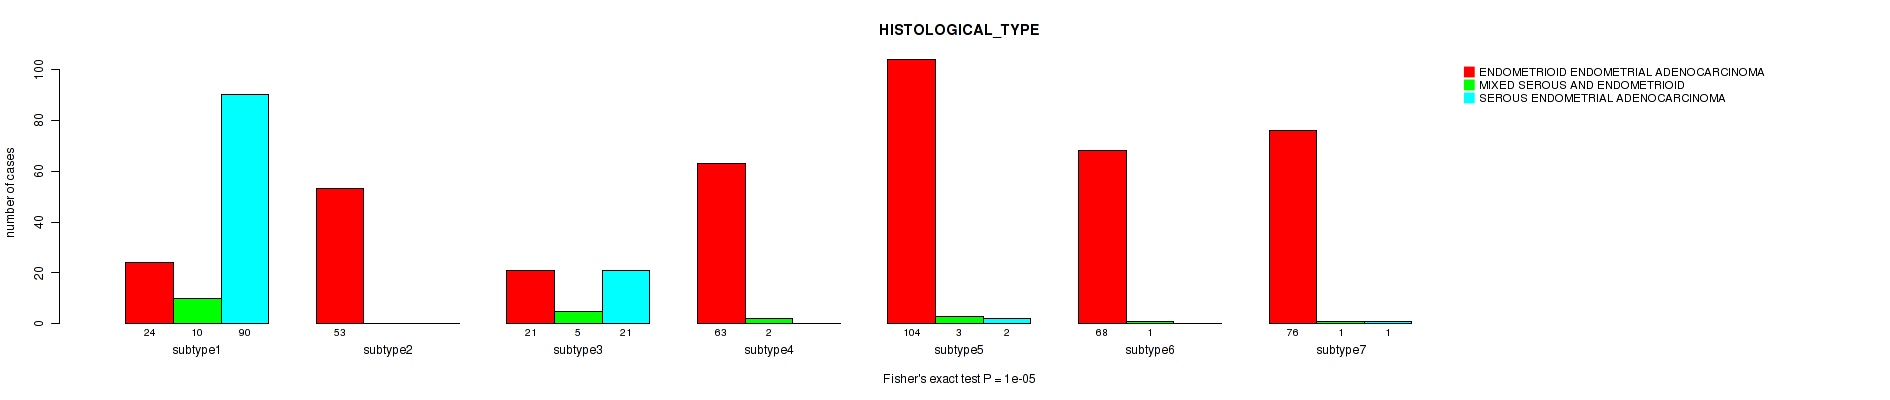
Consensus hierarchical clustering analysis on sequencing-based mRNA expression data identified 7 subtypes that correlate to 'Time to Death', 'HISTOLOGICAL_TYPE', and 'RESIDUAL_TUMOR'.
-
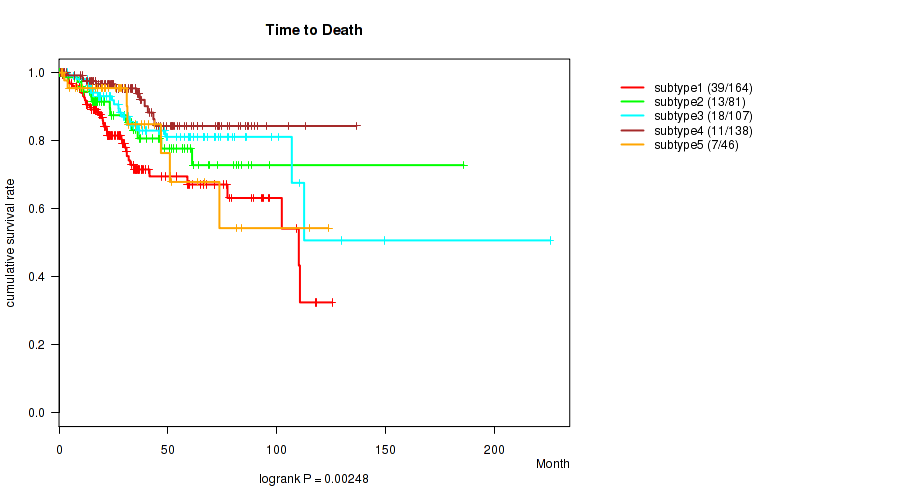
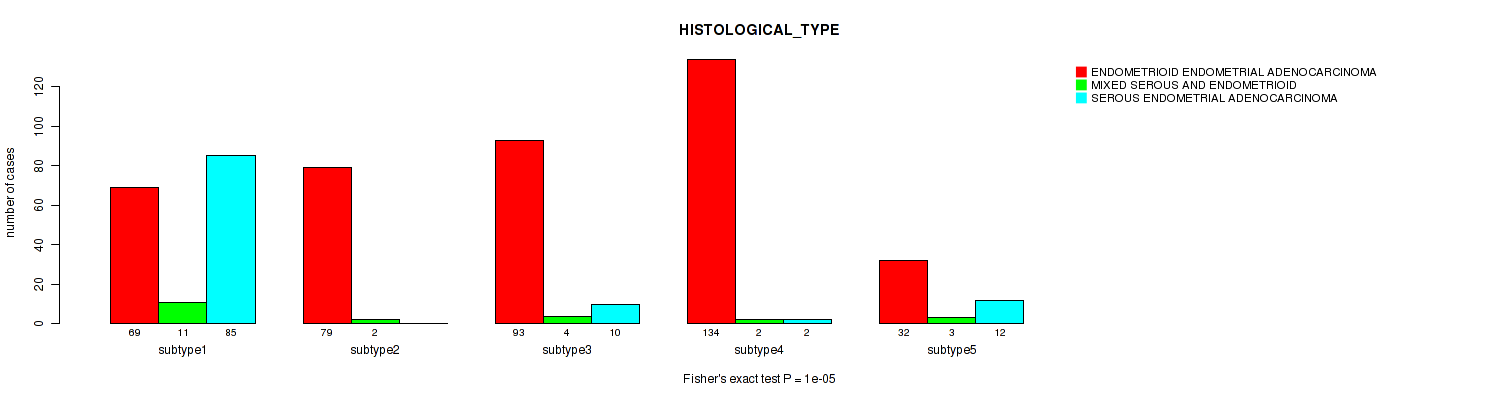
5 subtypes identified in current cancer cohort by 'MIRSEQ CNMF'. These subtypes correlate to 'Time to Death' and 'HISTOLOGICAL_TYPE'.
-
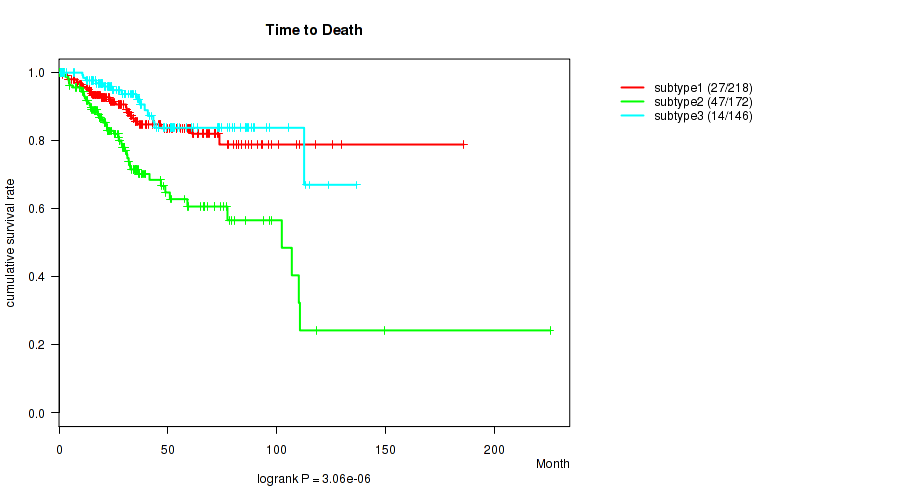
3 subtypes identified in current cancer cohort by 'MIRSEQ CHIERARCHICAL'. These subtypes correlate to 'Time to Death' and 'HISTOLOGICAL_TYPE'.
-
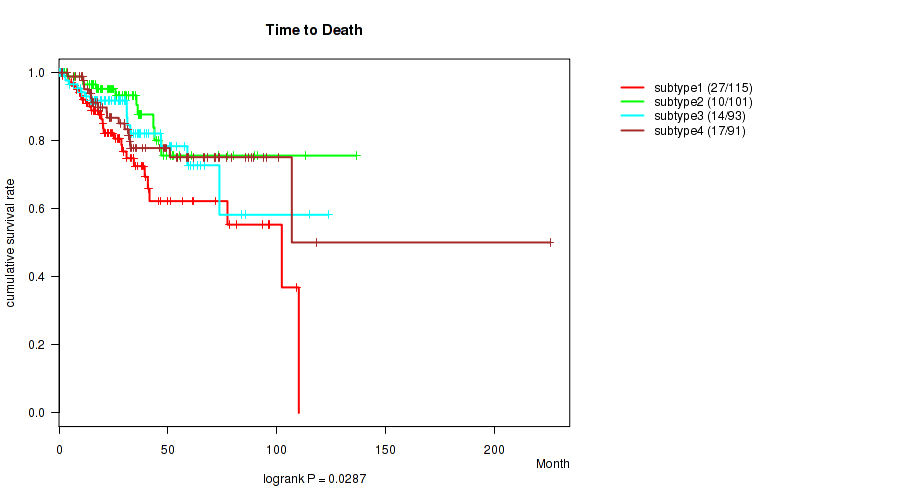
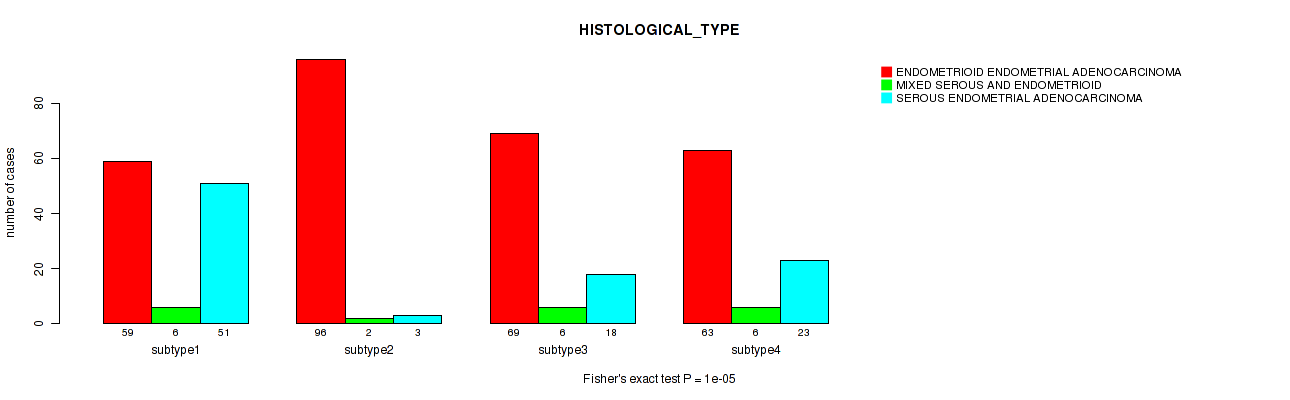
4 subtypes identified in current cancer cohort by 'MIRseq Mature CNMF subtypes'. These subtypes correlate to 'Time to Death' and 'HISTOLOGICAL_TYPE'.
-
3 subtypes identified in current cancer cohort by 'MIRseq Mature cHierClus subtypes'. These subtypes correlate to 'HISTOLOGICAL_TYPE'.
Table 1. Get Full Table Overview of the association between subtypes identified by 12 different clustering approaches and 4 clinical features. Shown in the table are P values (Q values). Thresholded by P value < 0.05 and Q value < 0.25, 23 significant findings detected.
|
Clinical Features |
Time to Death |
RADIATION THERAPY |
HISTOLOGICAL TYPE |
RESIDUAL TUMOR |
| Statistical Tests | logrank test | Fisher's exact test | Fisher's exact test | Fisher's exact test |
| mRNA CNMF subtypes |
0.466 (0.559) |
0.0656 (0.122) |
0.00053 (0.00159) |
0.696 (0.777) |
| mRNA cHierClus subtypes |
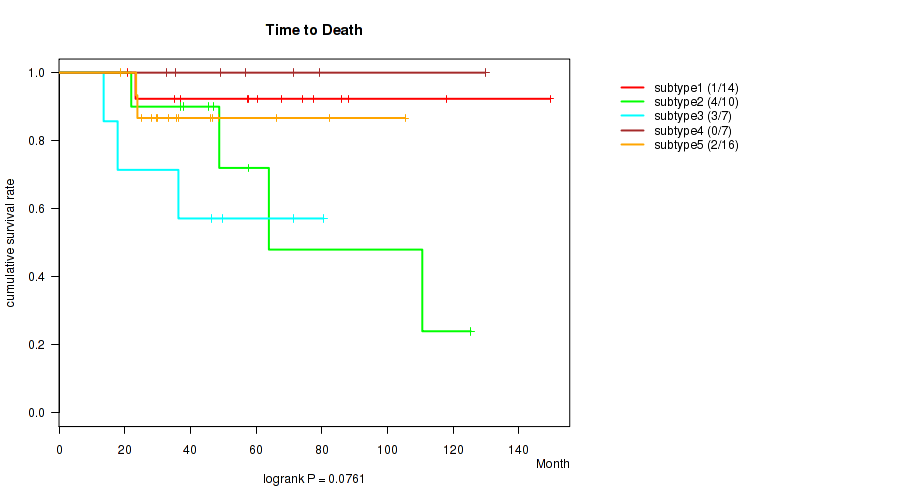
0.0761 (0.129) |
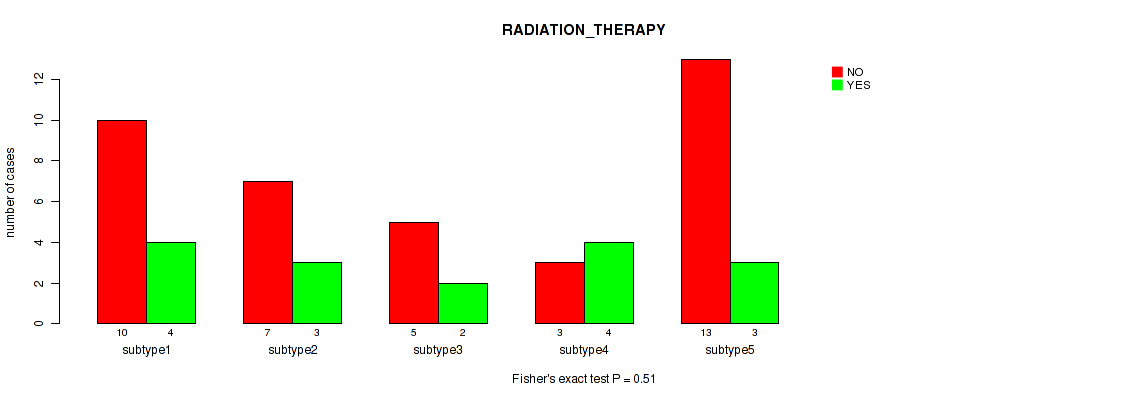
0.51 (0.583) |
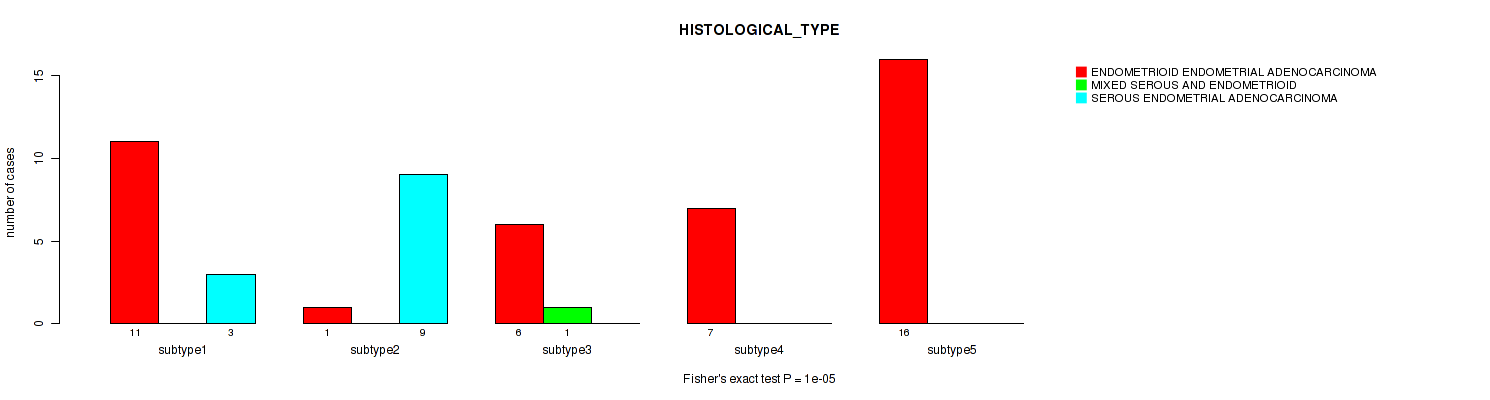
1e-05 (4e-05) |
0.178 (0.251) |
| Copy Number Ratio CNMF subtypes |
1.88e-05 (6.46e-05) |
0.783 (0.8) |
1e-05 (4e-05) |
0.0335 (0.0732) |
| METHLYATION CNMF |
0.15 (0.225) |
0.357 (0.463) |
1e-05 (4e-05) |
0.0403 (0.084) |
| RPPA CNMF subtypes |
0.00532 (0.0142) |
0.719 (0.782) |
1e-05 (4e-05) |
0.822 (0.822) |
| RPPA cHierClus subtypes |
0.233 (0.311) |
0.0923 (0.148) |
1e-05 (4e-05) |
0.733 (0.782) |
| RNAseq CNMF subtypes |
1.41e-05 (5.22e-05) |
0.0663 (0.122) |
1e-05 (4e-05) |
0.00586 (0.0148) |
| RNAseq cHierClus subtypes |
6.74e-05 (0.000216) |
0.462 (0.559) |
1e-05 (4e-05) |
0.0174 (0.0419) |
| MIRSEQ CNMF |
0.00248 (0.00699) |
0.158 (0.23) |
1e-05 (4e-05) |
0.121 (0.187) |
| MIRSEQ CHIERARCHICAL |
3.06e-06 (4e-05) |
0.183 (0.251) |
1e-05 (4e-05) |
0.0608 (0.122) |
| MIRseq Mature CNMF subtypes |
0.0287 (0.0656) |
0.433 (0.547) |
1e-05 (4e-05) |
0.482 (0.564) |
| MIRseq Mature cHierClus subtypes |
0.0698 (0.124) |
0.784 (0.8) |
1e-05 (4e-05) |
0.078 (0.129) |
Table S1. Description of clustering approach #1: 'mRNA CNMF subtypes'
| Cluster Labels | 1 | 2 | 3 | 4 |
|---|---|---|---|---|
| Number of samples | 15 | 18 | 14 | 7 |
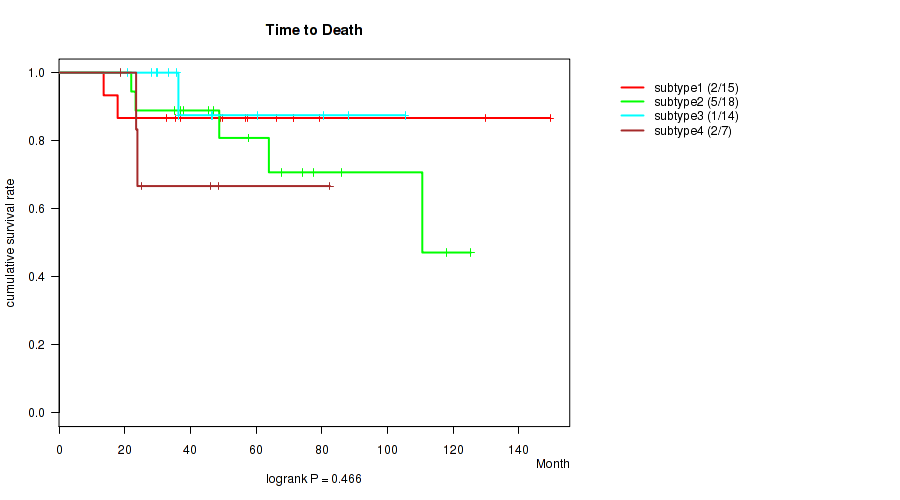
P value = 0.466 (logrank test), Q value = 0.56
Table S2. Clustering Approach #1: 'mRNA CNMF subtypes' versus Clinical Feature #1: 'Time to Death'
| nPatients | nDeath | Duration Range (Median), Month | |
|---|---|---|---|
| ALL | 54 | 10 | 13.6 - 149.6 (47.8) |
| subtype1 | 15 | 2 | 13.6 - 149.6 (56.9) |
| subtype2 | 18 | 5 | 22.0 - 125.4 (57.8) |
| subtype3 | 14 | 1 | 20.9 - 105.4 (36.4) |
| subtype4 | 7 | 2 | 18.6 - 82.5 (25.1) |
Figure S1. Get High-res Image Clustering Approach #1: 'mRNA CNMF subtypes' versus Clinical Feature #1: 'Time to Death'
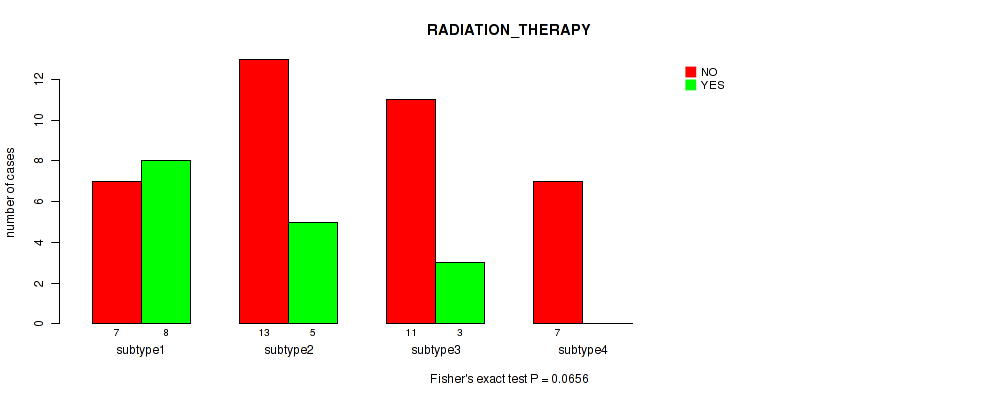
P value = 0.0656 (Fisher's exact test), Q value = 0.12
Table S3. Clustering Approach #1: 'mRNA CNMF subtypes' versus Clinical Feature #2: 'RADIATION_THERAPY'
| nPatients | NO | YES |
|---|---|---|
| ALL | 38 | 16 |
| subtype1 | 7 | 8 |
| subtype2 | 13 | 5 |
| subtype3 | 11 | 3 |
| subtype4 | 7 | 0 |
Figure S2. Get High-res Image Clustering Approach #1: 'mRNA CNMF subtypes' versus Clinical Feature #2: 'RADIATION_THERAPY'
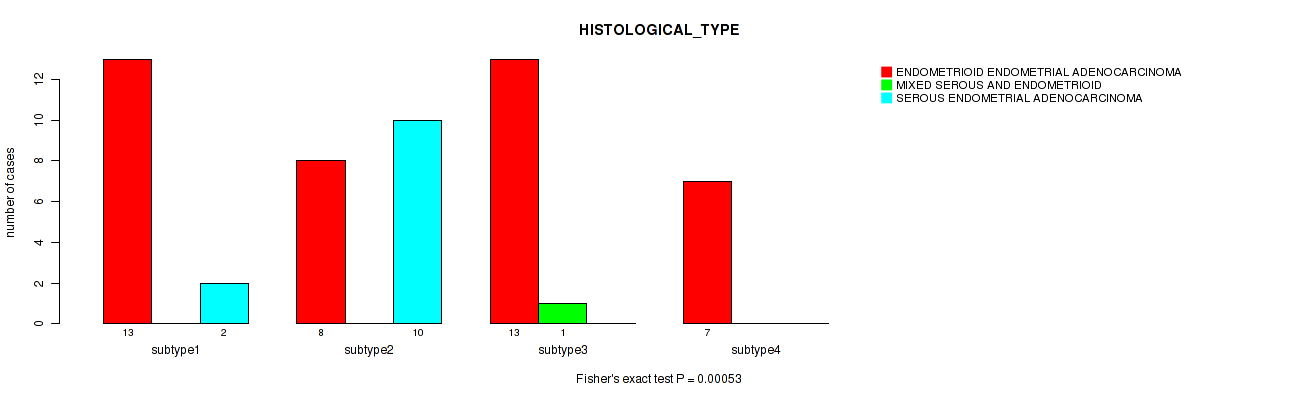
P value = 0.00053 (Fisher's exact test), Q value = 0.0016
Table S4. Clustering Approach #1: 'mRNA CNMF subtypes' versus Clinical Feature #3: 'HISTOLOGICAL_TYPE'
| nPatients | ENDOMETRIOID ENDOMETRIAL ADENOCARCINOMA | MIXED SEROUS AND ENDOMETRIOID | SEROUS ENDOMETRIAL ADENOCARCINOMA |
|---|---|---|---|
| ALL | 41 | 1 | 12 |
| subtype1 | 13 | 0 | 2 |
| subtype2 | 8 | 0 | 10 |
| subtype3 | 13 | 1 | 0 |
| subtype4 | 7 | 0 | 0 |
Figure S3. Get High-res Image Clustering Approach #1: 'mRNA CNMF subtypes' versus Clinical Feature #3: 'HISTOLOGICAL_TYPE'
P value = 0.696 (Fisher's exact test), Q value = 0.78
Table S5. Clustering Approach #1: 'mRNA CNMF subtypes' versus Clinical Feature #4: 'RESIDUAL_TUMOR'
| nPatients | R0 | R1 | R2 | RX |
|---|---|---|---|---|
| ALL | 42 | 3 | 2 | 1 |
| subtype1 | 9 | 2 | 1 | 0 |
| subtype2 | 14 | 1 | 1 | 1 |
| subtype3 | 13 | 0 | 0 | 0 |
| subtype4 | 6 | 0 | 0 | 0 |
Figure S4. Get High-res Image Clustering Approach #1: 'mRNA CNMF subtypes' versus Clinical Feature #4: 'RESIDUAL_TUMOR'
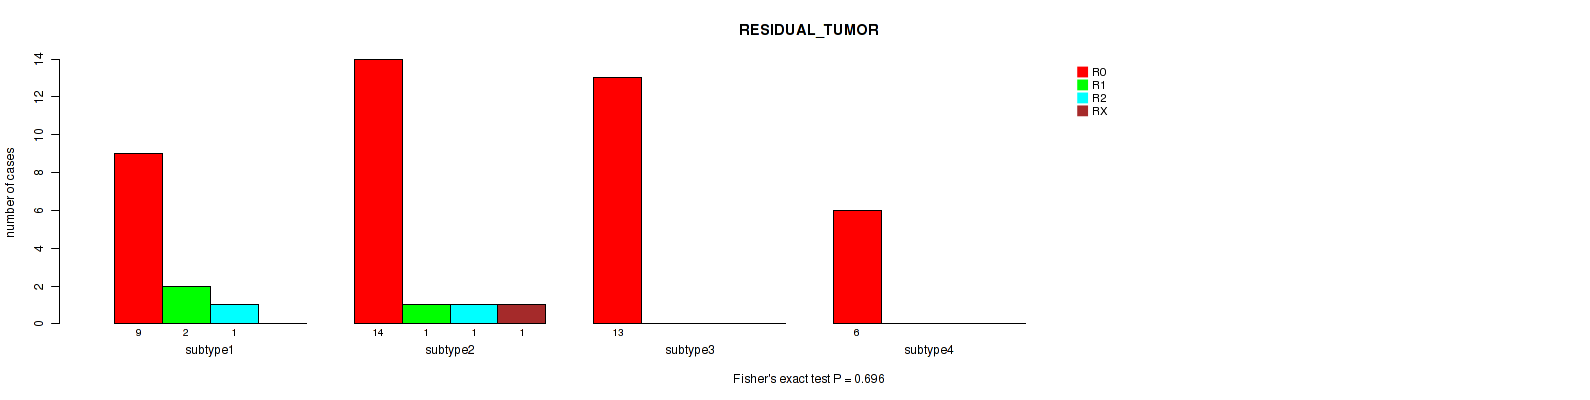
Table S6. Description of clustering approach #2: 'mRNA cHierClus subtypes'
| Cluster Labels | 1 | 2 | 3 | 4 | 5 |
|---|---|---|---|---|---|
| Number of samples | 14 | 10 | 7 | 7 | 16 |
P value = 0.0761 (logrank test), Q value = 0.13
Table S7. Clustering Approach #2: 'mRNA cHierClus subtypes' versus Clinical Feature #1: 'Time to Death'
| nPatients | nDeath | Duration Range (Median), Month | |
|---|---|---|---|
| ALL | 54 | 10 | 13.6 - 149.6 (47.8) |
| subtype1 | 14 | 1 | 20.9 - 149.6 (64.1) |
| subtype2 | 10 | 4 | 22.0 - 125.4 (47.9) |
| subtype3 | 7 | 3 | 13.6 - 80.5 (46.5) |
| subtype4 | 7 | 0 | 32.8 - 129.8 (56.9) |
| subtype5 | 16 | 2 | 18.6 - 105.4 (34.6) |
Figure S5. Get High-res Image Clustering Approach #2: 'mRNA cHierClus subtypes' versus Clinical Feature #1: 'Time to Death'
P value = 0.51 (Fisher's exact test), Q value = 0.58
Table S8. Clustering Approach #2: 'mRNA cHierClus subtypes' versus Clinical Feature #2: 'RADIATION_THERAPY'
| nPatients | NO | YES |
|---|---|---|
| ALL | 38 | 16 |
| subtype1 | 10 | 4 |
| subtype2 | 7 | 3 |
| subtype3 | 5 | 2 |
| subtype4 | 3 | 4 |
| subtype5 | 13 | 3 |
Figure S6. Get High-res Image Clustering Approach #2: 'mRNA cHierClus subtypes' versus Clinical Feature #2: 'RADIATION_THERAPY'
P value = 1e-05 (Fisher's exact test), Q value = 4e-05
Table S9. Clustering Approach #2: 'mRNA cHierClus subtypes' versus Clinical Feature #3: 'HISTOLOGICAL_TYPE'
| nPatients | ENDOMETRIOID ENDOMETRIAL ADENOCARCINOMA | MIXED SEROUS AND ENDOMETRIOID | SEROUS ENDOMETRIAL ADENOCARCINOMA |
|---|---|---|---|
| ALL | 41 | 1 | 12 |
| subtype1 | 11 | 0 | 3 |
| subtype2 | 1 | 0 | 9 |
| subtype3 | 6 | 1 | 0 |
| subtype4 | 7 | 0 | 0 |
| subtype5 | 16 | 0 | 0 |
Figure S7. Get High-res Image Clustering Approach #2: 'mRNA cHierClus subtypes' versus Clinical Feature #3: 'HISTOLOGICAL_TYPE'
P value = 0.178 (Fisher's exact test), Q value = 0.25
Table S10. Clustering Approach #2: 'mRNA cHierClus subtypes' versus Clinical Feature #4: 'RESIDUAL_TUMOR'
| nPatients | R0 | R1 | R2 | RX |
|---|---|---|---|---|
| ALL | 42 | 3 | 2 | 1 |
| subtype1 | 11 | 1 | 0 | 1 |
| subtype2 | 9 | 0 | 1 | 0 |
| subtype3 | 4 | 1 | 1 | 0 |
| subtype4 | 4 | 1 | 0 | 0 |
| subtype5 | 14 | 0 | 0 | 0 |
Figure S8. Get High-res Image Clustering Approach #2: 'mRNA cHierClus subtypes' versus Clinical Feature #4: 'RESIDUAL_TUMOR'
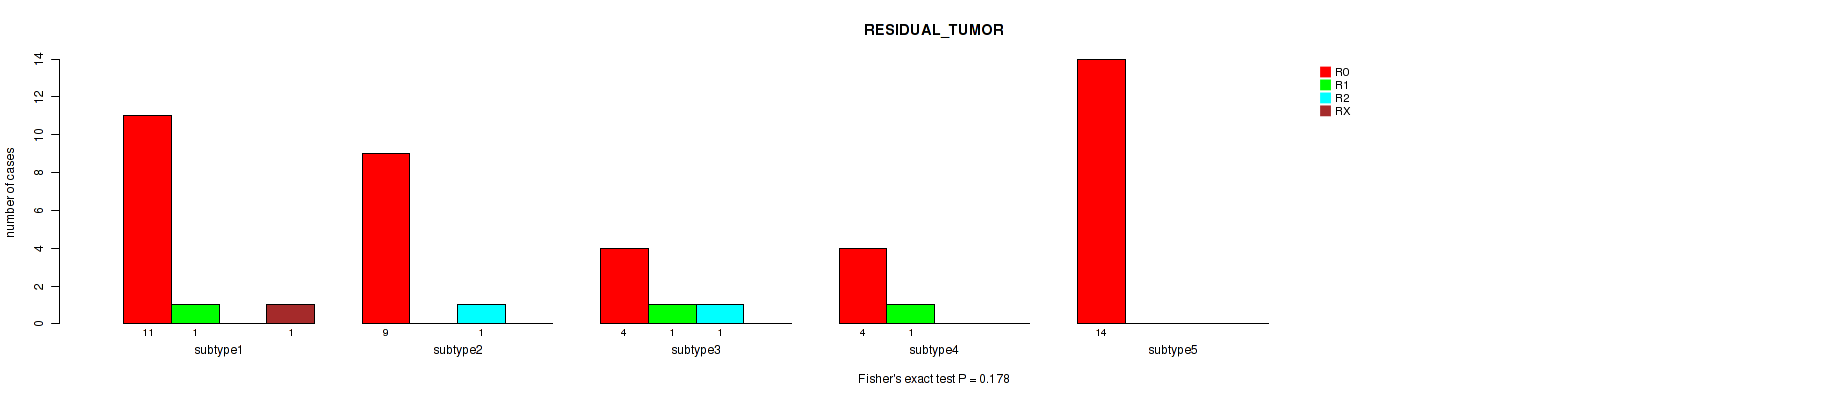
Table S11. Description of clustering approach #3: 'Copy Number Ratio CNMF subtypes'
| Cluster Labels | 1 | 2 | 3 | 4 |
|---|---|---|---|---|
| Number of samples | 208 | 178 | 99 | 54 |
P value = 1.88e-05 (logrank test), Q value = 6.5e-05
Table S12. Clustering Approach #3: 'Copy Number Ratio CNMF subtypes' versus Clinical Feature #1: 'Time to Death'
| nPatients | nDeath | Duration Range (Median), Month | |
|---|---|---|---|
| ALL | 537 | 90 | 0.1 - 225.5 (29.9) |
| subtype1 | 207 | 54 | 0.1 - 225.5 (27.4) |
| subtype2 | 178 | 14 | 0.4 - 185.8 (33.8) |
| subtype3 | 98 | 16 | 0.1 - 118.0 (28.3) |
| subtype4 | 54 | 6 | 0.6 - 129.8 (31.9) |
Figure S9. Get High-res Image Clustering Approach #3: 'Copy Number Ratio CNMF subtypes' versus Clinical Feature #1: 'Time to Death'
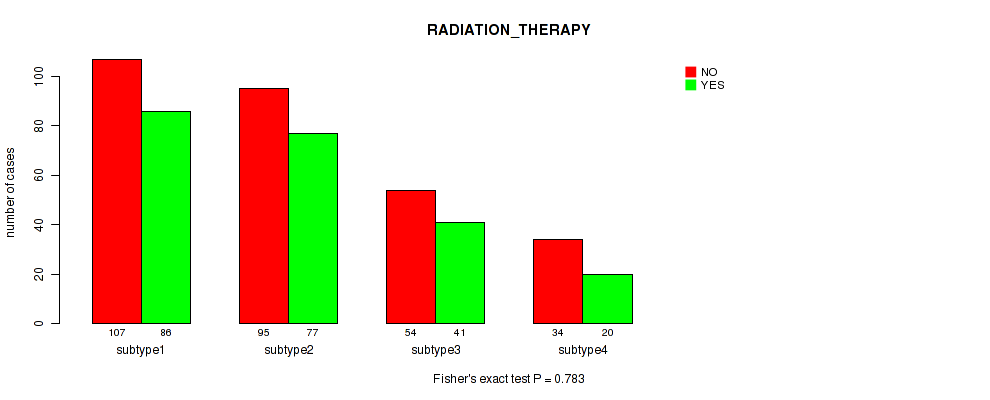
P value = 0.783 (Fisher's exact test), Q value = 0.8
Table S13. Clustering Approach #3: 'Copy Number Ratio CNMF subtypes' versus Clinical Feature #2: 'RADIATION_THERAPY'
| nPatients | NO | YES |
|---|---|---|
| ALL | 290 | 224 |
| subtype1 | 107 | 86 |
| subtype2 | 95 | 77 |
| subtype3 | 54 | 41 |
| subtype4 | 34 | 20 |
Figure S10. Get High-res Image Clustering Approach #3: 'Copy Number Ratio CNMF subtypes' versus Clinical Feature #2: 'RADIATION_THERAPY'
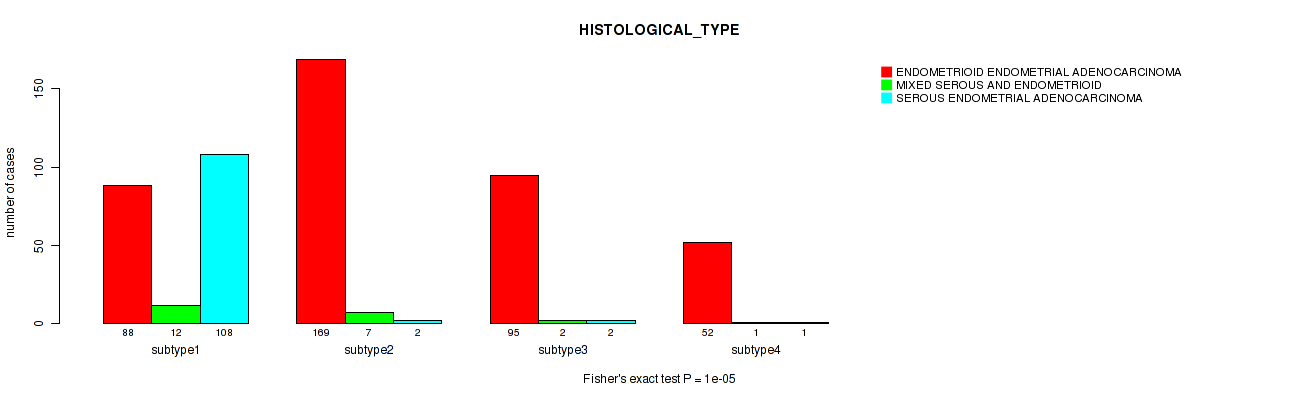
P value = 1e-05 (Fisher's exact test), Q value = 4e-05
Table S14. Clustering Approach #3: 'Copy Number Ratio CNMF subtypes' versus Clinical Feature #3: 'HISTOLOGICAL_TYPE'
| nPatients | ENDOMETRIOID ENDOMETRIAL ADENOCARCINOMA | MIXED SEROUS AND ENDOMETRIOID | SEROUS ENDOMETRIAL ADENOCARCINOMA |
|---|---|---|---|
| ALL | 404 | 22 | 113 |
| subtype1 | 88 | 12 | 108 |
| subtype2 | 169 | 7 | 2 |
| subtype3 | 95 | 2 | 2 |
| subtype4 | 52 | 1 | 1 |
Figure S11. Get High-res Image Clustering Approach #3: 'Copy Number Ratio CNMF subtypes' versus Clinical Feature #3: 'HISTOLOGICAL_TYPE'
P value = 0.0335 (Fisher's exact test), Q value = 0.073
Table S15. Clustering Approach #3: 'Copy Number Ratio CNMF subtypes' versus Clinical Feature #4: 'RESIDUAL_TUMOR'
| nPatients | R0 | R1 | R2 | RX |
|---|---|---|---|---|
| ALL | 371 | 22 | 16 | 40 |
| subtype1 | 132 | 9 | 11 | 19 |
| subtype2 | 122 | 11 | 2 | 16 |
| subtype3 | 75 | 2 | 2 | 3 |
| subtype4 | 42 | 0 | 1 | 2 |
Figure S12. Get High-res Image Clustering Approach #3: 'Copy Number Ratio CNMF subtypes' versus Clinical Feature #4: 'RESIDUAL_TUMOR'
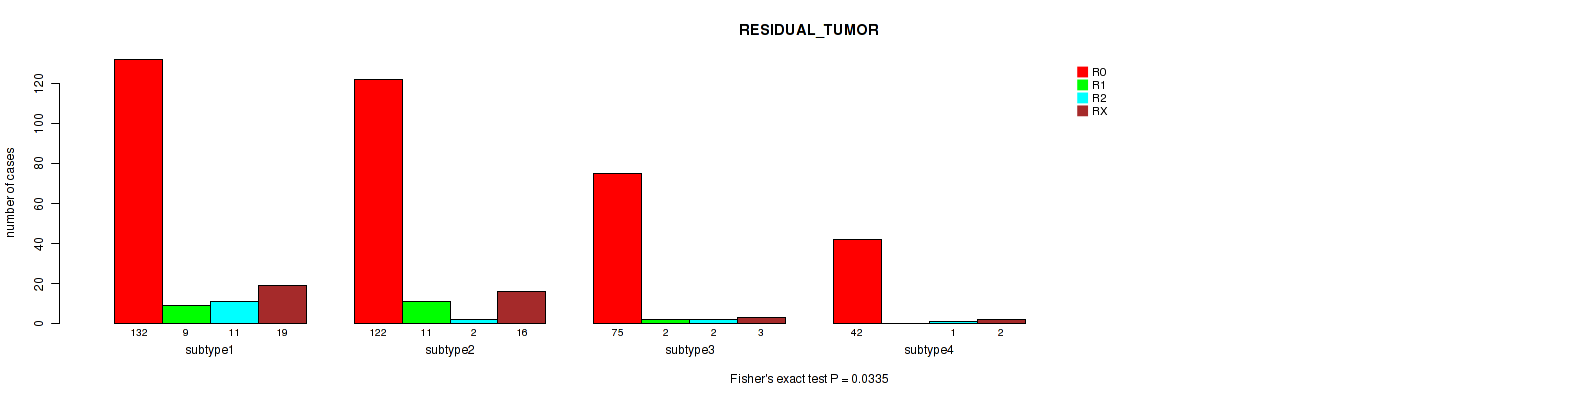
Table S16. Description of clustering approach #4: 'METHLYATION CNMF'
| Cluster Labels | 1 | 2 | 3 |
|---|---|---|---|
| Number of samples | 155 | 80 | 196 |
P value = 0.15 (logrank test), Q value = 0.22
Table S17. Clustering Approach #4: 'METHLYATION CNMF' versus Clinical Feature #1: 'Time to Death'
| nPatients | nDeath | Duration Range (Median), Month | |
|---|---|---|---|
| ALL | 429 | 73 | 0.1 - 225.5 (25.9) |
| subtype1 | 153 | 33 | 0.1 - 225.5 (27.1) |
| subtype2 | 80 | 15 | 0.3 - 136.6 (26.2) |
| subtype3 | 196 | 25 | 0.1 - 185.8 (24.3) |
Figure S13. Get High-res Image Clustering Approach #4: 'METHLYATION CNMF' versus Clinical Feature #1: 'Time to Death'
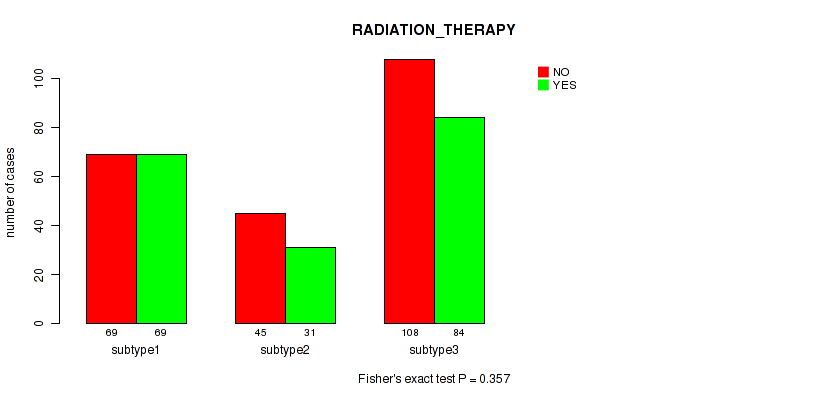
P value = 0.357 (Fisher's exact test), Q value = 0.46
Table S18. Clustering Approach #4: 'METHLYATION CNMF' versus Clinical Feature #2: 'RADIATION_THERAPY'
| nPatients | NO | YES |
|---|---|---|
| ALL | 222 | 184 |
| subtype1 | 69 | 69 |
| subtype2 | 45 | 31 |
| subtype3 | 108 | 84 |
Figure S14. Get High-res Image Clustering Approach #4: 'METHLYATION CNMF' versus Clinical Feature #2: 'RADIATION_THERAPY'
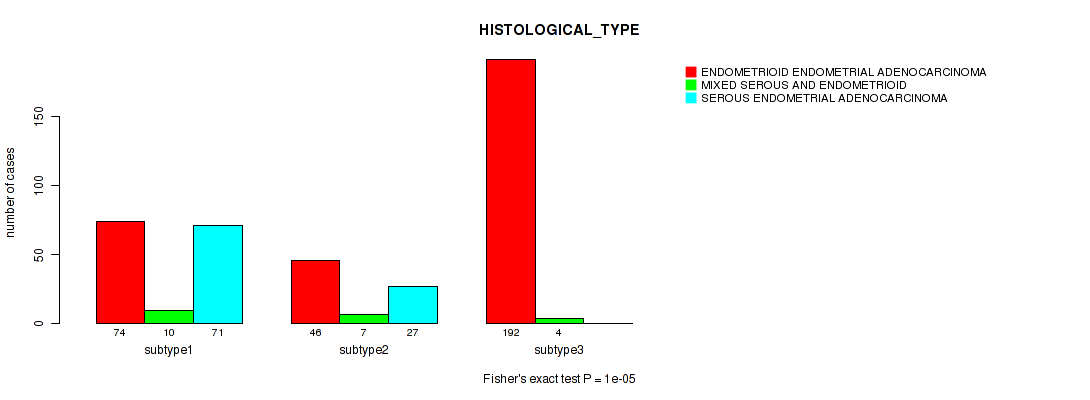
P value = 1e-05 (Fisher's exact test), Q value = 4e-05
Table S19. Clustering Approach #4: 'METHLYATION CNMF' versus Clinical Feature #3: 'HISTOLOGICAL_TYPE'
| nPatients | ENDOMETRIOID ENDOMETRIAL ADENOCARCINOMA | MIXED SEROUS AND ENDOMETRIOID | SEROUS ENDOMETRIAL ADENOCARCINOMA |
|---|---|---|---|
| ALL | 312 | 21 | 98 |
| subtype1 | 74 | 10 | 71 |
| subtype2 | 46 | 7 | 27 |
| subtype3 | 192 | 4 | 0 |
Figure S15. Get High-res Image Clustering Approach #4: 'METHLYATION CNMF' versus Clinical Feature #3: 'HISTOLOGICAL_TYPE'
P value = 0.0403 (Fisher's exact test), Q value = 0.084
Table S20. Clustering Approach #4: 'METHLYATION CNMF' versus Clinical Feature #4: 'RESIDUAL_TUMOR'
| nPatients | R0 | R1 | R2 | RX |
|---|---|---|---|---|
| ALL | 284 | 19 | 12 | 39 |
| subtype1 | 100 | 8 | 8 | 13 |
| subtype2 | 45 | 5 | 2 | 12 |
| subtype3 | 139 | 6 | 2 | 14 |
Figure S16. Get High-res Image Clustering Approach #4: 'METHLYATION CNMF' versus Clinical Feature #4: 'RESIDUAL_TUMOR'
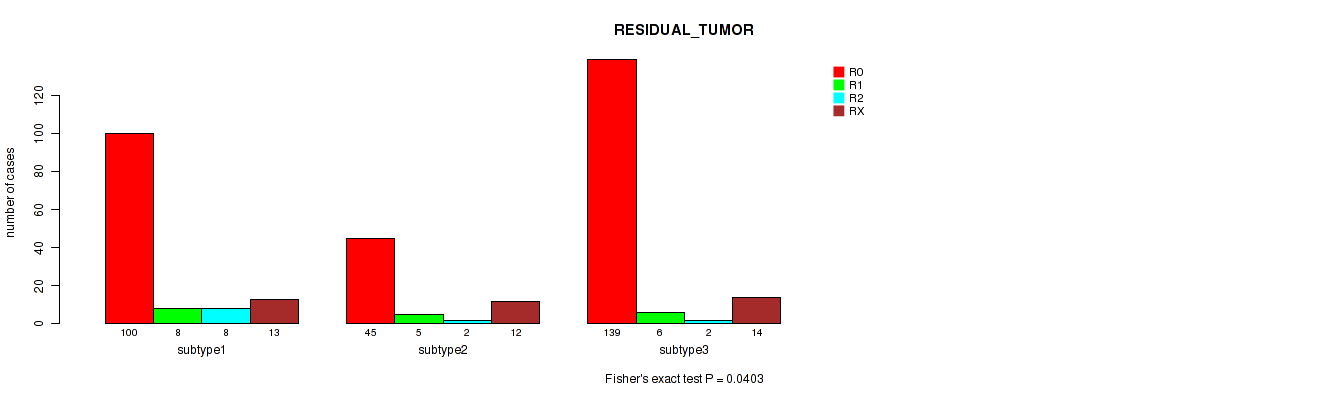
Table S21. Description of clustering approach #5: 'RPPA CNMF subtypes'
| Cluster Labels | 1 | 2 | 3 | 4 | 5 | 6 | 7 |
|---|---|---|---|---|---|---|---|
| Number of samples | 41 | 82 | 53 | 56 | 86 | 68 | 54 |
P value = 0.00532 (logrank test), Q value = 0.014
Table S22. Clustering Approach #5: 'RPPA CNMF subtypes' versus Clinical Feature #1: 'Time to Death'
| nPatients | nDeath | Duration Range (Median), Month | |
|---|---|---|---|
| ALL | 438 | 75 | 0.1 - 185.8 (28.9) |
| subtype1 | 41 | 6 | 0.2 - 123.7 (30.1) |
| subtype2 | 82 | 6 | 0.7 - 185.8 (30.3) |
| subtype3 | 53 | 6 | 6.6 - 113.4 (36.1) |
| subtype4 | 56 | 14 | 0.6 - 149.6 (30.4) |
| subtype5 | 84 | 19 | 0.1 - 118.0 (21.8) |
| subtype6 | 68 | 10 | 0.6 - 105.4 (28.6) |
| subtype7 | 54 | 14 | 0.2 - 96.3 (27.9) |
Figure S17. Get High-res Image Clustering Approach #5: 'RPPA CNMF subtypes' versus Clinical Feature #1: 'Time to Death'
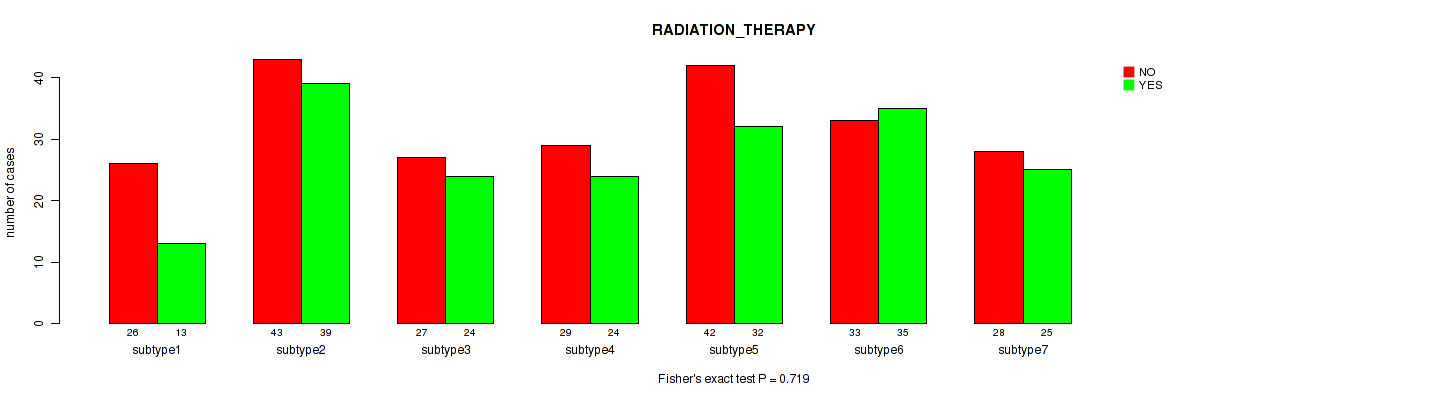
P value = 0.719 (Fisher's exact test), Q value = 0.78
Table S23. Clustering Approach #5: 'RPPA CNMF subtypes' versus Clinical Feature #2: 'RADIATION_THERAPY'
| nPatients | NO | YES |
|---|---|---|
| ALL | 228 | 192 |
| subtype1 | 26 | 13 |
| subtype2 | 43 | 39 |
| subtype3 | 27 | 24 |
| subtype4 | 29 | 24 |
| subtype5 | 42 | 32 |
| subtype6 | 33 | 35 |
| subtype7 | 28 | 25 |
Figure S18. Get High-res Image Clustering Approach #5: 'RPPA CNMF subtypes' versus Clinical Feature #2: 'RADIATION_THERAPY'
P value = 1e-05 (Fisher's exact test), Q value = 4e-05
Table S24. Clustering Approach #5: 'RPPA CNMF subtypes' versus Clinical Feature #3: 'HISTOLOGICAL_TYPE'
| nPatients | ENDOMETRIOID ENDOMETRIAL ADENOCARCINOMA | MIXED SEROUS AND ENDOMETRIOID | SEROUS ENDOMETRIAL ADENOCARCINOMA |
|---|---|---|---|
| ALL | 329 | 17 | 94 |
| subtype1 | 39 | 2 | 0 |
| subtype2 | 81 | 0 | 1 |
| subtype3 | 46 | 2 | 5 |
| subtype4 | 34 | 3 | 19 |
| subtype5 | 46 | 3 | 37 |
| subtype6 | 52 | 2 | 14 |
| subtype7 | 31 | 5 | 18 |
Figure S19. Get High-res Image Clustering Approach #5: 'RPPA CNMF subtypes' versus Clinical Feature #3: 'HISTOLOGICAL_TYPE'
P value = 0.822 (Fisher's exact test), Q value = 0.82
Table S25. Clustering Approach #5: 'RPPA CNMF subtypes' versus Clinical Feature #4: 'RESIDUAL_TUMOR'
| nPatients | R0 | R1 | R2 | RX |
|---|---|---|---|---|
| ALL | 301 | 14 | 11 | 37 |
| subtype1 | 31 | 1 | 1 | 2 |
| subtype2 | 61 | 1 | 0 | 6 |
| subtype3 | 32 | 2 | 0 | 5 |
| subtype4 | 37 | 3 | 2 | 5 |
| subtype5 | 58 | 4 | 3 | 9 |
| subtype6 | 47 | 1 | 4 | 5 |
| subtype7 | 35 | 2 | 1 | 5 |
Figure S20. Get High-res Image Clustering Approach #5: 'RPPA CNMF subtypes' versus Clinical Feature #4: 'RESIDUAL_TUMOR'
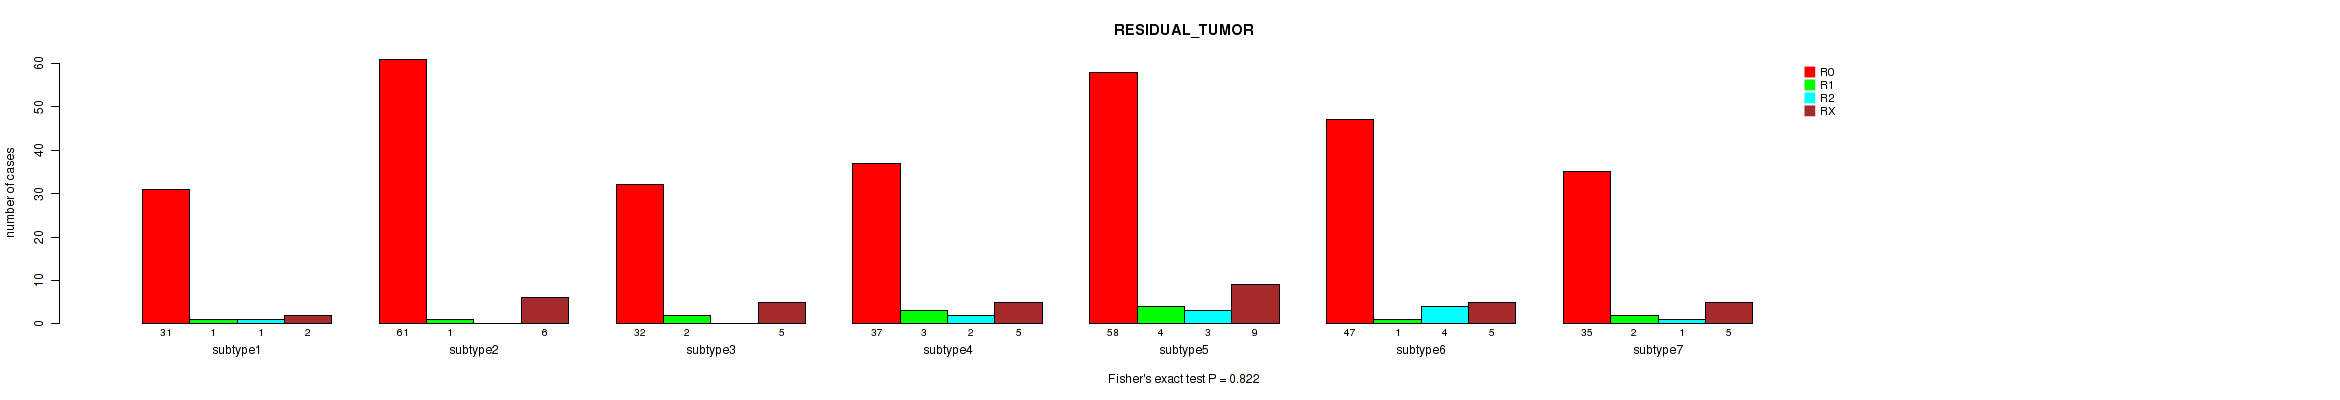
Table S26. Description of clustering approach #6: 'RPPA cHierClus subtypes'
| Cluster Labels | 1 | 2 | 3 | 4 |
|---|---|---|---|---|
| Number of samples | 110 | 183 | 95 | 52 |
P value = 0.233 (logrank test), Q value = 0.31
Table S27. Clustering Approach #6: 'RPPA cHierClus subtypes' versus Clinical Feature #1: 'Time to Death'
| nPatients | nDeath | Duration Range (Median), Month | |
|---|---|---|---|
| ALL | 438 | 75 | 0.1 - 185.8 (28.9) |
| subtype1 | 110 | 12 | 0.2 - 185.8 (31.5) |
| subtype2 | 181 | 37 | 0.1 - 149.6 (28.1) |
| subtype3 | 95 | 17 | 0.2 - 118.0 (27.0) |
| subtype4 | 52 | 9 | 0.7 - 89.3 (28.7) |
Figure S21. Get High-res Image Clustering Approach #6: 'RPPA cHierClus subtypes' versus Clinical Feature #1: 'Time to Death'
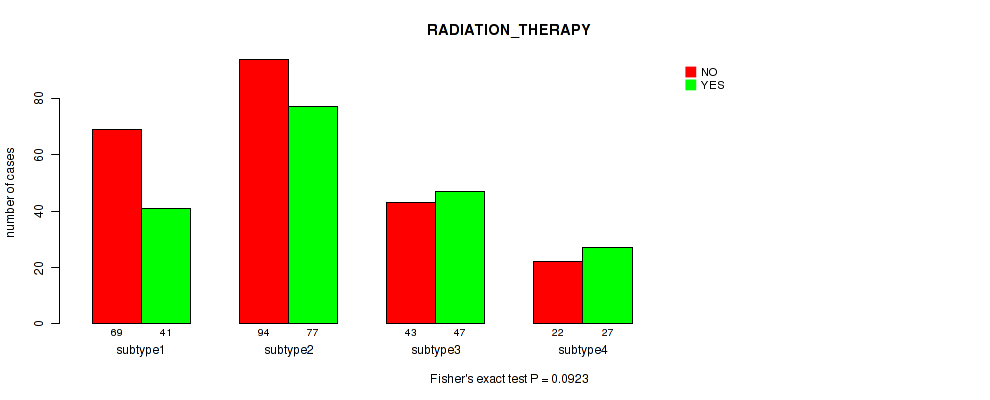
P value = 0.0923 (Fisher's exact test), Q value = 0.15
Table S28. Clustering Approach #6: 'RPPA cHierClus subtypes' versus Clinical Feature #2: 'RADIATION_THERAPY'
| nPatients | NO | YES |
|---|---|---|
| ALL | 228 | 192 |
| subtype1 | 69 | 41 |
| subtype2 | 94 | 77 |
| subtype3 | 43 | 47 |
| subtype4 | 22 | 27 |
Figure S22. Get High-res Image Clustering Approach #6: 'RPPA cHierClus subtypes' versus Clinical Feature #2: 'RADIATION_THERAPY'
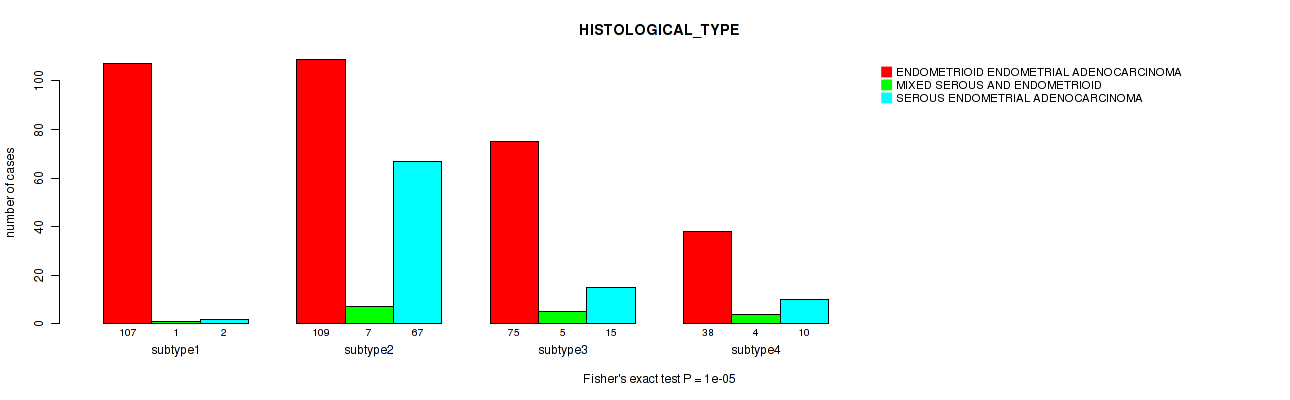
P value = 1e-05 (Fisher's exact test), Q value = 4e-05
Table S29. Clustering Approach #6: 'RPPA cHierClus subtypes' versus Clinical Feature #3: 'HISTOLOGICAL_TYPE'
| nPatients | ENDOMETRIOID ENDOMETRIAL ADENOCARCINOMA | MIXED SEROUS AND ENDOMETRIOID | SEROUS ENDOMETRIAL ADENOCARCINOMA |
|---|---|---|---|
| ALL | 329 | 17 | 94 |
| subtype1 | 107 | 1 | 2 |
| subtype2 | 109 | 7 | 67 |
| subtype3 | 75 | 5 | 15 |
| subtype4 | 38 | 4 | 10 |
Figure S23. Get High-res Image Clustering Approach #6: 'RPPA cHierClus subtypes' versus Clinical Feature #3: 'HISTOLOGICAL_TYPE'
P value = 0.733 (Fisher's exact test), Q value = 0.78
Table S30. Clustering Approach #6: 'RPPA cHierClus subtypes' versus Clinical Feature #4: 'RESIDUAL_TUMOR'
| nPatients | R0 | R1 | R2 | RX |
|---|---|---|---|---|
| ALL | 301 | 14 | 11 | 37 |
| subtype1 | 83 | 3 | 2 | 7 |
| subtype2 | 125 | 6 | 4 | 13 |
| subtype3 | 58 | 4 | 4 | 11 |
| subtype4 | 35 | 1 | 1 | 6 |
Figure S24. Get High-res Image Clustering Approach #6: 'RPPA cHierClus subtypes' versus Clinical Feature #4: 'RESIDUAL_TUMOR'
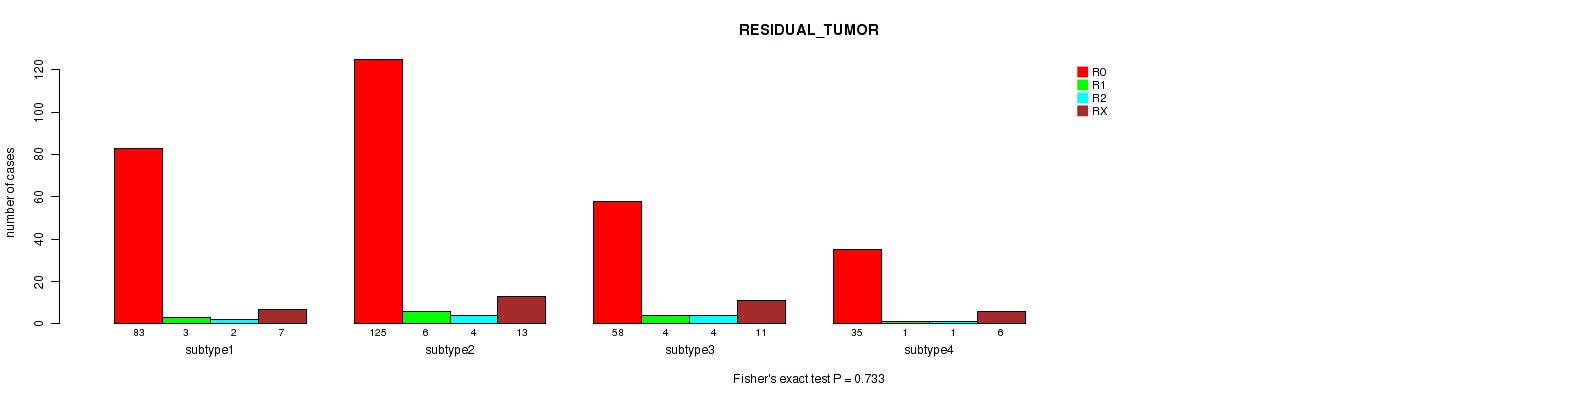
Table S31. Description of clustering approach #7: 'RNAseq CNMF subtypes'
| Cluster Labels | 1 | 2 | 3 | 4 |
|---|---|---|---|---|
| Number of samples | 189 | 124 | 94 | 138 |
P value = 1.41e-05 (logrank test), Q value = 5.2e-05
Table S32. Clustering Approach #7: 'RNAseq CNMF subtypes' versus Clinical Feature #1: 'Time to Death'
| nPatients | nDeath | Duration Range (Median), Month | |
|---|---|---|---|
| ALL | 543 | 91 | 0.1 - 225.5 (29.9) |
| subtype1 | 188 | 50 | 0.1 - 225.5 (25.4) |
| subtype2 | 124 | 13 | 0.1 - 185.8 (36.1) |
| subtype3 | 93 | 13 | 0.2 - 149.6 (30.7) |
| subtype4 | 138 | 15 | 0.6 - 136.6 (31.8) |
Figure S25. Get High-res Image Clustering Approach #7: 'RNAseq CNMF subtypes' versus Clinical Feature #1: 'Time to Death'
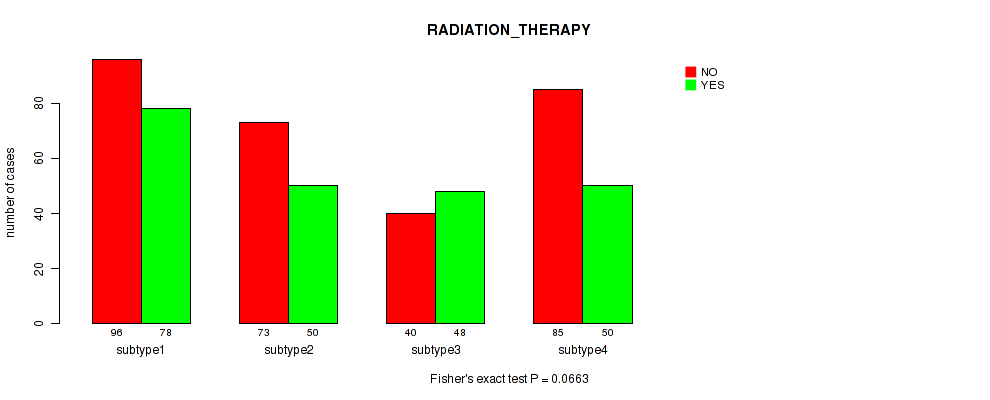
P value = 0.0663 (Fisher's exact test), Q value = 0.12
Table S33. Clustering Approach #7: 'RNAseq CNMF subtypes' versus Clinical Feature #2: 'RADIATION_THERAPY'
| nPatients | NO | YES |
|---|---|---|
| ALL | 294 | 226 |
| subtype1 | 96 | 78 |
| subtype2 | 73 | 50 |
| subtype3 | 40 | 48 |
| subtype4 | 85 | 50 |
Figure S26. Get High-res Image Clustering Approach #7: 'RNAseq CNMF subtypes' versus Clinical Feature #2: 'RADIATION_THERAPY'
P value = 1e-05 (Fisher's exact test), Q value = 4e-05
Table S34. Clustering Approach #7: 'RNAseq CNMF subtypes' versus Clinical Feature #3: 'HISTOLOGICAL_TYPE'
| nPatients | ENDOMETRIOID ENDOMETRIAL ADENOCARCINOMA | MIXED SEROUS AND ENDOMETRIOID | SEROUS ENDOMETRIAL ADENOCARCINOMA |
|---|---|---|---|
| ALL | 409 | 22 | 114 |
| subtype1 | 71 | 15 | 103 |
| subtype2 | 124 | 0 | 0 |
| subtype3 | 80 | 4 | 10 |
| subtype4 | 134 | 3 | 1 |
Figure S27. Get High-res Image Clustering Approach #7: 'RNAseq CNMF subtypes' versus Clinical Feature #3: 'HISTOLOGICAL_TYPE'
P value = 0.00586 (Fisher's exact test), Q value = 0.015
Table S35. Clustering Approach #7: 'RNAseq CNMF subtypes' versus Clinical Feature #4: 'RESIDUAL_TUMOR'
| nPatients | R0 | R1 | R2 | RX |
|---|---|---|---|---|
| ALL | 374 | 22 | 16 | 40 |
| subtype1 | 119 | 13 | 9 | 15 |
| subtype2 | 96 | 2 | 3 | 5 |
| subtype3 | 61 | 5 | 4 | 6 |
| subtype4 | 98 | 2 | 0 | 14 |
Figure S28. Get High-res Image Clustering Approach #7: 'RNAseq CNMF subtypes' versus Clinical Feature #4: 'RESIDUAL_TUMOR'
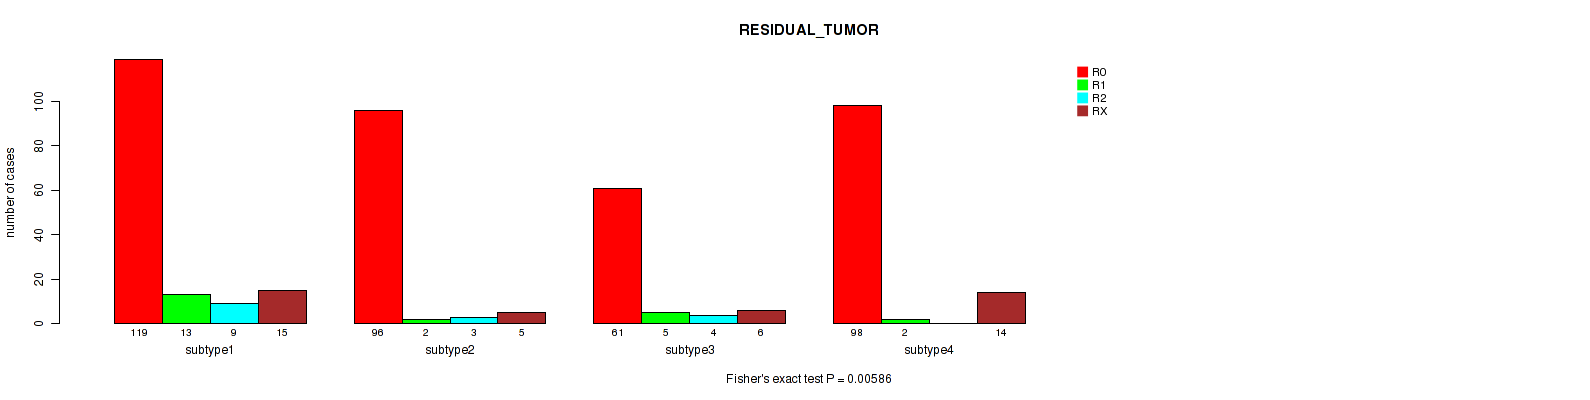
Table S36. Description of clustering approach #8: 'RNAseq cHierClus subtypes'
| Cluster Labels | 1 | 2 | 3 | 4 | 5 | 6 | 7 |
|---|---|---|---|---|---|---|---|
| Number of samples | 124 | 53 | 47 | 65 | 109 | 69 | 78 |
P value = 6.74e-05 (logrank test), Q value = 0.00022
Table S37. Clustering Approach #8: 'RNAseq cHierClus subtypes' versus Clinical Feature #1: 'Time to Death'
| nPatients | nDeath | Duration Range (Median), Month | |
|---|---|---|---|
| ALL | 543 | 91 | 0.1 - 225.5 (29.9) |
| subtype1 | 124 | 33 | 0.1 - 125.4 (26.0) |
| subtype2 | 53 | 5 | 0.4 - 185.8 (34.3) |
| subtype3 | 46 | 12 | 0.2 - 225.5 (33.5) |
| subtype4 | 65 | 4 | 0.1 - 129.8 (32.8) |
| subtype5 | 108 | 20 | 0.2 - 109.1 (23.8) |
| subtype6 | 69 | 13 | 0.7 - 136.6 (31.0) |
| subtype7 | 78 | 4 | 0.6 - 123.7 (32.0) |
Figure S29. Get High-res Image Clustering Approach #8: 'RNAseq cHierClus subtypes' versus Clinical Feature #1: 'Time to Death'
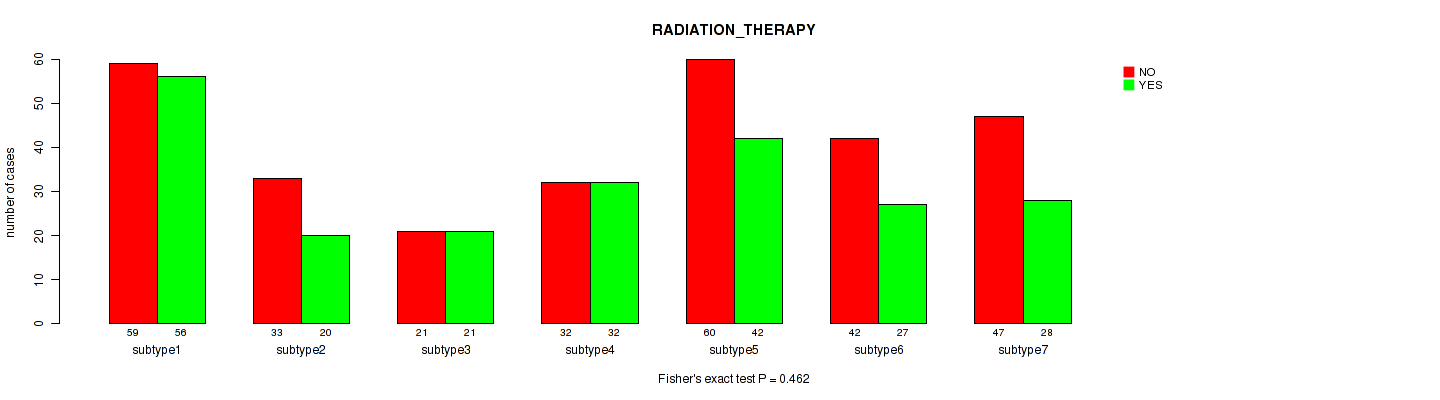
P value = 0.462 (Fisher's exact test), Q value = 0.56
Table S38. Clustering Approach #8: 'RNAseq cHierClus subtypes' versus Clinical Feature #2: 'RADIATION_THERAPY'
| nPatients | NO | YES |
|---|---|---|
| ALL | 294 | 226 |
| subtype1 | 59 | 56 |
| subtype2 | 33 | 20 |
| subtype3 | 21 | 21 |
| subtype4 | 32 | 32 |
| subtype5 | 60 | 42 |
| subtype6 | 42 | 27 |
| subtype7 | 47 | 28 |
Figure S30. Get High-res Image Clustering Approach #8: 'RNAseq cHierClus subtypes' versus Clinical Feature #2: 'RADIATION_THERAPY'
P value = 1e-05 (Fisher's exact test), Q value = 4e-05
Table S39. Clustering Approach #8: 'RNAseq cHierClus subtypes' versus Clinical Feature #3: 'HISTOLOGICAL_TYPE'
| nPatients | ENDOMETRIOID ENDOMETRIAL ADENOCARCINOMA | MIXED SEROUS AND ENDOMETRIOID | SEROUS ENDOMETRIAL ADENOCARCINOMA |
|---|---|---|---|
| ALL | 409 | 22 | 114 |
| subtype1 | 24 | 10 | 90 |
| subtype2 | 53 | 0 | 0 |
| subtype3 | 21 | 5 | 21 |
| subtype4 | 63 | 2 | 0 |
| subtype5 | 104 | 3 | 2 |
| subtype6 | 68 | 1 | 0 |
| subtype7 | 76 | 1 | 1 |
Figure S31. Get High-res Image Clustering Approach #8: 'RNAseq cHierClus subtypes' versus Clinical Feature #3: 'HISTOLOGICAL_TYPE'
P value = 0.0174 (Fisher's exact test), Q value = 0.042
Table S40. Clustering Approach #8: 'RNAseq cHierClus subtypes' versus Clinical Feature #4: 'RESIDUAL_TUMOR'
| nPatients | R0 | R1 | R2 | RX |
|---|---|---|---|---|
| ALL | 374 | 22 | 16 | 40 |
| subtype1 | 81 | 7 | 3 | 10 |
| subtype2 | 42 | 1 | 0 | 3 |
| subtype3 | 32 | 1 | 7 | 4 |
| subtype4 | 44 | 5 | 1 | 2 |
| subtype5 | 72 | 7 | 4 | 7 |
| subtype6 | 44 | 1 | 1 | 6 |
| subtype7 | 59 | 0 | 0 | 8 |
Figure S32. Get High-res Image Clustering Approach #8: 'RNAseq cHierClus subtypes' versus Clinical Feature #4: 'RESIDUAL_TUMOR'
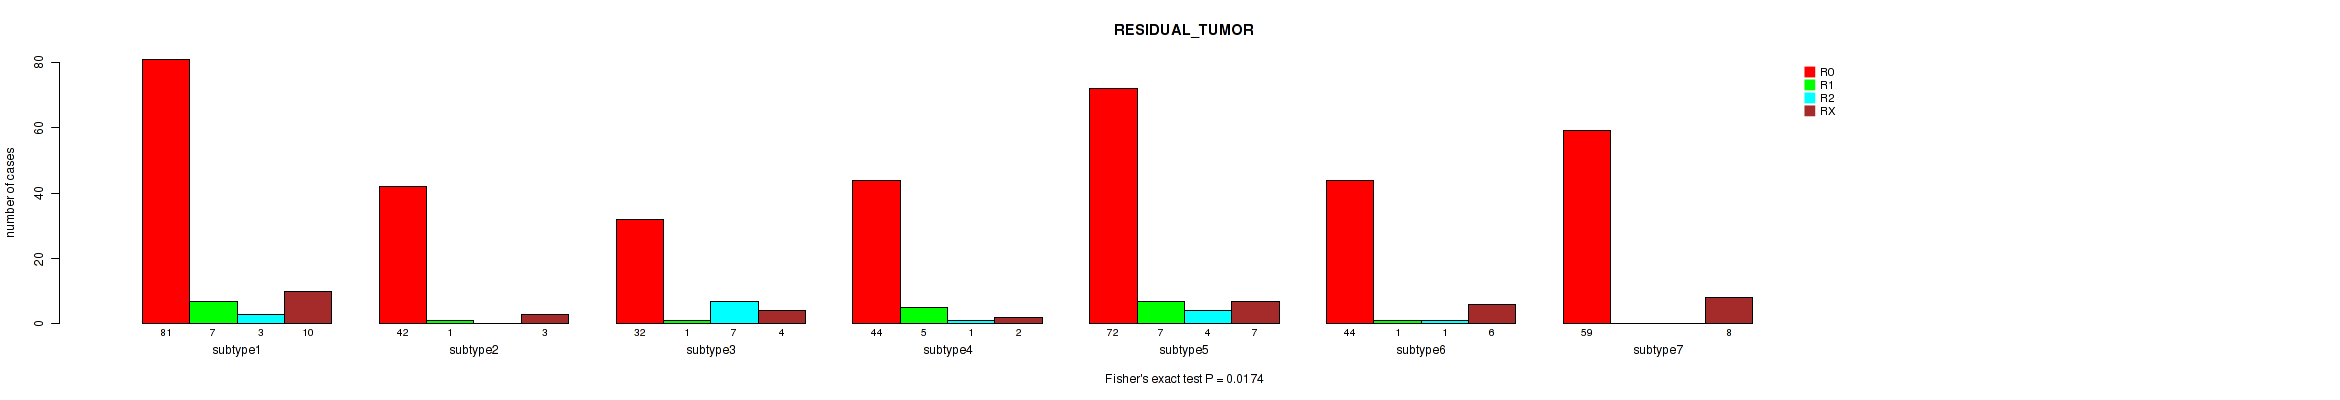
Table S41. Description of clustering approach #9: 'MIRSEQ CNMF'
| Cluster Labels | 1 | 2 | 3 | 4 | 5 |
|---|---|---|---|---|---|
| Number of samples | 165 | 81 | 107 | 138 | 47 |
P value = 0.00248 (logrank test), Q value = 0.007
Table S42. Clustering Approach #9: 'MIRSEQ CNMF' versus Clinical Feature #1: 'Time to Death'
| nPatients | nDeath | Duration Range (Median), Month | |
|---|---|---|---|
| ALL | 536 | 88 | 0.1 - 225.5 (29.9) |
| subtype1 | 164 | 39 | 0.1 - 125.4 (24.0) |
| subtype2 | 81 | 13 | 0.1 - 185.8 (30.7) |
| subtype3 | 107 | 18 | 3.7 - 225.5 (40.1) |
| subtype4 | 138 | 11 | 0.6 - 136.6 (30.3) |
| subtype5 | 46 | 7 | 1.0 - 123.7 (27.3) |
Figure S33. Get High-res Image Clustering Approach #9: 'MIRSEQ CNMF' versus Clinical Feature #1: 'Time to Death'
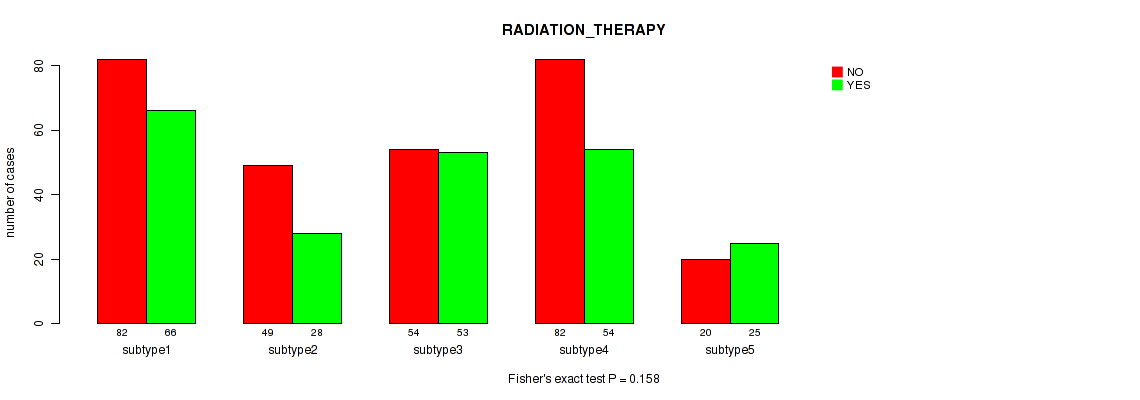
P value = 0.158 (Fisher's exact test), Q value = 0.23
Table S43. Clustering Approach #9: 'MIRSEQ CNMF' versus Clinical Feature #2: 'RADIATION_THERAPY'
| nPatients | NO | YES |
|---|---|---|
| ALL | 287 | 226 |
| subtype1 | 82 | 66 |
| subtype2 | 49 | 28 |
| subtype3 | 54 | 53 |
| subtype4 | 82 | 54 |
| subtype5 | 20 | 25 |
Figure S34. Get High-res Image Clustering Approach #9: 'MIRSEQ CNMF' versus Clinical Feature #2: 'RADIATION_THERAPY'
P value = 1e-05 (Fisher's exact test), Q value = 4e-05
Table S44. Clustering Approach #9: 'MIRSEQ CNMF' versus Clinical Feature #3: 'HISTOLOGICAL_TYPE'
| nPatients | ENDOMETRIOID ENDOMETRIAL ADENOCARCINOMA | MIXED SEROUS AND ENDOMETRIOID | SEROUS ENDOMETRIAL ADENOCARCINOMA |
|---|---|---|---|
| ALL | 407 | 22 | 109 |
| subtype1 | 69 | 11 | 85 |
| subtype2 | 79 | 2 | 0 |
| subtype3 | 93 | 4 | 10 |
| subtype4 | 134 | 2 | 2 |
| subtype5 | 32 | 3 | 12 |
Figure S35. Get High-res Image Clustering Approach #9: 'MIRSEQ CNMF' versus Clinical Feature #3: 'HISTOLOGICAL_TYPE'
P value = 0.121 (Fisher's exact test), Q value = 0.19
Table S45. Clustering Approach #9: 'MIRSEQ CNMF' versus Clinical Feature #4: 'RESIDUAL_TUMOR'
| nPatients | R0 | R1 | R2 | RX |
|---|---|---|---|---|
| ALL | 369 | 22 | 15 | 40 |
| subtype1 | 101 | 10 | 8 | 15 |
| subtype2 | 58 | 2 | 1 | 5 |
| subtype3 | 73 | 5 | 5 | 7 |
| subtype4 | 101 | 2 | 0 | 10 |
| subtype5 | 36 | 3 | 1 | 3 |
Figure S36. Get High-res Image Clustering Approach #9: 'MIRSEQ CNMF' versus Clinical Feature #4: 'RESIDUAL_TUMOR'
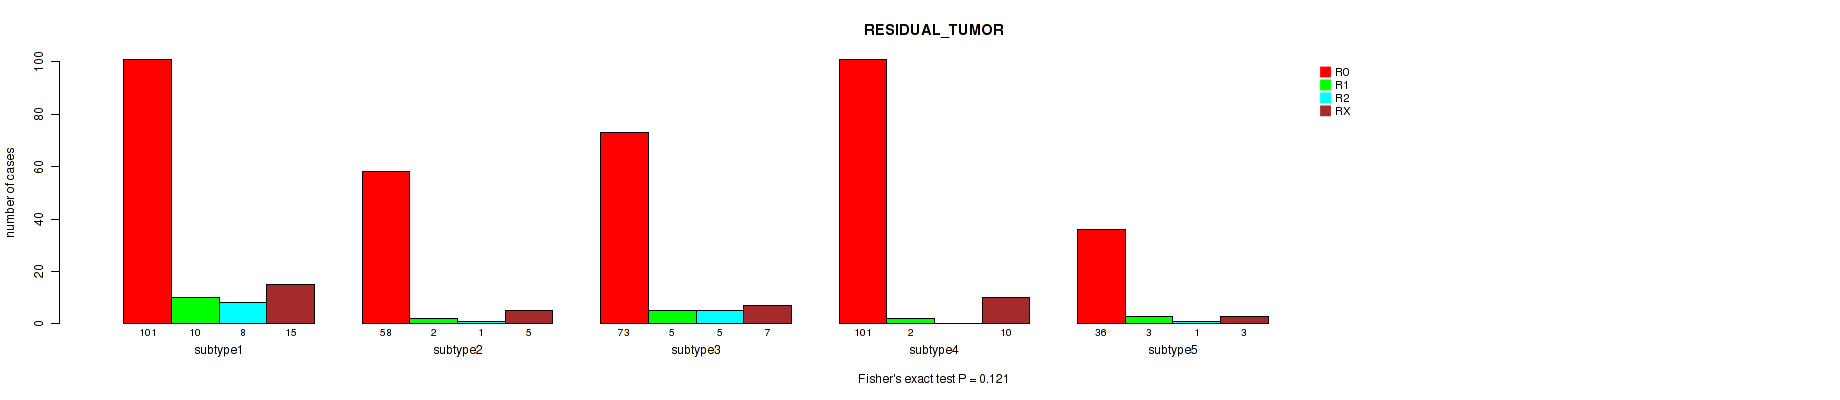
Table S46. Description of clustering approach #10: 'MIRSEQ CHIERARCHICAL'
| Cluster Labels | 1 | 2 | 3 |
|---|---|---|---|
| Number of samples | 219 | 173 | 146 |
P value = 3.06e-06 (logrank test), Q value = 4e-05
Table S47. Clustering Approach #10: 'MIRSEQ CHIERARCHICAL' versus Clinical Feature #1: 'Time to Death'
| nPatients | nDeath | Duration Range (Median), Month | |
|---|---|---|---|
| ALL | 536 | 88 | 0.1 - 225.5 (29.9) |
| subtype1 | 218 | 27 | 0.1 - 185.8 (31.5) |
| subtype2 | 172 | 47 | 0.1 - 225.5 (27.2) |
| subtype3 | 146 | 14 | 0.6 - 136.6 (30.6) |
Figure S37. Get High-res Image Clustering Approach #10: 'MIRSEQ CHIERARCHICAL' versus Clinical Feature #1: 'Time to Death'
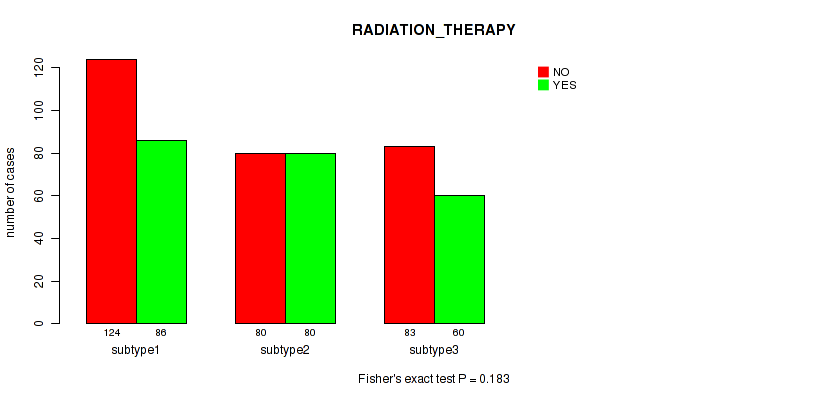
P value = 0.183 (Fisher's exact test), Q value = 0.25
Table S48. Clustering Approach #10: 'MIRSEQ CHIERARCHICAL' versus Clinical Feature #2: 'RADIATION_THERAPY'
| nPatients | NO | YES |
|---|---|---|
| ALL | 287 | 226 |
| subtype1 | 124 | 86 |
| subtype2 | 80 | 80 |
| subtype3 | 83 | 60 |
Figure S38. Get High-res Image Clustering Approach #10: 'MIRSEQ CHIERARCHICAL' versus Clinical Feature #2: 'RADIATION_THERAPY'
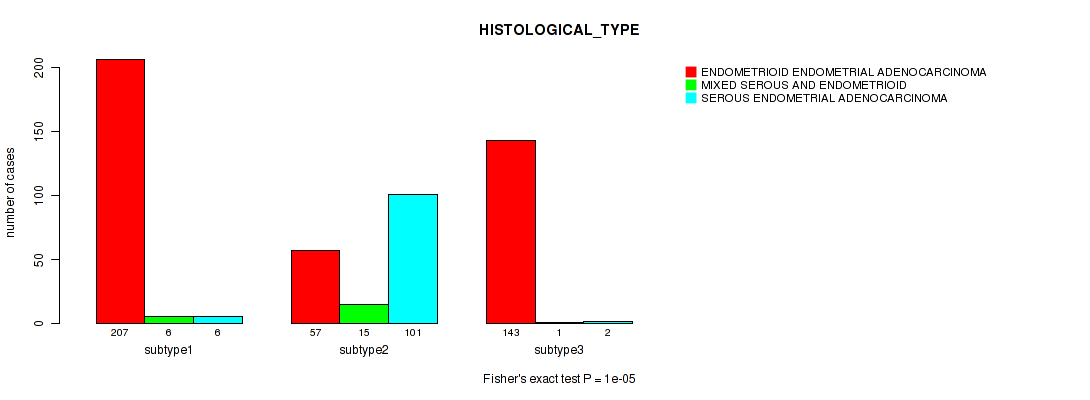
P value = 1e-05 (Fisher's exact test), Q value = 4e-05
Table S49. Clustering Approach #10: 'MIRSEQ CHIERARCHICAL' versus Clinical Feature #3: 'HISTOLOGICAL_TYPE'
| nPatients | ENDOMETRIOID ENDOMETRIAL ADENOCARCINOMA | MIXED SEROUS AND ENDOMETRIOID | SEROUS ENDOMETRIAL ADENOCARCINOMA |
|---|---|---|---|
| ALL | 407 | 22 | 109 |
| subtype1 | 207 | 6 | 6 |
| subtype2 | 57 | 15 | 101 |
| subtype3 | 143 | 1 | 2 |
Figure S39. Get High-res Image Clustering Approach #10: 'MIRSEQ CHIERARCHICAL' versus Clinical Feature #3: 'HISTOLOGICAL_TYPE'
P value = 0.0608 (Fisher's exact test), Q value = 0.12
Table S50. Clustering Approach #10: 'MIRSEQ CHIERARCHICAL' versus Clinical Feature #4: 'RESIDUAL_TUMOR'
| nPatients | R0 | R1 | R2 | RX |
|---|---|---|---|---|
| ALL | 369 | 22 | 15 | 40 |
| subtype1 | 152 | 9 | 6 | 16 |
| subtype2 | 112 | 10 | 9 | 13 |
| subtype3 | 105 | 3 | 0 | 11 |
Figure S40. Get High-res Image Clustering Approach #10: 'MIRSEQ CHIERARCHICAL' versus Clinical Feature #4: 'RESIDUAL_TUMOR'
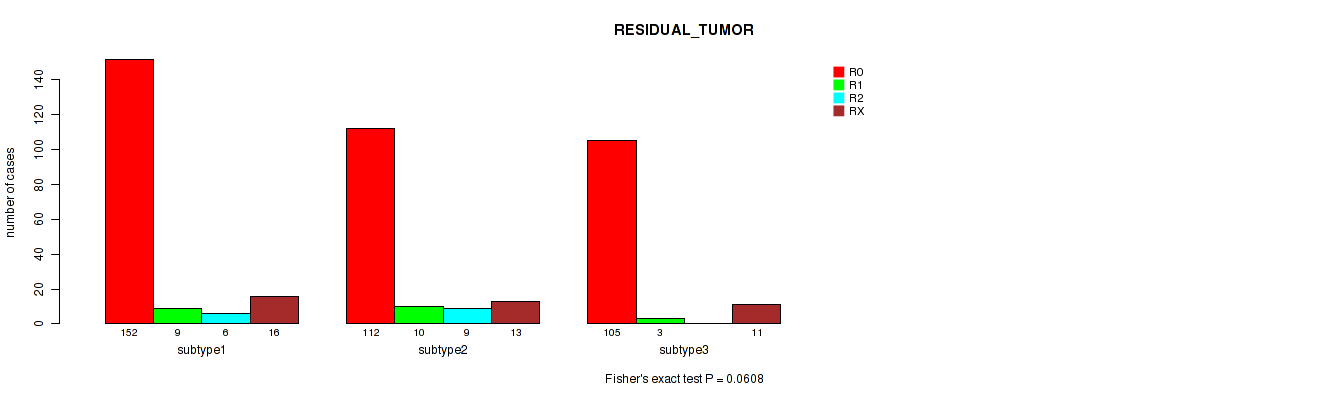
Table S51. Description of clustering approach #11: 'MIRseq Mature CNMF subtypes'
| Cluster Labels | 1 | 2 | 3 | 4 |
|---|---|---|---|---|
| Number of samples | 116 | 101 | 93 | 92 |
P value = 0.0287 (logrank test), Q value = 0.066
Table S52. Clustering Approach #11: 'MIRseq Mature CNMF subtypes' versus Clinical Feature #1: 'Time to Death'
| nPatients | nDeath | Duration Range (Median), Month | |
|---|---|---|---|
| ALL | 400 | 68 | 0.1 - 225.5 (25.9) |
| subtype1 | 115 | 27 | 0.1 - 110.1 (22.3) |
| subtype2 | 101 | 10 | 0.4 - 136.6 (25.9) |
| subtype3 | 93 | 14 | 0.3 - 123.7 (27.2) |
| subtype4 | 91 | 17 | 1.3 - 225.5 (32.0) |
Figure S41. Get High-res Image Clustering Approach #11: 'MIRseq Mature CNMF subtypes' versus Clinical Feature #1: 'Time to Death'
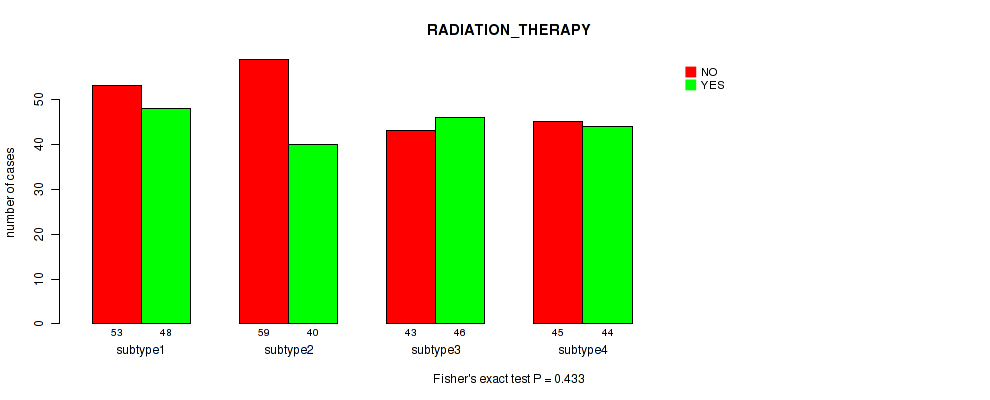
P value = 0.433 (Fisher's exact test), Q value = 0.55
Table S53. Clustering Approach #11: 'MIRseq Mature CNMF subtypes' versus Clinical Feature #2: 'RADIATION_THERAPY'
| nPatients | NO | YES |
|---|---|---|
| ALL | 200 | 178 |
| subtype1 | 53 | 48 |
| subtype2 | 59 | 40 |
| subtype3 | 43 | 46 |
| subtype4 | 45 | 44 |
Figure S42. Get High-res Image Clustering Approach #11: 'MIRseq Mature CNMF subtypes' versus Clinical Feature #2: 'RADIATION_THERAPY'
P value = 1e-05 (Fisher's exact test), Q value = 4e-05
Table S54. Clustering Approach #11: 'MIRseq Mature CNMF subtypes' versus Clinical Feature #3: 'HISTOLOGICAL_TYPE'
| nPatients | ENDOMETRIOID ENDOMETRIAL ADENOCARCINOMA | MIXED SEROUS AND ENDOMETRIOID | SEROUS ENDOMETRIAL ADENOCARCINOMA |
|---|---|---|---|
| ALL | 287 | 20 | 95 |
| subtype1 | 59 | 6 | 51 |
| subtype2 | 96 | 2 | 3 |
| subtype3 | 69 | 6 | 18 |
| subtype4 | 63 | 6 | 23 |
Figure S43. Get High-res Image Clustering Approach #11: 'MIRseq Mature CNMF subtypes' versus Clinical Feature #3: 'HISTOLOGICAL_TYPE'
P value = 0.482 (Fisher's exact test), Q value = 0.56
Table S55. Clustering Approach #11: 'MIRseq Mature CNMF subtypes' versus Clinical Feature #4: 'RESIDUAL_TUMOR'
| nPatients | R0 | R1 | R2 | RX |
|---|---|---|---|---|
| ALL | 268 | 17 | 12 | 34 |
| subtype1 | 72 | 5 | 4 | 9 |
| subtype2 | 65 | 4 | 1 | 13 |
| subtype3 | 70 | 4 | 2 | 4 |
| subtype4 | 61 | 4 | 5 | 8 |
Figure S44. Get High-res Image Clustering Approach #11: 'MIRseq Mature CNMF subtypes' versus Clinical Feature #4: 'RESIDUAL_TUMOR'
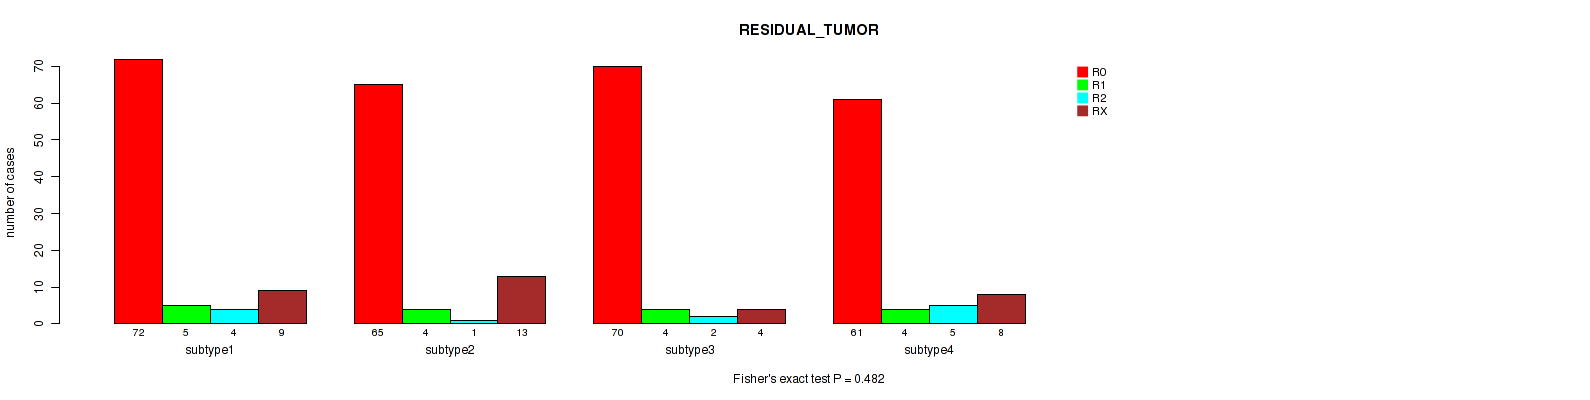
Table S56. Description of clustering approach #12: 'MIRseq Mature cHierClus subtypes'
| Cluster Labels | 1 | 2 | 3 |
|---|---|---|---|
| Number of samples | 163 | 136 | 103 |
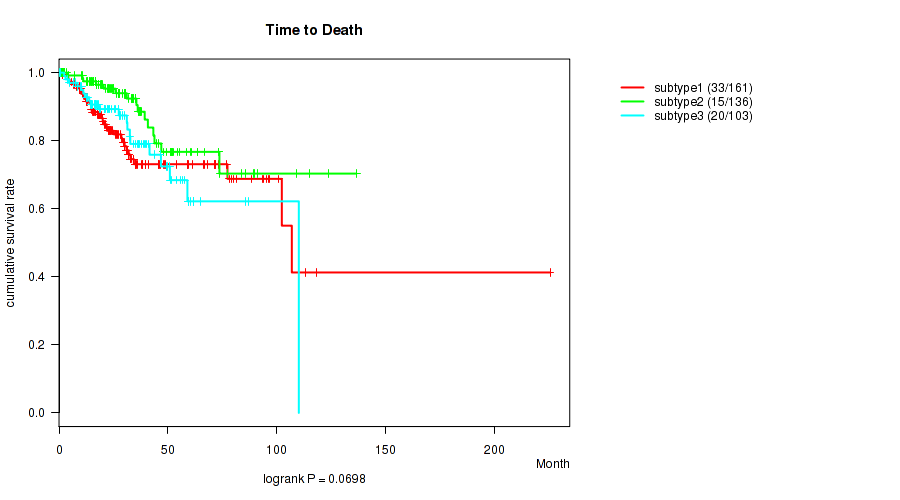
P value = 0.0698 (logrank test), Q value = 0.12
Table S57. Clustering Approach #12: 'MIRseq Mature cHierClus subtypes' versus Clinical Feature #1: 'Time to Death'
| nPatients | nDeath | Duration Range (Median), Month | |
|---|---|---|---|
| ALL | 400 | 68 | 0.1 - 225.5 (25.9) |
| subtype1 | 161 | 33 | 0.1 - 225.5 (23.7) |
| subtype2 | 136 | 15 | 0.4 - 136.6 (27.3) |
| subtype3 | 103 | 20 | 0.3 - 110.1 (25.9) |
Figure S45. Get High-res Image Clustering Approach #12: 'MIRseq Mature cHierClus subtypes' versus Clinical Feature #1: 'Time to Death'
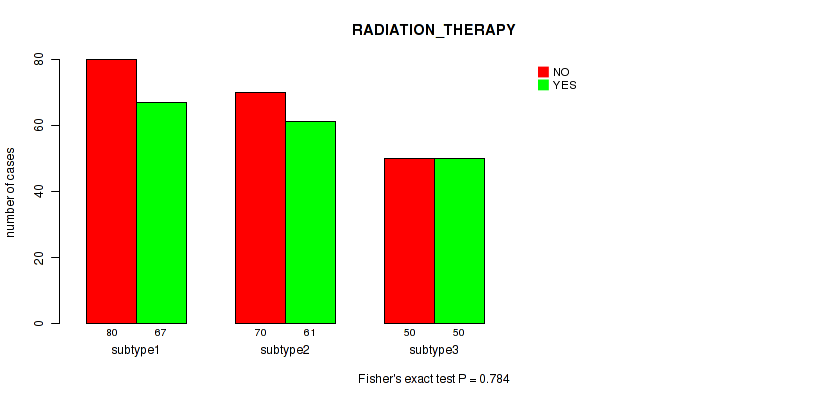
P value = 0.784 (Fisher's exact test), Q value = 0.8
Table S58. Clustering Approach #12: 'MIRseq Mature cHierClus subtypes' versus Clinical Feature #2: 'RADIATION_THERAPY'
| nPatients | NO | YES |
|---|---|---|
| ALL | 200 | 178 |
| subtype1 | 80 | 67 |
| subtype2 | 70 | 61 |
| subtype3 | 50 | 50 |
Figure S46. Get High-res Image Clustering Approach #12: 'MIRseq Mature cHierClus subtypes' versus Clinical Feature #2: 'RADIATION_THERAPY'
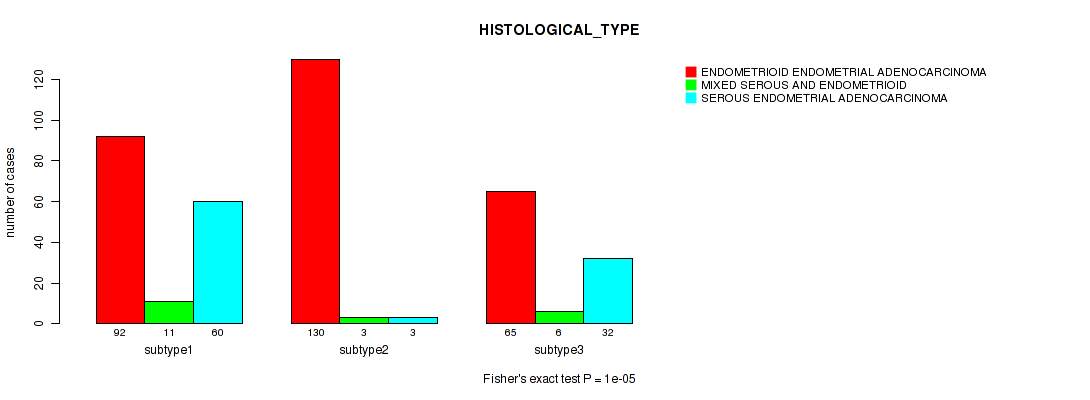
P value = 1e-05 (Fisher's exact test), Q value = 4e-05
Table S59. Clustering Approach #12: 'MIRseq Mature cHierClus subtypes' versus Clinical Feature #3: 'HISTOLOGICAL_TYPE'
| nPatients | ENDOMETRIOID ENDOMETRIAL ADENOCARCINOMA | MIXED SEROUS AND ENDOMETRIOID | SEROUS ENDOMETRIAL ADENOCARCINOMA |
|---|---|---|---|
| ALL | 287 | 20 | 95 |
| subtype1 | 92 | 11 | 60 |
| subtype2 | 130 | 3 | 3 |
| subtype3 | 65 | 6 | 32 |
Figure S47. Get High-res Image Clustering Approach #12: 'MIRseq Mature cHierClus subtypes' versus Clinical Feature #3: 'HISTOLOGICAL_TYPE'
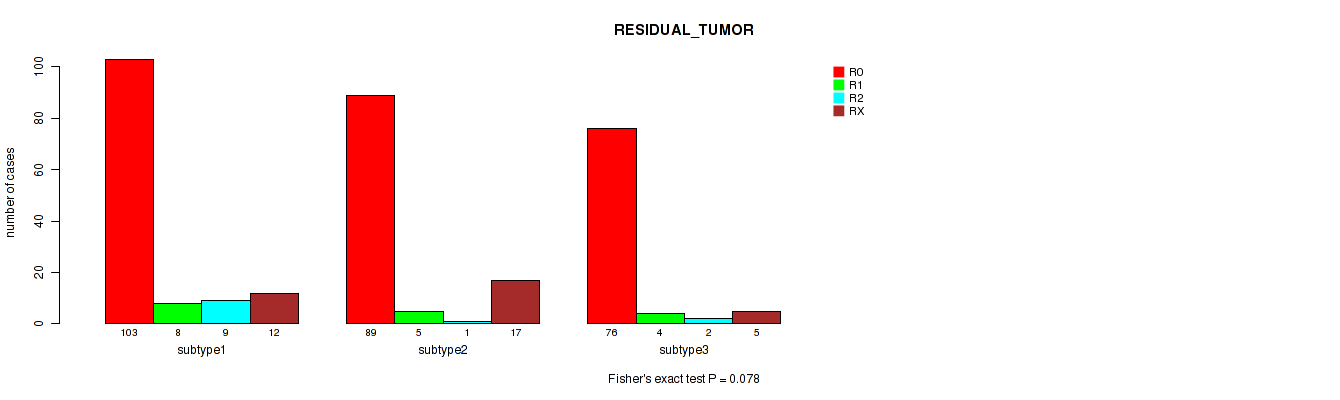
P value = 0.078 (Fisher's exact test), Q value = 0.13
Table S60. Clustering Approach #12: 'MIRseq Mature cHierClus subtypes' versus Clinical Feature #4: 'RESIDUAL_TUMOR'
| nPatients | R0 | R1 | R2 | RX |
|---|---|---|---|---|
| ALL | 268 | 17 | 12 | 34 |
| subtype1 | 103 | 8 | 9 | 12 |
| subtype2 | 89 | 5 | 1 | 17 |
| subtype3 | 76 | 4 | 2 | 5 |
Figure S48. Get High-res Image Clustering Approach #12: 'MIRseq Mature cHierClus subtypes' versus Clinical Feature #4: 'RESIDUAL_TUMOR'
-
Cluster data file = /xchip/cga/gdac-prod/tcga-gdac/jobResults/GDAC_mergedClustering/UCEC-TP/22553827/UCEC-TP.mergedcluster.txt
-
Clinical data file = /xchip/cga/gdac-prod/tcga-gdac/jobResults/Append_Data/UCEC-TP/22507145/UCEC-TP.merged_data.txt
-
Number of patients = 548
-
Number of clustering approaches = 12
-
Number of selected clinical features = 4
-
Exclude small clusters that include fewer than K patients, K = 3
consensus non-negative matrix factorization clustering approach (Brunet et al. 2004)
Resampling-based clustering method (Monti et al. 2003)
For survival clinical features, the Kaplan-Meier survival curves of tumors with and without gene mutations were plotted and the statistical significance P values were estimated by logrank test (Bland and Altman 2004) using the 'survdiff' function in R
For binary clinical features, two-tailed Fisher's exact tests (Fisher 1922) were used to estimate the P values using the 'fisher.test' function in R
For multiple hypothesis correction, Q value is the False Discovery Rate (FDR) analogue of the P value (Benjamini and Hochberg 1995), defined as the minimum FDR at which the test may be called significant. We used the 'Benjamini and Hochberg' method of 'p.adjust' function in R to convert P values into Q values.
In addition to the links below, the full results of the analysis summarized in this report can also be downloaded programmatically using firehose_get, or interactively from either the Broad GDAC website or TCGA Data Coordination Center Portal.